

Technology Tools in Hospitality: Mapping the Landscape through Bibliometric Analysis and Presentation of a New Software Solution
Nelios EPE, 10560 Athens, Greece
Digital 2023, 3(1), 81-96; https://doi.org/10.3390/digital3010006
Submission received: 8 February 2023
/
Revised: 22 February 2023
/
Accepted: 1 March 2023
/
Published: 3 March 2023
(This article belongs to the Special Issue “Management of Digital Ecosystems”: Dedicated to the Memory of Prof. William I. Grosky 8/4/1944–11/13/2020)
Abstract
:This study offers a comprehensive examination of the literature surrounding technology and tools in the hospitality industry. A bibliometric analysis was performed on 709 Scopus-indexed publications from 2000 to January 2023, with a focus on identifying key players, institutions, research trends, and the co-occurrence of keywords. The results shed light on the scientific landscape of technology and tools in the hospitality sector, emphasizing the significance of big data and the customer experience in the sharing economy. The study also presents the architecture of new software that offers guests the ability to customize their hotel stay, classified as part of the first cluster in the co-occurrence of keywords analysis. This approach highlights the growing importance of big data and customer experience and makes a valuable contribution to the field by offering a tool for hotel booking customization. Furthermore, the study underscores the importance of collaboration between academic institutions and private companies in providing a mutually beneficial platform that exceeds the expectations of both hotels and guests.
1. Introduction
The tourism industry is a complex and multifaceted field of study, with a wide range of dimensions that have been developed over the years. Scholars have explored various topics such as metaverse [1], big data and innovation [2], technology and ICT [3,4], competitiveness [5,6], spatial inequalities [7], seasonality [6], and crisis management [8,9] to gain a deeper understanding of the factors that shape the tourism industry and its impact on society. In recent years, the integration of technology and tools into the hospitality industry has emerged as a rapidly growing area of research [10]. The implementation of digital solutions such as mobile apps and smart systems has been driven by the need to enhance the guest experience and improve operational efficiency in hotels and other accommodation providers [11]. As a result, a growing body of literature has emerged on the use of technology and tools in the hospitality sector, although this literature is diverse and dispersed, making it challenging to identify key actors, institutions, and trends in the field.
To address this challenge, this study employs bibliometric analysis to map the structure and dynamics of research on technology and tools in the hospitality sector. Bibliometric analysis is a widely used research method in various fields, including the hospitality industry, for understanding the scientific landscape and key actors, institutions, and research trends within a specific field of study [12]. This powerful tool enables the creation of a comprehensive overview of the scientific literature and helps to identify the most relevant papers, authors, institutions, and trends within a specific field of research [13].
In this study, the literature on technology and tools in the hospitality sector will be analyzed through a bibliometric lens. The study will focus on the temporal distribution of relevant publications, citation metrics, and co-authorship patterns. By utilizing various metrics such as citation counts and co-citation analysis, this study aims to identify the most prevalent and highly cited publications, as well as the leading organizations and countries participating in the co-authoring network. Additionally, this study will seek to identify the most important keywords and highlight the relationships between them using tools such as VOSviewer and Gephi.
In addition to the bibliometric analysis, this study presents a proposed software solution for the hospitality industry. The proposed software focuses on customizing hotel reservations and aims to improve the overall customer experience. The software architecture is designed to account for the bibliometric analysis findings and integrates advanced technologies to provide customized and personalized experiences for guests. This software solution offers a new and innovative approach to improving the guest experience, providing a starting point for further research and development in this area.
The hospitality industry is constantly seeking new and innovative ways to improve the customer experience. This study addresses this need by combining bibliometric analysis and the development of a proposed software solution. The bibliometric analysis identifies the main authors and organizations in the field, providing a foundation for future research and development. The main objectives of this study are, therefore, to identify the key authors and organizations in the field for potential synergies and to propose a software solution that meets the identified needs of the hospitality industry.
2. Materials and Methods
The methodology of this study is based on bibliometric analysis, a widely recognized and established research method [14,15,16] that utilizes quantitative measures to analyze and evaluate the scientific literature in a specific field of study. The purpose is to map and understand the structure and dynamics of research on technology and tools in the hospitality sector. Bibliometric analysis is mainly helpful in identifying key actors, institutions, and research trends within a given field and can provide valuable insights into research gaps and opportunities, as well as the impact of research activities [13,17]. It is crucial to be aware of the limitations of the bibliometric analysis and to interpret the results with caution [17,18].
In this study, data were collected from the Scopus database, one of the largest and most reputable sources of abstracts and citations of research literature, and exported to VOSviewer and Gephi software. VOSviewer and Gephi are popular in bibliometric analyses thanks to their user-friendliness, ability to handle large datasets, and production of high-quality visualizations. VOSviewer is a powerful and user-friendly software tool that is specifically designed for visualizing and analyzing bibliometric networks. It allows for the exploration of the underlying structure of a research field and the identification of key themes, authors, and journals. Gephi is another widely used software tool for visualizing and analyzing complex networks. It is particularly useful for exploring the topology of the network and for identifying the most important nodes and communities. While R language, bibliometrix, or SCImat are also commonly used for bibliometric analysis, this study used these tools as they offer a more intuitive and efficient way to analyze the data, allowing for a more comprehensive and accurate understanding of the bibliometric landscape.
VOSviewer uses the co-citation analysis method, which is a method of bibliometric analysis that uses the co-citation of papers to identify the relationships between manuscripts in a specific field of research [15,16,17,18], and Gephi is a tool used for network visualization and analysis [19]. The data for this study were extracted for the period spanning from 2010 to mid-January 2023, as detailed in Table 1, which outlines the specific terms and constraints used to gather the database of 709 references. Scopus includes over 22,000 academic journals and other scholarly sources from more than 5000 international publishers and over 70 million records. Additionally, the enhanced version of Scopus allows for the use of a data visualization dashboard, which was employed in this study.
The time frame of 2010 to mid-January 2023 was selected for the bibliometric analysis in order to capture long-term trends in research and facilitate comparisons across time periods. This duration provides a more comprehensive overview of the field, allowing for the identification of key developments over a significant period. The choice of 2023 as the end point of the data collection ensures that the analysis is current and reflects the most recent developments in the field. This is particularly important in bibliometric studies, as it allows for a more accurate assessment of the current state of the field and offers valuable insights to guide future research.
The data were analyzed in two steps: first, to identify the most highly cited papers in the field of technology and tools in the hospitality sector, and second, to create a bibliometric map of the field of technology and tools in the hospitality sector, which was used to identify critical actors, institutions, and research trends.
2.1. Citation Analysis
Citation analysis is a widely employed technique in bibliometric research that involves quantifying the number of times a specific paper or author has been cited within other publications [12,20]. This method allows researchers to evaluate the impact and influence of a particular paper or author within a specific field of study. Through the examination of citation patterns, researchers can identify the most highly cited papers and authors within a field, as well as the main research trends and key actors [12,21,22]. Additionally, citation analysis can be utilized to assess the performance of academic institutions and journals, as well as to identify potential research gaps and opportunities within a field [19].
2.2. Co-Authorship Analysis
Co-authorship analysis is a method used in bibliometric research to identify patterns of collaboration among authors in a specific field of study. This method is particularly useful in identifying key actors, institutions, and research trends within a given field and identifying research gaps and opportunities. Co-authorship analysis can be performed at different levels of analysis, including the individual author, the institution, and the country [14,20]. In this study, co-authorship analysis was performed at the country level to identify patterns of collaboration among authors from different countries in the field of technology and tools in the hospitality sector. The country unit of analysis is particularly useful in identifying international collaborations and in understanding the global distribution of research activities in a given field [12,17,20]. The results of the co-authorship analysis at the country level were used to identify the most active countries and institutions in the field of technology and tools in the hospitality sector, as well as to understand the dynamics of international collaborations in this field.
2.3. Co-Occurrence of Keywords Analysis
Co-occurrence of keywords analysis is another method of bibliometric analysis used to identify the relationships between keywords in a specific field of research, the main themes and subtopics within a research topic, and the key actors and institutions working in that field. As a result, it is useful in identifying emerging trends and research gaps within the topic [21]. However, it is important to note that the co-occurrence of keywords analysis should be used in conjunction with other research methods, such as citation analysis, in order to provide a comprehensive understanding of the research topic. Additionally, one must be aware of the limitations of the co-occurrence of keywords analysis, such as the potential for bias in the selection of keywords, and interpret the results with caution [12,17]. This study involves analyzing the co-occurrence of keywords in a set of publications to identify the most frequently co-occurring keywords and the patterns of association between them [12,17].
3. Results
Table 2 provides a breakdown of the different types of documents included in the dataset used in this study. The majority of the sources were articles and conference papers, accounting for a total of 62.76% and 20.45% of the dataset, respectively. These two types of documents are considered to be the most prevalent forms of scholarly communication in the field of technology and tools in the hospitality sector. The presence of a high proportion of articles and conference papers in the dataset suggests that this study has captured a broad and representative sample of the literature in this area. Additionally, it indicates that the study has captured the most recent and up-to-date research.
The next most prevalent type of document in the dataset is book chapters, which make up 9.87% of the sources. This suggests that the study has also captured research that is disseminated in monographic works. The remaining types of documents, including reviews, books, notes, letters, and editorials, make up a relatively small percentage of the dataset, indicating that they are less prevalent forms of scholarly communication in the field of technology and tools in the hospitality sector. Furthermore, the overwhelming majority of studies, approximately 96%, were written in English, while the remaining studies were authored in various other languages, including Spanish, Portuguese, Russian, French, German, Italian, and Japanese.
3.1. Results of the Citation Analysis
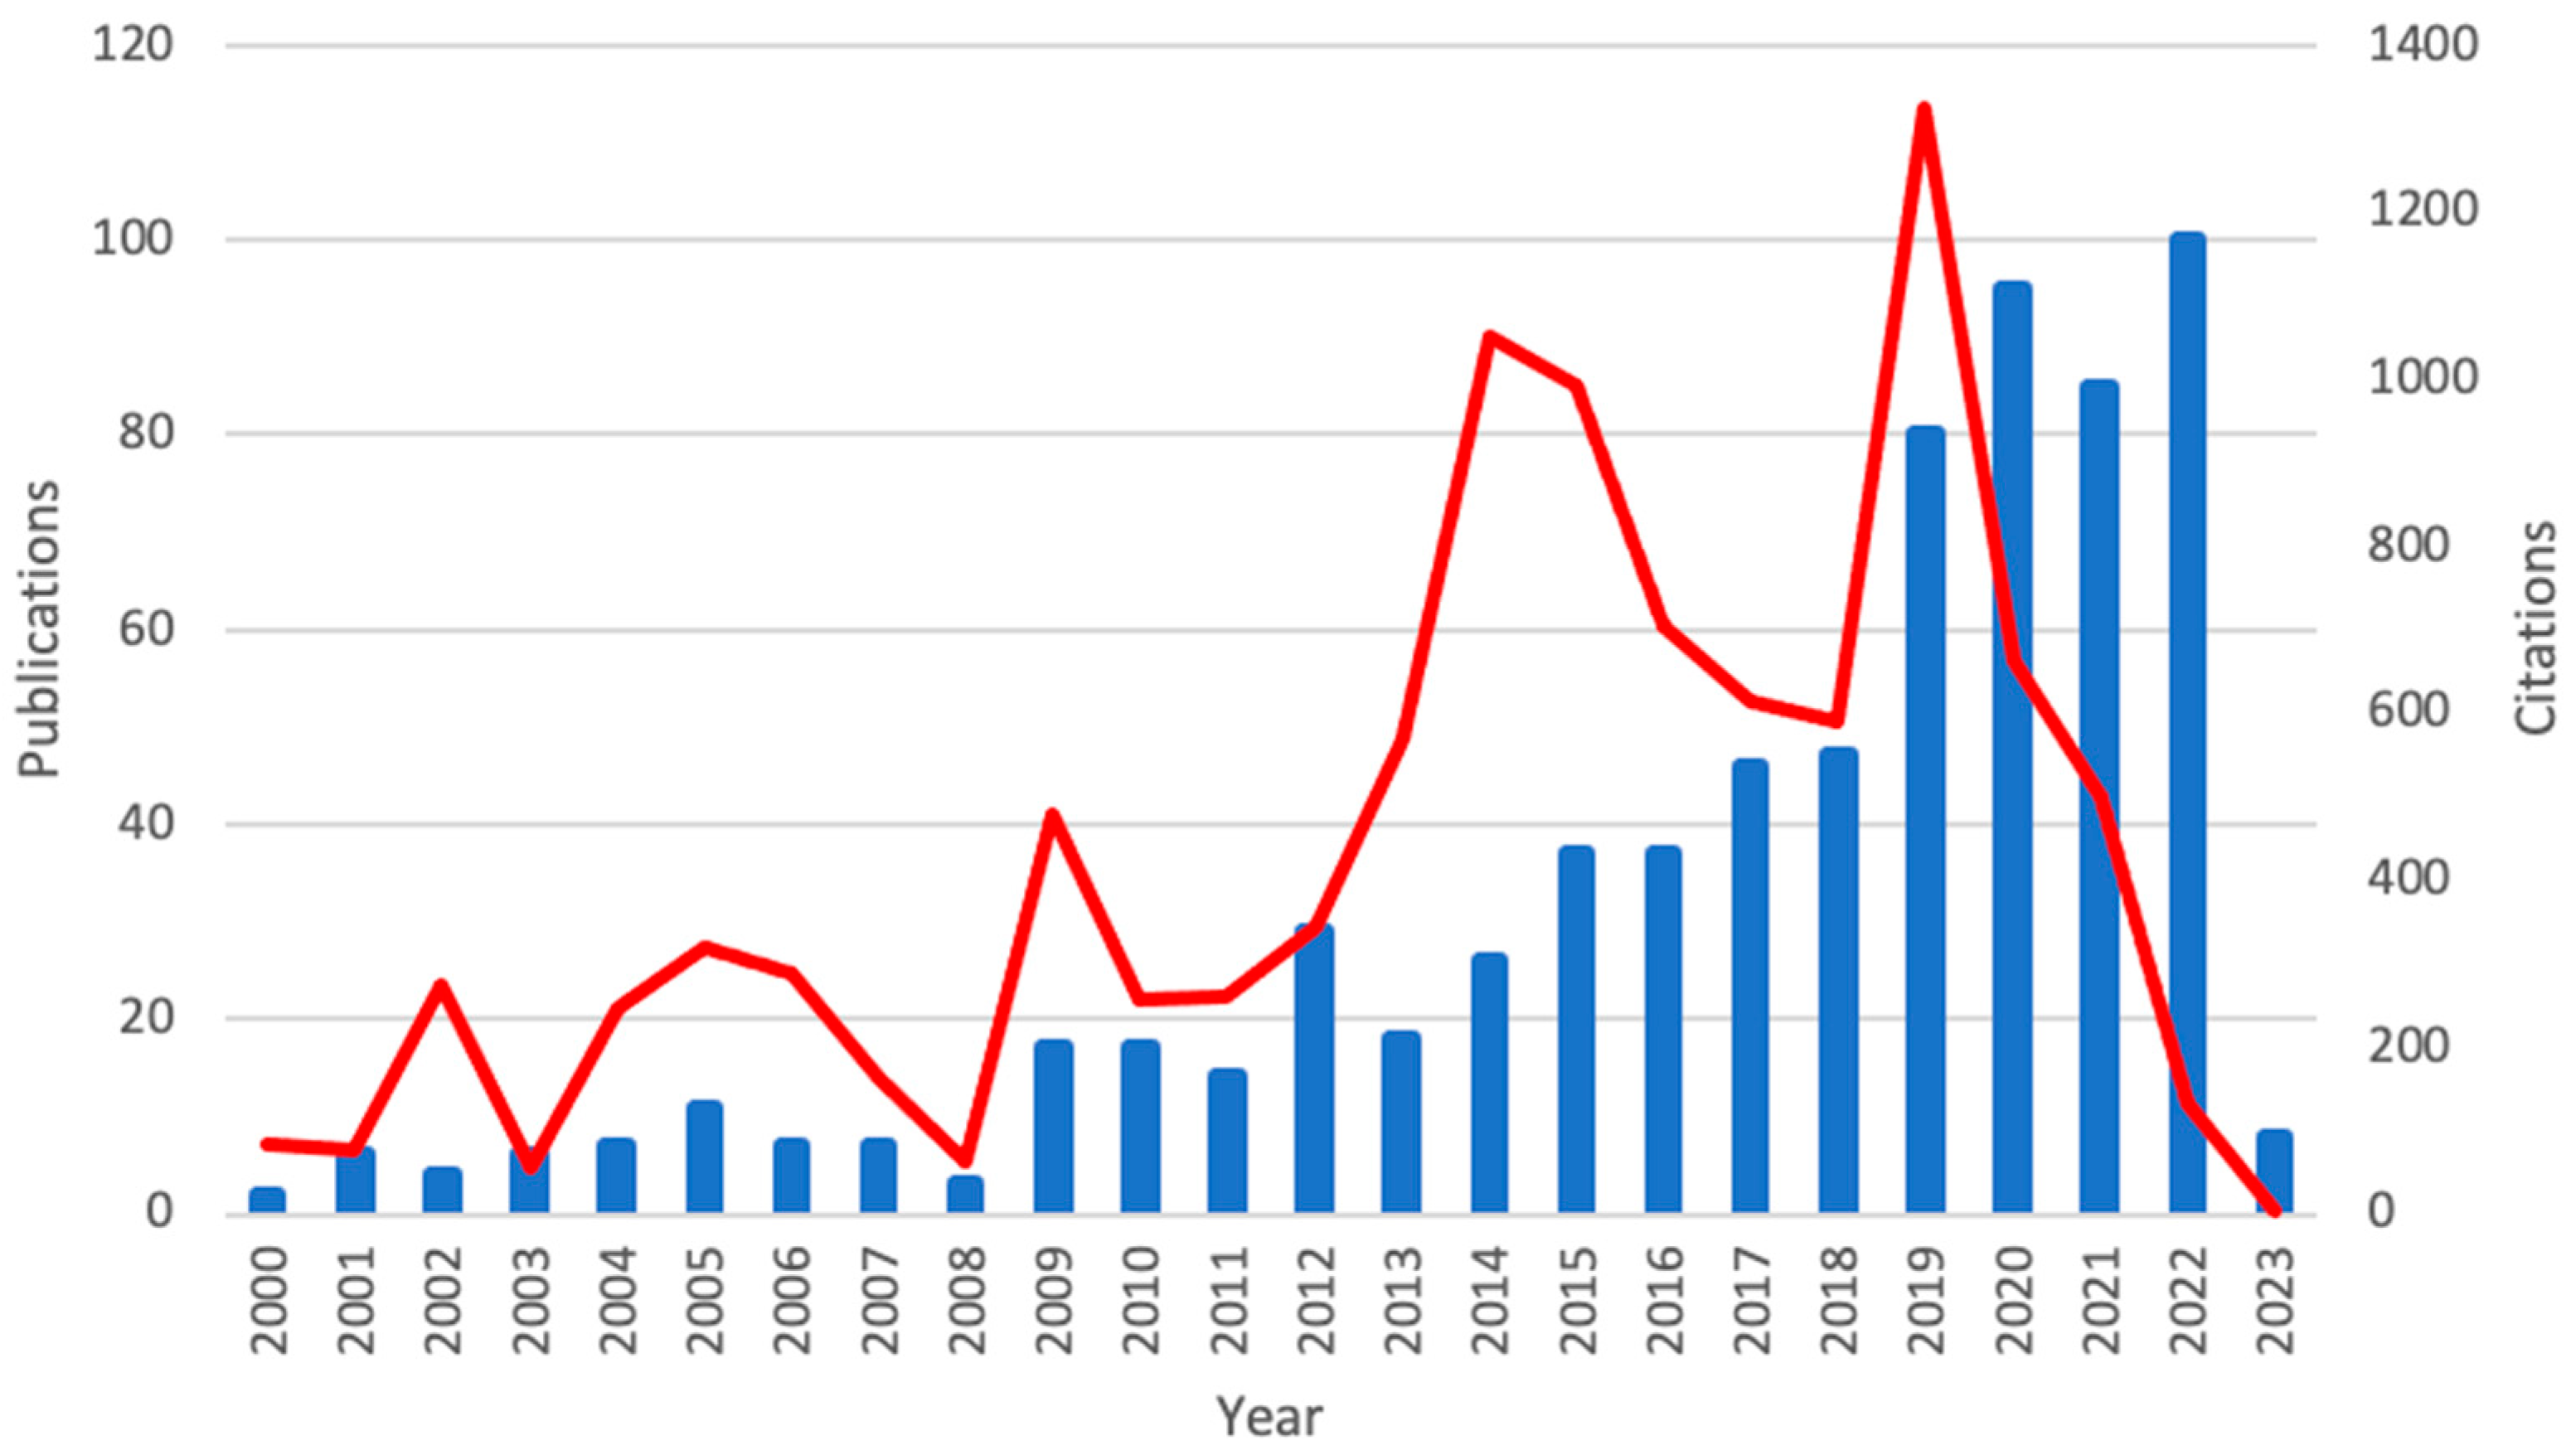
Figure 1 illustrates the temporal distribution of related publications and their corresponding total citations over the years of examination. The left axis represents the number of publications, depicted through bars, which exhibits an upward trend in recent years. The right axis, representing the number of citations through a line graph, also reflects a similar pattern. It is noteworthy that a slight decline in the number of citations is observed post-2020, which may indicate a higher rate of publications within this timeframe. Despite this, there is significant interest in the concepts examined within the tourism industry, as evidenced by the increasing trend in both publications and citations over the years of examination.
Table 3 presents the citation metrics of the 709 publications analyzed in this study. The total number of citations for these publications is 10,051, spanning over 12 years. This results in an average of 837.6 citations per year, or 59.1 citations per paper. The data show that the average number of citations per author is 63.0 and the average number of authors per paper is 4.4.
Table 4 presents the general citation structure of the publications analyzed in this study, providing an overview of the distribution of citations among the publications of the dataset. As shown, 28.07% of the articles received no citations and 65.87% received less than 52 citations. Moreover, 3.39% of the articles received between 52 and 103 citations, 1.27% received between 104 and 154 citations, 0.71% received between 155 and 205 citations, 0.42% received between 206 and 256 citations, and 0.28% received more than 256 citations.
Table 5 illustrates the top 10 most cited papers in our database. The papers are ranked based on the number of citations received, with the paper written by Xiang et al. (2015) receiving the highest number of citations at 510. These cover a wide range of topics related to the hospitality industry, including big data and text analytics in relation to hotel guest experience and satisfaction, customer engagement with tourism brands, technological disruptions in services, and consumer satisfaction in green hotels. The authors of the papers come from diverse backgrounds and institutions, including universities and research centers. Overall, the table highlights the importance of understanding the consumer experience and the role of technology and sustainability in the hospitality industry.
3.2. Results of the Co-Authorship Analysis
Of the 1286 organizations, only 4 meet the threshold of a minimum number of threedocuments, as shown in Table 6. The table presents the top organizations in the co-authorship of organizations analysis. The first column shows the organization’s name, the second column shows the number of documents (publications) produced by the organization, and the third column shows the number of citations received by these documents. Cardiff Metropolitan University, with 3 documents and 43 citations, is the top organization. The second organization is Rosen College of Hospitality Management, University of Florida, with 9 documents and 197 citations. The third organization is the School of Hotel and Tourism Management, The Hong Kong Polytechnic University, with 4 documents and 160 citations. The fourth organization is Universidade Europeia, Lisbon, with 4 documents and 47 citations. These organizations have made significant contributions to the topic of hospitality and tourism management, as evidenced by their high number of publications and citations.
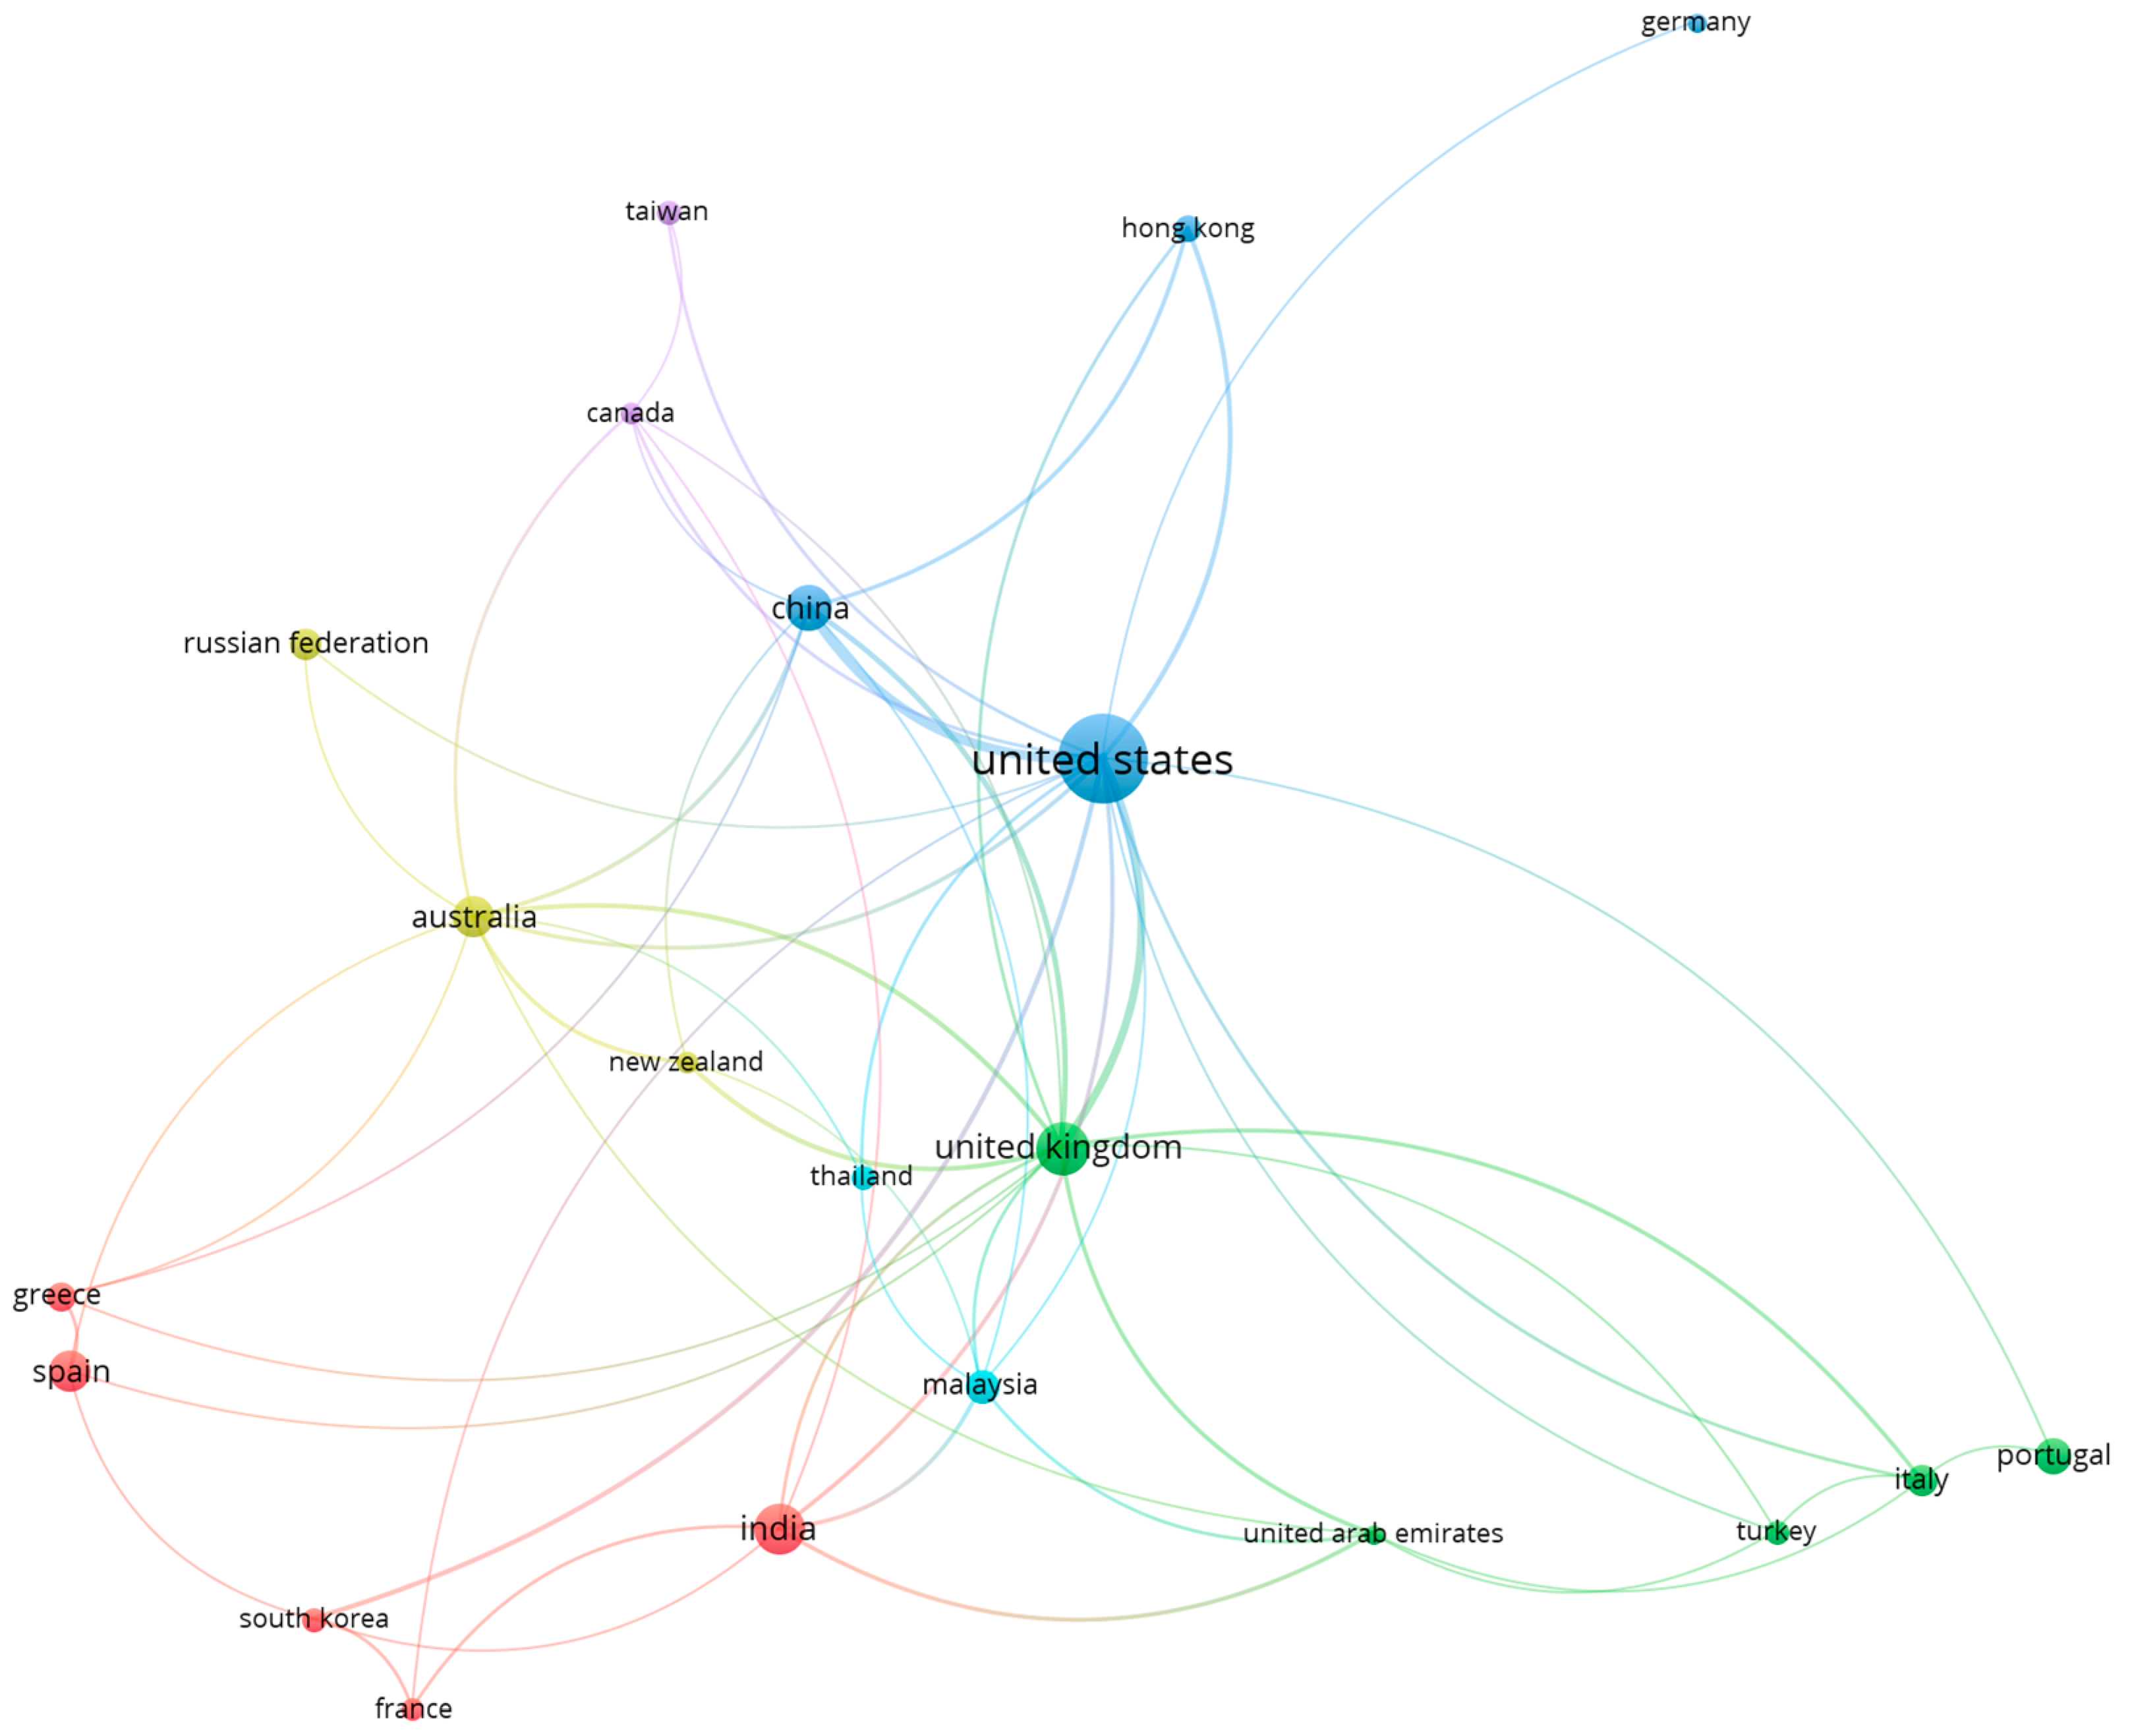
Of the 93 countries, 21 meet the threshold of a minimum number of 10 documents, as shown in Table 7 and Figure 2. The table shows the number of documents and citations for each country and the total link strength between them. The total link strength is a measure of the collaboration between countries, where a higher link strength means more collaboration. The United States of America is at the top of the list, with 177 documents and 4872 citations. The United Kingdom follows with 62 documents and 1077 citations. China is in third place, with 47 documents and 458 citations, and other countries on the list include Australia, India, Malaysia, United Arab Emirates, Hong Kong, New Zealand, Canada, Italy, South Korea, France, Greece, Spain, Thailand, Turkey, Taiwan, Portugal, Russian Federation, and Germany. The data suggest that the authors in these countries have a strong collaboration with each other in terms of co-authorship and citations.
The co-authorship of countries analysis provides a deeper understanding of the patterns and trends in the co-authorship of countries in the network. The analysis yielded six clusters, each representing a grouping of countries based on their patterns of collaboration in the network. This analysis provides a deeper understanding of the patterns and trends in the co-authorship of countries in the network. The first cluster (red) encompasses France, Greece, India, South Korea, and Spain, indicating a high degree of collaboration among these countries. The second cluster (green) includes Italy, Portugal, Turkey, the United Arab Emirates, and the United Kingdom. The third cluster (blue) encompasses China, Germany, Hong Kong, and the United States of America. The fourth cluster (yellow) includes Australia, New Zealand, and the Russian Federation. The fifth cluster (purple) encompasses Canada and Taiwan and the sixth cluster (light blue) includes Malaysia and Thailand, with both clusters indicating a lower degree of collaboration among these countries.
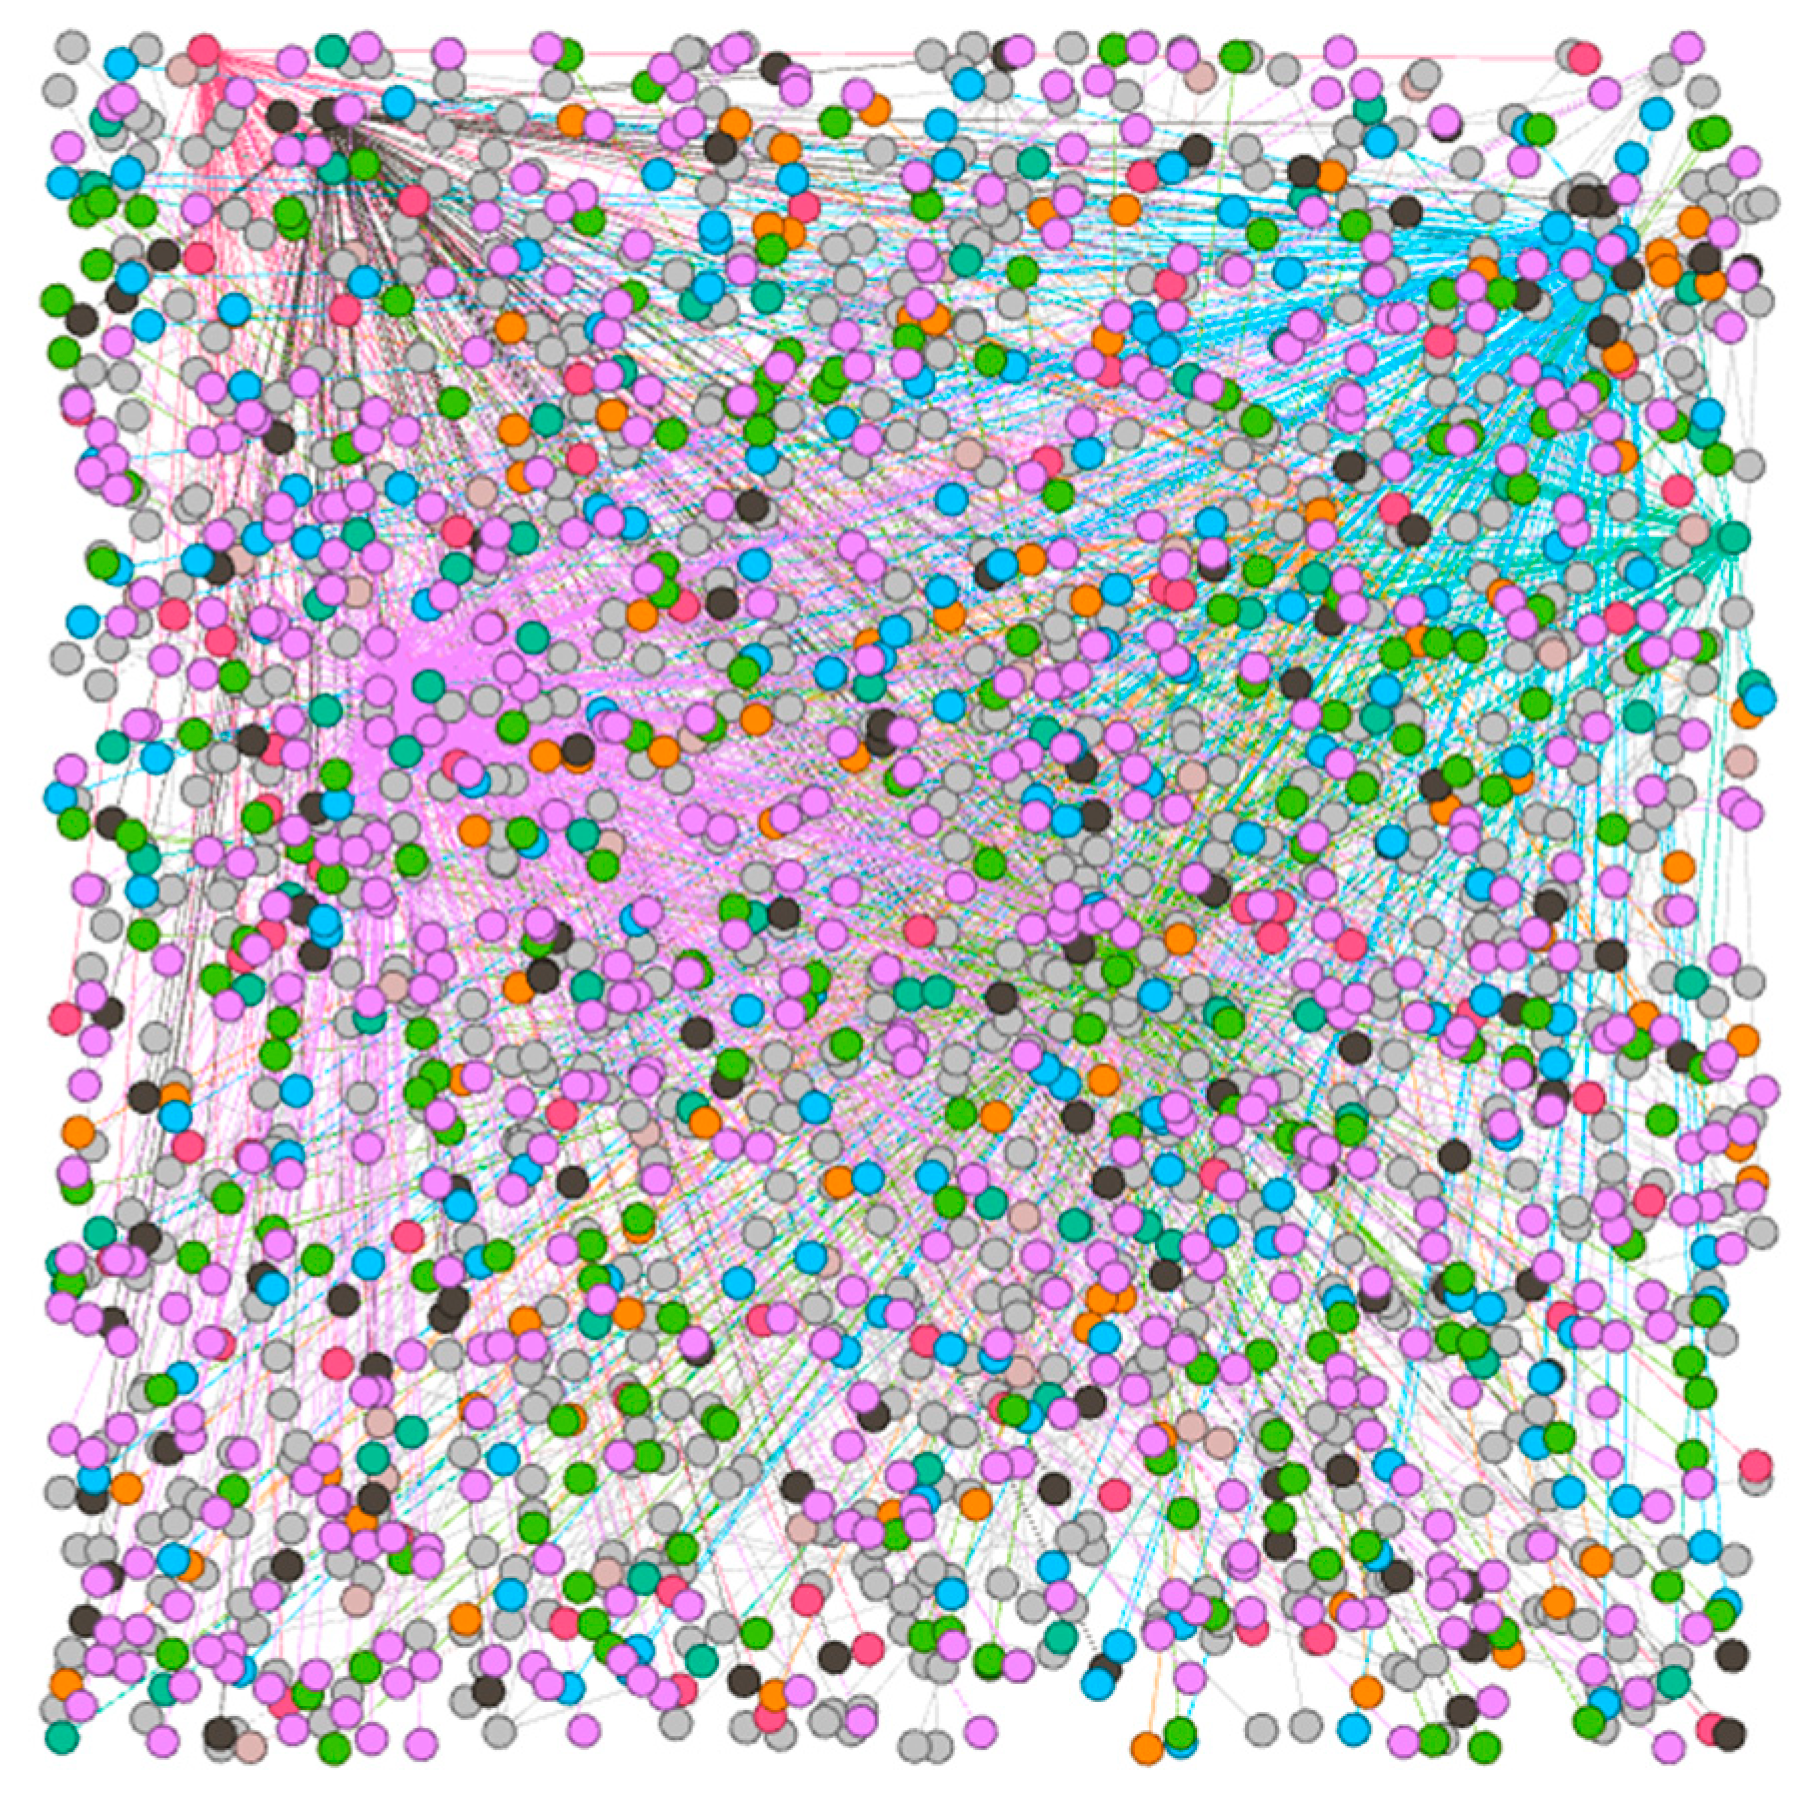
The analysis of the co-authorship network using Gephi software revealed some interesting insights. The total number of nodes (authors) in the database was 1810 and the total number of edges (citations) was 1922. Utilizing Gephi’s network visualization capabilities, an understanding of the overall structure of the network was achieved, patterns in the connections between authors were identified, and distinct groups within the network were highlighted, known as modularity classes. These classes represent groups of authors that are more densely connected than other nodes in the network, providing insight into potential research interests or collaboration patterns among the authors.
The analysis revealed a high degree of community structure in the network, as indicated by the modularity index of 0.895 [19]. This suggests that the authors in the network tend to be more connected to other nodes within the same group or cluster than to those outside of it, potentially indicating similar research interests or collaboration on similar projects. The modularity classes were used to identify the group of authors that are most tightly connected, with the highest class (purple color) having a 25.75% representation, as shown in Figure 3. The elements in this class are the authors and the number of elements, in this case, 465, represents the number of authors that have been grouped.
3.3. Results of the Co-Occurrence Analysis
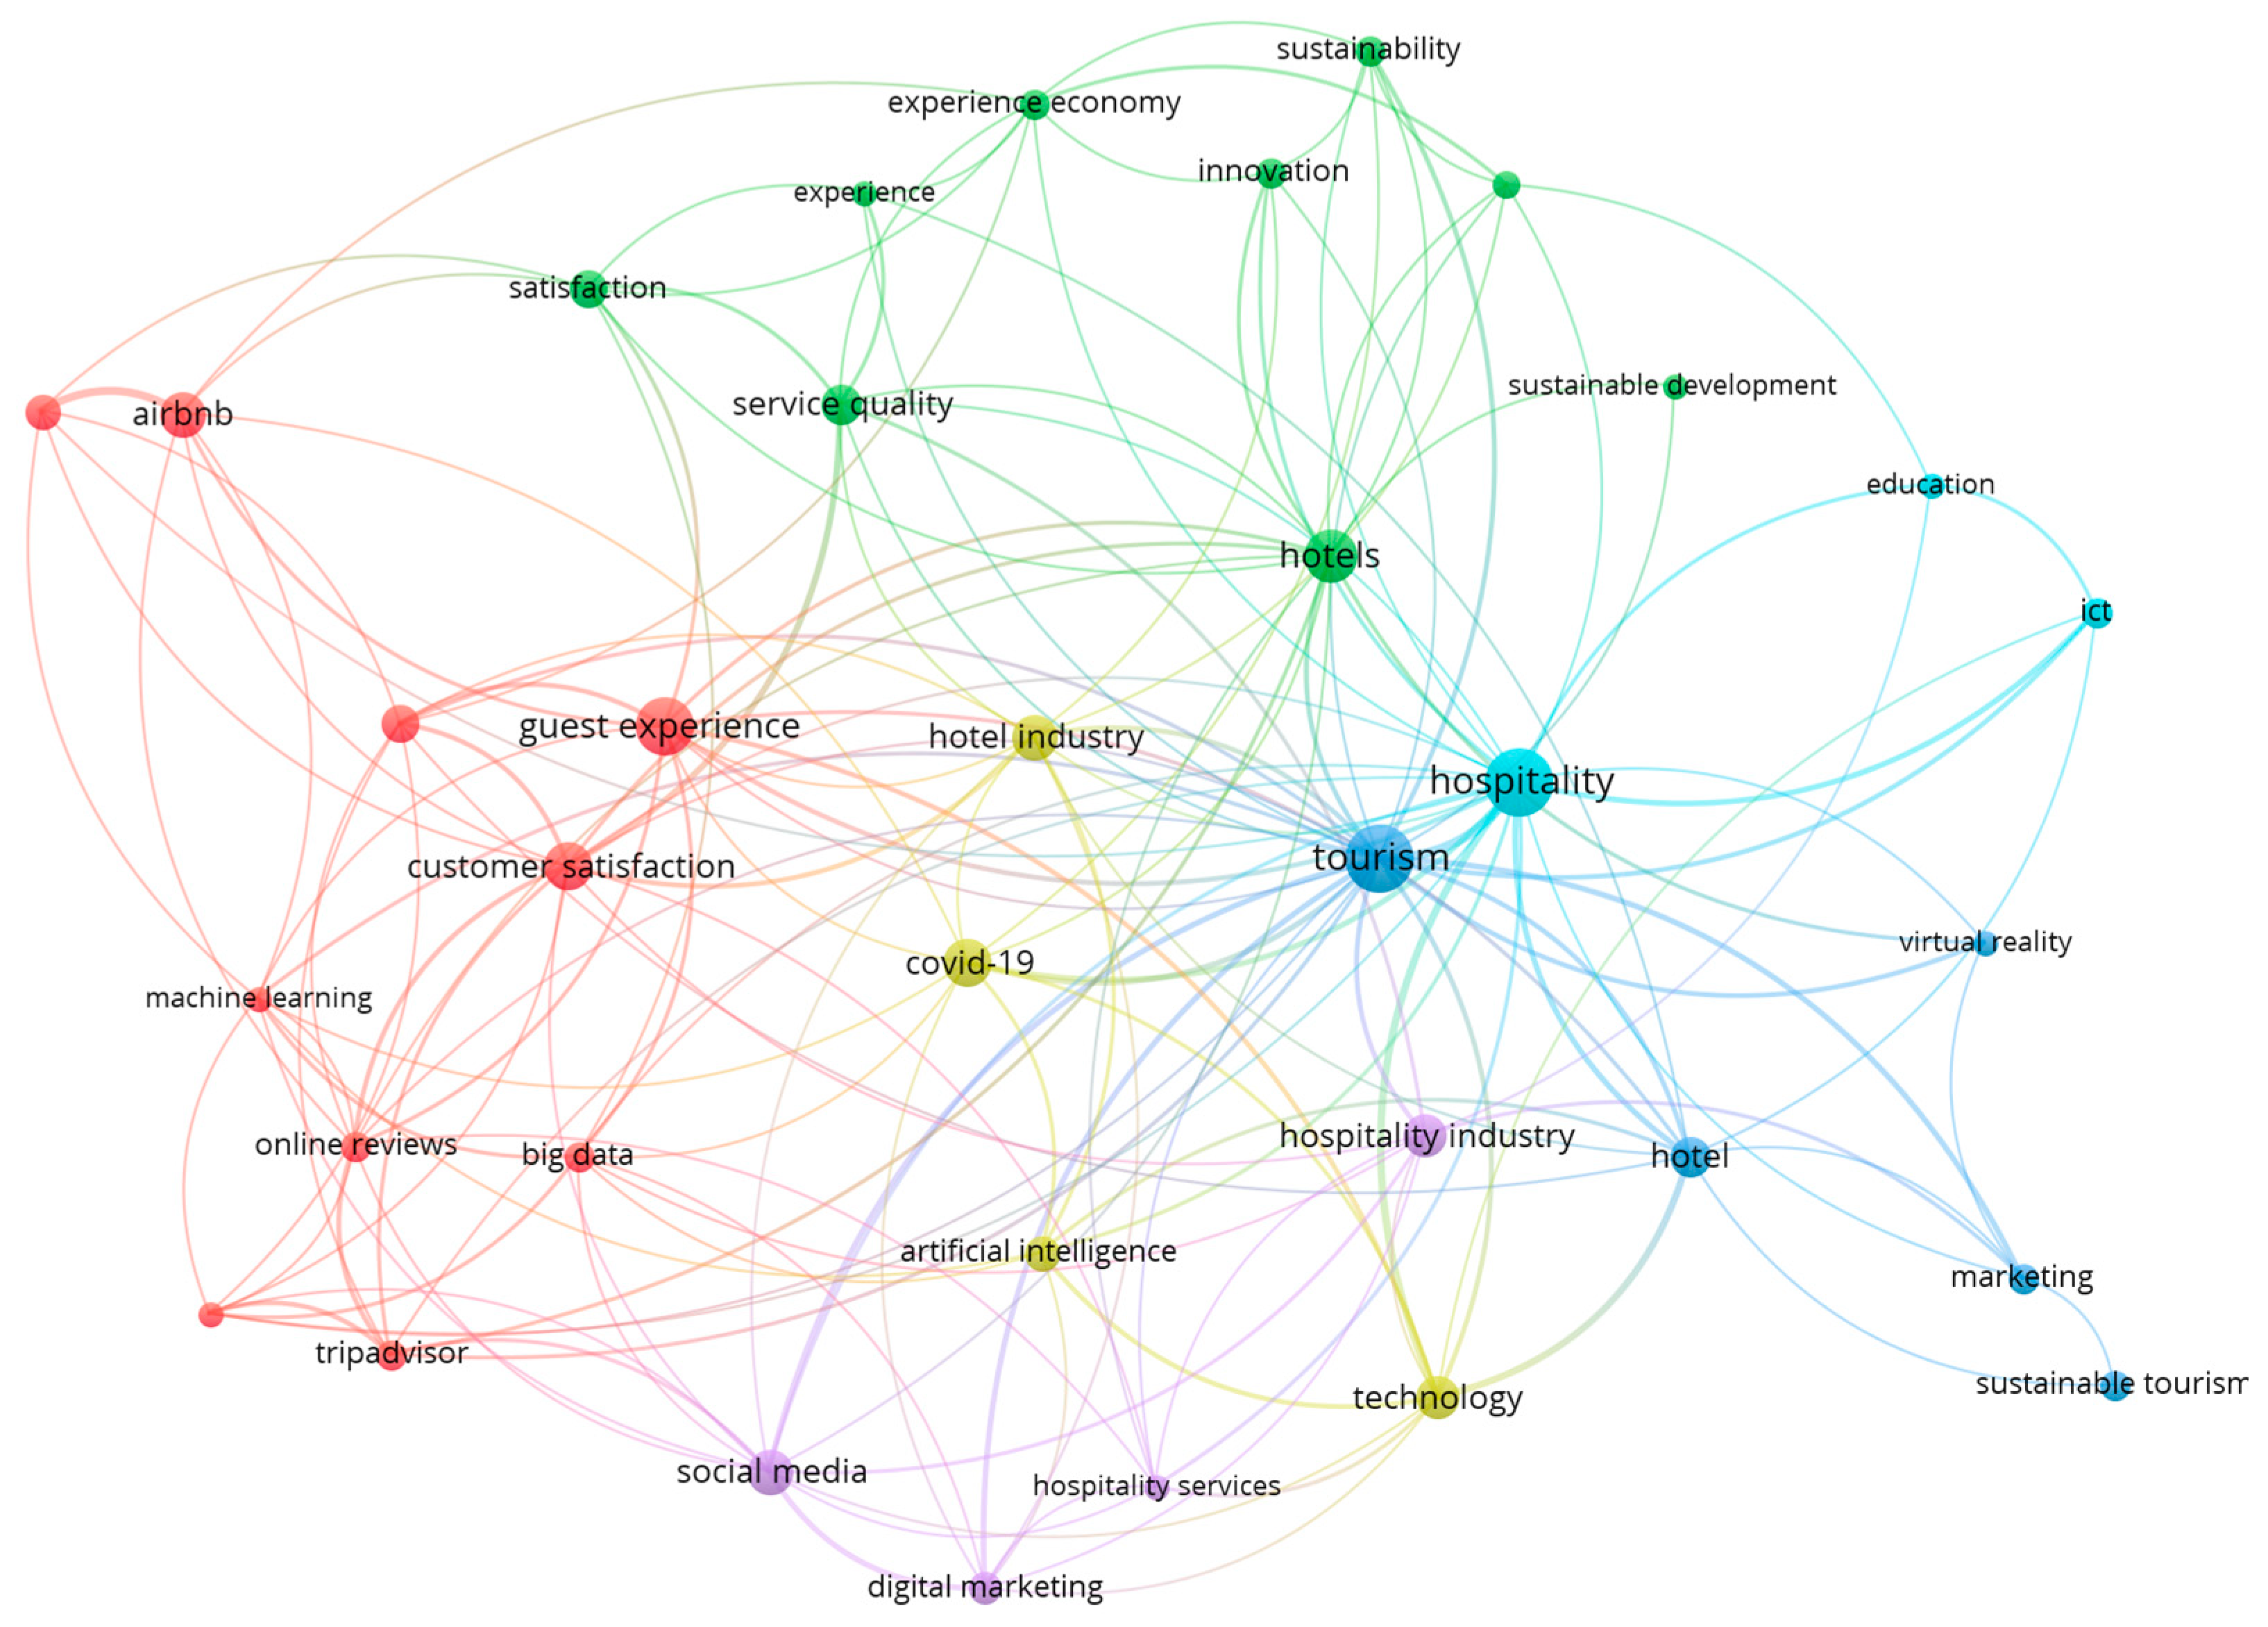
An analysis of the co-occurrence of keywords in the authors’ papers was conducted using VOSviewer software. Of the 2069 total author keywords, a threshold of seven appearances was set to identify the most prevalent keywords. This analysis produced six clusters, with the highest co-occurring keywords being tourism (46), hospitality (46), guest experience (33), and hotels (29). Table 8 presents a summary of the top 15 keywords, including their number of occurrences and total link strength, while Figure 4 illustrates the network mapping of the co-occurrence of keywords analysis. The clusters were then labeled and analyzed to gain insights into the prevalent themes and patterns in the authors’ research.
Cluster 1 (red), titled “Big Data and Customer Experience in the Sharing Economy”, contains keywords related to the use of big data and the customer experience in the context of the sharing economy, specifically in the context of companies such as Airbnb and TripAdvisor. The keywords “Airbnb”, “big data”, “customer experience”, “customer satisfaction”, “guest experience”, “machine learning”, “online reviews”, “sentiment analysis”, “sharing economy”, and “TripAdvisor” all relate to the use of data and customer experience in the sharing economy. This cluster highlights the growing importance of utilizing big data and advanced technologies such as machine learning in understanding and improving customer experiences in the sharing economy.
Cluster 2 (green), titled “Innovations in Hospitality Management and Sustainability”, contains keywords related to the topics of hospitality management, innovation, and sustainability. The keywords “experience”, “experience economy”, “hospitality management”, “hotels”, “innovation”, “satisfaction”, “service quality”, “sustainability”, and “sustainable development” all relate to the growing importance of sustainability and innovation in the hospitality industry. This cluster highlights the need for hotels and other hospitality businesses to focus on sustainable practices and the use of new technologies to improve customer satisfaction and experience.
Cluster 3 (blue), titled “Sustainable Tourism and Marketing”, contains keywords related to sustainable tourism and marketing in the context of the hotel industry. The keywords “hotel”, “marketing”, “sustainable tourism”, “tourism”, and “virtual reality” all relate to the growing importance of sustainable practices and innovative marketing strategies in the hotel industry. This cluster highlights the need for hotels to focus on sustainable practices and the use of new technologies, such as virtual reality, in their marketing efforts to attract customers.
Cluster 4 (yellow), titled “Technology and the Hotel Industry in the Era of COVID-19”, contains keywords related to the impact of technology and the ongoing COVID-19 pandemic on the hotel industry. The keywords “artificial intelligence”, “COVID-19”, “hotel industry”, and “technology” all relate to the ongoing changes and challenges faced by the hotel industry in the wake of the COVID-19 pandemic and the increasing use of technology in the industry. This cluster highlights the need for hotels to adapt to the new technological and health-related challenges posed by the COVID-19 pandemic.
Cluster 5 (purple), titled “Digital Marketing and the Hospitality Industry”, contains keywords related to digital marketing and the hospitality industry. The keywords “digital marketing”, “hospitality industry”, “hospitality services”, and “social media” all relate to the use of digital marketing strategies and the growing importance of social media in the hospitality industry. This cluster highlights the need for hotels and other hospitality businesses to focus on digital marketing and social media in order to attract customers.
Cluster 6 (light blue), titled “Education and ICT in the Hospitality Industry”, contains keywords related to education and the use of information and communication technology (ICT) in the hospitality industry. The keywords “education”, “hospitality”, and “ict” all relate to the importance of education and the use of technology in the hospitality industry. This cluster highlights the need for hotels and other hospitality businesses to focus on education and the use of technology in order to improve their operations and attract customers.
4. Discussion
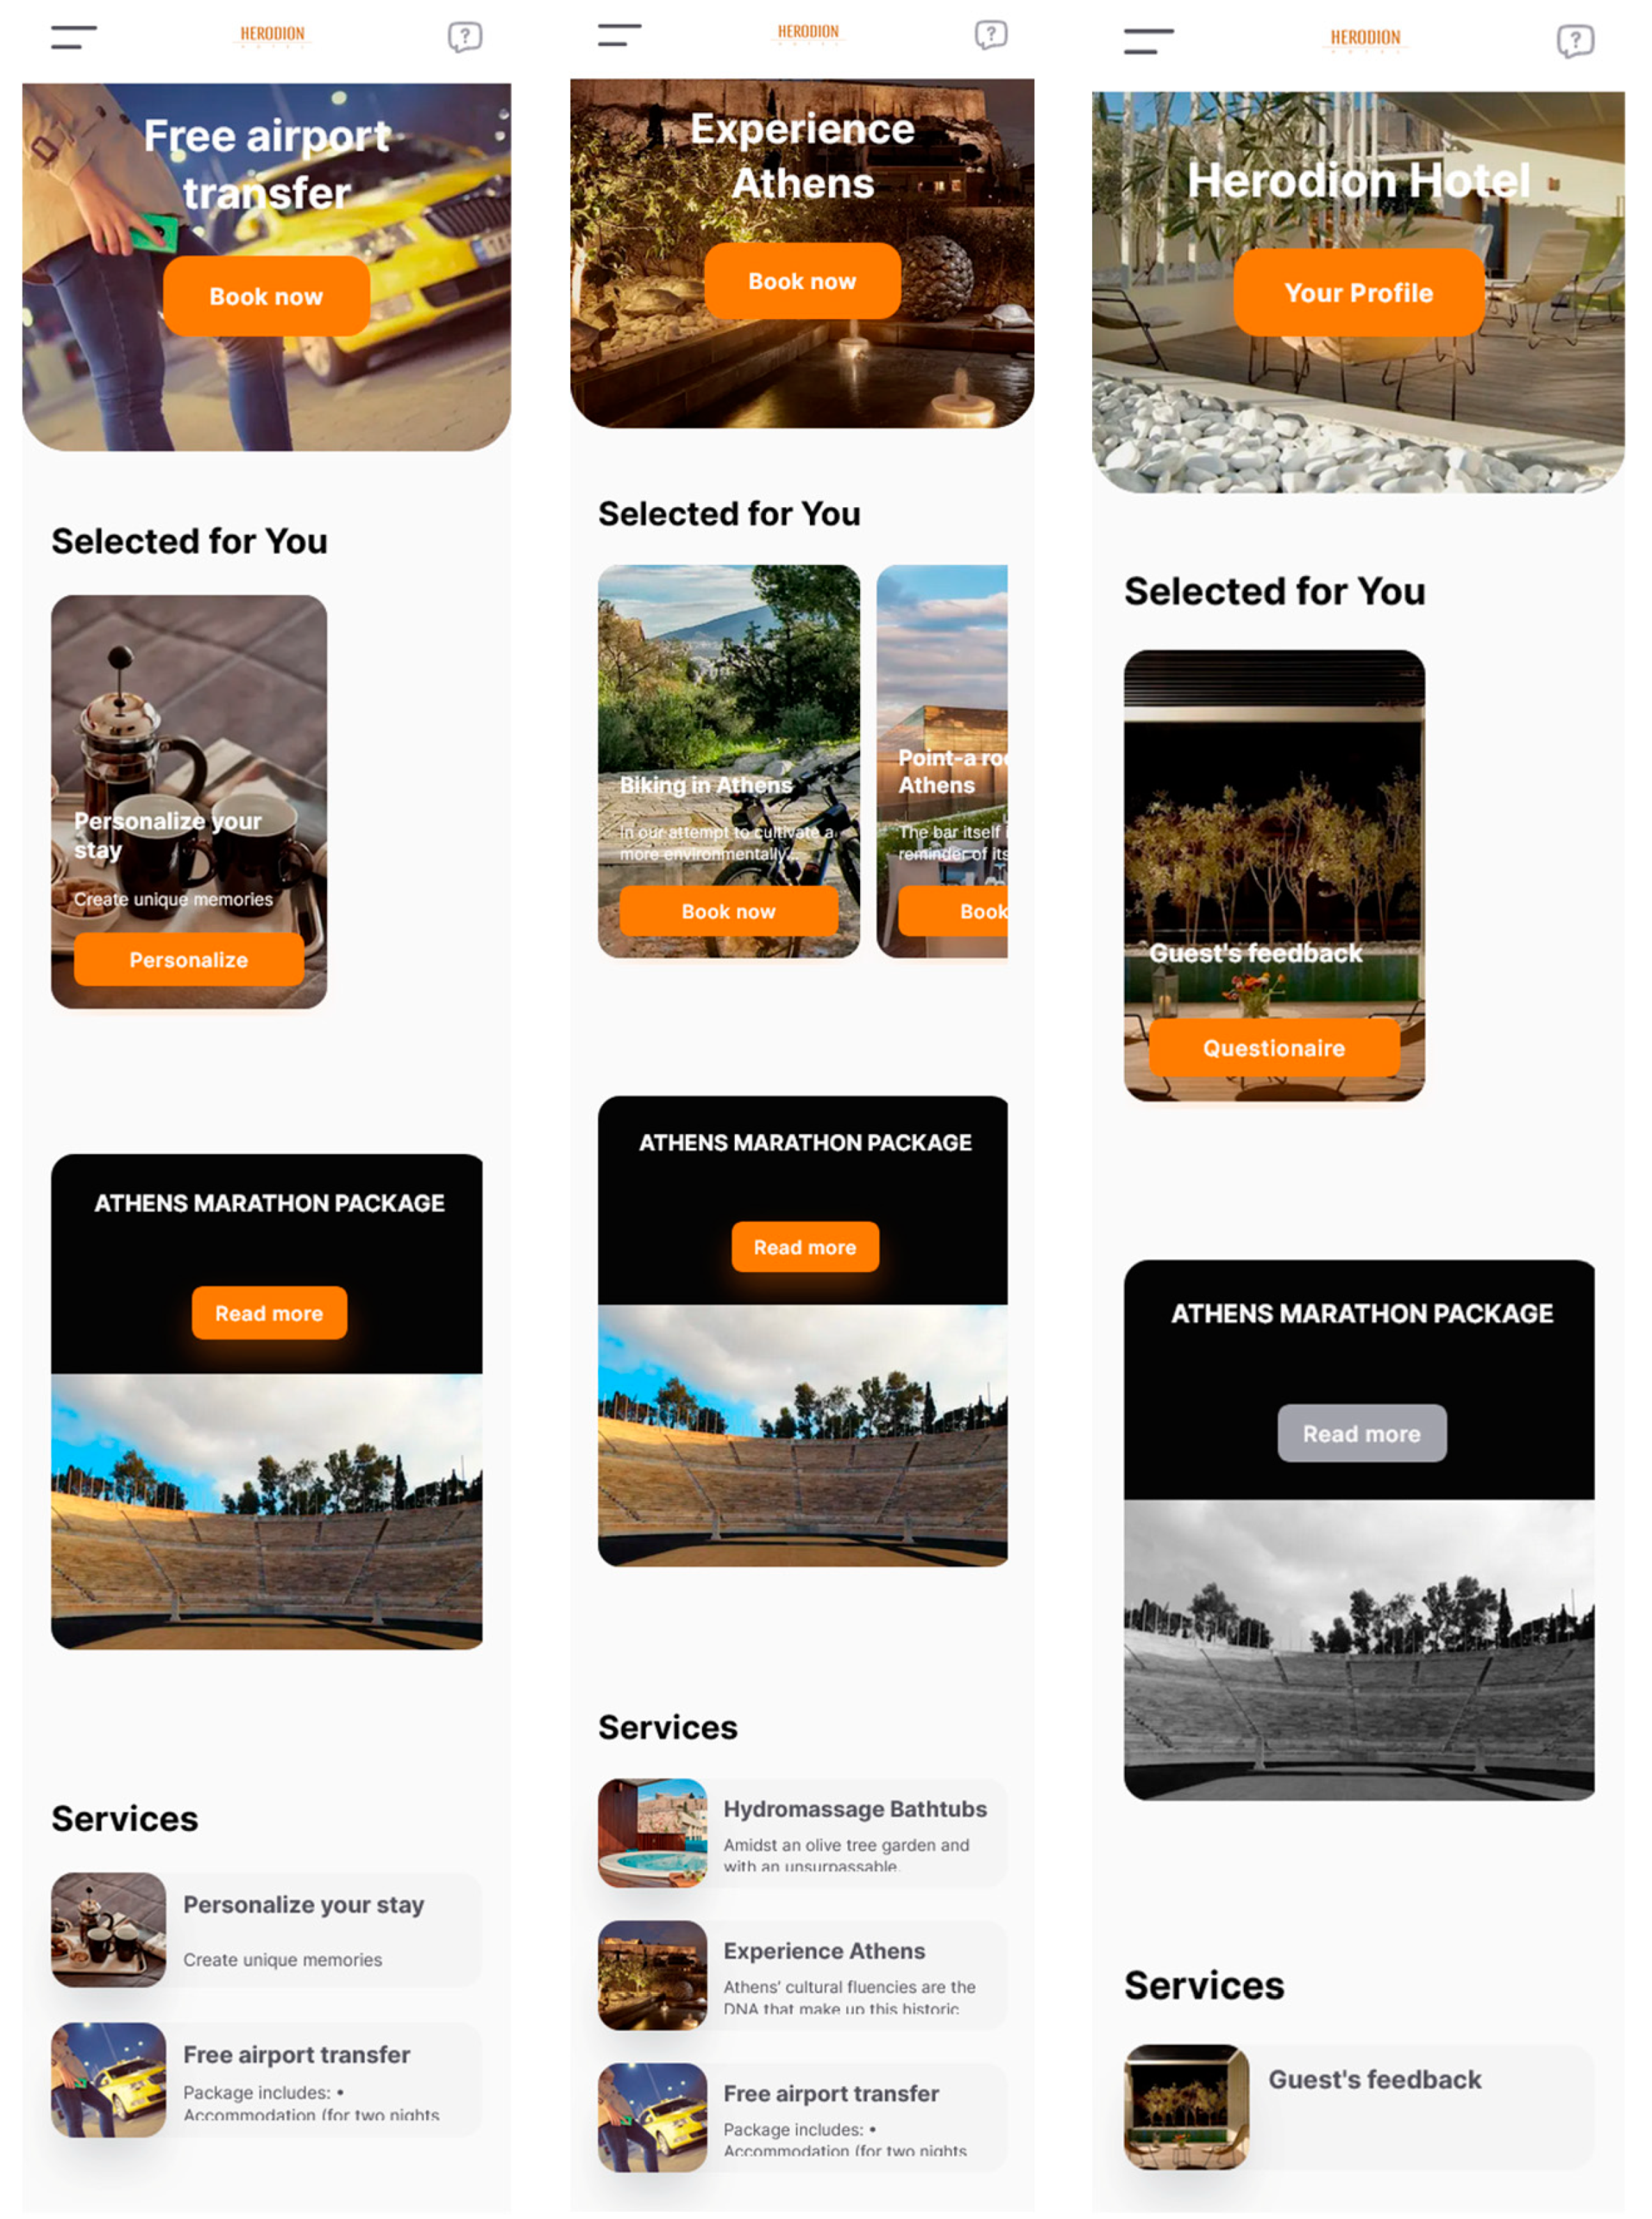
The analysis performed has led to the identification of distinct groups of tools utilized in the global hotel industry. The application developed in this work falls within group 1, titled “Big Data and Customer Experience in the Sharing Economy”, which is concerned with enhancing the overall experience of hotel guests. To achieve this objective, a categorization of the booking process into different stages was conducted, as illustrated in Figure 5 (Nelios, Athens, Greece) and supported by recent studies [33]. This approach allows the traveler to customize the booking process with a few clicks, resulting in a more personalized accommodation experience.
The first stage, before arrival, enables the guest to make choices such as early check-in, airport transportation, meal preferences, minibar contents, and pillow type. The second stage, during the stay, allows the guest to make reservations at various hotel departments (e.g., restaurants, spas, and gyms), order room service, and book activities outside the hotel. Finally, the third stage, after departure, invites the guest to provide feedback on their stay experience through a questionnaire and to share their thoughts on social media. All of this information is stored on the platform, allowing to provide a more personalized service during future stays and supporting actions such as email marketing.
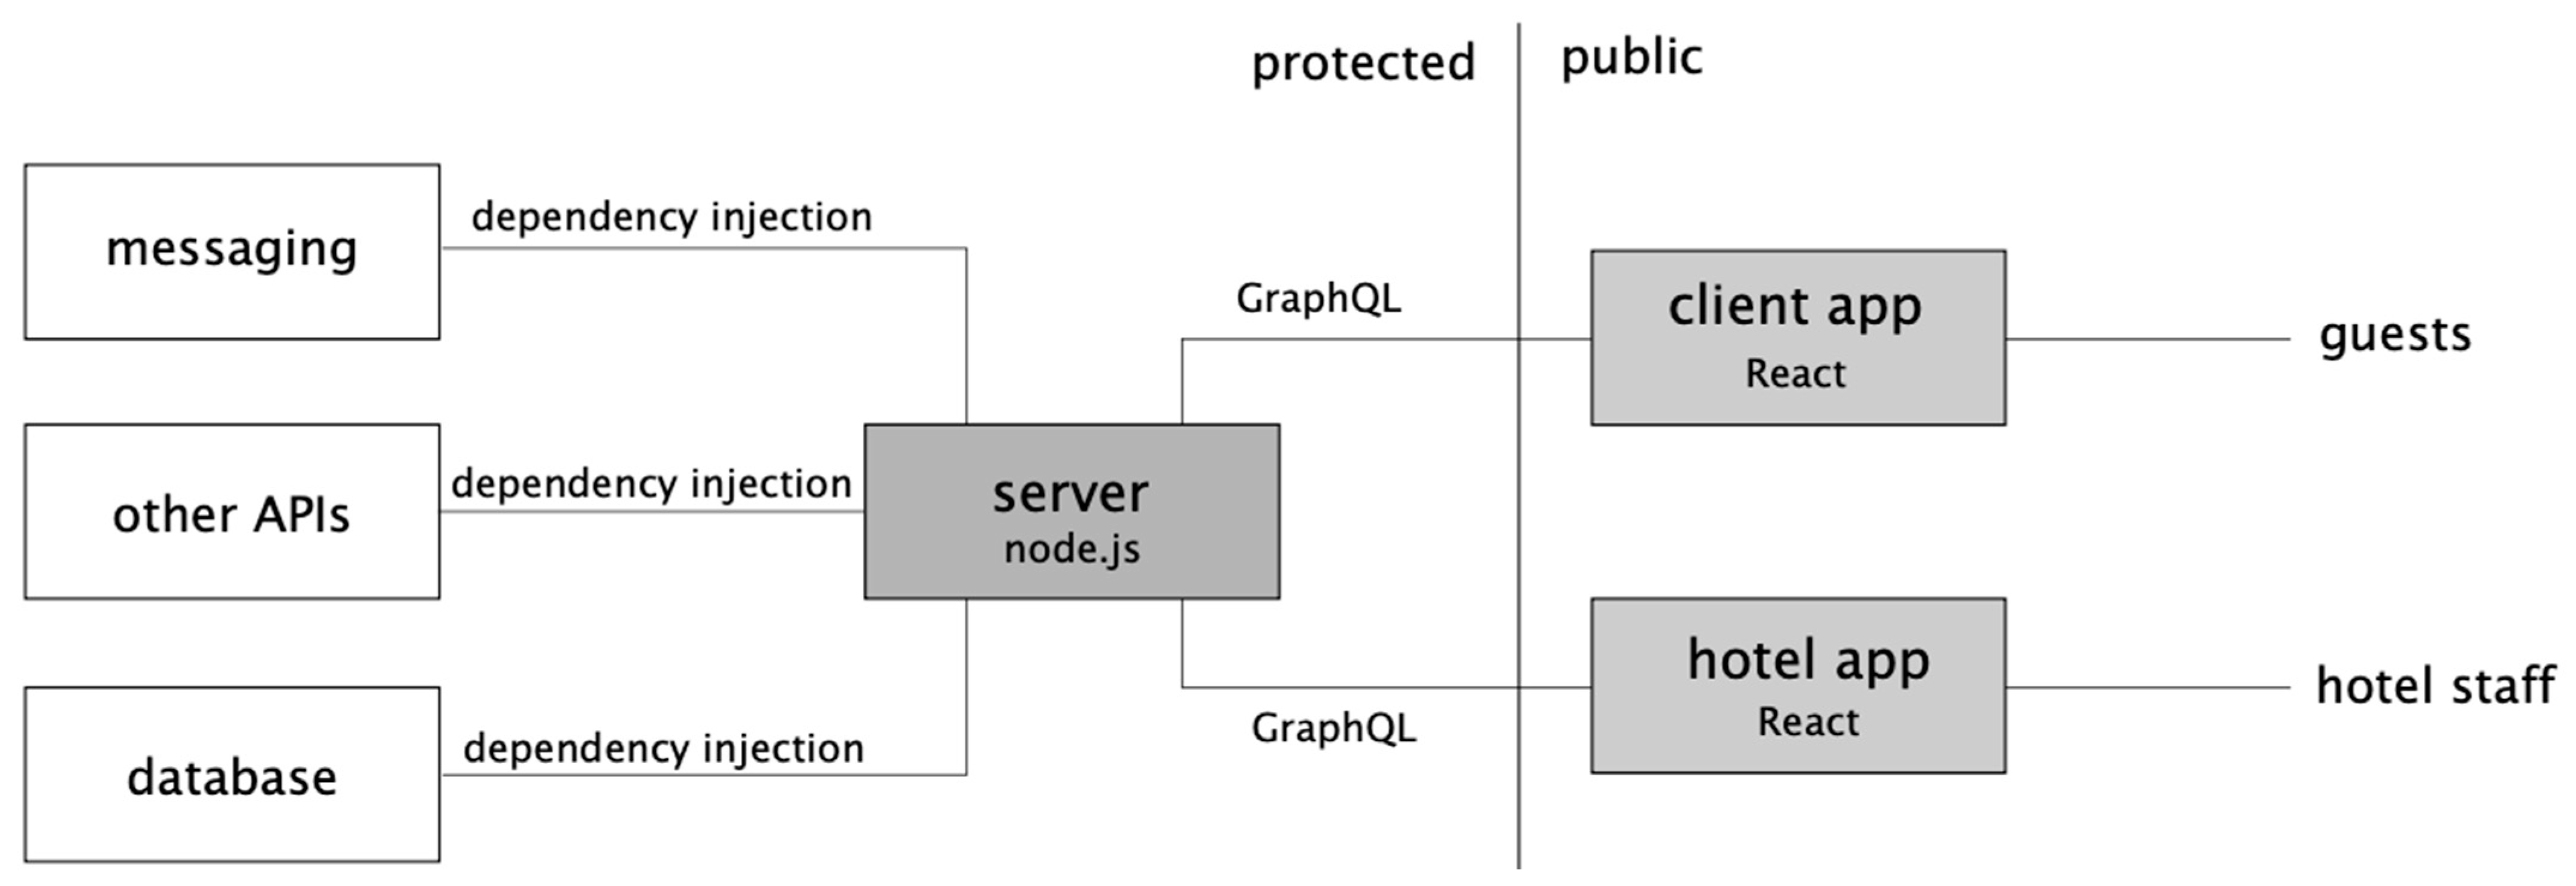
The project structure employed in this study consists of three separate applications, each serving a specific purpose, with shared code libraries that allow for intercommunication and code reuse. The entire project is held within a monorepo and written in TypeScript. One of the applications is a Node.Js server, responsible for serving as a common API and database access point for the other two React-based applications. The first React app is designed to be utilized by the hotel for data entry and order management purposes, while the other app is aimed at providing a convenient interface for clients. Communication between the Node server and the React apps is established via GraphQL, enabling seamless data exchange between the different components of the system. The shared code libraries contain type definitions, which are utilized across all applications and ensure consistency and compatibility of code. Requests to the Node server are authenticated using JWT, ensuring in this way secure access to the data stored in the system, as shown in Figure 6.
The server-side application of the system is developed using the Nest.JS framework, which leverages the benefits of dependency injection. The architecture of the Node server is modular, with each module corresponding to a distinct entity within the system. There are modules for the three different types of services offered and a module for unifying these services into common lists. Similarly, there are modules for the orders accepted by each of the service modules and an additional module for aggregating all orders. The system also includes modules for managing hotel employees and guests, hotel departments, and other content entities such as offers and experiences. Finally, there are modules dedicated to internal functionalities such as authentication and file management.
By utilizing dependency injection, the system allows for flexible modularity, enabling any individual module to be altered without affecting the rest of the code. Within each module, the same principles apply, with database access solely managed through repository classes that are subsequently injected into the rest of the code. Each module exposes GraphQL resolvers that complement the GraphQL schema and, if necessary, service classes that can be utilized by other modules.
The architecture of the two React applications is broadly similar and leverages Next.JS as its underlying framework. Both apps have implemented a similar pattern for authentication and context management, following a modular approach. However, in this scenario, the use of dependency injection is not feasible and a simple folder structure with organized imports is adopted instead. Each module only exposes the components responsible for rendering the relevant pages, with other logic and components either being kept within the module or extracted to libraries if needed by multiple modules.
There is no direct communication between the two React applications at any point. They only interact with the server app and share a substantial amount of standard code such as interfaces, helper functions, unstyled components, and constants, which are housed in separate libraries that both apps can import.
The server app is deployed once for the entire application and functions as a multi-tenant app, able to accept requests from all hotels through different subdomains. The hotel ID is included in all requests and is utilized throughout the app to manage and process the requests. The two React apps are deployed individually for each hotel, utilizing the same code but with distinct environment variables. This allows for greater customization of the apps for each hotel, as well as facilitating integration with other hotel services and the use of different domains.
5. Conclusions
The study provides an overview of the literature on the technology and tools used in the hospitality sector through a bibliometric analysis. The analysis revealed a growing body of research in this field, with increasing trends in publications and citations over the years. The key actors, institutions, and research trends in the field were identified, highlighting the various ways in which technology and data are being utilized in the hospitality industry to enhance customer experience, improve operational efficiency, and promote sustainability. Additionally, a novel application was presented that falls under the umbrella of big data and the customer experience in the sharing economy. The study also discussed the limitations of bibliometric research and provided suggestions for future research, including expanding the range of keywords used in the search process and exploring other academic databases, such as WoS, to improve the accuracy and comprehensiveness of future research.
5.1. Contribution to the Theory
The results show a growing body of research in this field, with an increasing trend in both publications and citations over the years of examination. The majority of sources were articles and conference papers, comprising 62.76% and 20.45% of the dataset, respectively, suggesting a broad and representative sample of the literature in this field. The study also identified key actors, institutions, and research trends in the field, including significant contributions from organizations such as Cardiff Metropolitan University and Rosen College of Hospitality Management, and countries such as the United States and the United Kingdom. The co-authorship analysis revealed patterns of collaboration among countries, with clusters of countries showing varying degrees of collaboration.
Additionally, the analysis identified six key clusters in the literature on technology and tools in the hospitality sector, which highlights the various ways in which technology and data are being utilized in the hospitality industry to enhance customer experience, improve operational efficiency, and promote sustainability. Cluster 1, “Big Data and Customer Experience in the Sharing Economy”, highlights the growing importance of utilizing big data and advanced technologies such as machine learning in understanding and improving customer experiences in the sharing economy, specifically in the context of companies such as Airbnb and TripAdvisor. Cluster 2, “Innovations in Hospitality Management and Sustainability”, emphasizes the need for hotels and other hospitality businesses to focus on sustainable practices and the use of new technologies to improve customer satisfaction and experience. Cluster 3, “Sustainable Tourism and Marketing”, highlights the need for hotels to focus on sustainable practices and the use of new technologies, such as virtual reality, in their marketing efforts to attract customers. Cluster 4, “Technology and the Hotel Industry in the Era of COVID-19”, highlights the need for hotels to adapt to the new technological and health-related challenges posed by the COVID-19 pandemic. Cluster 5, “Digital Marketing and the Hospitality Industry”, emphasizes the need for hotels and other hospitality businesses to focus on digital marketing and social media to attract customers. Lastly, Cluster 6 “Education and ICT in the Hospitality Industry”, highlights the importance of education and the use of technology in the hospitality industry to improve operations and attract customers.
5.2. Contribution to the Management Practice
In Section 4, a novel application was presented that falls under the umbrella of group 1, titled “Big Data and Customer Experience in the Sharing Economy”. The goal of this application is to provide a cutting-edge platform to the international market and to be the first integrated Greek platform with advanced capabilities. This analysis significantly contributes to the identification of key academic players, enabling the identification of strategic partnerships that emphasize collaboration between academic institutions and private companies.
It is worth noting that the presented platform is highly customizable by hotels, and the developers have already identified the next steps to integrate it with other hotel platforms. The collaboration between the different stakeholders is a critical aspect of this application, as it highlights the importance of teamwork in creating a platform that meets the needs of the hotel industry worldwide. The focus is on establishing a mutually beneficial partnership that leverages the expertise of academic institutions and the resources of private companies to provide a platform that exceeds the expectations of both hotels and guests.
5.3. Limitations
The limitations of bibliometric research are that it is based on a limited set of data, such as publications and citations, which may not fully capture the breadth of research in a field, and that may be subject to biases, such as publication bias, language bias, and citation bias [20], as can be caused by the “Matthew effect in science”, where researchers use references from colleagues and friends [34]. To overcome these limitations, it is essential to use bibliometric research in conjunction with other research methods, such as qualitative analysis, to gain a comprehensive understanding of the scientific landscape. Utilizing a wider range of academic databases, such as Web of Science and Scopus, can increase the number and diversity of sources included in the analysis. While the study focused solely on Scopus, it is essential to note that no single database is comprehensive or error-free, and each has its unique strengths and weaknesses. By including a more comprehensive range of databases in future research, researchers can gain a more complete and nuanced understanding of the literature in a given field.
Additionally, utilizing advanced features of bibliometric software, such as network mapping and co-occurrence analysis, can provide a more in-depth understanding of the relationships and trends within the literature. Overall, incorporating a multi-faceted approach that includes a wider range of keywords, databases, and software features can enhance the scope and precision of future research in the field of technology and tools in the hospitality sector.
5.4. Suggestions for Future Research
This study provides a comprehensive review of the current state of research on hospitality technology and tools and their impact on the hotel guest experience. By identifying gaps and trends in the literature, future studies can build upon these findings and develop a deeper understanding of how specific technology tools and strategies can improve the guest experience. Additionally, the study highlights the need for more research on certain areas, such as the impact of technology on sustainability in the hospitality industry. This can serve as a starting point for researchers who wish to address these gaps and expand the field of knowledge in this area.
To improve the accuracy and comprehensiveness of future research in the field of technology and tools in the hospitality sector, it is recommended to expand the range of keywords used in the search process and to explore other academic databases such as WoS. Utilizing the advanced features of the software used in this study, such as the Boolean operator “OR” to include synonyms of keywords, can also help to increase the number of search results. Additionally, it may be beneficial to consider using other bibliometric tools such as CiteSpace and to perform deeper analysis using software like VOSviewer and Gephi, which can provide additional insights into the literature.
Funding
This research was implemented under the action RESEARCH-CREATE-INNOVATE and co-funded by the European Regional Development Fund (ERDF) of the European Union and national resources through the Competitiveness, Entrepreneurship, and Innovation Programme (EPANEK), under project code T2EDK-03945. The funding was administered by the Managing Authority of the Operational Programme “Competitiveness, Entrepreneurship, and Innovation” (MIS 5075101) and the Ministry of Development and Investments of Greece (No. Accession Protocol 5567).
Data Availability Statement
The data presented in this study are not publicly available, but can be obtained upon request from the corresponding author. The main script of the paper is presented in Table 1, which can be used to search for the examined database on Scopus.
Conflicts of Interest
The authors declare no conflict of interest.
References
- Buhalis, D.; Lin, M.S.; Leung, D. Metaverse as a driver for customer experience and value co-creation: Implications for hospitality and tourism management and marketing. Int. J. Contemp. Hosp. Manag. 2022, 35, 701–716. [Google Scholar] [CrossRef]
- Bulchand-Gidumal, J.M.; Sigala, R.; Thelwall, R.M. Big Data and Innovation in Tourism, Travel, and Hospitality. Managerial Approaches, Techniques, and Applications. Z. Tour. 2021, 13, 309–310. [Google Scholar] [CrossRef]
- Gössling, S. Technology, ICT and tourism: From big data to the big picture. J. Sustain. Tour. 2021, 29, 849–858. [Google Scholar] [CrossRef]
- Buhalis, D.; O’Connor, P.; Leung, R. Smart hospitality: From smart cities and smart tourism towards agile business ecosystems in networked destinations. Int. J. Contemp. Hosp. Manag. 2022, 35, 369–393. [Google Scholar] [CrossRef]
- Kim, Y.R.; Liu, A.; Williams, A.M. Competitiveness in the visitor economy: A systematic literature review. Tour. Econ. 2022, 28, 817–842. [Google Scholar] [CrossRef]
- Krabokoukis, T.; Polyzos, S. Drawing an indicator of tourism competitiveness and examining its relationship with tourism seasonality for the Greek prefectures. Reg. Sci. Inq. 2022, 14, 55–70. [Google Scholar]
- Tsiotas, D.; Krabokoukis, T.; Polyzos, S. Detecting Tourism Typologies of Regional Destinations Based on Their Spatio-Temporal and Socioeconomic Performance: A Correlation-Based Complex Network Approach for the Case of Greece. Tour. Hosp. 2021, 2, 113–139. [Google Scholar] [CrossRef]
- Ivanov, S.H.; Webster, C.; Stoilova, E.; Slobodskoy, D. Biosecurity, crisis management, automation technologies and economic performance of travel, tourism and hospitality companies—A conceptual framework. Tour. Econ. 2022, 28, 3–26. [Google Scholar] [CrossRef]
- Günaydın, Y.; Kozak, M. Managing Crisis in the Tourism Industry: How Pessimism Has Changed to Optimism? Tourism 2022, 70, 317–330. [Google Scholar] [CrossRef]
- Kansakar, P.; Munir, A.; Shabani, N. Technology in the Hospitality Industry: Prospects and Challenges. IEEE Consum. Electron. Mag. 2019, 8, 60–65. [Google Scholar] [CrossRef] [Green Version]
- Buhalis, D.; Moldavska, I. Voice assistants in hospitality: Using artificial intelligence for customer service. J. Hosp. Tour. Technol. 2022, 13, 386–403. [Google Scholar] [CrossRef]
- Bornmann, L.; Leydesdorff, L. Scientometrics in a changing research landscape: Bibliometrics has become an in-tegral part of research quality evaluation and has been changing the practice of research. EMBO Rep. 2014, 15, 1228–1232. [Google Scholar] [CrossRef] [Green Version]
- Wang, J. Citation time window choice for research impact evaluation. Scientometrics 2013, 94, 851–872. [Google Scholar] [CrossRef]
- Ali, J.; Jusoh, A.; Idris, N.; Abbas, A.F.; Alsharif, A.H. Nine Years of Mobile Healthcare Research: A Bibliometric Analysis. Int. J. Online Biomed. Eng. (iJOE) 2021, 17, 144–159. [Google Scholar] [CrossRef]
- Alsharif, A.H.; Salleh, N.Z.M.; Baharun, R.; Hashem, E.A.R. Neuromarketing research in the last five years: A bibliometric analysis. Cogent Bus. Manag. 2021, 8, 1978620. [Google Scholar] [CrossRef]
- Pilelienė, L.; Alsharif, A.H.; Alharbi, I.B. Scientometric Analysis of Scientific Literature on Neuromarketing Tools in Advertising. Balt. J. Econ. Stud. 2022, 8, 1–12. [Google Scholar] [CrossRef]
- Leydesdorff, L. How are new citation-based journal indicators adding to the bibliometric toolbox? J. Am. Soc. Inf. Sci. Technol. 2009, 60, 1327–1336. [Google Scholar] [CrossRef] [Green Version]
- Van Eck, N.J.; Waltman, L. Software survey: VOSviewer, a computer program for bibliometric mapping. Scientometrics 2010, 84, 523–538. [Google Scholar] [CrossRef] [Green Version]
- Donthu, N.; Kumar, S.; Mukherjee, D.; Pandey, N.; Lim, W.M. How to conduct a bibliometric analysis: An overview and guidelines. J. Bus. Res. 2021, 133, 285–296. [Google Scholar] [CrossRef]
- Majeed, S.; Uzair, M.; Qamar, U.; Farooq, A. Social Network Analysis Visualization Tools: A Comparative Review. In Proceedings of the IEEE 23rd International Multitopic Conference (INMIC), Bahawalpur, Pakistan, 5–7 November 2020; pp. 1–6. [Google Scholar] [CrossRef]
- Mingers, J.; Leydesdorff, L. A review of theory and practice in scientometrics. Eur. J. Oper. Res. 2015, 246, 1–19. [Google Scholar] [CrossRef] [Green Version]
- Glänzel, W.; Chi, P.-S.; Debackere, K. 3.1 Measuring the Impact. In Handbook Bibliometrics; Ball, R., Ed.; De Gruyter: Berlin, Germany, 2021; pp. 135–148. [Google Scholar] [CrossRef]
- Xiang, Z.; Schwartz, Z.; Gerdes, J.H.; Uysal, M. What can big data and text analytics tell us about hotel guest experience and satisfaction? Int. J. Hosp. Manag. 2015, 44, 120–130. [Google Scholar] [CrossRef]
- So KK, F.; King, C.; Sparks, B. Customer Engagement With Tourism Brands: Scale Development and Validation. J. Hosp. Tour. Res. 2014, 38, 304–329. [Google Scholar] [CrossRef]
- Buhalis, D.; Harwood, T.; Bogicevic, V.; Viglia, G.; Beldona, S.; Hofacker, C. Technological disruptions in services: Lessons from tourism and hospitality. J. Serv. Manag. 2019, 30, 484–506. [Google Scholar] [CrossRef]
- Skogland, I.; Siguaw, J.A. Are Your Satisfied Customers Loyal? Cornell Hotel. Restaur. Adm. Q. 2004, 45, 221–234. [Google Scholar] [CrossRef]
- Walls, A.; Okumus, F.; Wang, Y.; Kwun, D.J.-W. Understanding the Consumer Experience: An Exploratory Study of Luxury Hotels. J. Hosp. Mark. Manag. 2011, 20, 166–197. [Google Scholar] [CrossRef]
- Gilmore, J. Differentiating hospitality operations via experiences: Why selling services is not enough. Cornell Hotel. Restaur. Adm. Q. 2002, 43, 87–96. [Google Scholar] [CrossRef]
- Mody, M.A.; Suess, C.; Lehto, X. The accommodation experiencescape: A comparative assessment of hotels and Airbnb. Int. J. Contemp. Hosp. Manag. 2017, 29, 2377–2404. [Google Scholar] [CrossRef] [Green Version]
- Gao, Y.; Mattila, A.S. Improving consumer satisfaction in green hotels: The roles of perceived warmth, perceived competence, and CSR motive. Int. J. Hosp. Manag. 2014, 42, 20–31. [Google Scholar] [CrossRef]
- Huang, Y.-C.; Backman, S.J.; Backman, K.F.; Moore, D. Exploring user acceptance of 3D virtual worlds in travel and tourism marketing. Tour. Manag. 2013, 36, 490–501. [Google Scholar] [CrossRef]
- Ayuso, S. Adoption of voluntary environmental tools for sustainable tourism: Analysing the experience of Spanish hotels. Corp. Soc. Responsib. Environ. Manag. 2006, 13, 207–220. [Google Scholar] [CrossRef]
- Buhalis, D.; Leung, D.; Lin, M. Metaverse as a disruptive technology revolutionising tourism management and marketing. Tour. Manag. 2023, 97, 104724. [Google Scholar] [CrossRef]
- Lehmann, E.E.; Stockinger, S.A.E. Entrepreneurship in Higher Education: The impact of competition-based policy programmes exemplified by the German Excellence Initiative. High. Educ. Q. 2019, 73, 70–84. [Google Scholar] [CrossRef] [Green Version]
Figure 1.
Temporal distribution of the literature: a comparison of total publication (bars) and citation counts by year for the period 2000–2023 (lines).
Figure 1.
Temporal distribution of the literature: a comparison of total publication (bars) and citation counts by year for the period 2000–2023 (lines).

Figure 2.
Visualization of the co-authorship of countries analysis.

Figure 3.
Visualization of the co-authorship of modularity analysis in Gephi.

Figure 4.
Visualization of the co-occurrence of keywords analysis.

Figure 5.
Stages of guest experience in the hotel industry: before arrival (left), during the stay (center), and after departure (right).
Figure 5.
Stages of guest experience in the hotel industry: before arrival (left), during the stay (center), and after departure (right).

Figure 6.
The architecture of the software.


Table 1.
Data retrieval constraints and parameters for the Scopus database.
| Data | Constraints and Parameters |
|---|---|
| Database | Scopus |
| Search field | Title, abstract, keywords |
| Keywords | “Hospitality technology tools” OR “hotel experience tools” OR “guest experience” OR “digital hotel tools” |
| Open access | All |
| Years | 2000–2023 |
| Author name | Exclude undefined names |
| Subject area | All |
| Publication stage | All |
| Document type | All |
| Source title | All |
| Affiliation | All |
| Funding sponsor | All |
| Country | All |
| Source type | All |
| Language | All |
| Search string | (TITLE-ABS-KEY (hospitality AND technology AND tools)) OR (TITLE-ABS-KEY (digital AND hotel AND tools)) OR (TITLE-ABS-KEY (hotel AND experience AND tools)) OR (TITLE-ABS-KEY (“guest experience”)) AND PUBYEAR > 1999 AND PUBYEAR < 2024 AND (EXCLUDE (PREFNAMEAUID, “Undefined”)) |
| Data extracted | 12 January 2023 |
| Number of publications | 709 |
Table 2.
Distribution of document types in the retrieved sample.
| Document Type | Total Publications | Percentage (%) |
|---|---|---|
| Article | 445 | 62.76 |
| Conference paper | 145 | 20.45 |
| Book chapter | 70 | 9.87 |
| Review | 24 | 3.39 |
| Book | 11 | 1.55 |
| Note | 10 | 1.41 |
| Letter | 2 | 0.28 |
| Editorial | 2 | 0.28 |
| Total | 709 | 100 |
Table 3.
Citations metrics.
| Metrics | Data |
|---|---|
| Publications | 709 |
| Number of citations | 10,051 |
| Years | 12 |
| Citations per year | 837.6 |
| Citations per paper | 59.1 |
| Citations per author | 63.0 |
| Authors per paper | 4.4 |
Table 4.
Distribution of citations.
| Number of Citations | Number of Publications | % Accumulated Articles |
|---|---|---|
| 0 | 199 | 28.07 |
| <52 | 467 | 65.87 |
| <103 | 24 | 3.39 |
| <154 | 9 | 1.27 |
| <205 | 5 | 0.71 |
| <256 | 3 | 0.42 |
| <512 | 2 | 0.28 |
| Total | 709 | 100 |
Table 5.
Top 10 most cited publications.
| No. | Authors | Title | Citations |
|---|---|---|---|
| 1 | [23] | What can big data and text analytics tell us about hotel guest experience and satisfaction? | 510 |
| 2 | [24] | Customer Engagement With Tourism Brands: Scale Development and Validation | 332 |
| 3 | [25] | Technological disruptions in services: lessons from tourism and hospitality | 226 |
| 4 | [26] | Are your satisfied customers loyal? | 210 |
| 5 | [27] | Understanding the consumer experience: An exploratory study of luxury hotels | 205 |
| 6 | [28] | Differentiating hospitality operations via experiences: Why selling services is not enough | 202 |
| 7 | [29] | The accommodation experiences cape: a comparative assessment of hotels and Airbnb | 201 |
| 8 | [30] | Improving consumer satisfaction in green hotels: The roles of perceived warmth, perceived competence, and CSR motive | 185 |
| 9 | [31] | Exploring user acceptance of 3D virtual worlds in travel and tourism marketing | 169 |
| 10 | [32] | Adoption of voluntary environmental tools for sustainable tourism: Analysing the experience of Spanish hotels | 162 |
Table 6.
Top organizations in the co-authorship of organizations analysis.
| No. | Organization | Documents | Citations |
|---|---|---|---|
| 1 | Cardiff Metropolitan University, United Kingdom | 3 | 43 |
| 2 | Rosen College of Hospitality Management, University of Florida, United States of America | 9 | 197 |
| 3 | School of Hotel and Tourism Management, The Hong Kong Polytechnic University, Hong Kong | 4 | 160 |
| 4 | Universidade Europeia, Lisbon, Portugal | 4 | 47 |
Table 7.
Top countries by co-authorship productivity in organizational analysis.
| No. | Country | Documents | Citations | Total Link Strength |
|---|---|---|---|---|
| 1 | United States of America | 177 | 4872 | 55 |
| 2 | United Kingdom | 62 | 1077 | 40 |
| 3 | China | 47 | 458 | 31 |
| 4 | Australia | 36 | 827 | 20 |
| 5 | India | 59 | 544 | 15 |
| 6 | Malaysia | 27 | 167 | 11 |
| 7 | United Arabia Emirates | 10 | 117 | 11 |
| 8 | Hong Kong | 17 | 566 | 9 |
| 9 | New Zealand | 11 | 99 | 9 |
| 10 | Canada | 12 | 283 | 8 |
| 11 | Italy | 22 | 265 | 8 |
| 12 | South Korea | 13 | 201 | 8 |
| 13 | France | 12 | 229 | 8 |
| 14 | Greece | 20 | 89 | 5 |
| 15 | Spain | 39 | 635 | 5 |
| 16 | Thailand | 13 | 60 | 5 |
| 17 | Turkey | 15 | 309 | 4 |
| 18 | Taiwan | 14 | 207 | 43 |
| 19 | Portugal | 31 | 239 | 2 |
| 20 | Russian Federation | 22 | 175 | 2 |
| 21 | Germany | 10 | 73 | 1 |
Table 8.
Top keywords in the co-authorship of organizations analysis.
| No. | Keyword | Occurrences | Total Link Strength |
|---|---|---|---|
| 1 | Hospitality | 46 | 55 |
| 2 | Guest experience | 33 | 25 |
| 3 | Hotels | 29 | 22 |
| 4 | Customer satisfaction | 24 | 26 |
| 5 | COVID-19 | 22 | 20 |
| 6 | Social media | 21 | 23 |
| 7 | Hotel industry | 21 | 18 |
| 8 | Airbnb | 20 | 16 |
| 9 | Technology | 19 | 30 |
| 10 | Hospitality industry | 19 | 15 |
| 11 | Hotel | 17 | 23 |
| 12 | Service quality | 16 | 16 |
| 13 | Customer experience | 15 | 15 |
| 14 | Satisfaction | 15 | 10 |
| 15 | Sharing economy | 13 | 13 |
Disclaimer/Publisher’s Note: The statements, opinions and data contained in all publications are solely those of the individual author(s) and contributor(s) and not of MDPI and/or the editor(s). MDPI and/or the editor(s) disclaim responsibility for any injury to people or property resulting from any ideas, methods, instructions or products referred to in the content. |
© 2023 by the author. Licensee MDPI, Basel, Switzerland. This article is an open access article distributed under the terms and conditions of the Creative Commons Attribution (CC BY) license (https://creativecommons.org/licenses/by/4.0/).
Share and Cite
MDPI and ACS Style
Krabokoukis, T. Technology Tools in Hospitality: Mapping the Landscape through Bibliometric Analysis and Presentation of a New Software Solution. Digital 2023, 3, 81-96. https://doi.org/10.3390/digital3010006
AMA Style
Krabokoukis T. Technology Tools in Hospitality: Mapping the Landscape through Bibliometric Analysis and Presentation of a New Software Solution. Digital. 2023; 3(1):81-96. https://doi.org/10.3390/digital3010006
Chicago/Turabian StyleKrabokoukis, Thomas. 2023. "Technology Tools in Hospitality: Mapping the Landscape through Bibliometric Analysis and Presentation of a New Software Solution" Digital 3, no. 1: 81-96. https://doi.org/10.3390/digital3010006