Checking Consistency and Comparing Multi-Criteria Decision Making Methods in the Evaluation of Museums’ Websites


1
Department of Environment, Ionian University, 29100 Zakynthos, Greece
2
School of Science and Technology, Hellenic Open University, 26335 Patras, Greece
*
Author to whom correspondence should be addressed.
Digital 2022, 2(4), 484-500; https://doi.org/10.3390/digital2040026
Submission received: 16 September 2022
/
Revised: 13 October 2022
/
Accepted: 19 October 2022
/
Published: 24 October 2022
Abstract
:The need to evaluate museum websites is an issue that has been highlighted by several researchers. In this paper, we focus on museums’ website evaluation and use as a case study the evaluation of natural history museums’ websites. For this evaluation experiment, MCDM methods are combined and compared. The focus of this paper is twofold: (1) checking the consistency of AHP for calculating the weights of criteria and (2) comparing Fuzzy TOPSIS and Fuzzy VIKOR with each other and with a usability evaluation questionnaire.
1. Introduction
The need to evaluate museum websites is an issue that has been highlighted by several researchers [1,2,3,4,5]. This evaluation is important because a museum achieves its goals through its online presence. Thus, the correct design of the museum website is important and is an issue to be evaluated.
However, the implementation of an evaluation experiment is not an easy task. Many usability evaluation questionnaires have been designed in order to test usability of a product and/or software [6,7,8,9,10]. One of the most widely used is the SUS questionnaire. The specific questionnaire has only ten questions that are rated on a five-point scale ranging from strongly disagree to strongly agree. The structure of the questionnaire makes it easy to answer. Moreover, it has been found that for a very small number of users answering the questionnaire, one can achieve reliable results [11]. In addition, the SUS questionnaire has been widely used at a professional level and referenced in over 2000 scientific publications, making it one of the most effective usability assessment tools regarding the validity and the reliability of the produced results. This is the main reason for using SUS questionnaire.
The evaluation of a website is a task that takes into account several criteria. For this purpose, in the past different Multi Criteria Decision Making (MCDM) theories have been applied for evaluating websites of different content [2,3,4,12,13,14]. Among these experiments are some that involve museums’ website evaluation [2,3,4]. In this paper we focus on museums’ website evaluation and use as a case study the evaluation of natural museums’ websites. For this evaluation experiment, MCDM methods are combined and compared.
After having defined the criteria for evaluating natural museums’ websites, we present how Analytic Hierarchy Process (AHP) [15] is used for calculating the weights of importance of these criteria. Further, AHP is combined in turn with Fuzzy TOPSIS (Technique for Order of Preference by Similarity to Ideal Solution) [16] and Fuzzy VIKOR (VlsekriterijumskaOptimizacija I KOmpromisnoResenje) [17,18]. Fuzzy MCDM theories are used because the results of the evaluation are given in linguistic terms and those theories are considered more appropriate to model their reasoning.
AHP’s rationale is based on pairwise comparisons. Both the criteria and the alternatives are compared pairwise. The validity and consistency of the pairwise comparisons can be confirmed through a consistency test [19]. The consistency test is of great importance since the quality of the results strictly depends on the consistency of pairwise comparison matrices. In case of absence of a consistency test, wrong, poor, or misleading results may be obtained [20]. For this purpose, after the implementation the AHP, a consistency test is implemented.
After checking and confirming the consistency of AHP for weights’ calculation, two other theories are used for ranking the alternatives. This is due to the fact that AHP is based on pairwise comparisons and, therefore, if the alternatives being evaluated are many then pairwise comparisons are time consuming and difficult to implement. As a result, other MCDM theories with different rationales have been exploited and in particular, Fuzzy VIKOR and Fuzzy TOPSIS have been selected. These two theories are compared and their effectiveness is compared to the System Usability Scale (SUS) questionnaire [6].
The focus of this paper is twofold: (1) checking the consistency of AHP for calculating the weights of criteria and (2) comparing Fuzzy TOPSIS and Fuzzy VIKOR, not only with each other but mainly with a usability evaluation questionnaire. The main aim is to check the efficiency and correctness of the MCDM methods by checking their consistency and checking them with other methods that are considered successful in website evaluation.
2. Dimensions and Criteria
The criteria used for the evaluation of the websites of natural history museums have been selected from a review on inspection evaluation experiments as proposed by Kabassi [2] and the study of Sylaiou et al. [21]. Ref. [2] offers a state of the art review of the evaluation experiments on museums’ websites and conclusions on the criteria used. Sylaiou et al. [21], on the other hand, focus their work on Virtual Museums. Their study does not focus on natural history museums’ websites but on museums in general. However, there is no study focusing specifically on natural history museums’ websites and, therefore, other related studies on museums’ websites have been selected as relevant here. In particular, Ref. [2] has a detailed list of all the different criteria that have been used in the studies of museums’ websites in general and are included in one or more of the reviewed papers. Most of the criteria have been acquired by [2] and criteria related to VR interaction have been acquired by [21].
As a result, the final set of criteria has been formed taking into account the criteriathat seem to be more appropriate for the particular evaluation. The three evaluation dimensions of the proposed framework are:
- Usability,
- Functionality,
- VR interaction.
The first two criteria have been drawn from the study [19] while the third dimension has been drawn from the study [21]. Each one of the above factors is further differentiated into more specific characteristics (sub criteria), the existence or not of which helps to determine the quality of a website.
The dimension of “Usability” is further analyzed through the following ten quality characteristics: Consistency—uc1 (checks if the website displays uniformity between its different elements); Accessibility—uc2 (measures how easily the website can be accessed by people with disabilities); Currency/Text comprehension—uc3 (checks if the content of the website is up to date and the text presented on it is easy to understand); Quality content—uc4 (checks if the website contains information about the museum and its exhibits, e.g., images of the exhibits, working hours, ticket prices, physical address, historical information about the museum, museum’s e-mail, etc.); User interface, overall presentation/design—uc5 (checks whether the design of the website is beautiful and attractive); Structure/navigation—uc6 (checks whether the website has an easily understood structure, menu and navigation system); Interactivity and feedback—uc7 (checks whether the website has synchronous and asynchronous communication services, e.g., links to social networks, chat and video conferencing services, e-mail services, newsletter alerts, online help etc.); Multimedia usability—uc8 (refers to the correct use of multimedia in the website in a way that enhances the user experience and enriches the user knowledge about the exhibits); Learnability—uc9 (refers to how quickly the user can learn to use the website); and Efficiency—uc10 (checks whether actions within the website like the subscription through a form, booking and paying for tickets online, etc., can be performed quickly and successfully).
The dimension of “Functionality” depends on seven criteria. Multilingualism—fc1 (checks whether the website has the ability to display its content into more than one language); Multimedia features—fc2 (refers to whether the website uses different types of multimedia to convey the information on it); Services and mechanisms—fc3 (refers to whether the website offers the possibility of use by the web user of other web services and applications such as online ticket purchasing, online museum shop, e-lectures services, etc.); Web communities—fc4 (checks if the website enhances the creation and maintenance of online user communities); Reliability—fc5 (checks whether the website provides the online services which it claims to offers, with reliability and accuracy); Adaptability—fc6 (refers to the ability of the website to adapt the structure, the content or the presentation of the website information in response to the users interaction with it); Technical issues—fc7 (checks if the website is easily accessible at any time of the day on any day via any operating system and any web browser; it also checks if the website uses unusual types of files).
The criteria evaluated within the context of “VR interaction” are: Imageability in panoramic images—VRc1 (checks if the museum website uses panoramic images in order to simulate the real-world museum space, through panoramic images that can be manipulated thanks to a set of interacting tools such as rotate and pan, zoom in and out, allowing users to experience and interactively navigate the simulated museum space); Interacting with scalable images and texts—VRc2 (refers to whether the website provides high resolution images of the museum artifacts, providing the opportunity to examine museum artefacts in detail by applying zoom tools over the high-resolution images); Virtual spatiality—VRc3 (checks if the website provides a 3D interactive representation of the museum environment and its exhibits, such that the user, through an avatar, will be able to navigate freely in the simulated museum space and interact with the information associated to the 3D representations of museum exhibits); Narration—VRc4 (corresponds to whether the website contains narrative embedded videos through which the storytelling is inserted into the user’s experience to offer a personal view and story engagement).
3. Alternative Museum Websites
The museums’ websites that have been selected to be evaluated and compared in the current experiment derive from research that was launched on November 2021. The first step of this research was the creation of a list of museums’ websites by searching on: (a) the International Committee for Museums and Collections of Natural History (NATHIST), (b) the Natural Heritage Search portal and (c) Wikipedia. This research resulted in finding more than 400 museums. Therefore, a filtering process had to be imposed in order to create a subset of museums.
First of all, the museums with an active link to an official webpage were detected, eliminating those websites that were out of function/service. In this way, the initial number of museums was reduced to 135. Considering the fact that museums have traditionally been among the most popular tourist attractions, an additional search for the most popular natural history museums was undertaken. For this purpose, the list of the most popular natural history museums as displayed in various travel platforms and guides such as Tripadvisor, Matador Network, Fodor’s Travel, Triponzy as well as the WorldAtlas website, was taken into consideration. Furthermore, the list of the most visited natural history museums, as displayed on the website of Wikipedia, was also taken into account. The support of English language by a website was the final filtering criterion in order to further reduce the dataset of 135 museums. After this additional filtering process, the number of the museums was restricted to 33.
In the design stage of the experiment, empirical methods were decided upon in order to evaluate use of the selected museums’ webpages by real users. In order to avoid any discomfort to the evaluation group that could cause a non-substantial participation or even the refusal of the user to participate at all, it was deemed necessary to reduce even more the dataset. Taking into account the popularity of the selected museums from a touristic viewpoint, the number of the museums’ annual visitors’ traffic, and the support of English language, the first three museums out of the 33 as derived in the previous step of the research, were selected. Ιn this evaluation set, it was considered that one of the most popular Greek natural history museums should be included as well, so as to examine the quality of its website, in relation to the other 3 world-renowned ones.
Thus, the final dataset of museum websites selected for this study is presented in Table 1, as follows:
4. Calculating the Weights of Criteria
4.1. AHP for Estimating the Weights of the Criteria
The dimensions of evaluation, along with their further distinguishing criteria, are not equally important while evaluating a a museum’s website. For this purpose, the AHP method is used for calculating the values of the weights of the dimensions and the criteria. Specifically, the first two basic steps of AHP implementation were applied [22], which involve: (1) development of the goal hierarchy and (2) formation of the pair-wise comparison matrices of the criteria.
AHP is considered one of the most popular MCDM methods and its selection among others was made because this method presents a formal way of quantifying the qualitative evaluation criteria of the examined websites [23]. In addition, the ability of this method to make decisions by comparing pairs of uncertain qualitative and quantitative factors and also its ability to model expert opinion [24], are two more reasons that favored the selection of AHP method. The basic steps for the implementation of AHP in an inspection method are:
Step 1. Develop the goal hierarchy: In this step, the AHP MCDM method is implemented similarly to many others website evaluations of different domains [3,25,26,27].
1.a: Setting the goal: Evaluation of the natural history museums’ websites.
1.b: Forming the set of criteria: The set of criteria has been formed taking into account the evaluation experiments done by [2,21], which involved museum websites’ evaluation (Section 2).
1.c: Forming the set of alternatives: Theset of alternatives involvesnatural history museum websites, which were presented in Section 3.
1.d: Forming the hierarchical structure: In this step, the hierarchical structure is formed so that criteria could be combined in pairs (Figure 1).
Step 2. Selecting the evaluators: The group of evaluators consisted of human experts. The human expert evaluation group that is proposed should include experts from both the domain of computer science and the scientific field covered by natural history museums (Botany, Zoology, Biology, Geology, Paleontology, Ecology, Biotechnology and Biochemistry). The choice of this double expert evaluation group is made in order to overcome the problem of subjectivity of the results that the inspection evaluation method introduces [23]. In this way, the reliability of the results should increase. Thus, a group of evaluators was formed which included 1 software engineer, 2 web designers, 1 biologist, 1 chemical engineer–biochemist, and 1 museum employee, with both the biologist and the chemical engineer–biochemist, having previous experience in software engineering. Both software engineer and web designers had experience in web accessibility.
Step 3. Setting up a pairwise comparison matrix of criteria: In this step, a comparison matrix is formed in order to pair-wise compare the criteria of the same level in the hierarchical structure that was created during the application of the AHP (Figure 1). More specifically, each one of the six experts was first asked to answer four questionnaires. Each completed questionnaire corresponded to a pair-wise comparison of the criteria belonging to the same dimension. This process resulted in twenty-four pair-wise comparison matrices, i.e., six matrices for the pair wise comparison of the evaluation dimensions, six matrices for the pair wise comparison of the sub-criteria of Usability, another six for sub-criteria of Functionality and another six for the VR interaction. Each one of the comparison matrices that was formed was completed with a value varied from 1/9 to 9 (P = {1, 2, 3, 4, 5, 6, 7, 8, 9, 1/2, 1/3, 1/4, 1/5, 1/6, 1/7, 1/8, 1/9}), as Saaty [15,28] proposed.
After this process, the final matrices of pair-wise comparisons between the evaluation dimensions and their respective sub-criteria were formed. Since the procedure is effectively a means of group decision making, each cell of the final matrices is calculated by the geometric mean of the corresponding values for each corresponding matrix’s cell. This procedure resulted in four aggregated comparison matrices (Table 2, Table 3, Table 4 and Table 5).
After making pairwise comparisons, estimations were made using an open-source decision making software that implements the AHP method that is called ‘Priority Estimation Tool’ (PriEst). The results are presented in Figure 2.
4.2. Consistency of the Obtained Degree of Importance for the Dimensions and the Criteria
In order confirm the consistency of the results, a consistency test is implemented on the application of AHP.
Let C signify an n-dimensional column vector relating to the sum of weighted values for the importance degrees of the criteria:
where
The consistency values for the criteria can be specified by the vector , with a representative element computed as follows:
Saaty [28] recommended application of maximal eigenvalue λmaxto assess the validity of measurements as follows:
λmax is further used for calculating a consistency index (CI):
The closer the maximal eigenvalue λmaxis to n, the more consistent is the assessment. Further, a consistency ratio (CR) is calculated to check the conformity:
RI represents the average random index with the value that is estimated using different orders of the pairwise matrices of comparison. The values of RI in our experiment are given in Table 6.
The critical value for the CR is 0.1. Higher values may reveal inconsistency of the comparison matrix and the procedure may be repeated.
The two terms of the Consistency Index (CI) and the Consistency Ratio (CR) that developed related to consistency, were calculated for each one of the four aggregated pair wised comparison matrices (Table 2, Table 3, Table 4 and Table 5), revealing a value below 0.1 for each one of the four pair-wise comparison matrices. More specifically, the CR value for the matrix of the evaluation dimensions was , the CR value for the matrix of the sub criteria of usability was , the CR value for the matrix of the sub criteria of functionality was and finally the CR value for the matrix of the sub criteria of VR interaction was . With a for each one of the four pair-wise comparison matrices we assume that the expert group evaluation as well as the whole AHP developed hierarchy is consistent, so we may use the calculated importance weights of the criteria in further calculations.
5. Fuzzy VIKOR vs. Fuzzy TOPSIS
In the second stage of the evaluation experiment, we decided to implement empirical evaluation methods. For this purpose, we created a Likert scale questionnaire in which each one of the included questions corresponded to each one of the respective sub-criteria of the evaluation dimensions. The questionnaire that was created consisted of two sections. The first section provided some general information about the purpose of the questionnaire, instructions for completing it and presented the twenty-one questions that the user was asked to obligingly answer, for each one of the four museum websites that were evaluated. The second section of the questionnaire consisted of six demographic interest questions, to which the answer was optional. The questionnaire was created using GoogleForms and it was provided to the users electronically through e-mails and social media. The data collection process lasted for 51 days. During this period, we managed to collect a sample of 72 answers from real users of different age, gender and cognitive background. When the data collection process was completed, we decided to use the fuzzy VIKOR MCDM method in order to process the data and finally rank the museum’s websites.
The VIKOR method is a compromised ranking MCDM method introduced by Opricovic [17], in order to solve MCDM problems with conflicting and non-commensurable criteria [29]. This MCDM technique has a simple computation procedure that allows simultaneous consideration of the closeness to ideal and the anti-ideal alternatives [30].
In order to deal with the situation of imprecise or subjective data of our natural language expression of thoughts and judgement that the evaluation questionnaire may introduce, fuzzy logic theory [31] was adopted. As is usual for most MCDM techniques, the VIKOR method was extended to accommodate subjectivity and imprecise data under a fuzzy environment [18]. A number of applications from various disciplines have been carried out using the fuzzy VIKOR method [17,24,30,32,33,34,35,36]. In order to implement the fuzzy VIKOR method in the second stage of our evaluation experiment, the following steps were taken:
Step 1. Form a new group of decision makers: Based on the study of [5], through which an attempt is made to understand the taxonomy of museum websites users, a new group of evaluators is formed including not only expert users but other categories of users as well. More specifically the new group of evaluators involved user groups coming from the general public, students at undergraduate and postgraduate level, academics/teachers and museum staff.
Step 2. Conversion of the evaluation criteria into linguistic terms: The term linguistic variable refers to a variable whose values are words or sentences in a natural or artificial language. We applied triangular fuzzy number in order to assign values to the criteria that corresponded to the questions of the questionnaire. A triangular fuzzy number is a special class of fuzzy number that is defined by three real numbers, expressed as . is the most possible value of fuzzy number A and and are the lower and upper bounds, respectively, which are often used to illustrate the fuzziness of the data evaluated [37]. We used the triangular fuzzy numbers presented in Table 7 [38]:
Step 3. Construction of the aggregated fuzzy decision matrix: The aggregated fuzzy decision matrix is constructed by polling the decision makers’ opinions to get aggregated fuzzy rating of alternatives. Let k be the number of decision makers in a group. The aggregated fuzzy rating of alternatives with respect to each criterion can be calculated as:
The value of aggregated ratings is expressed in matrix format as follows:
where i is the notation for the alternatives and j is the notation for the criteria, respectively.
Step 4. Defuzzify the aggregated decision matrix: The aggregated fuzzy decision matrix that was created in step 3, is defuzzified into crisp values using the relation BNPi (Best Non-fuzzy Performance) based on the COA defuzzification method.
Step 5. Determine the best crisp value and worst crisp value for all criterion ratings(j = 1, 2, …, n), by using the relations (for benefit criteria):
Step 6. Compute the value Si using the relation:
Step 7. Compute the value Ri using the relation:
Step 8. Compute the values , , and using the relations, respectively:
Step 9. Compute the value , using the relation:
Step 10. Rank the alternatives by sorting each S, R and Q value in descending order: The alternatives are sorted using the values of S, R and Q in descending order. The final ranking of the evaluated museums’ websites is presented in Table 8.
The results using the fuzzy VIKOR results are compared with the results of the evaluation using the TOPSIS method. The TOPSIS technique was proposed by Hwang and Yoon [16] but extended to fuzzy TOPSIS by Deng et al. [39]. The choice of these particular MCDM methods was made due to the fact that both fuzzy VIKOR and fuzzy TOPSIS conclude at a crisp value in their ranking.
The first three steps for the implementation of the fuzzy TOPSIS technique in the evaluation experiment are common with the three first steps related to the implementation of the fuzzy VIKOR method. Thus, the implementation of the fuzzy TOPSIS method presupposes that the weights of the criteria have been estimated through AHP, and includes the following steps:
Step 1. Compute the normalized aggregated fuzzy decision matrix: Τhe aggregated fuzzy decision matrix that was created by polling the decisionmakers’ opinions is normalized using the linear scale transformation formula that Chen [40] proposes. The normalization of a fuzzy number for each cell of the aggregated fuzzy decision is given by the formula (benefit criteria):
Step 2. Compute the weighted normalized fuzzy decision matrix: Taking into account the fact that the importance of each evaluation criterion is different and is expressed through their weights of importance as calculated through the AHP process, the weighted normalized fuzzy numbers are calculated using the formula:
These values are used to construct the weighted normalized fuzzy decision matrix of the following format:
Step 3. Compute the Fuzzy Positive Ideal Solution (FPIS) and the Fuzzy Negative Ideal Solution (FNIS):
and
Step 4. Estimation of the distance of each alternative to the FPIS () and to the FNIS (): The two distances and of each alternative iis calculated using the Euclidean distance:
Step 5. Estimation of the closeness coefficient of each alternative:
The closeness coefficient is used for determining the ranking order of all the alternatives. The value of the closeness coefficient for each alternative in the example and the final ranking of the websites are presented in Table 9.
Note that in TOPSIS unlike VIKOR, the bigger the value of the relative closeness coefficient, the better the alternative.
6. System Usability Scale Questionnaire
In this section, a comprehensive evaluation related to usability of the four examined museum websites is implemented using the SUS questionnaire [6]. During the data collection phase in the second stage of the evaluation experiment, the SUS questionnaire was electronically distributed to real museum websites users, simultaneously with the questionnaire that we created and we described above. The sample that we finally manage to collect after 51 days, was 62 answers and the final SUS score for each one of the examined natural history museums’ websites was derived by the mean SUS score of each one of the 62 participants.
If the SUS score is above 68 then it is considered above average and if it is below 68 then it is considered below average. Despite the fact that the SUS score is not a percentage value, the value that is obtained is in the range between [0–100].
The mean SUS score value and the final ranking for each evaluated natural history museum website is presented in Table 10.
7. Comparing MCDM and SUS
In this section, in order to compare the three produced rankings by the two fuzzy MCDM methods (fuzzy VIKOR—fuzzy TOPSIS) and the System Usability Scale questionnaire, we calculated the Pearson correlation coefficient for making a pair-wise comparison of the values produced by the three methods and the Spearman’s ranking correlation coefficient for making a pair-wise comparison of the rankings of the alternative websites. The Pearson correlation coefficient is estimated by the following formula:
where n is sample size, , are the individual sample points indexed with i and , the sample mean and analogously for .
The formula for the calculation of Spearman’s rank correlation coefficient is:
where n is the number of data points of the two variables and is the difference in ranks of the i element.
Both Pearson and Spearman Coefficient, can take a value between +1 to −1, where
- A value of +1 means a perfect positive association
- A value of 0 means no association of values
- A value of −1 means a perfect negative association
The values and the ranking order of the natural history museums which arise by implementing the above formulas for the results of the three applied methods (Table 8, Table 9 and Table 10), are presented in Table 11.
Both values of the Pearson and Spearman’s rho correlation coefficient revealed a high correlation of fuzzy VIKOR and fuzzy TOPSIS. A high correlation is also found by the comparison of SUS questionnaire and fuzzy VIKOR method. Finally, a perfect positive association of values and rank was observed between the SUS questionnaire and fuzzy TOPSIS MCDM method.
This is not the first time that fuzzy VIKOR method has been compared with fuzzy TOPSIS [41]. However, in this earlier study, a general remark is made and a specific statistical dependence between the results (values or rank) is not examined. As far as the comparison of the SUS questionnaire with any MCDM method is concerned, we have not located any particular comparison study in the literature.
In this section, the Pearson and the Spearman correlation coefficient were used, in order to compare the values calculated for each alternative website and the ranking order derived from those values, using each one of the three methods (fuzzy VIKOR, fuzzy TOPSIS and SUS). The Pearson correlation coefficient was used to make a pair-wise comparison between the values produced by the three methods for each natural history museum website (Qi, CCi and SUS mean score). Spearman’s ranking correlation coefficient was used to make a pair-wise comparison between the final ranking order of the alternative websites, which was derived from the values calculated using the three methods.
A correlation coefficient is used in statistics to describe a pattern or relationship between two variables and it measures the strength of the relationship between them. Given a pair of random variables (x, y), the formula for the Pearson correlation coefficient is (“Pearson Correlation Coefficient r”, 2018):
where n is samplesize, , are the individual sample points indexed with i., the sample mean; and analogously for .
The Spearman’s correlation coefficient between a sample of ranked variables is computed as (Glen, 2022):
Both Pearson and Spearman Coefficients range from −1.0 to +1.0, where:
- A value of +1.00 indicates two variables that move in a similar direction.
- A value of 0.00 means that there is no linear relationship between them.
- A value of −1.00 means a perfect negative association
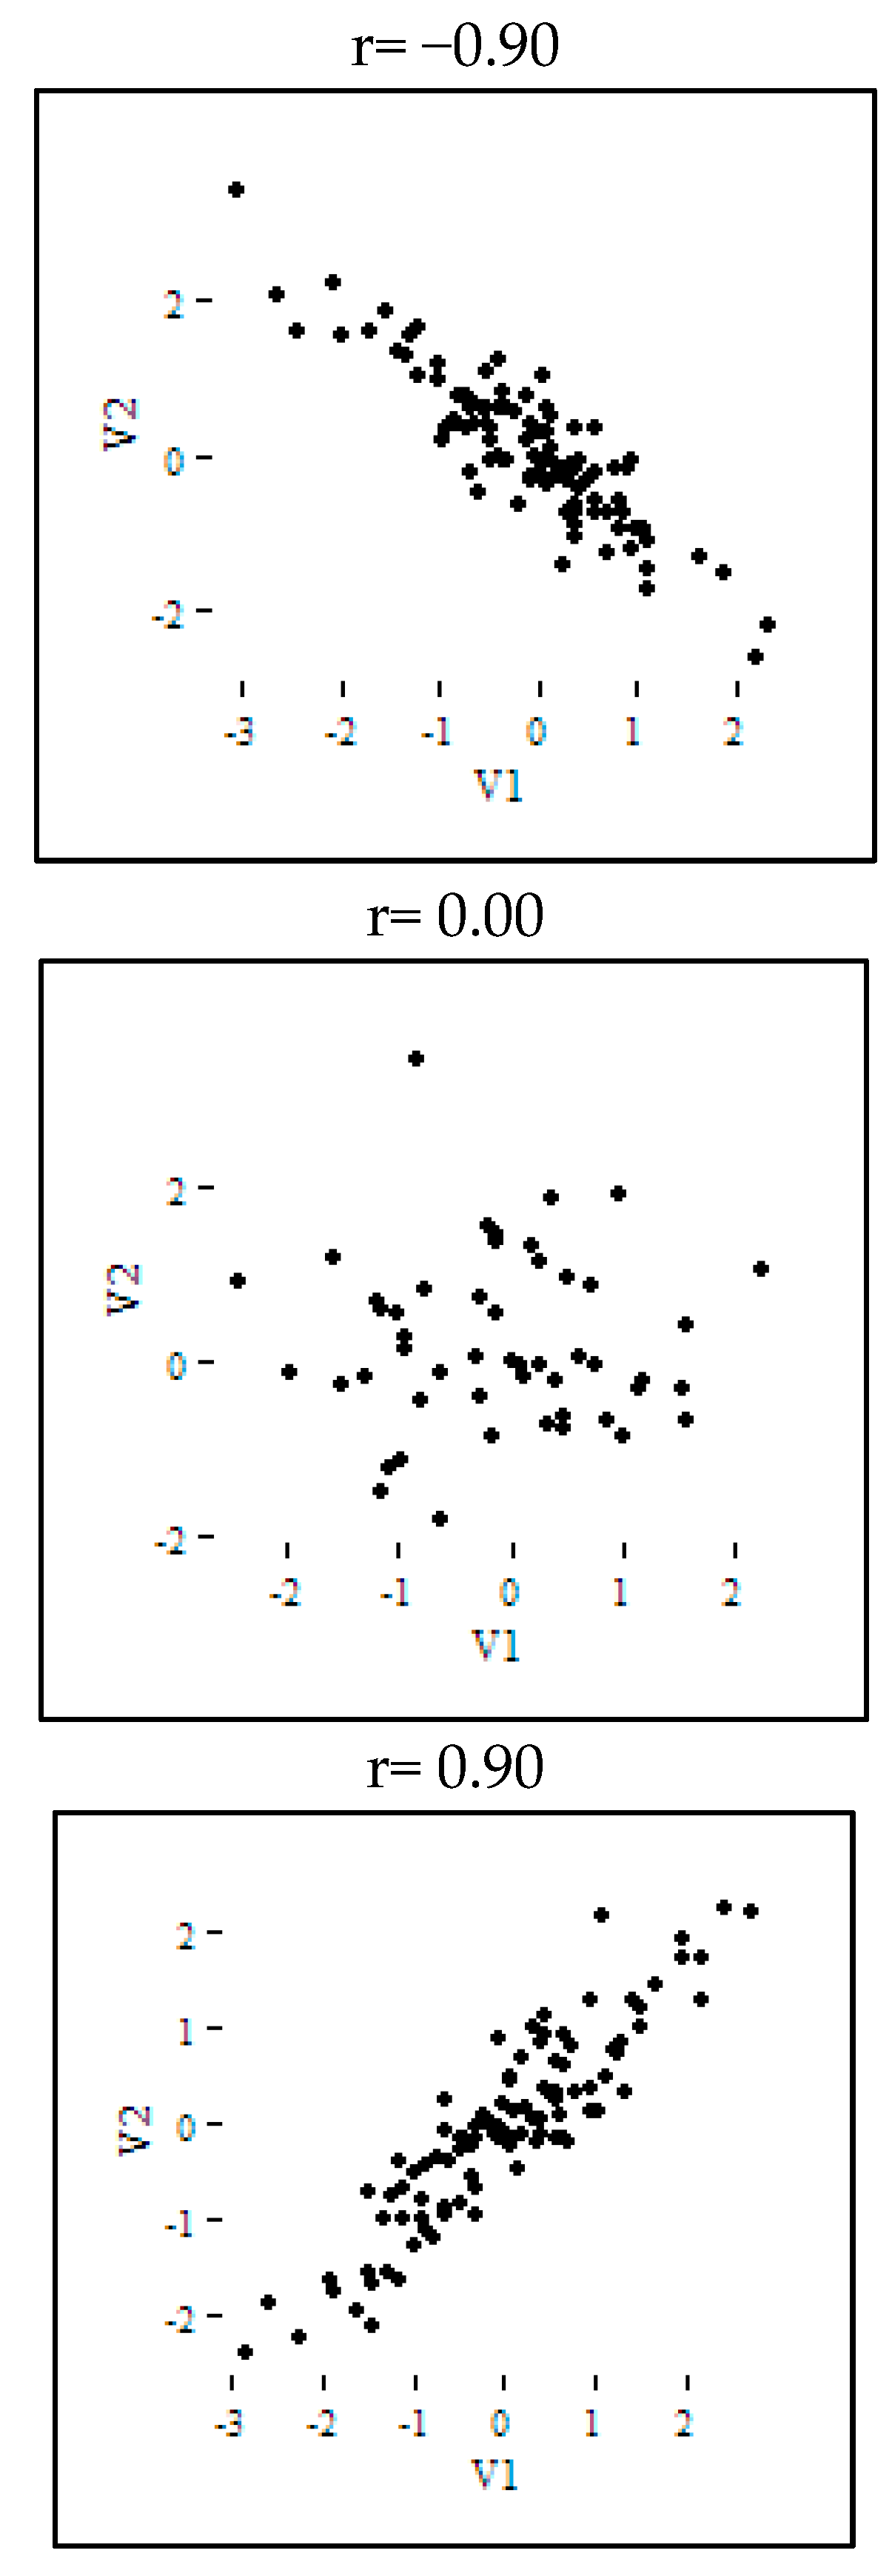
The direction and strength of a correlation are two distinct properties. The scatterplots below (Figure 3) show correlations that are r = +0.90, r = 0.00, and r = −0.90, respectively. The figure shows that only the direction of the correlations is different in the case of positive and negative correlation.
By taking into account the values, as well as the ranking order, which arise by the three applied methods (Table 9, Table 10 and Table 11), the Pearson and the Spearman rho are estimated and presented in Table 12.
Both values of the Pearson and Spearman’s rho correlation coefficient revealed a high correlation of fuzzy VIKOR and fuzzy TOPSIS. A high correlation is also found by the comparison of SUS questionnaire and fuzzy VIKOR method. Finally, a perfect positive association of values and rank was found between the SUS questionnaire and the fuzzy TOPSIS MCDM method. The negative value of the Pearson correlation coefficient is due to the fact that according to the Fuzzy VIKOR MCDM theory, the alternative with the smallest value of Qi is the optimal, thus creating an inversely proportional correlation relationship with the Fuzzy TOPSIS.
8. Conclusions
Generally, the evaluation of a website is a laborious and complex process, as it is based on the examination of several different factors. For this purpose, different methods have been examined by different researchers. Ref. [1] examined direct observation, log analysis, online questionnaires, and inspection methods for museum websites. Ref. [42] used design patterns for evaluation museum websites. However, these methods regard the different dimensions that are evaluated as equally important. This is the main reason why the proposed method in this paper is better as it takes into account many different dimensions and criteria during the evaluation process and considers them as having different weights of importance.
The evaluation framework that is presented in this paper was designed particularly for the evaluation of natural history museum websites. Due to the fact that the evaluation of a museum website is based on the examination of several different factors, the methodological evaluation framework that was designed proposes a combination of website evaluation methods and decision making theories. The proposed evaluation framework was applied for the first time for the evaluation of four natural history museum websites.
The combination of the different methods was carried out through an evaluation experiment which was developed in two stages. Specifically, in the first stage of the experiment, AHP is applied using inspection evaluation methods in order to determine the relative importance of criteria affecting natural history museum’s websites quality. The ability of the method to make decisions by pair-wise comparison of uncertain qualitative and quantitative factors and to model the opinion of experts and the fact that it is considered one of the most important among MCDM methods were the main reasons why it was chosen for the first stage of the evaluation experiment. The three main quality evaluation factors for the examined museum websites were their usability, their functionality and their VR interaction. Each main evaluation factor was further analyzed in several sub-criteria, thus forming a hierarchical structure. With respect to the final weights that were derived after the application of AHP in the first stage of the evaluation experiment (Figure 2), among the quality factors of natural history museum websites, usability was ranked the highest (Uc = 0.541), followed by functionality (Fc = 0.322) and VR interaction (VRc = 0.137). Among the sub-criteria of the main evaluation factors, user interface/overall presentation was considered the most important (Uc5 = 0.201) regarding usability, multilingualism was considered the most important (Fc1 = 0.236) regarding functionality, and finally virtual spatiality was considered the most important (VRc = 0.377) regarding VR interaction. When the relative importance of each criterion was calculated, a consistency test was carried out. The reason for this was to ensure that the expert group evaluation as well as the whole AHP-developed hierarchy is consistent, such that the estimated importance criteria weights can be used in further calculations. Indeed with a CR value bellow the critical rate of 0.1 for each one of the four pair-wise comparison matrices of the criteria, we can confirm the consistency of the developed hierarchy.
In the second stage of the evaluation experiment two fuzzy MCDM methods were applied by implementing empirical evaluation methods. More precisely an evaluation questionnaire was created, which then was distributed electronically to real potential natural history museum website users. The data finally collected from a sample of 72 users were processed and analyzed by applying the fuzzy VIKOR and fuzzy TOPSIS MCDM methods, in order to determine the best alternative. The reason we decided to implement fuzzy MCDM methods was in order to deal with the vagueness and uncertainty that the human factor introduces through the responses of the users in the evaluation questionnaire. Furthermore, the choice of applying two different fuzzy MCDM methods was made in order to compare their results. This is because, in the past, MCDM models have been criticized for producing different results [4]. The choice of the fuzzy VIKOR MCDM method for the processing of the data was made because fuzzy VIKOR introduces a simple computation procedure to highlight the best alternative through the simultaneous consideration of the closeness to the ideal—optimal and the worst alternative. In addition, the choice of the fuzzy TOPSIS method as the second MCDM method for implementation was made because of the similarity that the two methods present in the determination of the best alternative. Both methods conclude in a ranking of the alternatives, taking into account the distance from an optimal best and a worst solution. A major drawback of fuzzy VIKOR as well as fuzzy TOPSIS is that they do not provide a specific way for calculating the weights of criteria as AHP does. This is one more reason why we chose to implement the AHP method in the first stage of our experiment. In order to further compare the results of the two fuzzy MCDM methods with a widely adopted evaluation method, an extra evaluation of the four natural history museums was applied using the SUS questionnaire.
Each one of the methods used for the evaluation of the museum websites has some advantages and some disadvantages. The pros and cons of each method are summarized in Table 12. The results that the three different methods (fuzzy VIKOR, fuzzy TOPSIS and SUS questionnaire) produced were subjected to a pair-wise comparative analysis, by examining the statistical dependence of their values and their rankings. For this reason the Pearson correlation coefficient between the values of Qi, CCi and mean SUS score, as well as the Spearman’s correlation coefficient between the rankings of the three methods, were calculated. The comparative analysis revealed a high correlation of fuzzy VIKOR and fuzzy TOPSIS (, ), a high correlation of fuzzy VIKOR and SUS (, ) and a perfect positive correlation of fuzzy TOPSIS and SUS (, ). In this way, the reliability of our proposed evaluation framework has been confirmed.
The evaluation experiment that was conducted in this paper was designed for the evaluation of natural history museum websites specifically. However, the implementation steps that were described above could also be followed by other researchers in order to evaluate the quality of websites of museums in other areas of science or culture. This could be implemented using exactly the same set of dimensions and criteria, without changing anything. The evaluation framework could also be used for evaluating the quality of websites in other domains but in such a case the set of dimensions and criteria should be reconsidered. The new set of criteria could be formed by adapting the set of the quality evaluation factors proposed in this study or by choosing a completely new one. Therefore, it is among our future plans to implement the proposed framework in websites of different domains to check its usability, effectiveness and reliability.
Author Contributions
Conceptualization, K.K. and A.B.; methodology, K.K. and A.B.; validation, S.B.; formal analysis, K.K., S.B. and A.B.; investigation, S.B.; data curation, S.B.; writing—original draft preparation, S.B.; writing—review and editing, K.K. and A.B.; project administration, K.K. All authors have read and agreed to the published version of the manuscript.
Funding
This research received no external funding.
Informed Consent Statement
Informed consent was obtained from all subjects involved in the study.
Conflicts of Interest
The authors declare no conflict of interest.
References
- Cunnliffe, D.; Kritou, E.; Tudhope, D. Usability evaluation for museum web sites. Mus. Manag. Curatorship 2001, 19, 229–252. [Google Scholar] [CrossRef]
- Kabassi, K. Evaluating websites of museums: State of the art. J. Cult. Herit. 2017, 24, 184–196. [Google Scholar] [CrossRef]
- Kabassi, K.; Martinis, A. Multi-Criteria Decision Making in the Evaluation of the Thematic Museums’ Websites”. In Innovative Approaches to Tourism and Leisure Proceedings of the 4th International Conference on “Innovative Approaches to Tourism and Leisure: Culture, Places and Narratives in a Sustainability Context”, Athens, Greece, 25–27 May 2017; Katsoni, V., Velander, K., Eds.; Springer: Berlin/Heidelberg, Germany, 2017. [Google Scholar]
- Kabassi, K. Application of Multi-Criteria Decision-Making Models for the Evaluation Cultural Websites: A Framework for Comparative Analysis. Information 2021, 12, 407. [Google Scholar] [CrossRef]
- Walsh, D.; Hall, M.M.; Clough, P.; Foster, J. Characterizing online museum users: A study of the National museums Liverpool museum website. Int. J. Digit. Libr. 2018, 21, 75–87. [Google Scholar] [CrossRef] [Green Version]
- Brooke, J. SUS-A quick and dirty usability scale. In Usability Evaluation in Industry; CRC Press: Boca Raton, FL, USA, 1996. [Google Scholar]
- Chin, J.; Diehl, V.; Norman, K. Development of an instrument measuring user satisfaction of the human-computer interface. In Proceedings of the SIGCHI Conference on Human Factors in Computing Systems, Washington, DC, USA, 15–19 May 1998; pp. 213–218. [Google Scholar]
- Davis, F.D. Perceived Usefulness, Perceived Ease of Use, and User Acceptance of Information Technology. MIS Q. 1989, 13, 319–340. [Google Scholar] [CrossRef] [Green Version]
- Lewis, J.R. IBM computer usability satisfaction questionnaires: Psychometric evaluation and instructions for use. Int. J. Hum. -Comput. Interact. 1995, 7, 57–78. [Google Scholar] [CrossRef] [Green Version]
- Lin, H.X.; Choong, Y.-Y.; Salvendy, G. A proposed index of usability: A method for comparing the relative usability of different software systems. Behav. Inf. Technol. 1997, 16, 267–277. [Google Scholar] [CrossRef]
- Tullis, T.S.; Stetson, J.N. A Comparison of Questionnaires for Assessing Website Usability; UPA Presentation: Seattle, WA, USA, 2004. [Google Scholar]
- Kabassi, K.; Maravelakis, E.; Konstantaras, A. Heuristics and Fuzzy Multi-criteria Decision Making for Evaluating Museum Virtual Tours. Int. J. Incl. Mus. 2018, 11, 1–21. [Google Scholar]
- Kabassi, K. Evaluating Museum Using a Combination of Decision-Making Theories. J. Herit. Tour. 2019, 14, 544–560. [Google Scholar] [CrossRef]
- Kabassi, Κ.; Karydis, C.; Botonis, A. AHP, Fuzzy SAW and Fuzzy WPM for the evaluation of Cultural Websites. Multimodal Technol. Interact. 2020, 4, 5. [Google Scholar] [CrossRef] [Green Version]
- Saaty, T. The Analytic Hierarchy Process; McGraw-Hill: New York, NY, USA, 1980. [Google Scholar]
- Hwang, C.L.; Yoon, K. Multiple Attribute Decision Making: Methods and Applications, A State of the Art Survey; Springer: New York, NY, USA, 1981. [Google Scholar]
- Opricovic, S. Multi Criteria Optimization of Civil Engineering Systems; Faculty of Civil Engineering: Belgrade, Serbia, 1998. [Google Scholar]
- Opricovic, S. Fuzzy VIKOR With an Application to Water Resource Planning. Expert Syst. Appl. 2011, 38, 12983–12990. [Google Scholar] [CrossRef]
- Ghaleb, A.M.; Kaid, H.; Alsamhan, A.; Mian, S.H.; Hidri, L. Assessment and Comparison of Various MCDM Approaches in the Selection of Manufacturing Process. Adv. Mater. Sci. Eng. 2020, 1–16. [Google Scholar] [CrossRef]
- Akincilar, A.; Dagdeviren, M. A hybrid multi-criteria decision making model to evaluate hotel websites. Int. J. Hosp. Manag. 2014, 36, 263–271. [Google Scholar] [CrossRef]
- Sylaiou, S.; Mania, K.; Paliokas, I.; Pujol-Tost, L.; Killintzis, V.; Liarokapis, F. Exploring the educational impact of diverse technologies in online Virtual Museums. Int. J. Arts Technol. 2017, 10, 58–84. [Google Scholar] [CrossRef]
- Zhu, Y.; Buchman, A. Evaluating and selecting web sources as external information resources of a data warehouse. In Proceedings of the Third International Conference on Web Information Systems Engineering (WISE’00), Amsterdam, The Netherlands, 20–24 October 2000; pp. 149–160. [Google Scholar] [CrossRef] [Green Version]
- Tiwari, N. Using the Analytic Hierarchy Process (AHP) to identify Performance Scenarios for Enterprise Application. Comput. Meas. Group Meas. It 2006, 4, 3. [Google Scholar]
- Mulubrhan, F.; Mokhtar, A.A.; Muhammad, M. Comparative Analysis between Fuzzy and Traditional Analytical hierarchy process. MATEC Web Conf. 2014, 13, 01006. [Google Scholar] [CrossRef] [Green Version]
- Bilsel, R.U.; Büyüközkan, G.; Ruan, D. A fuzzy preference ranking model for a quality evaluation of hospital web sites. Int. J.Intell. Syst. 2006, 21, 1181–1197. [Google Scholar] [CrossRef]
- Dominic, P.D.D.; Jati, H. Evaluation method of Malaysian university website: Quality website using hybrid method. In Proceedings of the 2010 International Symposium on Information Technology, Kuala Lumpur, Malaysia, 15–17 June 2010; pp. 1–6. [Google Scholar] [CrossRef]
- Shee, D.Y.; Wang, Y.-S. Multi-criteria evaluation of the web based e-learning system: A methodology based on learner satisfaction and its applications. Comput. Educ. 2008, 50, 894–905. [Google Scholar] [CrossRef]
- Saaty, R.W. The analytic hierarchy process—What it is and how it is used. Math. Model. 1987, 9, 161–176. [Google Scholar] [CrossRef] [Green Version]
- Sanayei, A.; Mousavi, S.F.; Yazdankhah, A. Group decision making process for supplier selection with VIKOR under fuzzy environment. Expert Syst. Appl. 2010, 37, 24–30. [Google Scholar] [CrossRef]
- Kaya, T.; Kahraman, C. ‘Fuzzy multiple criteria forestry decision making based on an integrated VIKOR and AHP approach. Expert Syst. Appl. 2011, 38, 7326–7333. [Google Scholar] [CrossRef]
- Zadeh, L.A. Fuzzy Sets. Inf. Control. 1965, 8, 338–353. [Google Scholar] [CrossRef] [Green Version]
- Bairagi, B.; Dey, B.; Sarkar, B.; Sanyal, S. Selection of robot for automated foundry operations using fuzzy multi-criteria decision making approaches. Int. J. Manag. Sci. Eng. Manag. 2014, 9, 221–232. [Google Scholar] [CrossRef]
- Chen, L.Y.; Wang, T.-C. Optimizing partners’ choice in IS/IT outsourcing projects: The strategic decision of fuzzy VIKOR. Int. J. Prod. Econ. 2009, 120, 233–242. [Google Scholar] [CrossRef]
- Devi, K. Extension of VIKOR method in intuitionistic fuzzy environment for robot selection. Expert Syst. Appl. 2011, 38, 14163–14168. [Google Scholar] [CrossRef]
- Liu, H.-C.; You, J.-X.; You, X.-Y.; Shan, M.-M. A novel approach for failure mode and effects analysis using combination weighting and fuzzy VIKOR method. Appl. Soft Comput. 2015, 28, 579–588. [Google Scholar] [CrossRef]
- Rostamzadeh, R.; Govindan, K.; Esmaeili, A.; Sabaghi, M. Application of fuzzy VIKOR for evaluation of green supply chain management practices. Ecol. Indic. 2015, 49, 188–203. [Google Scholar] [CrossRef]
- Güngör, Z.; Serhadlıoglu, G.; Kesen, S.E. A fuzzy AHP approach to personnel selection problem. Appl. Soft Comput. 2009, 9, 641–646. [Google Scholar] [CrossRef]
- Aydin, S.; Kahraman, C. Evaluation of E-commerce Website Quality Using Fuzzy Multi-Criteria Decision Making Approach. IAENG Int. J. Comput. Sci. 2012, 39, 64–70. [Google Scholar]
- Deng, H.; Chung-Hsing, Y.; Willis, R.J. Inter-company comparison using modified TOPSIS with objective weights. Comput. Oper. Res. 2000, 27, 963–973. [Google Scholar] [CrossRef]
- Chen, C.T. Extensions of the TOPSIS for group decision-making under fuzzy environment. Fuzzy Sets Syst. 2000, 114, 1–9. [Google Scholar] [CrossRef]
- Afful-Dadzie, E.; Nabareseh, S.; Oplatková, Z.K. Fuzzy Vikor Approach: Evaluating Quality of Internet Health Information. In Proceedings of the 2014 Federated Conference on Computer Science and Information Systems, Warsaw, Poland, 7–10 September 2014. [Google Scholar] [CrossRef]
- Van Welie, M.; Klaasse, B. Evaluating Museum Websites Using Design Patterns; Technical Report Number: IR-IMSE-001; Vrije Universiteit: Amsterdam, The Netherlands, 2004. [Google Scholar]
Figure 1.
Hierarchy of dimensions and criteria according to AHP.

Figure 2.
Hierarchy of dimensions and criteria as well as their weights of importance according to AHP.
Figure 2.
Hierarchy of dimensions and criteria as well as their weights of importance according to AHP.

Figure 3.
Strength of correlation.


Table 1.
List of the selected museums’ websites.
| Museum Name | Country | Associated Link | |
|---|---|---|---|
| A1 | Goulandris Museum of Natural History | Greece | https://www.gnhm.gr/ (accessed on 31 May 2022) |
| A2 | The Natural History Museum of London | UK | https://www.nhm.ac.uk/ (accessed on 31 May 2022) |
| A3 | Smithsonian National Museum of Natural History | USA | https://naturalhistory.si.edu/ (accessed on 31 May 2022) |
| A4 | National Museum of Nature and Science | Japan | https://www.kahaku.go.jp/ (accessed on 31 May 2022) |
Table 2.
Pair-wise comparison matrix of the evaluation dimensions.
| Usability | Functionality | VR Interaction | |
|---|---|---|---|
| Usability | 1.00 | 1.33 | 5.01 |
| Functionality | 0.75 | 1.00 | 1.86 |
| VR interaction | 0.20 | 0.54 | 1.00 |
Table 3.
Pair-wise comparison matrix of the sub-criteria of usability.
| uc1 | uc2 | uc3 | uc4 | uc5 | uc6 | uc7 | uc8 | uc9 | uc10 | |
|---|---|---|---|---|---|---|---|---|---|---|
| uc1 | 1.00 | 0.80 | 1.29 | 1.17 | 0.24 | 0.55 | 1.87 | 1.35 | 1.28 | 0.73 |
| uc2 | 1.26 | 1.00 | 1.00 | 1.07 | 0.78 | 0.83 | 1.04 | 1.19 | 2.12 | 1.11 |
| uc3 | 0.77 | 1.00 | 1.00 | 1.28 | 0.31 | 0.60 | 2.49 | 1.57 | 1.57 | 1.03 |
| uc4 | 0.85 | 0.93 | 0.78 | 1.00 | 0.41 | 0.86 | 1.94 | 1.70 | 1.74 | 1.14 |
| uc5 | 4.15 | 1.27 | 3.24 | 2.44 | 1.00 | 1.55 | 2.70 | 3.37 | 1.90 | 1.74 |
| uc6 | 1.82 | 1.20 | 1.68 | 1.16 | 0.64 | 1.00 | 1.23 | 1.29 | 1.94 | 1.46 |
| uc7 | 0.53 | 0.96 | 0.40 | 0.51 | 0.37 | 0.81 | 1.00 | 0.66 | 0.61 | 0.52 |
| uc8 | 0.74 | 0.84 | 0.64 | 0.59 | 0.30 | 0.77 | 1.51 | 1.00 | 0.58 | 0.61 |
| uc9 | 0.78 | 0.47 | 0.64 | 0.58 | 0.53 | 0.51 | 1.63 | 1.71 | 1.00 | 0.57 |
| uc10 | 1.37 | 0.90 | 0.97 | 0.88 | 0.58 | 0.69 | 1.92 | 1.64 | 1.74 | 1.00 |
Table 4.
Pair-wise comparison matrix of the sub-criteria of functionality.
| fc1 | fc2 | fc3 | fc4 | fc5 | fc6 | fc7 | |
|---|---|---|---|---|---|---|---|
| fc1 | 1.00 | 2.04 | 1.55 | 6.00 | 1.27 | 1.68 | 1.92 |
| fc2 | 0.49 | 1.00 | 0.60 | 4.37 | 0.47 | 0.89 | 1.06 |
| fc3 | 0.64 | 1.66 | 1.00 | 2.36 | 0.60 | 1.40 | 1.12 |
| fc4 | 0.17 | 0.23 | 0.42 | 1.00 | 0.23 | 0.28 | 0.37 |
| fc5 | 0.79 | 2.12 | 1.68 | 4.33 | 1.00 | 2.47 | 1.35 |
| fc6 | 0.60 | 1.12 | 0.71 | 3.60 | 0.41 | 1.00 | 0.65 |
| fc7 | 0.52 | 0.94 | 0.89 | 2.67 | 0.74 | 1.54 | 1.00 |
Table 5.
Pair-wise comparison matrix of the sub-criteria of mobile interaction.
| VRc1 | VRc2 | VRc3 | VRc4 | |
|---|---|---|---|---|
| VRc1 | 1.00 | 0.63 | 0.40 | 1.29 |
| VRc2 | 1.59 | 1.00 | 0.49 | 1.81 |
| VRc3 | 2.49 | 2.05 | 1.00 | 1.22 |
| VRc4 | 0.77 | 0.55 | 0.73 | 1.00 |
Table 6.
RI value depending on the number of criteria.
| n | 1 | 2 | 3 | 4 | 5 | 6 | 7 | 8 | 9 | 10 |
|---|---|---|---|---|---|---|---|---|---|---|
| RI | 0.00 | 0.00 | 0.58 | 0.90 | 1.12 | 1.24 | 1.32 | 1.41 | 1.45 | 1.49 |
Table 7.
Linguistic scale for ratings of alternatives.
| Linguistic Term | Fuzzy Number |
|---|---|
| Very Poor | (0, 0, 1) |
| Poor | (0, 1, 3) |
| Fair | (3, 5, 7) |
| Good | (7, 9, 10) |
| Very Good | (9, 10, 10) |
Table 8.
Ranking the alternatives with fuzzy VIKOR MCDM method.
| Rank | Museum Name | Si | Ri | Qi |
|---|---|---|---|---|
| 1 | A1 •Goulandris Museum of Natural History | 0.206 | 0.082 | 0.000 |
| 2 | A2 • The Natural History Museum of London | 0.663 | 0.228 | 0.336 |
| 3 | A3 • Smithsonian National Museum of Natural History | 0.625 | 0.236 | 0.342 |
| 4 | A4 • National Museum of Nature and Science | 2.780 | 0.377 | 1.000 |
Table 9.
Ranking the alternatives with fuzzy TOPSIS MCDM method.
| Rank | Museum Name | |
|---|---|---|
| 1 | A1 •Goulandris Museum of Natural History | 0.95 |
| 2 | A3 • Smithsonian National Museum of Natural History | 0.79 |
| 3 | A2 • The Natural History Museum of London | 0.76 |
| 4 | A4 • National Museum of Nature and Science | 0.09 |
Table 10.
Ranking the alternatives according the SUS score mean value.
| Rank | Museum Name | SUS Score |
|---|---|---|
| 1 | A1 •Goulandris Museum of Natural History | 80.89 |
| 2 | A3 • Smithsonian National Museum of Natural History | 77.30 |
| 3 | A2 • The Natural History Museum of London | 75.20 |
| 4 | A4 • National Museum of Nature and Science | 52.38 |
Table 11.
The Pearson and Spearman’s correlation coefficient.
| Pair-Wise Comparison | Pearson CC | Spearman’s Rho | Correlation Rate |
|---|---|---|---|
| Fuzzy VIKOR—Fuzzy TOPSIS | −0.99 | 0.80 | High correlation |
| Fuzzy VIKOR—SUS | −0.97 | 0.80 | High correlation |
| Fuzzy TOPSIS—SUS | 1.00 | 1.00 | Perfect correlation |
Table 12.
Advantages and disadvantages of the different methods.
| Method | Advantages | Disadvantages |
|---|---|---|
| AHP |
|
|
| VIKOR |
|
|
| TOPSIS |
|
|
| SUS |
|
|
Publisher’s Note: MDPI stays neutral with regard to jurisdictional claims in published maps and institutional affiliations. |
© 2022 by the authors. Licensee MDPI, Basel, Switzerland. This article is an open access article distributed under the terms and conditions of the Creative Commons Attribution (CC BY) license (https://creativecommons.org/licenses/by/4.0/).
Share and Cite
MDPI and ACS Style
Kabassi, K.; Bekatoros, S.; Botonis, A. Checking Consistency and Comparing Multi-Criteria Decision Making Methods in the Evaluation of Museums’ Websites. Digital 2022, 2, 484-500. https://doi.org/10.3390/digital2040026
AMA Style
Kabassi K, Bekatoros S, Botonis A. Checking Consistency and Comparing Multi-Criteria Decision Making Methods in the Evaluation of Museums’ Websites. Digital. 2022; 2(4):484-500. https://doi.org/10.3390/digital2040026
Chicago/Turabian StyleKabassi, Katerina, Stelios Bekatoros, and Athanasios Botonis. 2022. "Checking Consistency and Comparing Multi-Criteria Decision Making Methods in the Evaluation of Museums’ Websites" Digital 2, no. 4: 484-500. https://doi.org/10.3390/digital2040026