Article

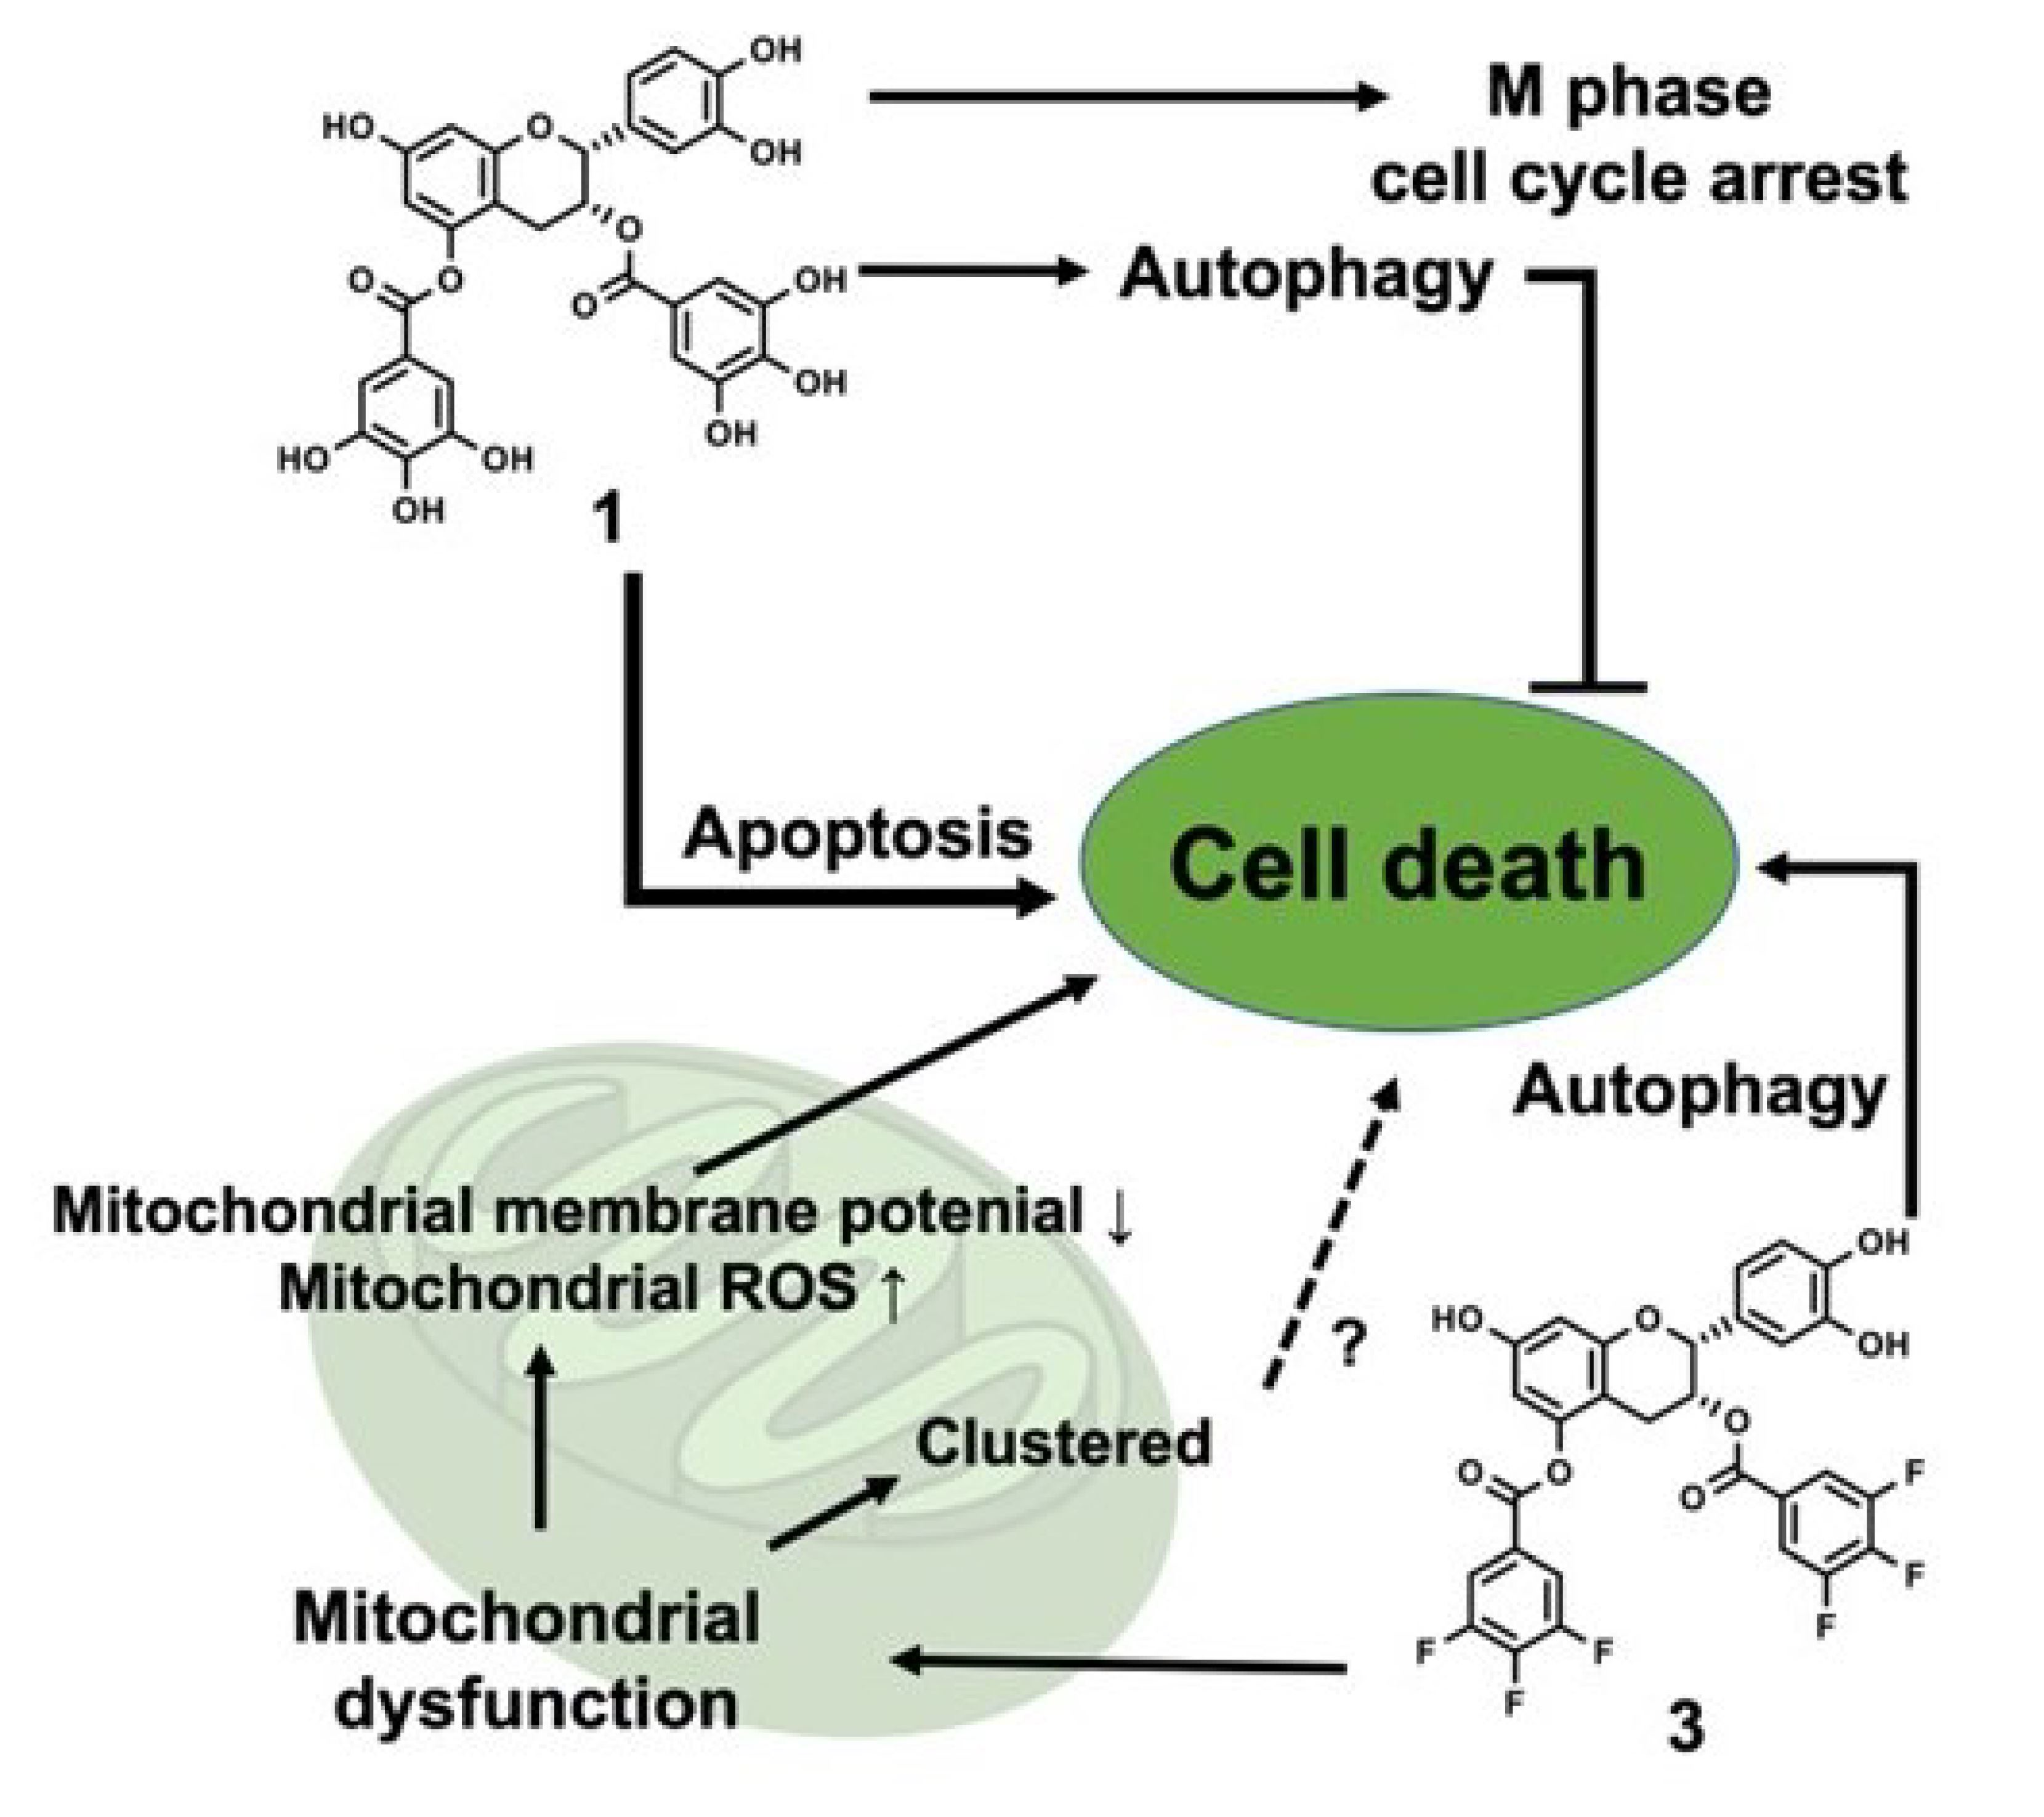
Fluorinated Derivatives of Digalloyl-Flavan-3-ol Induce Autophagic Cell Death by Forming Granular Aggregates Containing Mitochondria

Graduate School of Engineering, Osaka Electro-Communication University (OECU), 18-8 Hatsu-cho, Neyagawa 572-8530, Osaka, Japan
*
Authors to whom correspondence should be addressed.
BioChem 2023, 3(2), 61-77; https://doi.org/10.3390/biochem3020005
Submission received: 30 January 2023 / Revised: 13 March 2023 / Accepted: 27 March 2023 / Published: 17 April 2023
(This article belongs to the Special Issue Cancer Molecular Biology and Drug Discovery)

Abstract

:
Flavan-3-ol derivatives are polyphenolic compounds with multifunctional properties. One of the flavan-3-ol derivatives, green tea catechin epigallocatechin gallate, is known to have anticancer activity as one of its multifunctional properties. We have studied the synthesis of flavan-3-ol derivatives and conducted structure-activity relationship studies; we found that the fluorinated derivatives exhibited high toxicity against HeLa and A549 cells. It was confirmed that the cytotoxicity was affected by the conformation of the flavan-3-ol skeleton and that the 2,3-cis form was dominant. The addition of fluorinated compounds increased the amount of intracellular mitochondrial superoxide, abolished the membrane potential of mitochondria, and, interestingly, formed granular aggregates containing mitochondria. When the level of LC3-II, a marker of autophagy induction, was confirmed, it suggested that the addition of the fluorinated compounds promoted autophagy. These results suggest that the novel highly cytotoxic fluorinated flavan-3-ol compound synthesized in this study promotes autophagy and induces cell death by triggering mitochondrial dysfunction. We believe that these results suggest the possibility of conferring more functionality through structural transformations of flavan-3-ol derivatives.

Graphical Abstract

1. Introduction

Polyphenolic compounds are produced in plants and are known to exhibit antioxidant activity, along with carotenoids and vitamins. Polyphenol is a compound with multiple phenolic hydroxy groups in the molecule. Among the various structures known as polyphenol compounds, a group of compounds called “flavonoids” have attracted significant attention because they are found in foods and have many biological activities and functions. Flavan-3-ol derivatives, also called catechins, are found in a variety of foods. Flavan-3-ol derivatives have many isomers, which are often simultaneously present in the same plant. As each compound is present in very small amounts, it is difficult to isolate and purify each compound from the plant in quantities sufficient for biological activity studies. Among the flavan-3-ol derivatives, (–)-epigallocatechin-3-O-gallate (EGCG), also known as tea catechin, is a well-known compound. Various studies using EGCG have been conducted worldwide, and its biological activities, such as its antibacterial [1], antiallergic [2,3], antioxidant [4], and anticancer [5,6] effects, have been reported. In particular, chemical biological research to identify the targets of EGCG is under active investigation [7,8,9].
We have previously reported that only the 5-position can be selectively deprotected by the acid treatment of a flavan-3-ol derivative, in which the four phenolic hydroxyl groups of (–)-epicatechin and (+)-catechin are protected with a tert-butyldimethylsilyl (TBDMS or TBS) group [10]. Using this regioselective modification method, (–)-epicatechin-3,5-di-O-gallate (1) and (+)-catechin-3,5-di-O-gallate (2) (Figure 1) were synthesized by modifying the galloyl groups at both the 3- and 5-positions, and their cell growth inhibitory activities were measured. Compound 1 with a 2, 3-cis stereostructure, a derivative of (–)-epicatechin, showed high activity against HeLa S3 cells, a cervical epithelioid carcinoma adaptable to suspension culture, while 2, with a 2, 3-trans stereostructure and derived from (+)-catechin, showed little activity [10]. These results suggest that compounds with the 2,3-cis stereostructure were dominant in the cell growth inhibitory activity. Furthermore, it was confirmed that two galloyl groups are required for the activity, and that the 3- and 5-positions are the most effective introduction positions for the galloyl groups [11]. Based on these results, we became interested in the functional mechanism of Compounds 1 and 2 with a flavan-3-ol skeleton and decided to conduct further research.
In this study, we report that fluorinated compounds, (–)-epicatechin-3,5-di-O-3,4,5-trifluorobenzoate (3) and (–)-catechin-3,5-di-O-3,4,5-trifluorobenzoate (4) (Figure 1), which are novel compounds discovered from the structure-activity relationship studies of analogs of Compounds 1 and 2, cause mitochondrial dysfunction and exhibit high toxicity against two cancer cell lines, the HeLa cell line and the human lung carcinoma cell line A549. Although these compounds have the same flavan-3-ol skeleton, it was confirmed that the mechanism of action of Compound 1, which showed high cytotoxicity, and fluorinated Compounds 3 and 4 were significantly different. Compound 2, which has a different steric structure at the 3-position than Compound 1, has low activity, including cytotoxicity, suggesting that the steric structure at the 3-position is important for exhibiting activity.

2. Materials and Methods

2.1. General Information

All of the commercially available chemicals used for chemical synthesis were used without further purification. The human cervical adenocarcinoma cell line, HeLa, and the human lung carcinoma cell line, A549, were provided by RIKEN BRC through the National Bio-Resource Project of MEXT (Tsukuba, Japan). The cells were maintained in DMEM high glucose (Dulbecco’s Modified Eagle’s Medium, Gibco (Life technology Co., Grand Island, NY, USA)) supplemented with 10% fetal bovine serum (Thermo Fisher Scientific, Waltham, MA, USA) and 1% Pen-Strep (Life Technology Co., Grand Island, NY, USA). The cells were incubated at 37 °C in a humid 5% CO2 and 95% air environment. The small molecule compounds used in the assay were dissolved in dimethyl sulfoxide (DMSO) and stored at −25 °C.

2.2. Cell Viability Assay

Approximately 7000 cells in 100 μL medium were counted and added to each well of a 96-well plate and incubated for 24 h in a 37 °C incubator equilibrated with an atmosphere of 5% CO2 and 95% humidified air. Then, 1 μL of the synthetic compound dissolved in DMSO was added to each well and incubated for 24 or 48 h. DMSO alone served as a negative control. After the medium was removed, 90 μL of fresh medium and 10 µL of 3-(4,5-dimethylthiazol-2-yl)-2,5-diphenyltetrazolium bromide solution (MTT, 5 mg/mL; FUJIFILM Wako Chemicals Co. Osaka, Japan) was added to each well and incubated at 37 °C for 2.5 h. The reaction medium was then removed, and 100 µL DMSO was added to each well and mixed. The viable cells were then assessed using a microplate reader (Filter Max F5 multi-mode microplate reader; Molecular Devices LLC, San Jose, CA, USA) to measure the OD at 570 nm. Each experiment was performed in six replicates, and the same experiment was repeated at least three times on different days to ensure reproducibility. As an indicator of cytotoxicity, epigallocatechin-3-O-gallate (EGCG), a polyphenol compound that has been extensively studied, was used (EGCG yielded 91.1 ± 5.8% inhibition against HeLa cells and 96.9 ± 4.8% against A549 cells in our assay at a final concentration of 50 µM). IC50 was calculated by the following formula: IC50 (μM) = 10^ {log(A/B) × (50 − C)/(D − C) + log(B)}; A: high concentration between 50% inhibition; B: low concentrations between 50% inhibition; C: inhibition rate at concentration B; D: inhibition rate at concentration A.

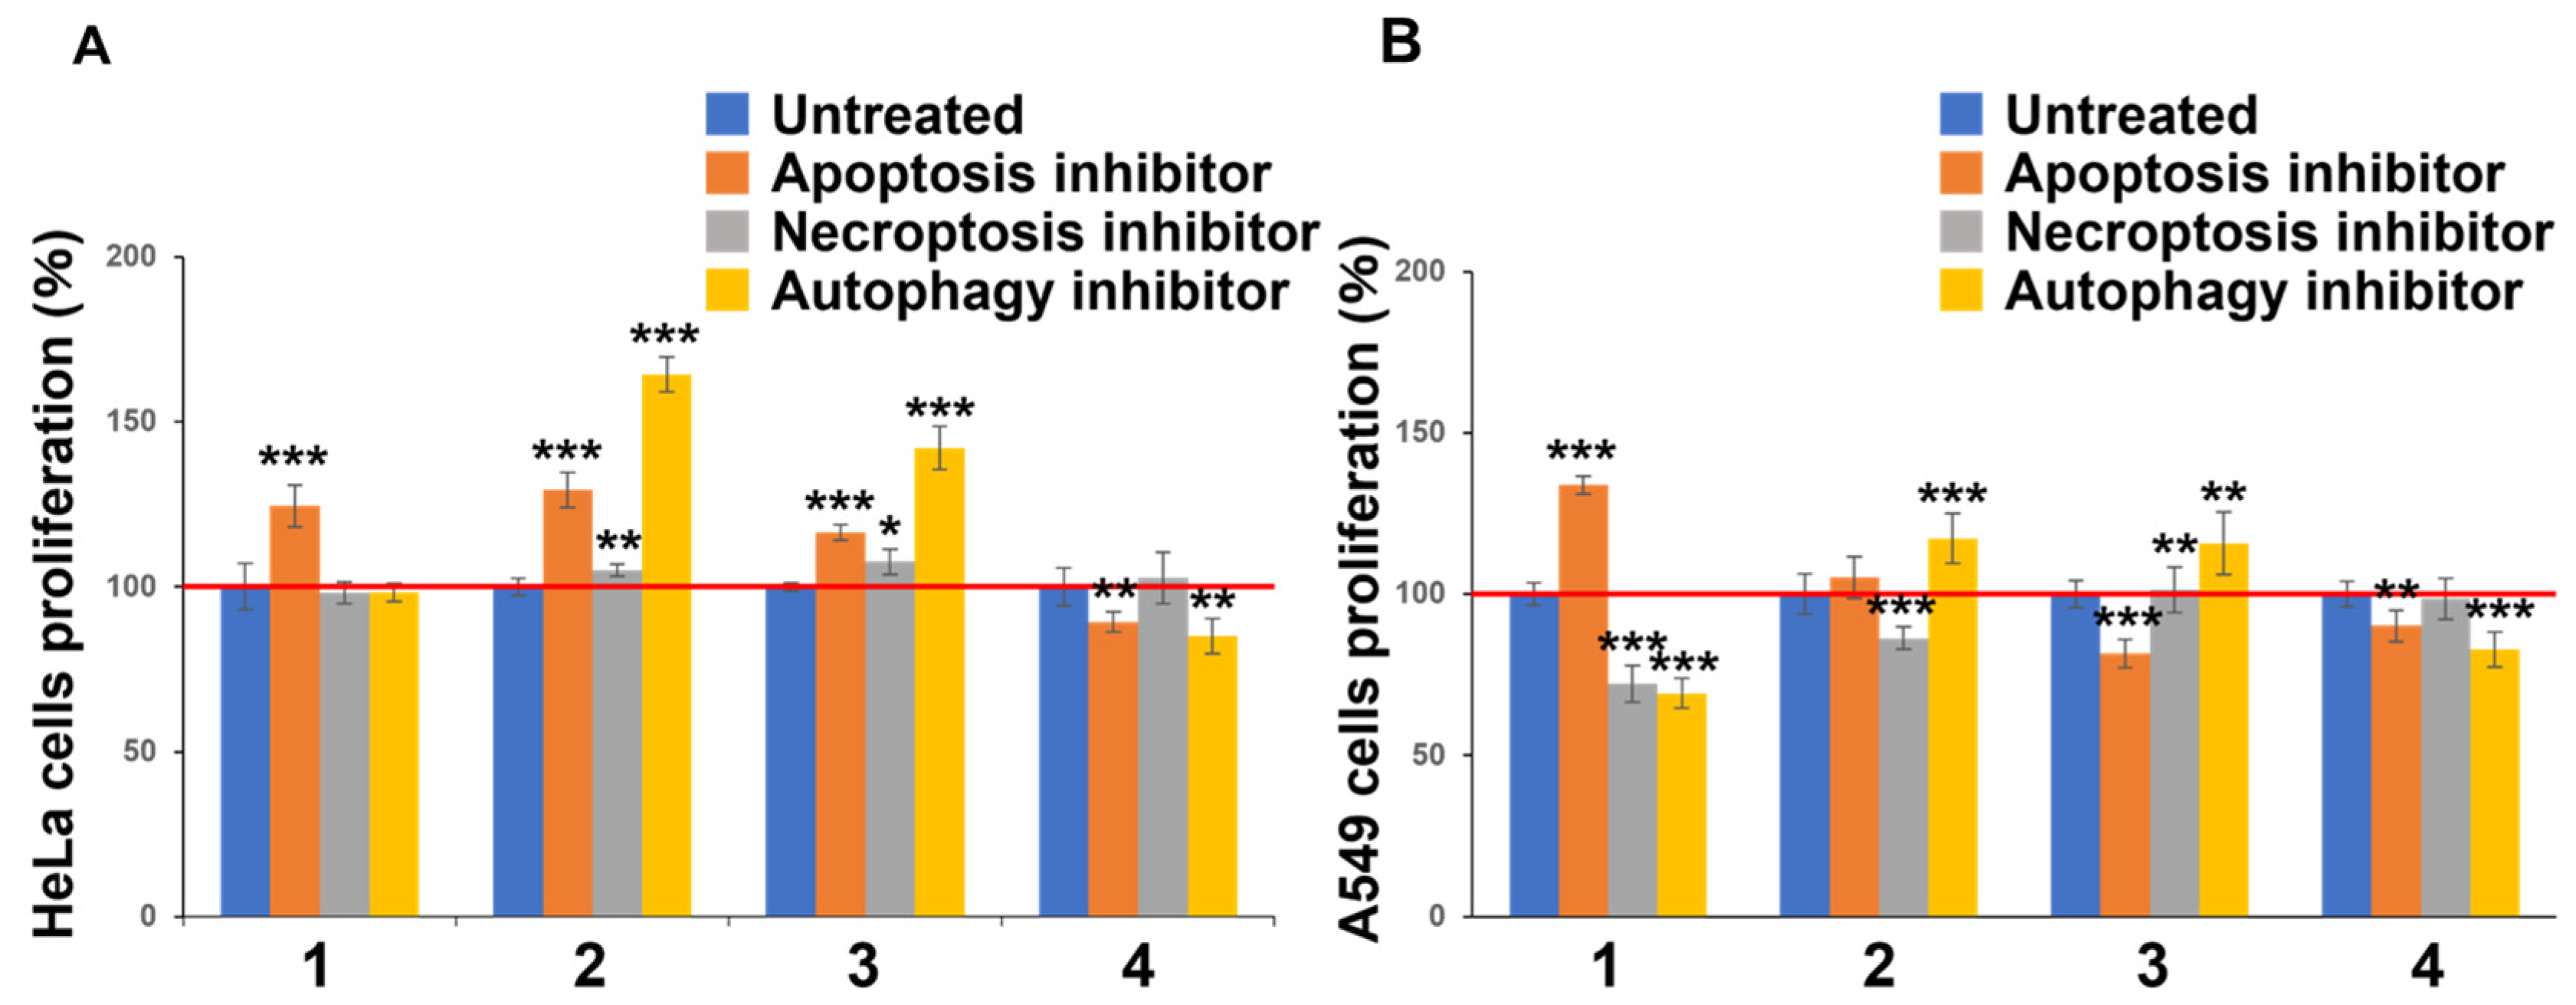
2.3. Cell Viability Measurement Using Cell Death Inhibitors

Approximately 7000 cells in 100 μL medium were counted and added to each well of a 96-well plate and incubated for 24 h in a 37 °C incubator equilibrated with an atmosphere of 5% CO2 and 95% humidified air. Then, 1 μL of the synthetic compounds dissolved in DMSO (Compounds 1, 3, and 4: final concentration 10 μM; Compound 2: final concentration 50 μM) and compounds that inhibit cell death were added to each well and incubated for 48 h. DMSO alone served as a negative control. The caspase inhibitor Z-Val-Ala-Asp(OMe)-CH2F (Z-VAD-FMK; AdipoGen Life Science, San Diego, CA, USA) was used as an apoptosis inhibitor [12,13], necrostatin-1 (Chemscene LLC, Monmouth Junction, NJ, USA) as a necroptosis inhibitor [14,15], and bafilomycin A1 (BAF-A1; AdipoGen Life Science, San Diego, CA, USA) as an autophagy inhibitor [16,17]. The inhibitors Z-VAD-FMK, Necrostain-1, and BAF-A1 were dissolved in DMSO to concentrations of 60 mM, 20 mM, and 20 mM, respectively. After the medium was removed, 90 µL of the new medium and 10 µL of MTT solution (5 mg/mL) were added to each well and incubated at 37 °C for 2.5 h. After incubation, the reaction medium was removed, and 100 µL of DMSO was added to each well and mixed. The viable cells were assessed using a microplate reader to measure the OD at 570 nm. Each experiment was performed in six replicates, and the same experiment was repeated at least three times on different days to ensure reproducibility.

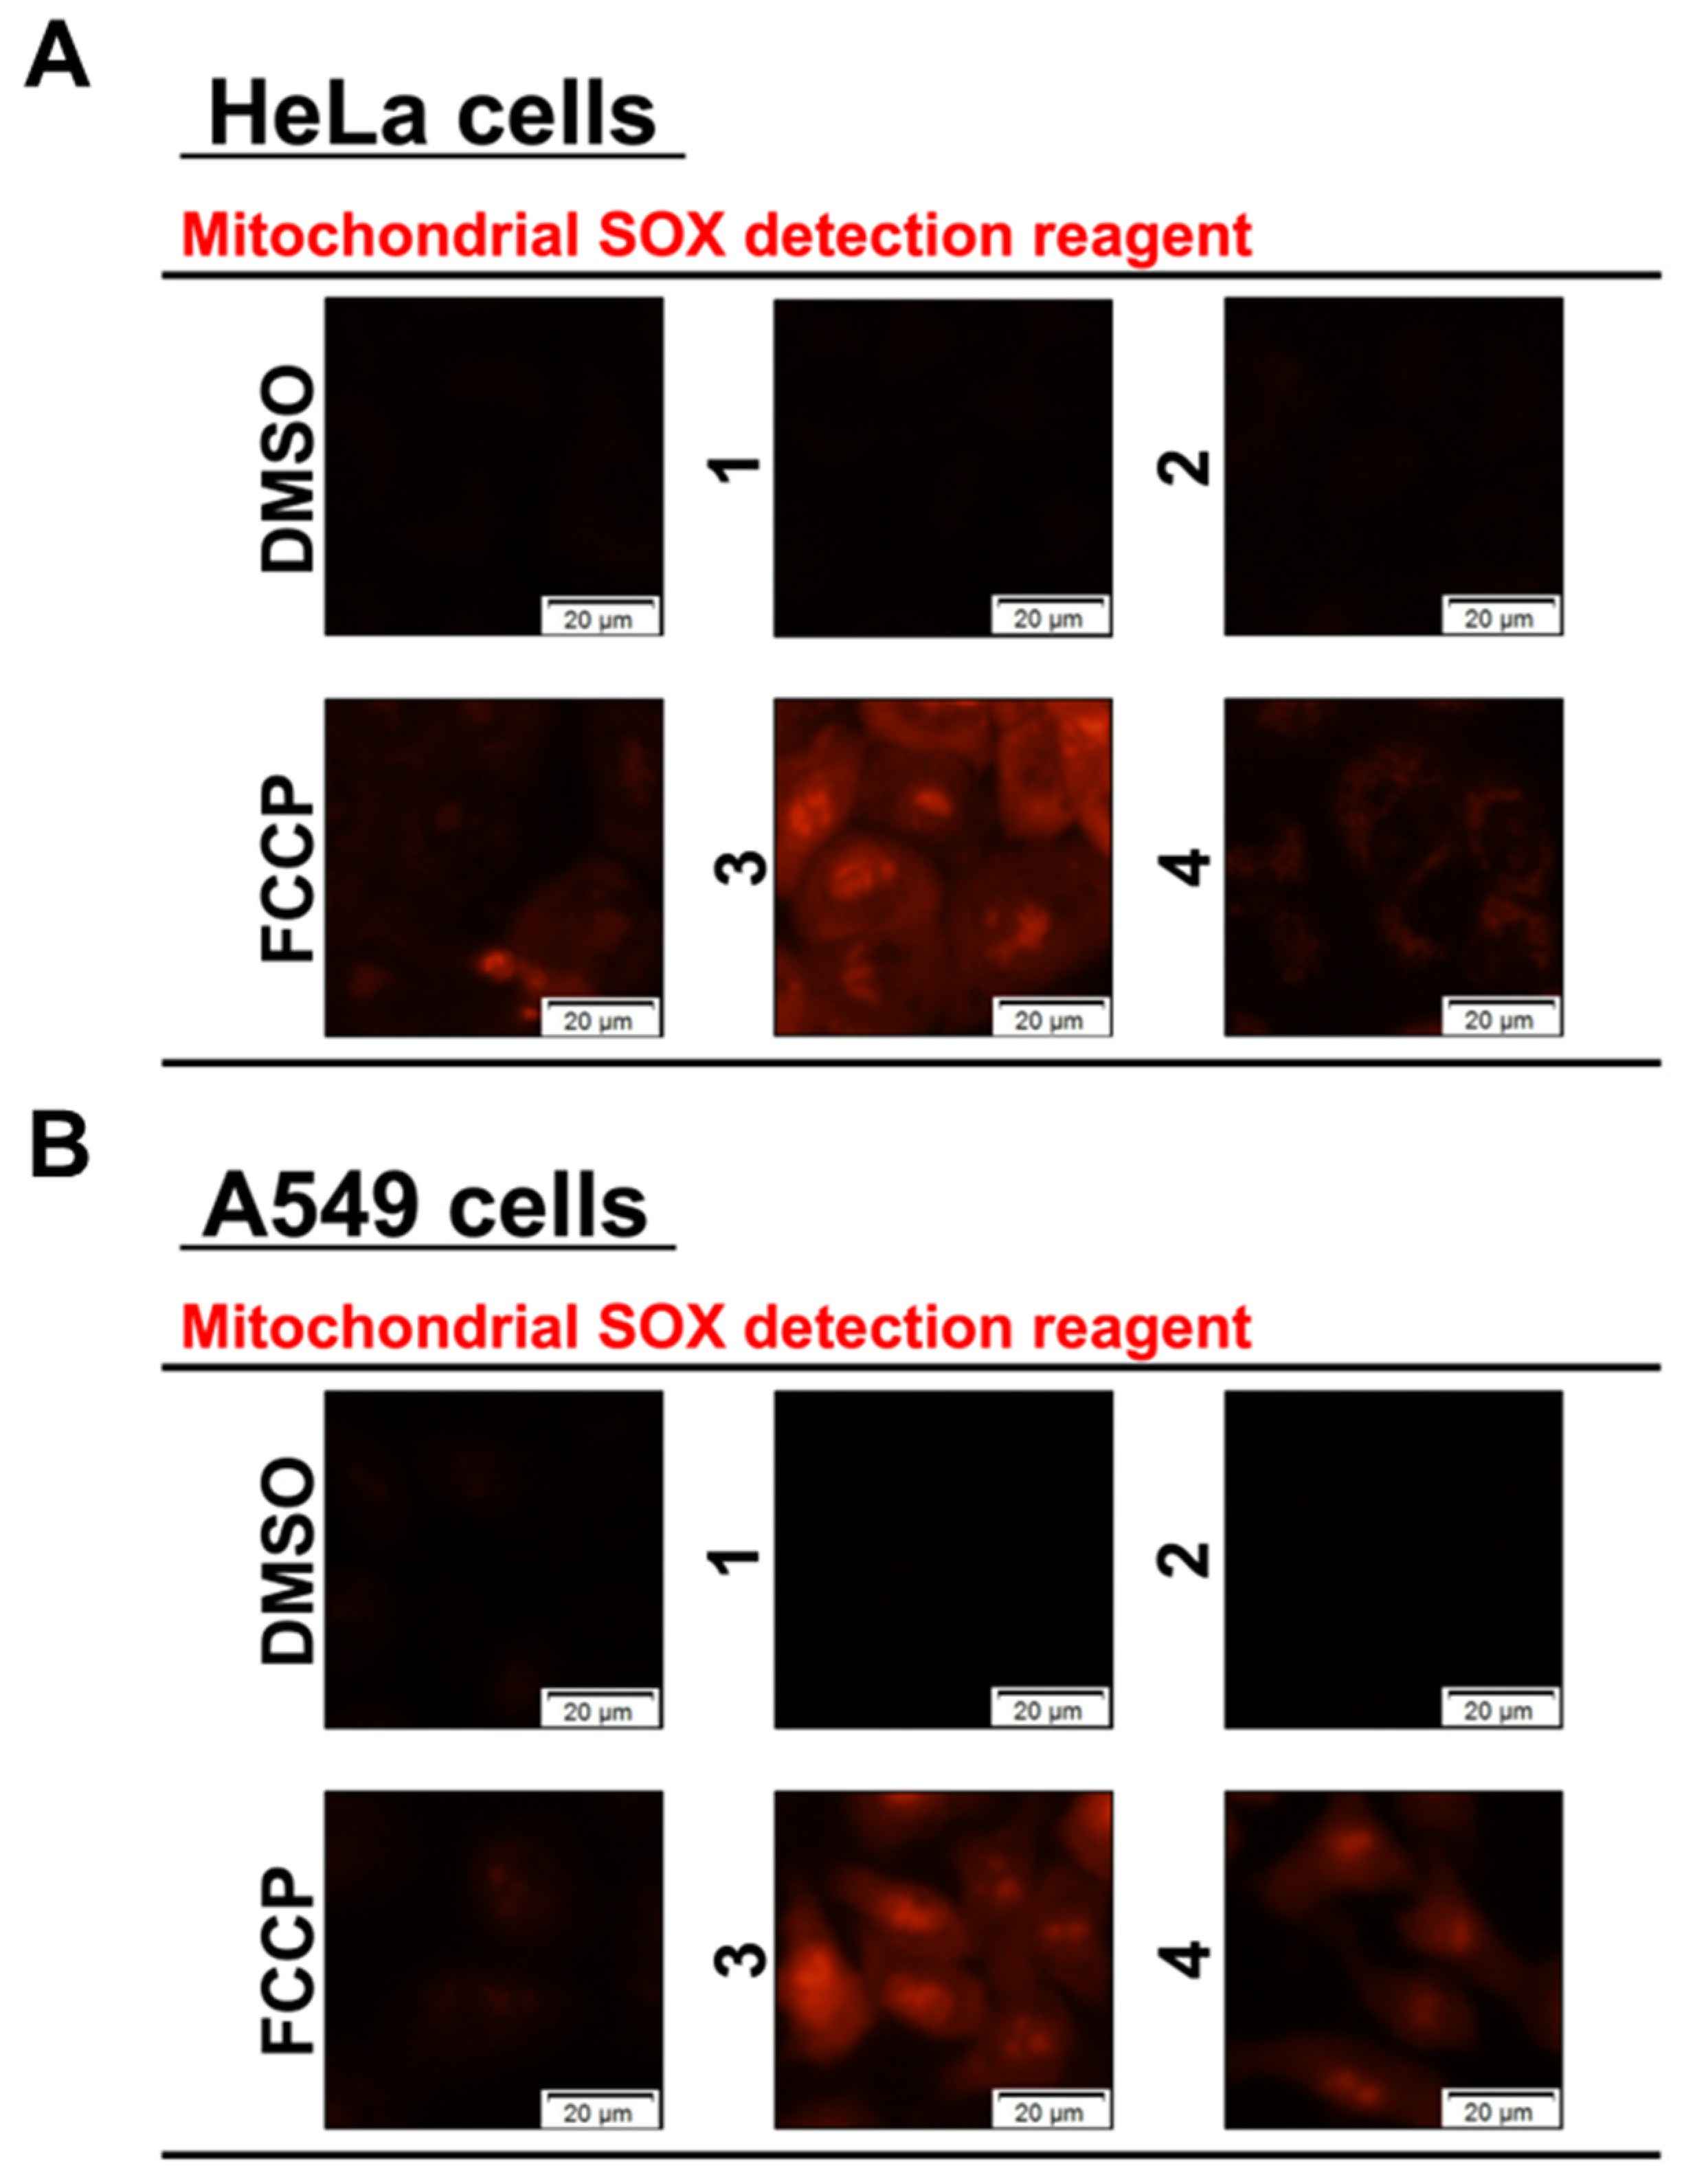
2.4. Mitochondrial Superoxide (SOX) Assay

Approximately 40,000 cells in 500 μL medium were counted, added to each well of a 24-well plate, and incubated for 24 h in a 37 °C incubator equilibrated with an atmosphere of 5% CO2 and 95% humidified air. Then, each synthesized Compound 14 was added to a final concentration of 50 μM and incubated for 1 h. Mitochondrial superoxide levels were measured using MitoSOXTM Red (Thermo Fisher Scientific, Waltham, MA, USA) according to the manufacturer’s instructions. Then, 50 µL of MitoSOXTM reagent working solution were added to each well. The cells were incubated for 10 min at 37 °C while being protected from light. The working solution was removed, and the cells were washed with PBS. The control cells were treated with carbonyl cyanide 4-(trifluoromethoxy)phenylhydrazone (FCCP; Abcam Co., Cambridge, UK) [18,19], a mitochondrial oxidative phosphorylation uncoupler, at a final concentration of 50 µM. Images were acquired using an IX73 fluorescence microscope (Olympus, Tokyo, Japan). For each experiment, three or more independent tests were performed in duplicate.

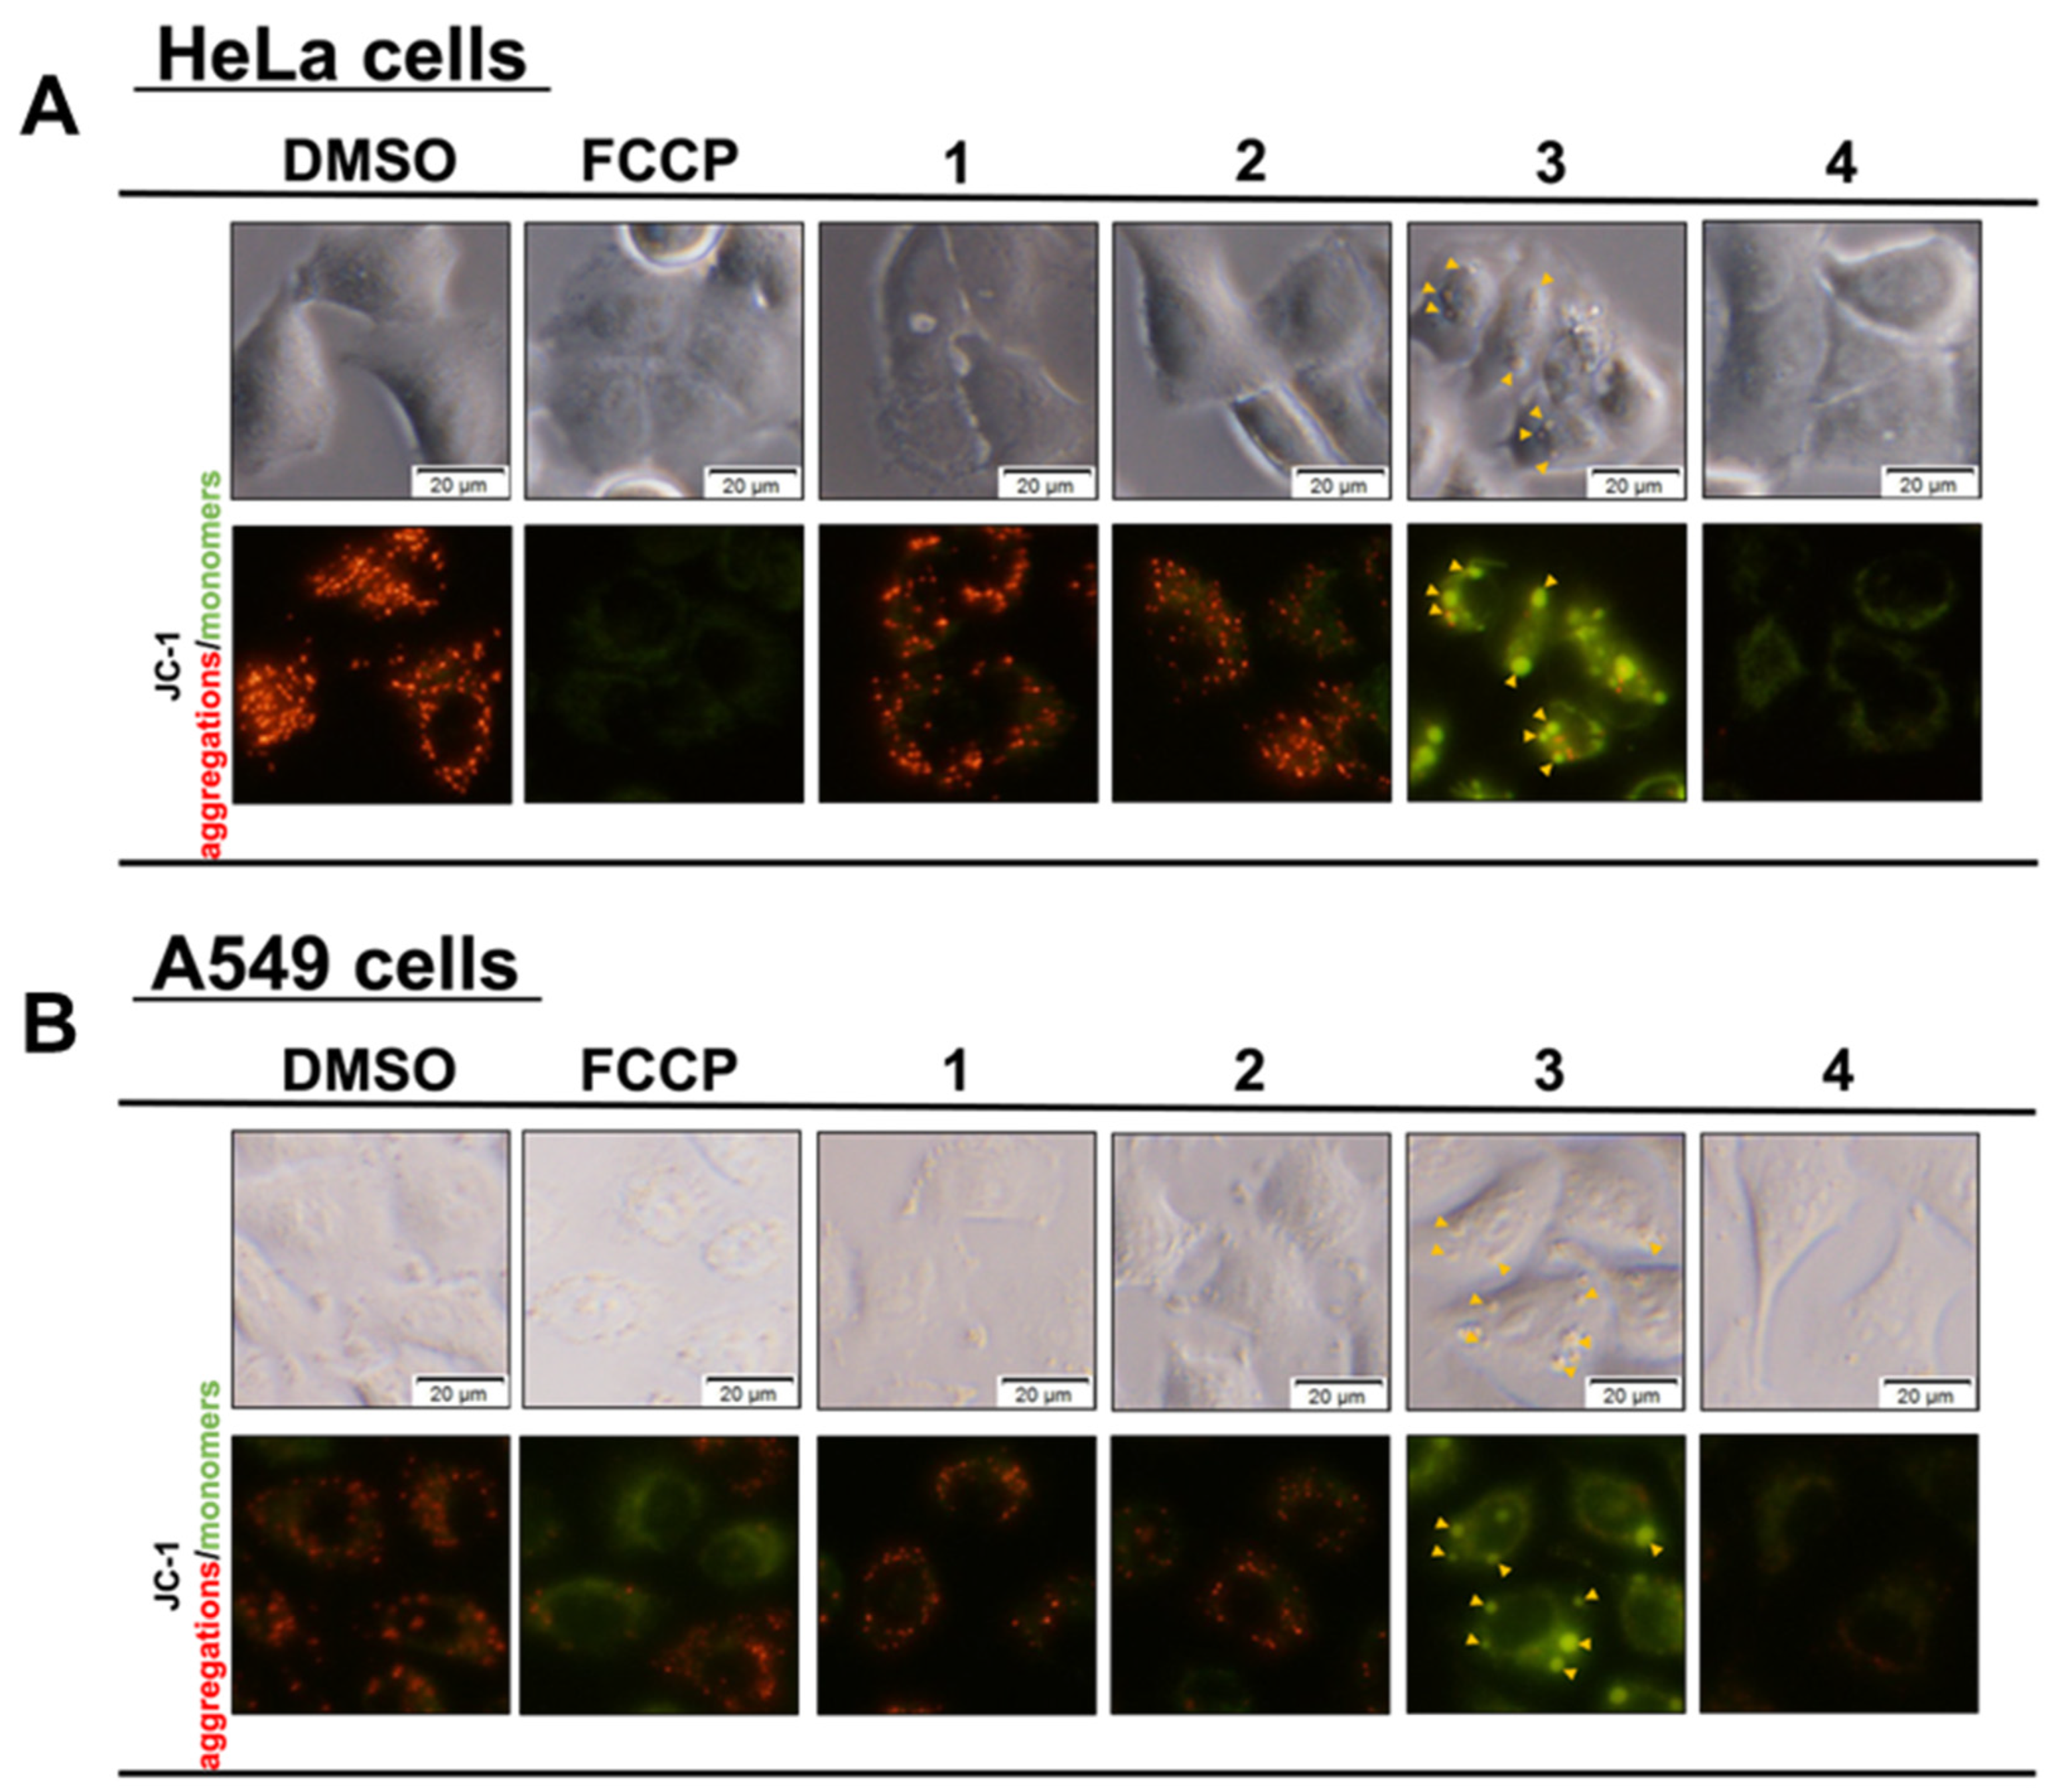
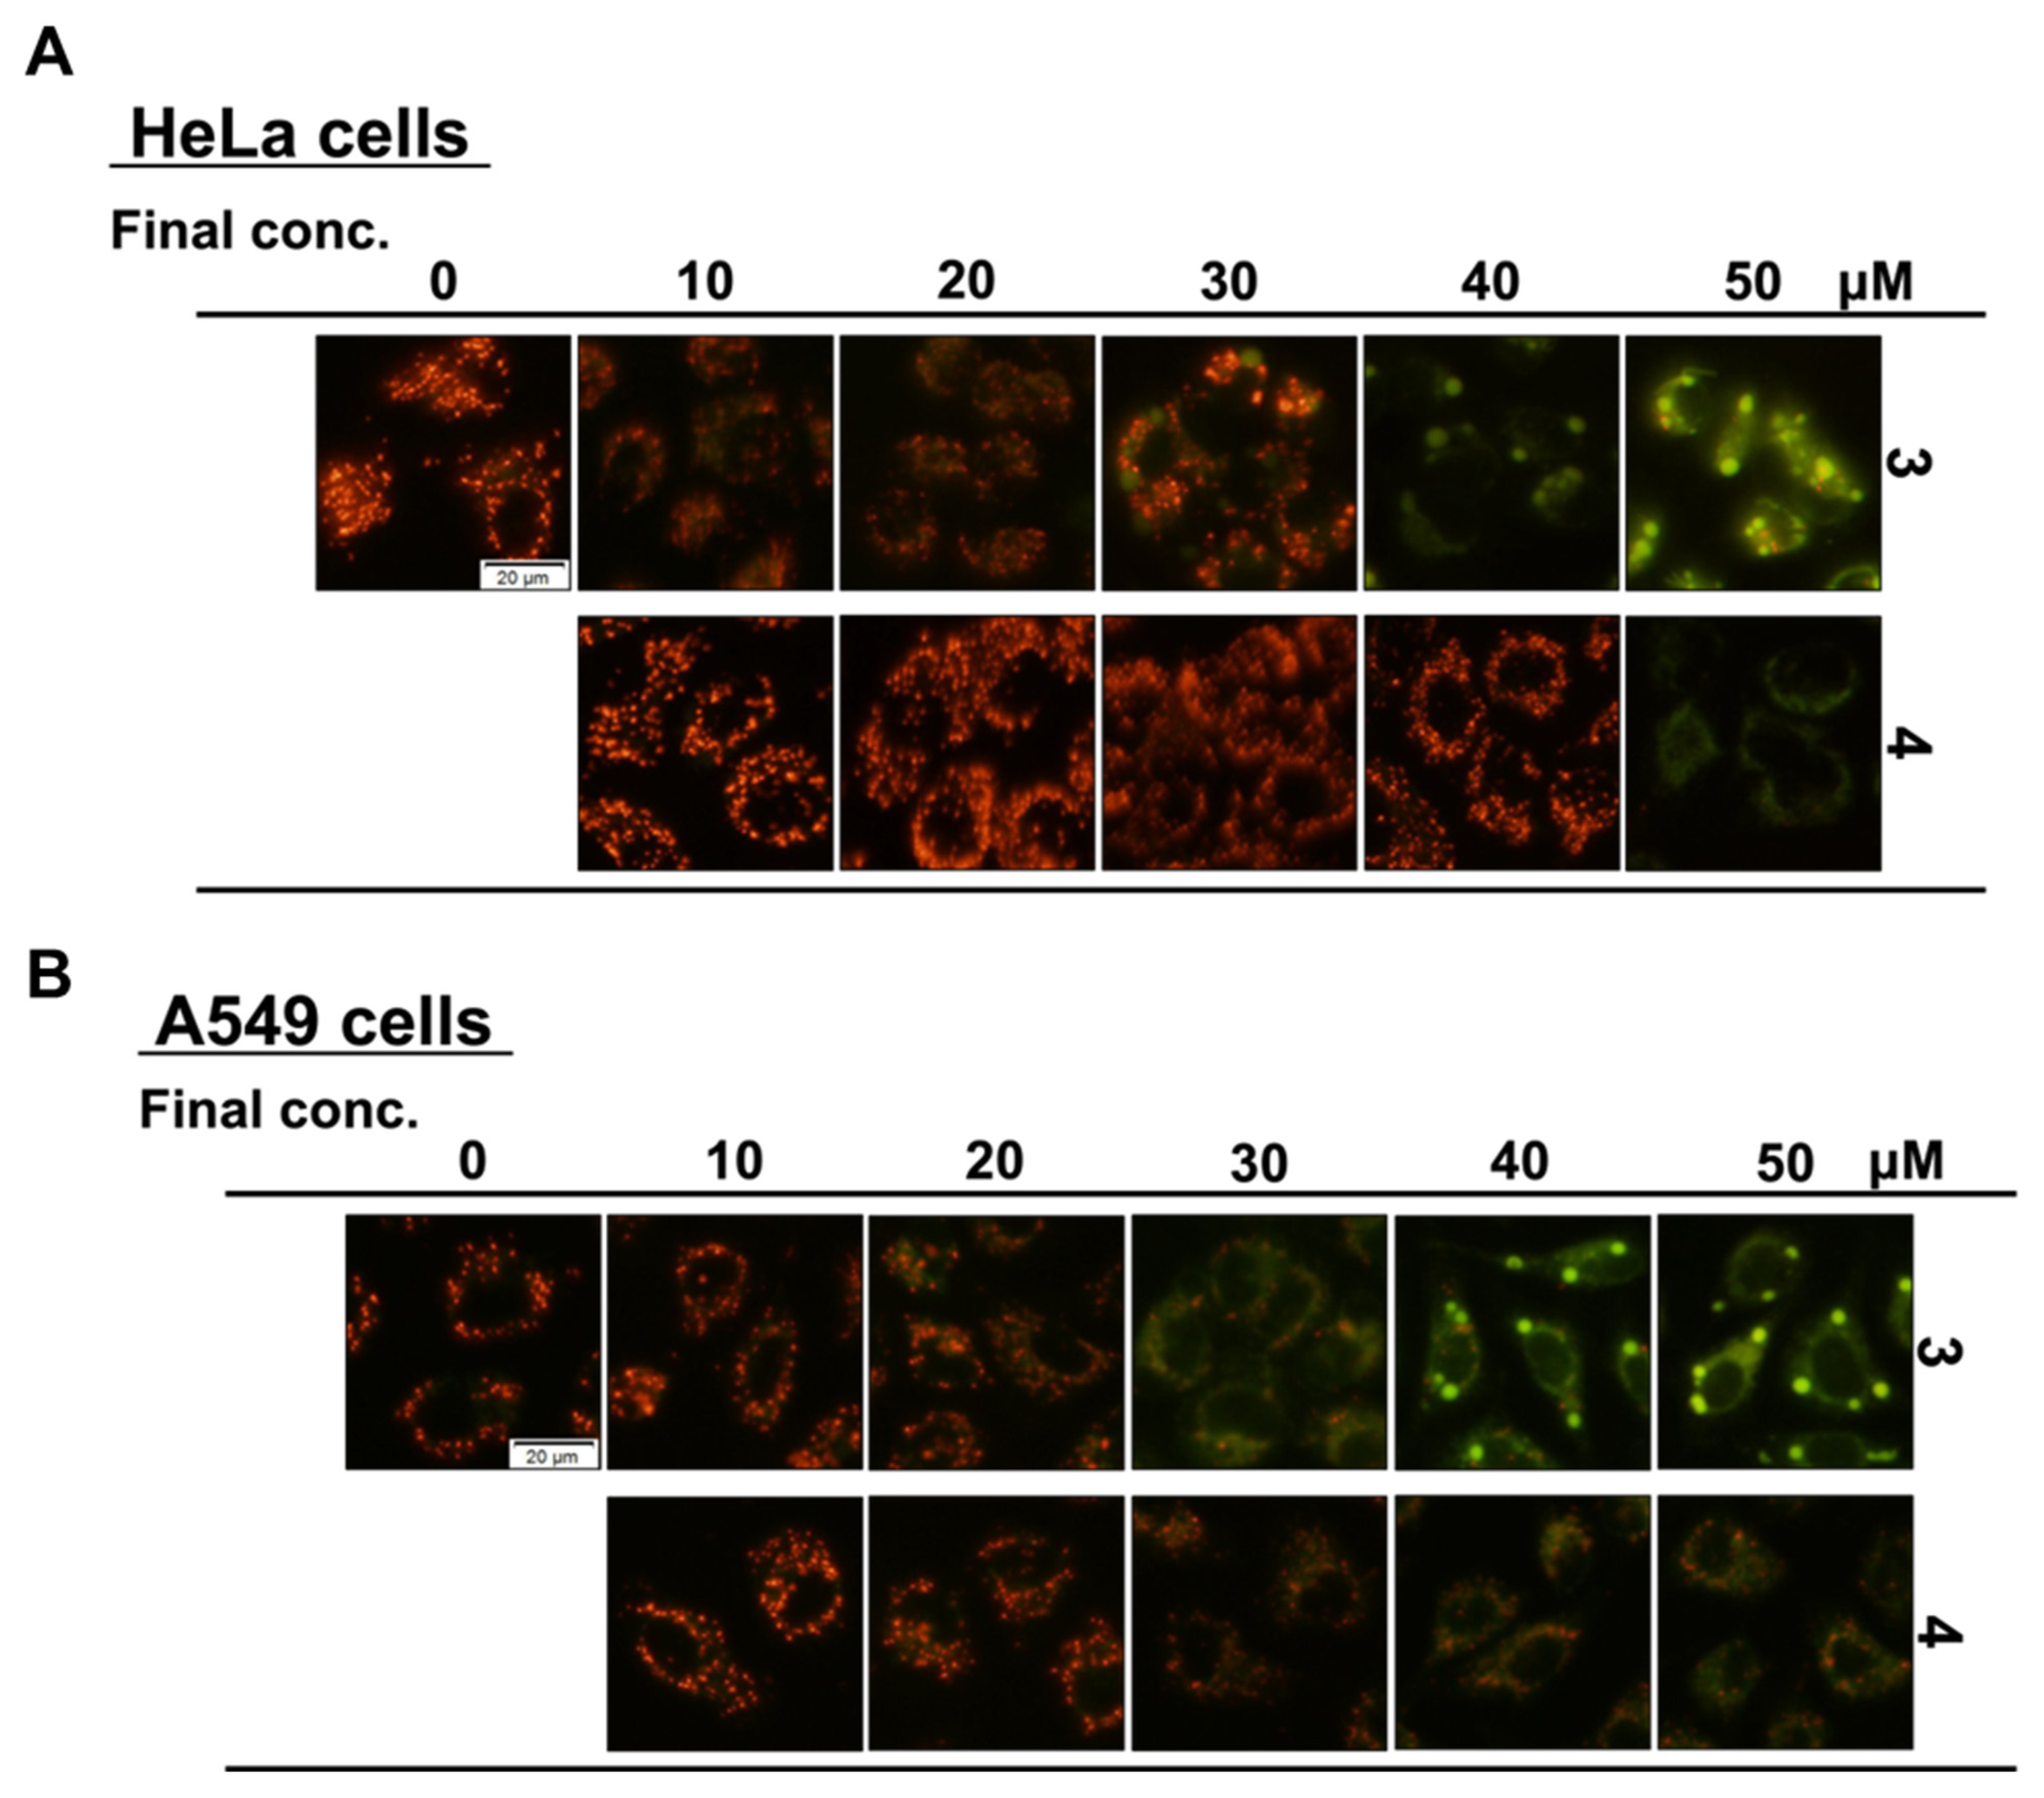
2.5. Mitochondrial Membrane Potential Assay with JC-1

Approximately 40,000 cells in 500 μL medium were counted, added to each well of a 24-well plate, and incubated for 24 h in a 37 °C incubator equilibrated with an atmosphere of 5% CO2 and 95% humidified air. After each synthesized Compound 14 was added to a final concentration of 50 μM and incubated for 1 h; JC-1 solution (Cayman Chemical Co., Ann Arbor, MI, USA) was added under light shielding, incubation was continued for 15 min, the medium was removed, and the cells were washed with JC-1 buffer and observed under an IX73 fluorescence microscope. The mitochondrial membrane potential was measured using a JC-1 assay kit (Cayman Chemical Co., Ann Arbor, MI, USA) according to the manufacturer’s instructions. For each experiment, three or more independent tests were performed in duplicate.

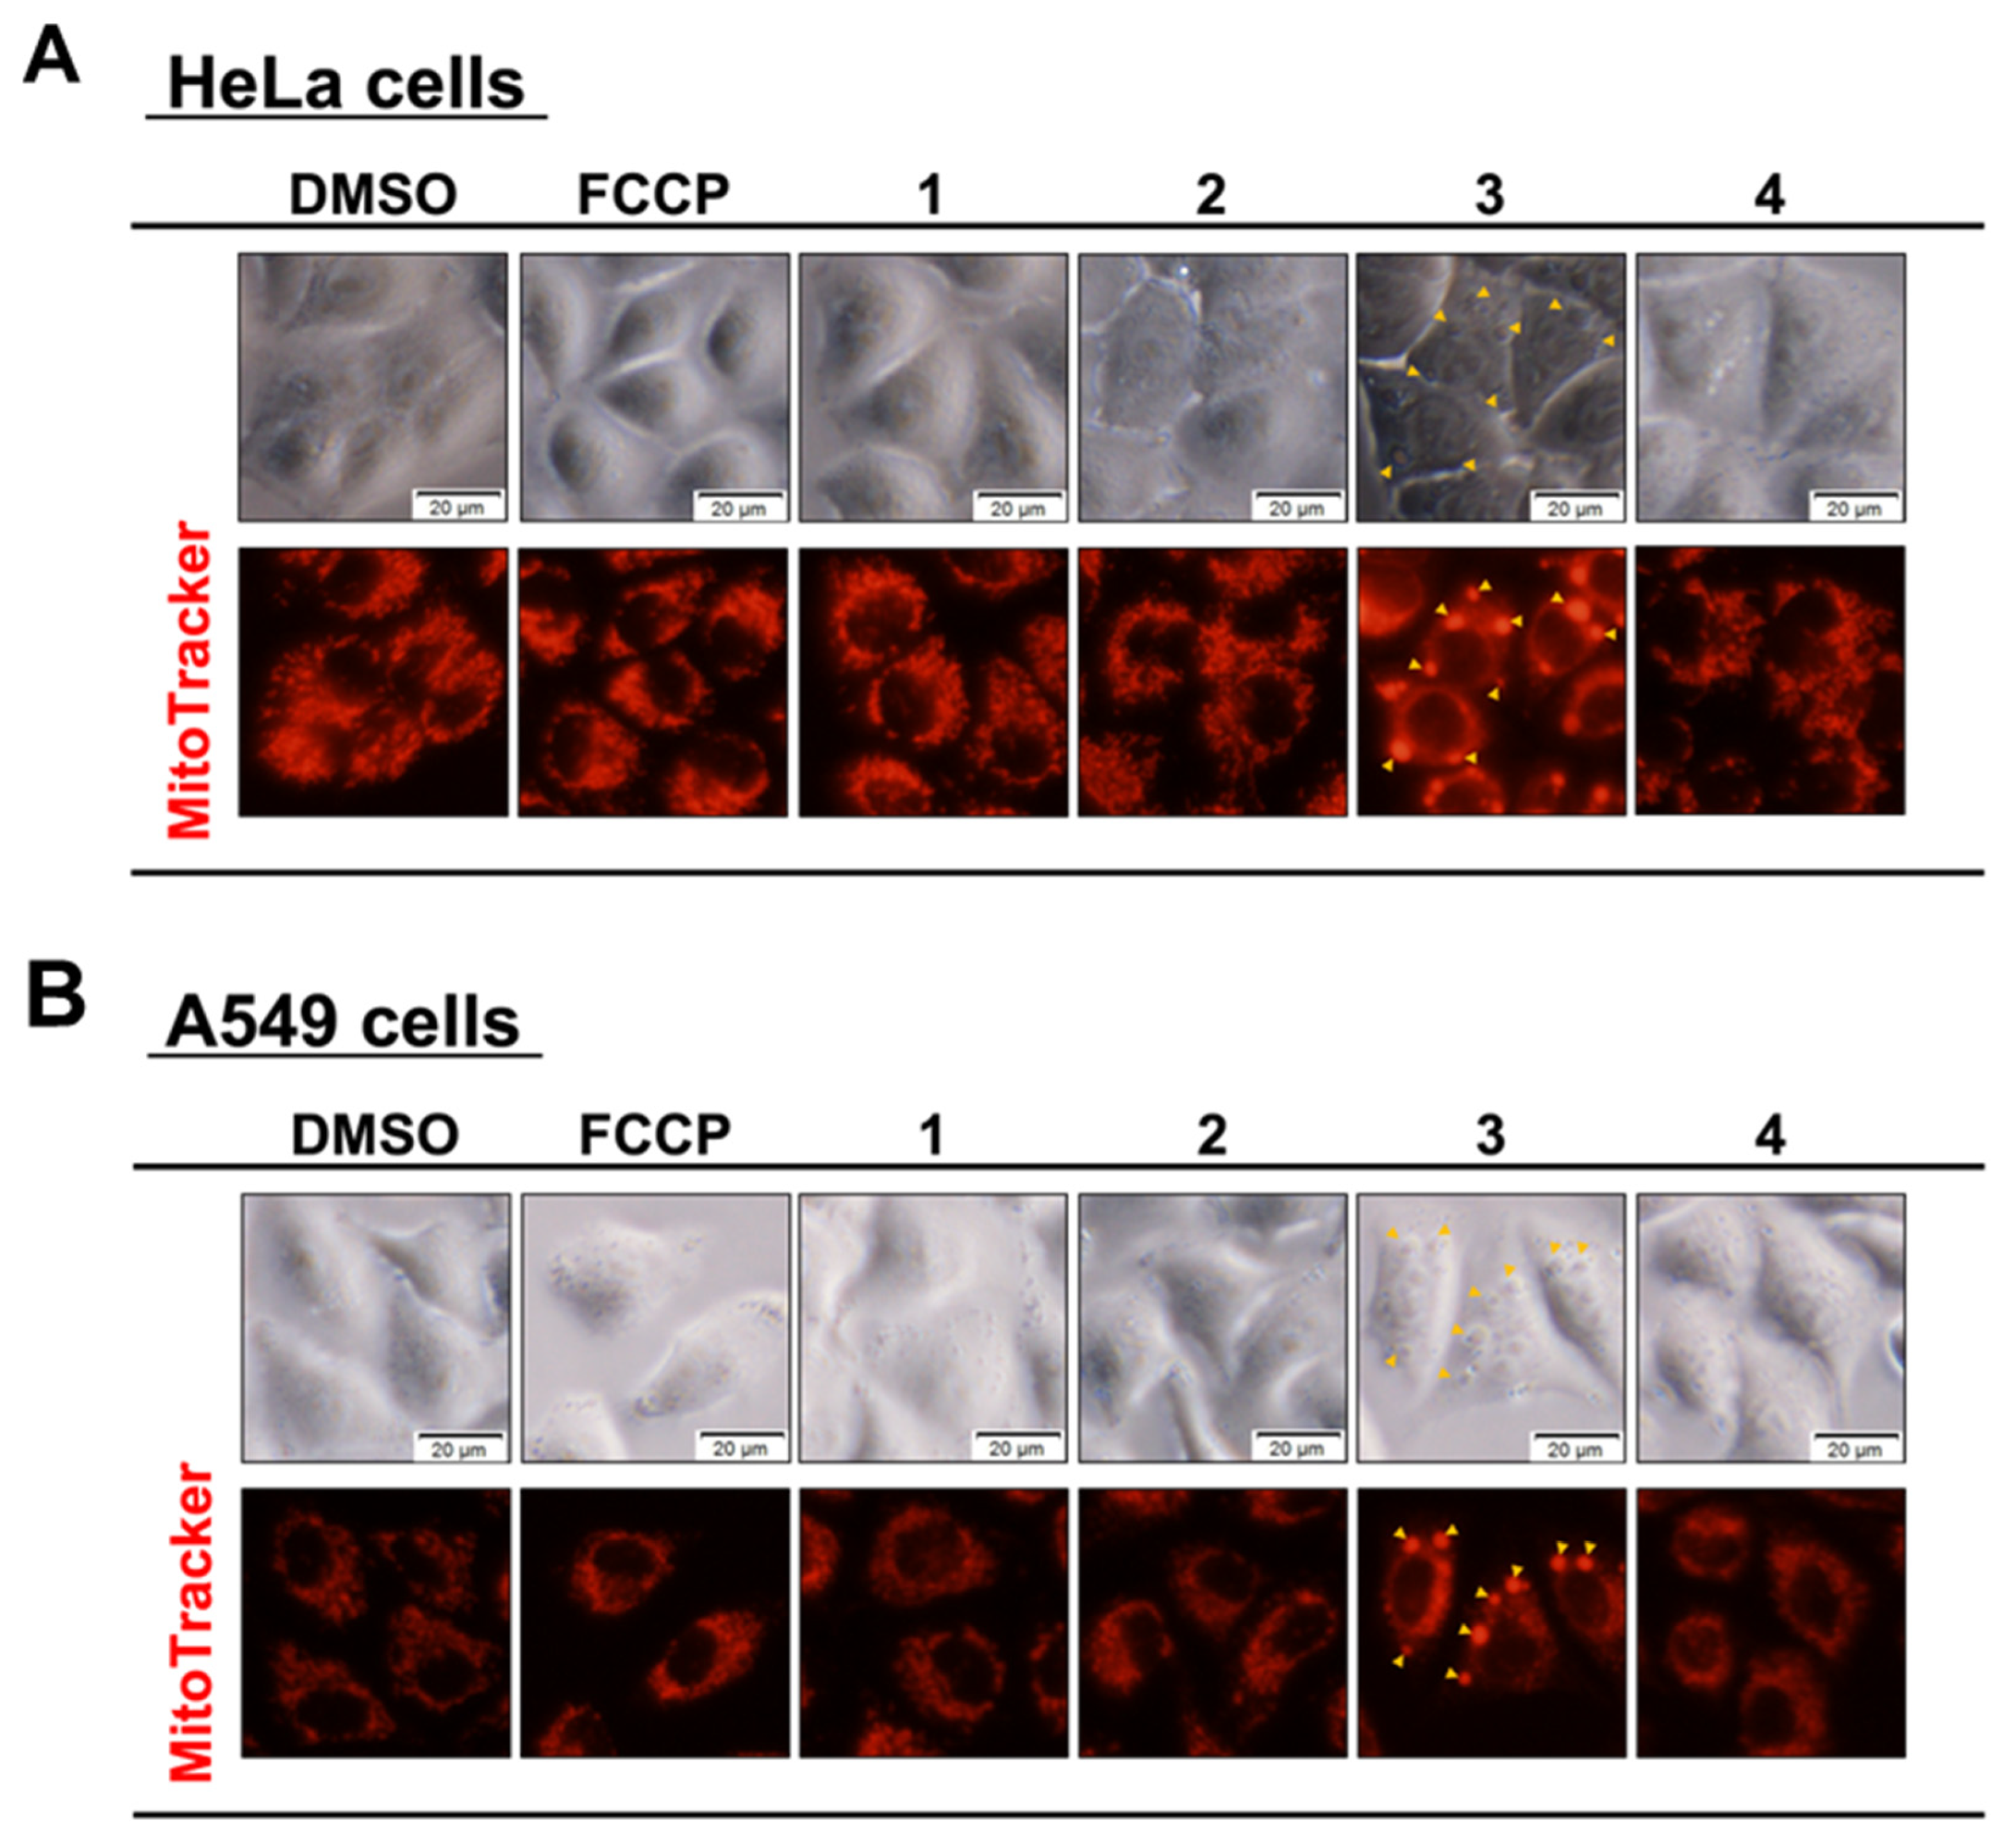
2.6. Mitochondrial Morphological Assay with MitoTrackerTM Red

Approximately 40,000 cells in 500 μL medium were counted, added to each well of a 24-well plate, and incubated for 24 h in a 37 °C incubator equilibrated with an atmosphere of 5% CO2 and 95% humidified air. Five microliters of the synthesized compounds in DMSO were added (final concentration 50 μM) and incubated for 1 h. The mitochondria were stained with MitoTrackerTM Red (Thermo Fisher Scientific, Waltham, MA, USA). Images were acquired using an IX73 fluorescence microscope. For each experiment, three or more independent tests were performed in duplicate.

2.7. Western Blots

Approximately 280,000 cells in 1 mL medium were counted and added to each well of a 12-well plate and incubated for 24 h in a 37 °C incubator equilibrated with an atmosphere of 5% CO2 and 95% humidified air. Compounds 1, 3, and 4 were added to each well at a final concentration of 10 μM and then incubated for 24 h. Only Compound 2 was added to a final concentration of 50 μM and then incubated for 24 h. The cell proteins were extracted using an ice-cold radioimmunoprecipitation assay (RIPA) buffer (50 mM Tris-HCl (pH 7.4), 0.15 M NaCl, 0.1% SDS, 1% Triton X-100, 1% sodium deoxycholate, 1 mM EDTA) with Protease Inhibitor Cocktail (Nacalai Tesque Inc., Kyoto, Japan). The proteins were separated by gel electrophoresis on 10 and 15% SDS polyacrylamide gels and subsequently transferred onto polyvinylidene difluoride (PVDF) membranes IPVH00010 (Merck MILLIPORE, Burlington, MA, USA). The membranes were blocked with Tris-buffered saline containing 0.1% Tween-20 (TBST) buffer containing 5% (w/v) skim milk powder (FUJIFILM Wako Chemicals Co., Osaka, Japan). The blots were then probed with the corresponding primary antibodies and secondary antibodies. The primary antibodies were Beta Actin (Gene Tex, Irvine, CA, USA) and LC3B (Cell Signaling Technology, Danvers, MA, USA). Horseradish peroxidase-conjugated secondary antibodies (Cell Signaling Technology, Danvers, MA, USA) were used. The blots were visualized using ImmunoStar LD (FUJIFILM Wako Chemicals Co., Osaka, Japan) and C-DiGit (LI-COR Biosciences, Lincoln, NE, USA).

2.8. Statistical Analysis

The results were obtained by MS Excel and analyzed using the Student’s t-test and the analysis of variance (ANOVA) test. A p < 0.05 was set for statistical significance. Basic descriptive statistics were used to describe the data, including the arithmetic means, standard deviations, and percentiles [20,21].

3. Results

3.1. Investigation of Cytotoxicity and Cell Death Induction Mechanism

Structure-activity relationship studies of the galloylated flavan-3-ol derivatives confirmed that Compound 1 (Figure 1), which has a 2,3-cis stereostructure, exhibited high toxicity against HeLa S3 cells. On the contrary, it has also been confirmed that Compound 2 (Figure 1), which is a stereoisomer at the 3-position of Compound 1 and has a 2,3-trans stereostructure, has low cytotoxicity [10]. Synthetic studies and activity measurements of various analogs showed that galloyl groups introduced at both the 3- and 5-positions exhibited high cytotoxicity [11]. By studying the synthesis of further analogs, it was confirmed that fluorinated Compounds 3 and 4 (Scheme S1), which are novel compounds in which the phenolic hydroxyl groups of the galloyl groups of Compounds 1 and 2 are substituted with fluorine, showed high cytotoxicity. Compound 3 is an analog of Compound 1 and has a 2,3-cis-structure, and Compound 4 is an analog of Compound 2 and has a 2,3-trans structure (Figure 1).
The MTT assay was used to evaluate the toxic effects of flavan-3-ol derivatives 14 (Figure 1) on HeLa and A549 cells (Figure 2 and Table 1). The results showed that all 14 compounds reduced the cell viability in both cell lines in a dose-dependent manner and that the cytotoxic effects were significantly stronger for fluorinated 3 and 4 when compared to those of 1 and 2. Similar to the relationship between Compounds 1 and 2, Compound 3, which has a cis-structure, showed higher cytotoxicity than that of Compound 4. Comparing Compounds 1 and 2, increasing the concentrations of Compound 2 did not show the same activity as Compound 1, whereas Compound 4 exhibited similar activity to Compound 3 at increasing concentrations. From the IC50 values in Table 2, the A549 cells tended to be highly sensitive to Compounds 1 and 2, whereas the HeLa cells tended to be highly sensitive to Compounds 3 and 4. These results suggested the possibility that fluorinated Compounds 3 and 4 differed in the activity expression mechanisms of Compounds 1 and 2.
When synthesizing various drugs, studies have shown that the fluorination of compounds is often considered to improve their activity and modify their physical properties [22]. The introduction of fluorine atoms is expected to improve the activity as a result of the mimicry and blocking effects of fluorine [23]. The mimic effect occurs when the substitution of some hydrogen atoms with fluorine in the structure effectively targets the same enzymes and receptors as the compound before the substitution. This is because fluorine is the second smallest atom, after hydrogen. The blocking effect occurs when the introduction of fluorine, which has the greatest electronegativity, into the structure strengthens the C–F bond and increases the stability of the compound against the oxidative metabolism, thus making the compound effective for a longer period of time. However, a simple evaluation of the effect on the cell cycle using Cell-ClockTM suggested that only Compound 1 arrested the cell cycle in the M phase (Figure S1). This indicates that the mechanism of activity expression of Compound 1 is different from that of the other derivatives. Fluorinated derivatives 3 and 4 may exhibit cytotoxicity through a mechanism that is different to that of Compound 1. The cytotoxicity of Compounds 3 and 4 did not appear to be the result of the mimetic effects of fluorine.
To determine the mechanism of toxicity of Compounds 14, their effects on the death of HeLa and A549 cells were examined using three cell death inhibitors and the MTT assay (Figure 3 and Table S1). Three cell death inhibitors were used: the apoptosis inhibitor Z-VAD-FMK (orange bar) [12,13], necrosis inhibitor Necrostatin-1 (gray bar) [14,15], and autophagy inhibitor BAF-A1 (light orange bar) [16,17]. Compounds 1, 3, and 4 with high activity were added at a final concentration of 10 μM, and Compound 2 showed cytotoxicity at a final concentration of 50 μM. When the cultured cells to which Compounds 1 to 4 were added were allowed to coexist with various cell death inhibitors, the increase in the cell survival rate suggested their involvement in cell death. In both the HeLa and A549 cell assays, Compound 1 increased the cell viability only when an apoptosis inhibitor was added. Moreover, in the HeLa cells, Compounds 2 and 3 increased the viability of both the apoptotic and autophagic cells. Compound 2 not only has low cytotoxicity (Figure 2 and Table 2), but it can also inhibit apoptosis and autophagy in both cell types. In the A549 cells, Compounds 2 and 3 inhibited autophagy and increased the cell viability. This effect was also observed in the HeLa cells, and it is considered that this effect was exhibited regardless of cell type. In contrast, in the A549 cells, Compound 1 enhanced necrosis and autophagy, Compound 2 enhanced necrosis, and Compound 3 enhanced apoptosis, thereby promoting cell death. Compound 4, which had high cytotoxicity, did not cancel the effect of any of the four cell death inhibitors in either cell type, but rather enhanced the effect. These results suggested that the four compounds examined in this study have different functional mechanisms.

3.2. Effects of Compounds on Mitochondria and Induction of Mitochondrial Dysfunction

Apoptosis and autophagy are associated with mitochondrial dysfunction. In particular, various studies have been conducted on the functional inactivation of the mitochondria. The phenomenon of mitochondrial aggregation under various environmental conditions, such as hypoxia, has been confirmed. This phenomenon has been reported to be closely related to neurological diseases, such as Alzheimer’s disease, Parkinson’s disease [24], aging [25], cancer cell invasion, and cell death [26]. The excessive intracellular accumulation of reactive oxygen species (ROS) is known to peroxidize cell membrane lipids, ultimately leading to cell death. It may also increase due to the extracellular oxidative stress caused by radiation or drugs [27]. Mitochondria are the main sites of ROS production in vivo, and damage to mitochondria and mitochondrial DNA has been shown to cause ROS production, leading to disease [28,29,30]. Therefore, we confirmed the production of intracellular mitochondrial superoxide (mSOX). The HeLa and A549 cells were treated with Compounds 14. DMSO was used as a negative control, and FCCP [18,19], a mitochondrial uncoupler, was used as a positive control. The cells were treated for 1 h, stained with MitoSOXTM Red, and observed under a fluorescence microscope. In both cell lines, Compounds 1 and 2 showed no significant difference in fluorescence intensity compared with the DMSO and FCCP controls. In contrast, Compounds 3 and 4 showed red fluorescence in both cell lines, confirming the production of mSOX (Figure 4). It has been suggested that the cytotoxicity of Compounds 3 and 4 may be related to mitochondrial dysfunction. In contrast, Compound 1 is thought to have little effect on the mitochondria.
Next, the effects of Compounds 14 on the mitochondrial membrane potential were evaluated (Figure 5). Mitochondria produce ATP, which is the energy needed by cells, via an electron transfer system. When mitochondria receive apoptotic signals and release cytochrome C, it results in an inability to maintain the membrane potential. Therefore, mitochondrial dysfunction was confirmed by observing the mitochondrial membrane potential. HeLa and A549 cells were treated for 1 h with derivatives 1–4. DMSO was used as a negative control, and FCCP was used as a positive control. Changes in the mitochondrial membrane potential were observed with the fluorescent reagent JC-1, which changes color with the membrane potential. Compounds 1 and 2 showed red fluorescence, and no effect on the mitochondrial membrane potential was observed. In contrast, Compounds 3 and 4, in which mSOX was increased (Figure 4), showed green fluorescence, confirming a decrease in mitochondrial membrane potential. In addition, Compound 3 formed granule-like aggregates in the cytoplasm (indicated by the yellow wedge arrow in Figure 5), and this phenomenon was confirmed by optical microscopy. This phenomenon was not observed with the other compounds, such as FCCP, which lowered the mitochondrial membrane potential.
As the granule-like aggregates formed by the addition of Compound 3 were stained with JC-1 and showed green fluorescence, it was assumed that these aggregates contained mitochondria, and an additional experiment was conducted. We hypothesized that the granule material was of mitochondrial origin, so we treated the HeLa and A549 cells with Compounds 14. DMSO was used as a negative control, and FCCP was used as a positive control. The cells were treated for 1 h and then stained with MitotrackerTM RED to observe the mitochondria (Figure 6). Similar to the JC-1 staining results shown in Figure 5, granular aggregates were observed when Compound 3 was added. In the cells in which aggregates were formed, the red fluorescence in areas other than the aggregates decreased, suggesting the possibility that the mitochondria concentration was low. These results suggest that the distribution of the mitochondria changed when granular aggregates were formed. This phenomenon was not observed in the DMSO or FCCP controls, or Compounds 1 and 2. It was also confirmed that granular aggregates were formed immediately after the addition of Compound 3, as observed with an optical microscope. For Compound 4, no aggregates were observed at the final concentration tested of 50 μM.
Next, we confirmed the concentration dependence of fluorinated Compounds 3 and 4 on the granular aggregate formation (Figure 7). In both the HeLa and A549 cell assays, Compound 3 produced a change in the mitochondrial membrane potential at a final concentration of 30 μM, completely produced green fluorescence at 40 μM, and strongly reduced the membrane potential. Compound 4 affected the membrane potential at a final concentration of 50 μM for the HeLa cells and 40 μM for the A549 cells. It was suggested that the A549 cells tended to be more sensitive than the HeLa S3 cells to the group of compounds investigated in this study. As shown in Figure 5, Compound 3 produced granular aggregates; however, at higher concentrations, Compound 4 also produced granular aggregates at a final concentration of 60 μM (Figure S2). These results suggested that fluorinated Compounds 3 and 4, which were found from structure-activity relationship studies of flavan-3-ol derivatives 1 and 2, affected the mitochondria and induced cell death. We believe that this cannot be explained by the mimicking effect of fluorine and the influence of stability.

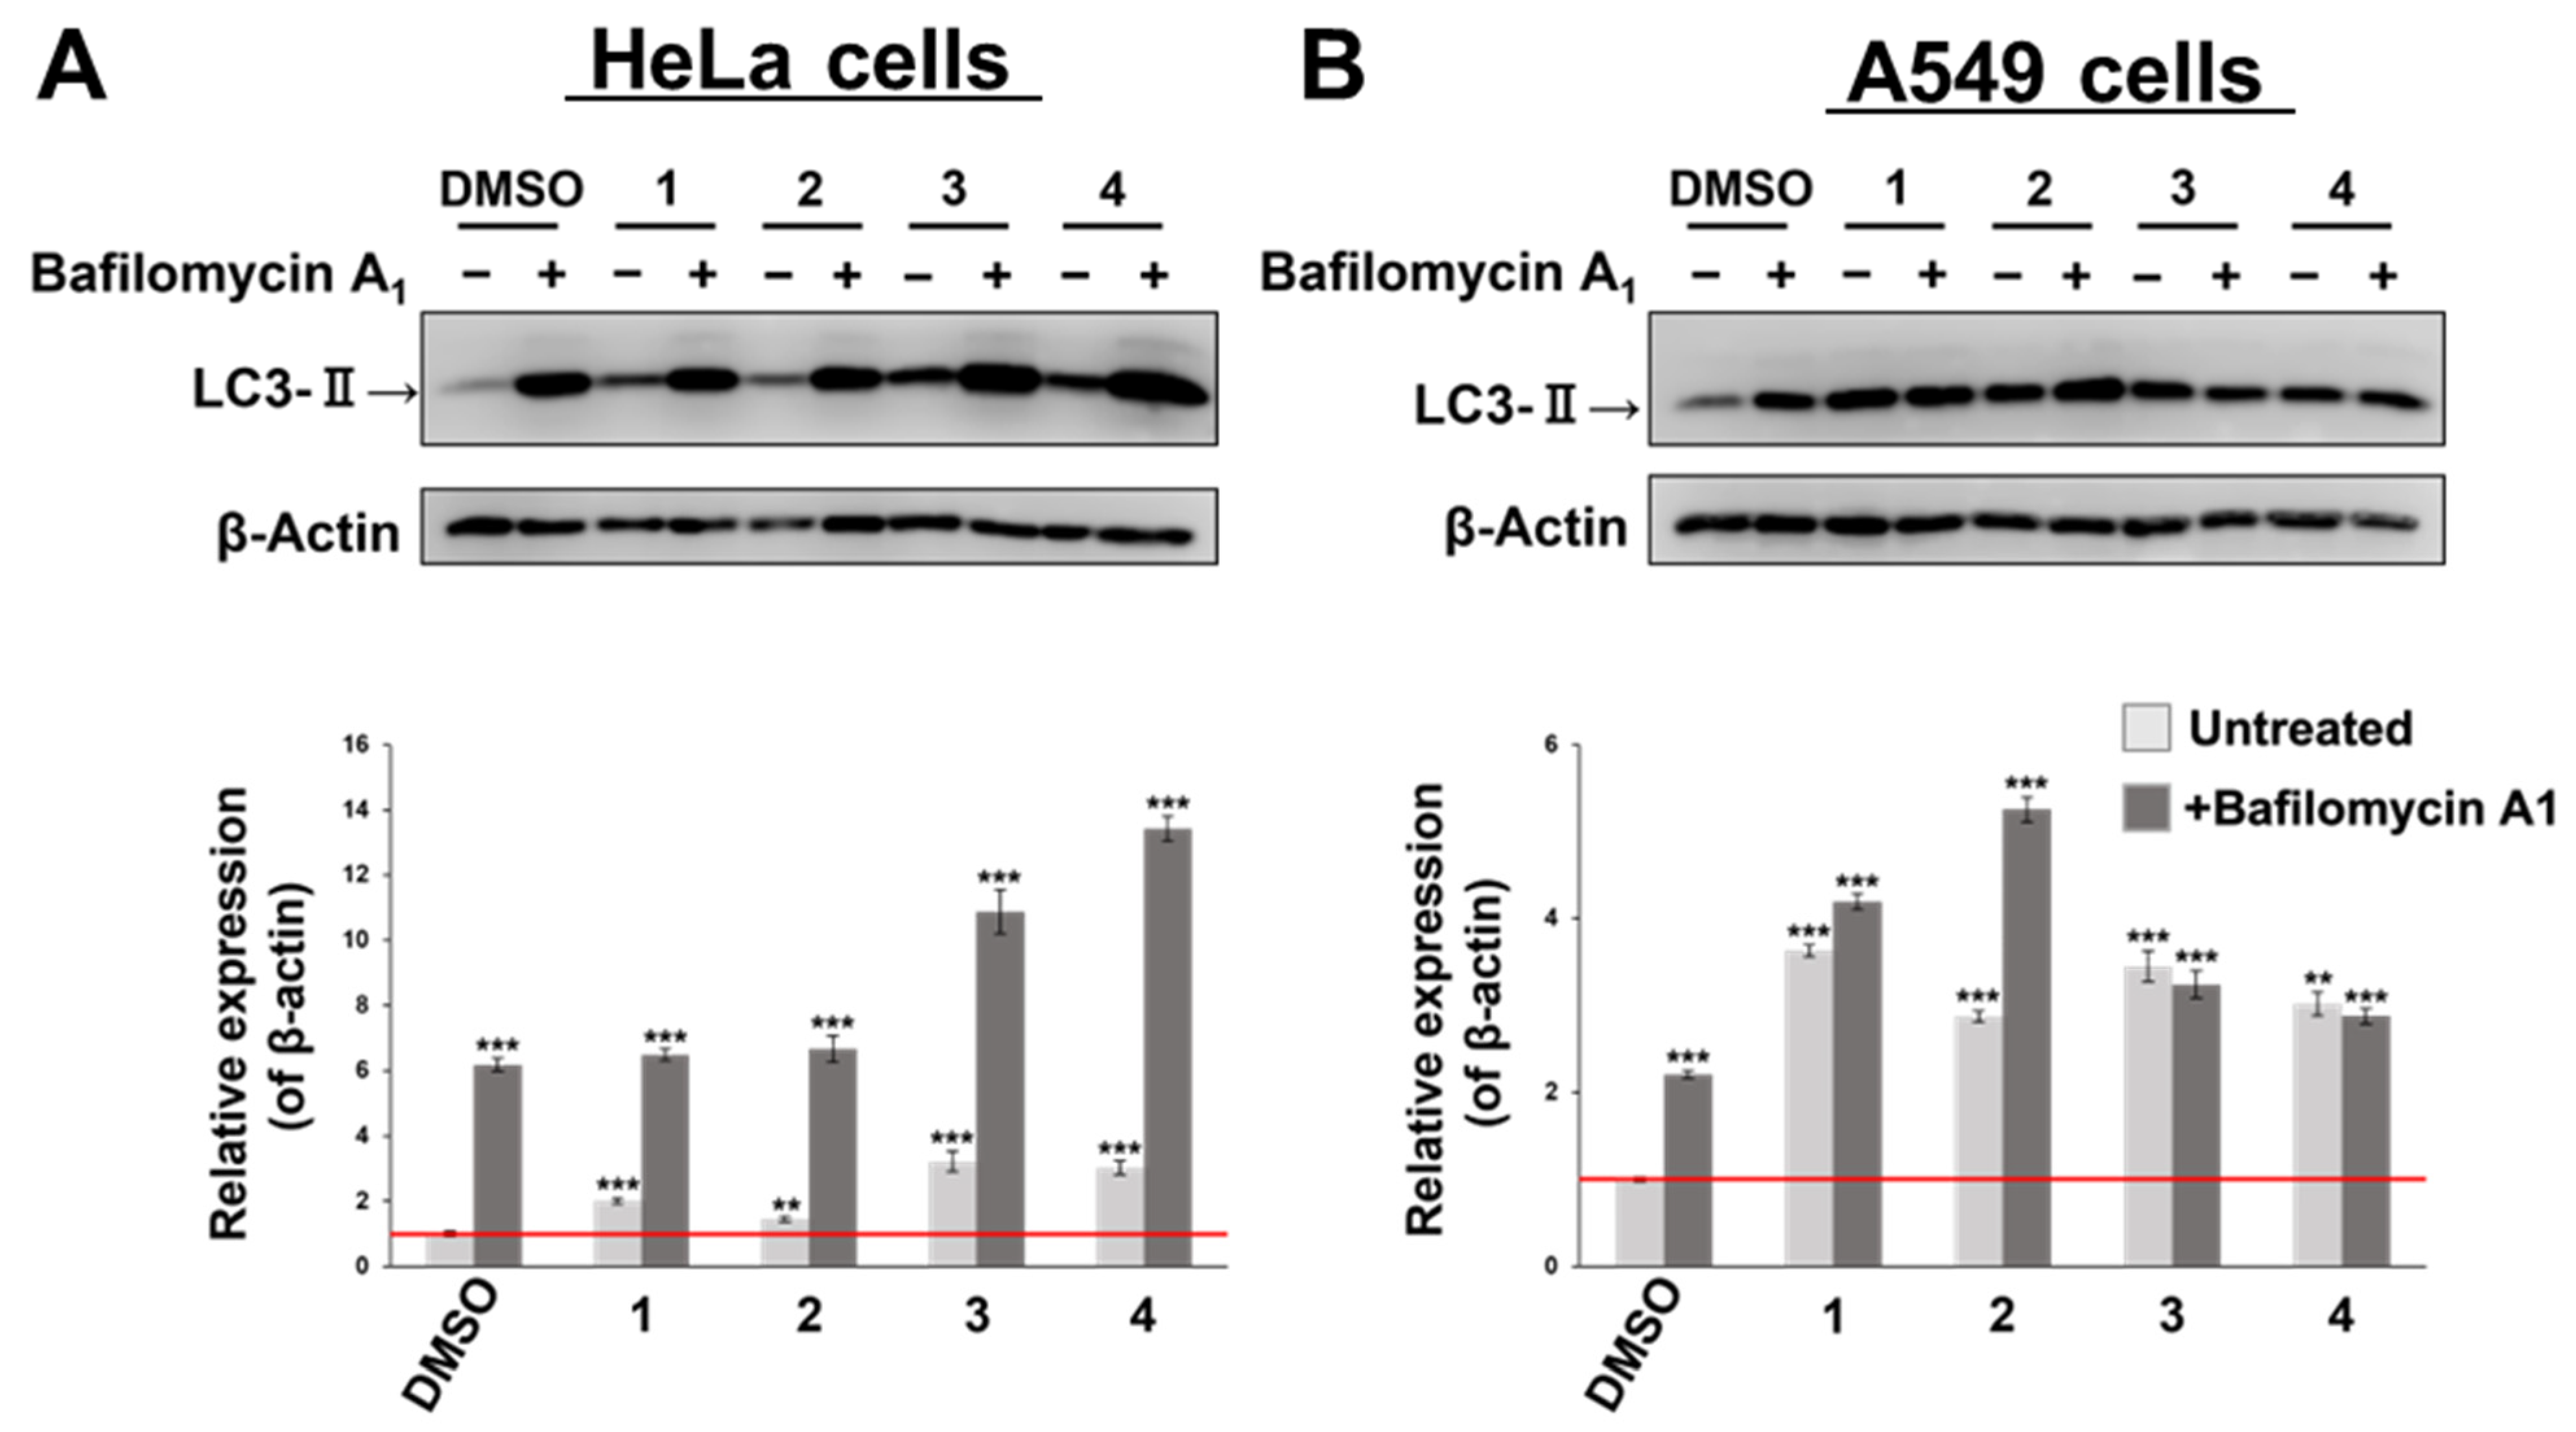
3.3. Confirmation of Autophagy Induction Using LC3-II Accumulation as an Index

Damaged mitochondria are removed by mitophagy, which also removes apoptosis-regulating proteins present in the mitochondria, thereby promoting apoptosis [31,32]. As shown in Figure 2, Compounds 2 and 3 improved the cell survival by inhibiting apoptosis and autophagy. In addition, Compounds 3 and 4 may have pronounced effects on the mitochondria. Considering that these findings suggest the possibility that autophagy degradation (mitophagy) is involved in cell death, we examined the amount of the autophagy-related protein LC3-II by Western blotting [33,34,35,36]. The HeLa and A549 cells were treated with 10 µM of Compounds 1, 3, and 4, and 50 µM of Compound 2, the concentration at which cytotoxicity occurred. BAF-A1 is a specific inhibitor of type V ATPase that inhibits the fusion of autophagosomes and lysosomes. If the LC3-II levels increase when BAF-A1 is added, autophagy is promoted. The results are shown in Figure 8 and Table 3. The results are shown in Figure 8. First, in the HeLa cells, Compounds 1, 3, and 4 increased the amount of LC3-II compared to that in the DMSO-treated cells, whereas Compound 2 did not significantly change (light gray bars). The addition of BAF-A1 increased the amount of LC3-II for all four compounds, but Compounds 1 and 2 were comparable to DMSO (dark-gray bars). In particular, fluorinated Compounds 3 and 4 significantly increased the amount of LC3-II compared to that of the DMSO treatment, suggesting that Compounds 3 and 4 have autophagy-promoting functions. In contrast, in the A549 cells, Compounds 14 significantly increased the amount of LC3-II compared to that of the DMSO treatment, confirming that autophagy was enhanced; however, the addition of BAF-A1 only affected Compound 2. Compounds 1, 3, and 4 did not significantly alter the amount of LC3-II. This suggests that this may not be due to an autophagy-promoting effect in A549 cells, but due to the inhibition of autophagic flux, a series of proteolytic pathways.

4. Discussion

We have been interested in the functionality of flavan-3-ol derivatives and have been conducting structure-activity relationship studies. Among the naturally occurring flavan-3-ol derivatives, we are particularly interested in the functionality of the trace components [37,38]. Although many flavan-3-ol derivatives are present in various plants, it is difficult to isolate and evaluate the individual compounds purely because they exist as aggregates of trace components. Therefore, we have been conducting research to secure pure compounds via chemical synthesis [39]. The main purposes of our study were to discover the basic skeleton of the compounds whose functionality has not been clarified thus far because they are trace components and to construct a new series of functional compounds. In a previous report, synthesizing various EGCG analogs and confirming their toxicity against HeLa S3 cells demonstrated that Compound 1 had higher activity than EGCG [10]. Compound 1 is a natural product present in very small amounts in a green tea catechin mixture containing EGCG as the main component [40]. Therefore, based on the skeleton of Compound 1, we started our synthetic research on non-natural substances and synthesized Compounds 3 and 4 (Figure 1). As mentioned in the results section, fluorination is often used in drug development to improve drug functionality and stability. In addition, the raw materials for synthesizing Compounds 3 and 4 are available at a low cost. The ability to easily provide large amounts of compounds is important in basic research. When we started our synthetic studies, we thought that fluorinated Compounds 3 and 4 would exhibit mimicking and activity-enhancing effects, and we expected them to enhance the activity of Compounds 1 and 2 (Figure 1). However, as the evaluation progressed, Compounds 3 and 4 were found to exhibit different functionalities. A difference in activity expression was confirmed between HeLa and A549 cells. To date, studies have not led to a definite conclusion; however, HeLa and A549 cells differ in the cancer tissues in which the cells are established, such as cervical cancer and alveolar basal epithelial adenocarcinoma. There is a possibility that the activity against other cancer cells may differ, and we plan to investigate this in the future.
Figure 2 and Table 1 and Table 2 confirm that Compound 1 exhibits moderate toxicity and Compound 2 exhibits low toxicity in both HeLa and A549 cells. Compounds 1 and 2 are isomers that differ only at the 3-position, suggesting that the 2,3-cis-structure is important for their activity (Figure 1). Fluorinated Compounds 3 and 4 showed higher cytotoxicity than that of Compound 1 at lower concentrations. At this time, it was confirmed that Compound 3, which has a 2,3-cis-structure, has higher cytotoxicity, suggesting that the basic skeleton also affects the activity of Compounds 3 and 4, in which a fluorine element is introduced into the compound structure, and are thought to have improved lipophilicity over Compounds 1 and 2. It was suggested that the lipophilicity of the compound was improved, and the effect was exerted by permeating the cell membrane. It is well-known that increasing the lipophilicity of compounds by fluorination increases their cytotoxicity [41]. When we also confirmed the toxicity with normal cells (lung fibroblast WI-38 cells), we found that Compounds 3 and 4 had higher toxicity than Compounds 1 and 2.
As the cytotoxicity of Compounds 14 was different, it was possible that the mechanism of cell death induction was different; therefore, we performed an analysis using a cell death inhibitor (Figure 2). Studies with preliminarily HeLa S3 cells have shown that Compound 1 arrests the M phase of the cell cycle (Figure S1), while other compounds have no effect on the cell cycle. Therefore, we investigated three types of cell death inhibitors: apoptosis, necrosis, and autophagy inhibitors. There are reports on the apoptosis-inducing activity and autophagy-promoting function of the polyphenol compounds derived from food and plants [42]. Therefore, it is highly likely that Compounds 14, with phenolic hydroxyl groups used in this study, have these functions. In addition, Compounds 3 and 4 have higher fat solubility than Compounds 1 and 2, owing to fluorination. We hypothesized that highly hydrophobic compounds may directly affect the lipid bilayer membrane of the cell by disrupting the membrane and inducing necrosis. Therefore, we hypothesized that additional information could be obtained by simultaneously adding Compounds 14 and a cell death inhibitor. As a result, it was suggested that Compound 1 might induce apoptosis, whereas fluorinated Compound 3 might be involved in autophagy. Interestingly, fluorinated Compound 4 was suggested to be less involved in both apoptosis and autophagy, despite its high cytotoxicity. In addition, the fluorinated compounds had almost no effect on necrosis. This suggests that the lipophilicity of the compound is unlikely to disrupt cell membranes. Furthermore, Compounds 3 and 4, which have the same number of fluorine elements, behaved differently, suggesting that the lipophilicity of the compounds does not play a significant role in their activity. Furthermore, polyphenol compounds have the potential to chelate metals in cells and affect the removal of ROS; we also investigated the involvement of ferroptosis [43,44]. However, it was suggested that Compounds 14 did not affect ferroptosis.
Apoptosis and autophagy are closely related to the accumulation of intracellular ROS and mitochondrial dysfunction, which are central to ROS production [27,28,29,30]. Therefore, we examined the mSOX and mitochondrial membrane potential (Figure 4 and Figure 5). Compounds 1 and 2 had no effect, but fluorinated Compounds 3 and 4 increased the amounts of mSOX and lowered their membrane potential. Therefore, it was suggested that Compounds 3 and 4 caused damage to the mitochondria. Excess intracellular ROS can further damage mitochondria, and the accumulation of damaged mitochondria can lead to apoptosis [27]. Interestingly, the addition of Compounds 3 and 4 caused the mitochondria to form granular aggregates (Figure 6 and Figure 7). Granular aggregate formation begins immediately after the addition of the compound, forming large granules that are visible under a light microscope. It is thought that this aggregate formation causes significant damage to the mitochondria. Compound 3, with its 2,3-cis-structure, was highly active in mSOX production, the loss of the mitochondrial membrane potential, and granular aggregate formation. As the granular aggregates were clearly stained with the mitochondrial membrane potential detection reagent JC-1, we assumed that they contained mitochondria. There was a change in the mitochondrial distribution around the locations where the aggregates were formed. From this result, we hypothesized that the granular aggregates formed by fluorinated Compounds 3 and 4 contained mitochondria, which caused mitochondrial dysfunction.
Damaged mitochondria are removed by mitophagy, which induces apoptosis and causes cell death [32]. Figure 3 suggests that Compound 3 may be involved in autophagy, suggesting the possibility of promoting autophagy due to mitochondrial dysfunction. Therefore, we confirmed the intracellular increase in LC3-II, an indicator of autophagy, using western blotting (Figure 8). Although the results differed depending on the cell type, it was confirmed that Compounds 14 promoted autophagy in the HeLa cells, with Compounds 3 and 4 being particularly effective. The addition of BAF-A1 further increased the amount of LC3-II; therefore, it was determined that the promotion effect was high. In contrast, the A549 cells also showed an increase in the amount of LC3-II, but the addition of BAF-A1 did not change this, except for Compound 2. Based on these results, we believe that fluorinated Compounds 3 and 4 induce cell death by promoting autophagy and causing mitochondrial dysfunction. We hypothesized that mSOX increases and the loss of mitochondrial membrane potential occurs during this process. It has been reported that an increase in ROS caused by irradiation promotes mitochondrial aggregation [26], suggesting that an increase in mSOX may lead to the formation of granular aggregates. However, to the best of our knowledge, there are no cases where similar granular aggregates were detected by adding a compound; therefore, it is possible that the mechanism is different.

5. Conclusions

We were interested in flavan-3-ol derivatives and evaluated their functionality using synthetic Compounds 14. It was suggested that fluorinated Compounds 3 and 4 have different activity expression mechanisms from their lead compounds, Compounds 1 and 2. Compounds 3 and 4 caused some damage to the mitochondria, increased the amount of mSOX, and formed granular aggregates containing mitochondria. In addition, as it has been suggested that Compounds 3 and 4 promote autophagy, cell death is thought to be caused by autophagy via mitochondrial damage. Intriguingly, the fluorinated compounds caused the malfunction of granules containing mitochondria. It may contribute to diseases related to mitochondrial dysfunction. Currently, we are planning to synthesize compounds to elucidate the mechanism of Compounds 14 in more detail, search for intracellular targets of compounds, and further investigate the functionality of flavan-3-ol derivatives.

Supplementary Materials

The following supporting information can be downloaded at https://www.mdpi.com/article/10.3390/biochem3020005/s1, Scheme S1: Synthesis of fluorinated compounds 3 and 4; Figure S1: Simple evaluation of the effects of compounds 14 on the cell cycle using Cell-ClockTM; Figure S2: Compound 4 forms granular aggregates at high concentrations; Table S1: ANOVA statistical processing results for cell viability in Figure 3.

Author Contributions

Conceptualization, R.D. and A.S.; synthesis, R.D. and Y.N.; methodology, R.D. and A.S.; writing—original draft preparation, R.D.; writing—review and editing, A.S.; supervision, A.S.; project administration, A.S.; funding acquisition, A.S. All authors have read and agreed to the published version of the manuscript.

Funding

This work was supported by BRAIN: Program for Promotion of Basic and Applied Research for Innovations in Bio-oriented Industry (GR104, A.S.), the Technology Research Promotion Program for Agriculture, Forestry, Fisheries, and Food Industry (A.S.), the Tojuro Iijima Foundation for Food and Technology (A.S.) and the Kurata Memorial Hitachi Science and Technology Foundation (A.S.).

Informed Consent Statement

Not applicable.

Data Availability Statement

Not applicable.

Acknowledgments

We are grateful to Yushi Futamura for helpful discussions and comments on the manuscript.

Conflicts of Interest

The authors declare no conflict of interest.

References

  1. Toda, M.; Okubo, S.; Ikigai, H.; Suzuki, T.; Suzuki, Y.; Hara, Y.; Shimamura, T. The protective activity of tea catechins against experimental infection by Vibrio cholerae O1. Microbiol. Immunol. 1992, 36, 999–1001. [Google Scholar] [CrossRef] [PubMed]
  2. Katsuno, M. Benifuuki tea suppresses histamine signaling and matrix metalloproteinase—9. Expression in TDI—Sensitized nasal allergy model rats. Jpn. Pharmacol. Ther. 2013, 41, 577–585. [Google Scholar]
  3. Maeda, Y.M.; Ema, K.; Monobe, M.; Shibuichi, I.; Shinoda, Y.; Yamamoto, T.; Fujisawa, T. The efficacy of early treatment of seasonal allergic rhinitis with benifuuki green tea containing O-methylated catechin before pollen exposure: An open randomized study. Allergol. Int. 2009, 58, 437–444. [Google Scholar] [CrossRef] [PubMed] [Green Version]
  4. Hu, B.; Ting, Y.; Zeng, X.; Huang, Q. Bioactive peptides/chitosan nanoparticles enhance cellular antioxidant activity of (−)-epigallocatechin-3-gallate. J. Agric. Food Chem. 2013, 61, 875–881. [Google Scholar] [CrossRef]
  5. Farhan, M. Green tea catechins: Nature’s way of preventing and treating cancer. Int. J. Mol. Sci. 2022, 23, 10713. [Google Scholar] [CrossRef]
  6. Mokra, D.; Joskova, M.; Mokry, J. Therapeutic effects of green tea polyphenol (–)-epigallocatechin-3-gallate (EGCG) in relation to molecular pathways controlling inflammation, oxidative stress, and apoptosis. Int. J. Mol. Sci. 2023, 24, 340. [Google Scholar]
  7. Tachibana, H.; Koga, K.; Fujimura, Y.; Yamada, K. A receptor for green tea polyphenol EGCG. Nat. Struct. Mol. Biol. 2004, 11, 380–381. [Google Scholar] [CrossRef]
  8. Kumazoe, M.; Sugihara, K.; Tsukamoto, S.; Huang, Y.; Tsurudome, Y.; Suzuki, T.; Suemasu, Y.; Ueda, N.; Yamashita, S.; Kim, Y.; et al. 67-kDa laminin receptor increases cGMP to induce cancer-selective apoptosis. J. Clin. Investig. 2013, 123, 787–799. [Google Scholar] [CrossRef] [PubMed]
  9. Kim, Y.H.; Fujimura, Y.; Hagihara, T.; Sasaki, M.; Yukihira, D.; Nagao, T.; Miura, D.; Yamaguchi, S.; Saito, K.; Tanaka, H.; et al. In situ label-free imaging for visualizing the biotransformation of a bioactive polyphenol. Sci. Rep. 2013, 3, 2805. [Google Scholar] [CrossRef] [PubMed] [Green Version]
  10. Mori, K.; Ayano, Y.; Hamada, Y.; Hojima, T.; Tanaka, R.; Higashino, Y.; Izuno, M.; Okamoto, T.; Kawasaki, T.; Hamada, M.; et al. Role of 2,3-cis structure of (−) -epicatechin-3,5-O-digallate in inhibition of HeLa S3 cell proliferation. Nat. Prod. Chem. Res. 2015, 3, 172. [Google Scholar]
  11. Hojima, T.; Komeda, S.; Higashino, Y.; Hamada, M.; Nakajima, N.; Kawasaki, T.; Saito, A. Role of 3,5-digalloyl and 3’,4’-dihydroxyl structure of (–)-epicatechin-3,5-digallate in inhibition of Hela S3 cell proliferation. Nat. Prod. Chem. Res. 2017, 5, 250. [Google Scholar] [CrossRef]
  12. Slee, E.A.; Zhu, H.; Chow, S.C.; MacFarlane, M.; Nicholson, D.W.; Cohen, G.M. Benzyloxycarbonyl-Val-Ala-Asp (OMe) fluoromethylketone (Z-VAD.FMK) inhibits apoptosis by blocking the processing of CPP32. Biochem. J. 1996, 315, 21–24. [Google Scholar] [CrossRef] [Green Version]
  13. Jo, M.H.; Kim, Y.T.; Park, S.J. Dieckol inhibits autophagic flux and induces apoptotic cell death in A375 human melanoma cells via lysosomal dysfunction and mitochondrial membrane impairment. Int. J. Mol. Sci. 2022, 23, 14149. [Google Scholar] [CrossRef]
  14. Degterev, A.; Huang, Z.; Boyce, M.; Li, Y.; Jagtap, P.; Mizushima, N.; Cuny, G.D.; Mitchison, T.J.; Moskowitz, M.A.; Yuan, J. Chemical inhibitor of nonapoptotic cell death with therapeutic potential for ischemic brain injury. Nat. Chem. Biol. 2005, 1, 112–119. [Google Scholar] [CrossRef]
  15. Borges, A.A.; Souza, M.P.; Fonseca, A.C.C.; Wermelinger, G.F.; Ribeiro, R.C.B.; Amaral, A.A.P.; Carvalho, C.J.C.; Abreu, L.S.; Queiroz, L.N.; Almeida, E.C.P.; et al. Chemoselective synthesis of mannich adducts from 1,4-naphthoquinones and profile as autophagic inducers in oral squamous cell carcinoma. Molecules 2023, 28, 309. [Google Scholar]
  16. Stojanov, S.J.; Kostić, A.; Ljujić, M.; Lupšić, E.; Schenone, S.; Pešić, M.; Dinić, J. Autophagy inhibition enhances anti-glioblastoma effects of pyrazolo[3,4-d]pyrimidine tyrosine kinase inhibitors. Life 2022, 12, 1503. [Google Scholar] [CrossRef] [PubMed]
  17. Divé, I.; Klann, K.; Michaelis, J.B.; Heinzen, D.; Steinbach, J.P.; Münch, C.; Ronellenfitsch, M.W. Inhibition of mTOR signaling protects human glioma cells from hypoxia-induced cell death in an autophagy-independent manner. Cell Death Discov. 2022, 8, 409. [Google Scholar] [CrossRef] [PubMed]
  18. Kane, M.S.; Paris, A.; Codron, P.; Cassereau, J.; Procaccio, V.; Lenaers, G.; Reynier, P.; Chevrollier, A. Current mechanistic insights into the CCCP-induced cell survival response. Biochem. Pharmacol. 2018, 148, 100–110. [Google Scholar] [PubMed]
  19. Panusatid, C.; Thangsiriskul, N.; Peerapittayamongkol, C. Methods for mitochondrial health assessment by high content imaging system. Methods X 2022, 9, 101685. [Google Scholar] [CrossRef] [PubMed]
  20. Begum, S.; Prabhu, V.; Mohanty, V.; Krishnaraj, U.; Abdulla, R. Unveiling the arcanum of formalin-fixed paraffin-embedded archival tissue blocks: A valuable resource for genomic DNA extraction. J. Oral Maxillofac. Pathol. 2022, 26, 289. [Google Scholar] [PubMed]
  21. Kušnierová, P.; Zeman, D.; Hradilic, P.; Čábal, M.; Zapletalová, O. Neurofilament levels in patients with neurological diseases: A comparison of neurofilament light and heavy chain levels. J. Clin. Lab. Anal. 2019, 33, e22948. [Google Scholar] [CrossRef] [Green Version]
  22. Heidelberger, C.; Chaudhuri, N.K.; Danneberg, P.; Mooren, D.; Griesbach, L.; Duschinsky, R.; Schnitzer, R.J.; Pleven, E.; Scheiner, J. Fluorinated pyrimidines. a new class of tumour-inhibitory compounds. Nature 1957, 179, 663–666. [Google Scholar] [CrossRef]
  23. Duschinsky, R.; Pleven, E.; Heidelberger, C. The synthesis of 5-fluoropyrimidines. J. Am. Chem. Soc. 1957, 79, 4559–4560. [Google Scholar] [CrossRef]
  24. Hoffstrom, B.G.; Kaplan, A.; Letso, R.; Schmid, R.S.; Turmel, G.J.; Lo, D.C.; Stockwell, B.R. Inhibitors of protein disulfide isomerase suppress apoptosis induced by misfolded proteins. Nat. Chem. Biol. 2010, 6, 900–906. [Google Scholar] [CrossRef] [Green Version]
  25. Daniel, M.K.; Xia, W.; Barbara, A.S.; Omar, A.I.; Marc, R.V.G.; James, E.B.; Michael, C. Ageing and hypoxia cause protein aggregation in mitochondria. Cell Death Diff. 2017, 24, 1730–1738. [Google Scholar]
  26. Onodera, Y.; Nam, J.M.; Horikawa, M.; Shirato, H.; Sabe, H. Arf6-driven cell invasion is intrinsically linked to TRAK1-mediated mitochondrial anterograde trafficking to avoid oxidative catastrophe. Nat. Commun. 2018, 9, 2682. [Google Scholar] [CrossRef] [Green Version]
  27. Indelchik, M.D.P.S.; Begley, T.J.; Melendez, J.A. Mitochondrial ROS control of cancer. Semin. Cancer Biol. 2017, 47, 57–66. [Google Scholar] [CrossRef] [PubMed]
  28. Ogura, A.; Oowada, S.; Kon, Y.; Hirayama, A.; Yasui, H.; Meike, S.; Kobayashi, S.; Kuwabara, M.; Inanami, O. Redox regulation in radiation-induced cytochrome c release from mitochondria of human lung carcinoma A549 cells. Cancer Lett. 2009, 277, 64–71. [Google Scholar] [CrossRef] [PubMed] [Green Version]
  29. Wallace, D.C.; Fan, W.; Procaccio, V. Mitochondrial energetics and therapeutics. Annu. Rev. Pathol. 2010, 5, 297–348. [Google Scholar] [CrossRef] [PubMed] [Green Version]
  30. Indo, H.P.; Davidson, M.; Yen, H.C.; Suenaga, S.; Tomita, K.; Nishii, T.; Higuchi, M.; Koga, Y.; Ozawa, T.; Majima, H.J. Evidence of ROS generation by mitochondria in cells with impaired electron transport chain and mitochondrial DNA damage. Mitochondrion 2007, 7, 106–118. [Google Scholar] [CrossRef]
  31. Saita, S.; Shirane, M.; Nakayama, I.K. Selective escape of proteins from the mitochondria during mitophagy. Nat. Commun. 2013, 4, 1410. [Google Scholar] [CrossRef] [Green Version]
  32. Bock, F.J.; Stephen, W.G.T. Mitochondria as multifaceted regulators of cell death. Nat. Rev. Mol. Cell Biol. 2020, 2, 85–100. [Google Scholar] [CrossRef] [PubMed]
  33. Jiang, P.; Mizushima, N. LC3- and p62-based biochemical methods for the analysis of autophagy progression in mammalian cells. Methods 2015, 75, 13–18. [Google Scholar] [CrossRef] [PubMed]
  34. Mizushima, N.; Yoshimori, T. How to interpret LC3 immunoblotting. Autophagy 2007, 3, 542–545. [Google Scholar] [CrossRef] [PubMed]
  35. Kabeya, Y.; Mizushima, N.; Ueno, T.; Yamammoto, A.; Kirisako, T.; Noda, T.; Kominami, E.; Ohsumi, Y.; Yoshimori, T. LC3, a mammalian homologue of yeast Apg8p, is localized in autophagosome membranes after processing. EMBO J. 2000, 19, 5720–5728. [Google Scholar] [CrossRef] [PubMed]
  36. Yoshii, R.S.; Mizushima, N. Monitoring and measuring autophagy. Int. J. Mol. Sci. 2017, 18, 1865. [Google Scholar] [CrossRef] [PubMed]
  37. Higashino, Y.; Okamoto, T.; Mori, K.; Kawasaki, T.; Hamada, M.; Nakajima, N.; Saito, A. Regioselective synthesis of procyanidin B6, a 4-6-condensed (+)-catechin dimer, by intramolecular condensation. Molecules 2018, 23, 205. [Google Scholar] [CrossRef] [Green Version]
  38. Hamada, Y.; Takano, S.; Ayano, Y.; Tokunaga, M.; Koashi, T.; Okamoto, S.; Doi, S.; Ishida, M.; Kawasaki, T.; Hamada, M.; et al. Structure–activity relationship of oligomeric flavan-3-ols: Importance of the upper-unit B-ring hydroxyl groups in the dimeric structure for strong activities. Molecules 2015, 20, 18870–18885. [Google Scholar] [CrossRef] [Green Version]
  39. Saito, A. Challenges and complexity of functionality evaluation of flavan-3-ol derivatives. Biosci. Biotechnol. Biochem. 2017, 81, 1055–1060. [Google Scholar] [CrossRef] [Green Version]
  40. Saijo, R.; Takeda, Y. HPLC analysis of catechins in various kinds of green teas produced in Japan and abroad. Nippo Shokuhin Kagaku Kogaku Kaishi 1999, 46, 138–147. [Google Scholar] [CrossRef]
  41. Johnson, B.M.; Shu, Y.Z.; Zhuo, X.; Meanwell, N.A. Metabolic and pharmaceutical aspects of fluorinated compounds. J. Med. Chem. 2020, 63, 6315–6386. [Google Scholar] [CrossRef] [PubMed]
  42. Mao, L.; Liu, H.; Zhang, R.; Deng, Y.; Hao, Y.; Liao, W.; Yuan, M.; Sun, S. PINK1/Parkin-mediated mitophagy inhibits warangalone-induced mitochondrial apoptosis in breast cancer cells. Aging 2021, 13, 12955–12972. [Google Scholar] [CrossRef] [PubMed]
  43. Dixon, S.J.; Lemberg, K.M.; Lamprecht, M.R.; Skouta, R.; Zaitsev, E.M.; Gleason, C.E.; Patel, D.N.; Bauer, A.J.; Cantley, A.M.; Yang, S.W.; et al. Ferroptosis: An iron-dependent form of nonapoptotic cell death. Cell 2012, 149, 1060–1072. [Google Scholar] [CrossRef] [PubMed] [Green Version]
  44. LoBianco, F.V.; Krager, K.J.; Johnson, E.; Godwin, C.O.; Allen, A.R.; Crooks, P.A.; Compadre, C.M.; Borrelli, M.J.; Aykin-Burns, N. Parthenolide induces rapid thiol oxidation that leads to ferroptosis in hepatocellular carcinoma cells. Font. Toxicol. 2022, 4, 936149. [Google Scholar] [CrossRef]
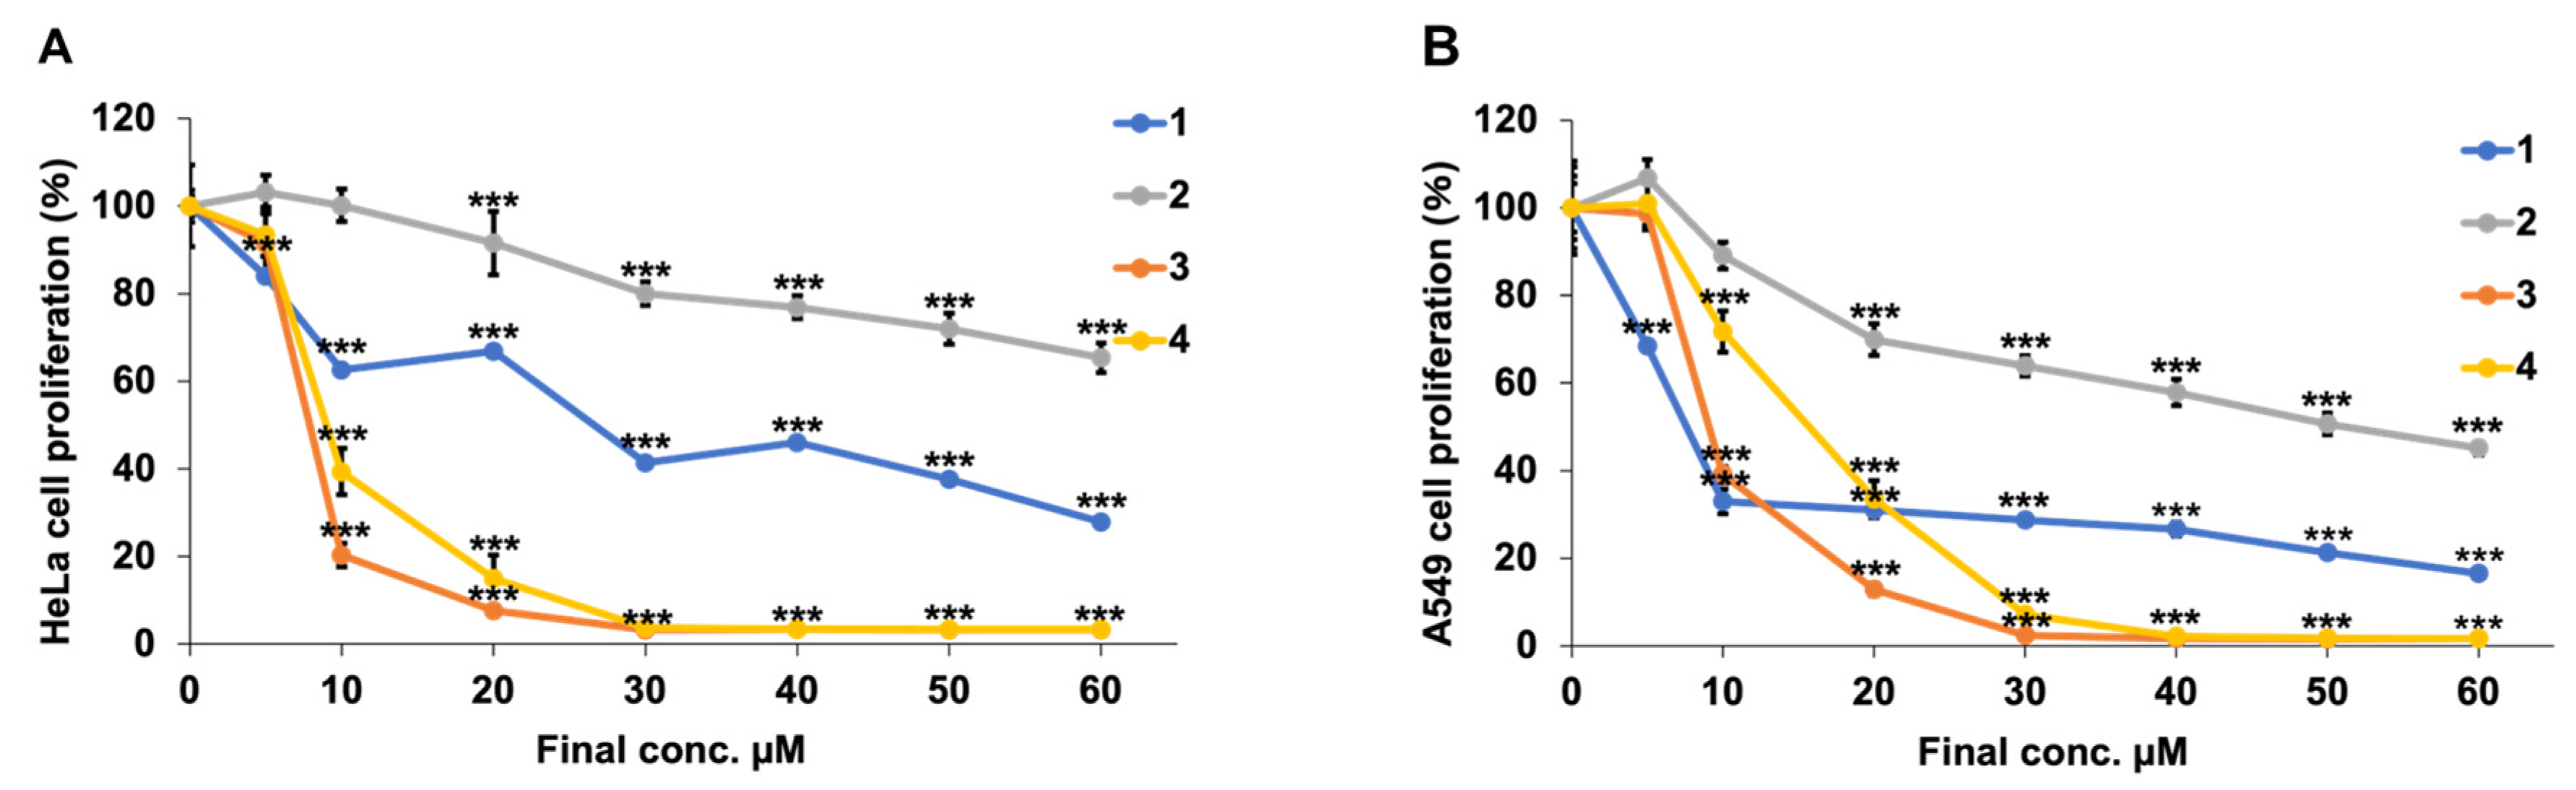
Figure 1. Structure of synthetic flavan-3-ol derivatives.
Biochem 03 00005 g001
Figure 2. The inhibitory rate of different concentrations of synthetic flavan-3-ol derivatives. HeLa (A) and A549 (B) cells were treated with different concentrations of synthetic flavan-3-ol derivatives for 48 h. Cell viability was detected by an MTT assay. *** p < 0.001 vs. compounds with a final concentration of 0 µM (Student’s t-test).
Biochem 03 00005 g002
Figure 3. Proliferation of synthetic flavan-3-ol derivatives in cancer cell lines with cell death inhibitors. HeLa (A) and A549 (B) cells were treated with inhibitor and synthetic flavan-3-ol derivatives (final concentrations 1, 3, and 4: 10 μM; 2: 50 μM) for 48 h. Cell viability was detected by an MTT assay. *** p < 0.001, ** p < 0.005, * p < 0.01 vs. untreated groups (Student’s t-test).
Biochem 03 00005 g003
Figure 4. Fluorinated derivatives have effects on mSOX. HeLa (A) and A549 (B) cells were treated with 50 µM synthetic flavan-3-ol derivatives for 1 h. The cells were stained with MitoSOXTM Red for 10 m and observed by fluorescence microscope.
Biochem 03 00005 g004
Figure 5. Fluorinated derivatives caused mitochondrial damage by reducing membrane potential. HeLa (A) and A549 (B) cells were treated with 50 µM of synthetic flavan-3-ol derivatives for 1 h. The mitochondrial membranes were stained with JC-1 for 15 min and observed under a fluorescence microscope.
Biochem 03 00005 g005
Figure 6. The addition of fluorinated compounds and granular aggregate formation near mitochondria. HeLa (A) and A549 (B) cells were treated with 50 µM synthetic flavan-3-ol derivatives for 1 h. The mitochondria were stained with MitoTrackerTM RED for 30 min and observed by fluorescence microscope.
Biochem 03 00005 g006
Figure 7. Granular aggregates formed by the addition of fluorinated compounds are formed in a concentration-dependent manner. HeLa (A) and A549 (B) cells were treated with different concentrations of synthetic flavan-3-ol derivatives for 1 h. The mitochondrial membrane potential was visualized by staining with JC-1 for 15 min and observed by fluorescence microscope.
Biochem 03 00005 g007
Figure 8. Synthetic flavan-3-ol derivatives induce autophagy. HeLa (A) and A549 (B) cells were treated with bafilomycin A1 (BAF-A1) and synthetic flavan-3-ol derivatives for 24 h. Representative western blots showed the expression of autophagy. ‘Untreated’ for Compounds 14 indicates that only treated with the respective compound and no BAF-A1 was added. The amount of LC3-II is normalized by the amount of β-actin. *** p < 0.001, ** p < 0.005 vs. untreated groups (Student’s t-test).
Biochem 03 00005 g008
Table 1. ANOVA statistical processing results for cell viability in Figure 2.
CompoundFinal Conc.
(µM)
HeLa CellsA549 Cells
Mean ± SDp-Value
(vs. 0 µM)
Mean ± SDp-Value
(vs. 0 µM)
1584.1 ± 5.6*** p < 0.00168.4 ± 0.49*** p < 0.001
1063.6 ± 2.8*** p < 0.00132.9 ± 2.8*** p < 0.001
2052.5 ± 1.7*** p < 0.00131.1 ± 1.6*** p < 0.001
3046.8 ± 1.6*** p < 0.00128.7 ± 1.2*** p < 0.001
4046.0 ± 0.98*** p < 0.00126.6 ± 1.6*** p < 0.001
5037.6 ± 2.1*** p < 0.00121.3 ± 0.77*** p < 0.001
6027.9 ± 3.3*** p < 0.00116.5 ± 1.2*** p < 0.001
25103.1 ± 3.9N.S. 1106.8 ± 4.3N.S. 1
10100.2 ± 3.7N.S. 189.1 ± 3.0N.S. 1
2091.5 ± 7.2N.S. 169.9 ± 3.6*** p < 0.001
3080.0 ± 2.7*** p < 0.00163.9 ± 2.3*** p < 0.001
4076.9 ± 2.6*** p < 0.00157.8 ± 3.0*** p < 0.001
5071.9 ± 3.5*** p < 0.00150.7 ± 2.5*** p < 0.001
6065.4 ± 3.2*** p < 0.00145.1 ± 1.5*** p < 0.001
3591.4 ± 8.3N.S. 198.6 ± 3.6N.S. 1
1020.4 ± 2.7*** p < 0.00139.1 ± 1.8*** p < 0.001
207.7 ± 0.96*** p < 0.00112.9 ± 1.4*** p < 0.001
303.3 ± 0.11*** p < 0.0012.4 ± 0.21*** p < 0.001
403.3 ± 0.15*** p < 0.0011.6 ± 0.060*** p < 0.001
503.3 ± 0.084*** p < 0.0011.6 ± 0.041*** p < 0.001
603.2 ± 0.13*** p < 0.0011.6 ± 0.059*** p < 0.001
4593.4 ± 4.8N.S. 1100.9 ± 5.0N.S. 1
1039.4 ± 5.3*** p < 0.00171.7 ± 4.7*** p < 0.001
2014.9 ± 0.79*** p < 0.00133.5 ± 4.2*** p < 0.001
303.8 ± 0.33*** p < 0.0017.1 ± 1.0*** p < 0.001
403.4 ± 0.14*** p < 0.0012.2 ± 0.33*** p < 0.001
503.4 ± 0.076*** p < 0.0011.7 ± 0.18*** p < 0.001
603.4 ± 0.087*** p < 0.0011.6 ± 0.073*** p < 0.001
1 N.S.: not significant.
Table 2. Inhibitory activity (IC50, µM) of synthetic flavan-3-ol 14.
CompoundHeLa cells IC50 µM ± SDA549 cells IC50 µM ± SD
123.6 ± 2.57.16 ± 0.14
2>6051.1 ± 3.4
37.49 ± 0.198.81 ± 0.12
48.73 ± 1.714.8 ± 0.60
Table 3. ANOVA statistical processing results for the amount of LC3-II in Figure 8.
HeLa CellsA549 Cells
Mean ± SDp-Value 1
(vs. DMSO)
Mean ± SDp-Value 1
(vs. DMSO)
DMSO + BAF6.2 ± 0.20*** p < 0.0012.2 ± 0.044*** p < 0.001
12.0 ± 0.090*** p < 0.0013.6 ± 0.069*** p < 0.001
1 + BAF6.5 ± 0.18*** p < 0.0014.2 ± 0.090*** p < 0.001
21.4 ± 0.0780.0083 *2.9 ± 0.064*** p < 0.001
2 + BAF6.7 ± 0.41*** p < 0.0015.2 ± 0.14*** p < 0.001
33.2 ± 0.30*** p < 0.0013.4 ± 0.18*** p < 0.001
3 + BAF10.9 ± 0.68*** p < 0.0013.2 ± 0.16*** p < 0.001
43.0 ± 0.21*** p < 0.0013.0 ± 0.14*** p < 0.001
4 + BAF13.4 ± 0.39*** p < 0.0012.9 ± 0.088*** p < 0.001
1 p value: *** p < 0.001, * p < 0.01.
Disclaimer/Publisher’s Note: The statements, opinions and data contained in all publications are solely those of the individual author(s) and contributor(s) and not of MDPI and/or the editor(s). MDPI and/or the editor(s) disclaim responsibility for any injury to people or property resulting from any ideas, methods, instructions or products referred to in the content.

