
One-Stage Methods of Computer Vision Object Detection to Classify Carious Lesions from Smartphone Imaging

 ,
,  ,
,  and
and 
Abstract
:1. Introduction
2. Materials and Methods
2.1. Reporting Protocols
2.2. Ethics
2.3. Data Acquisition and Annotation
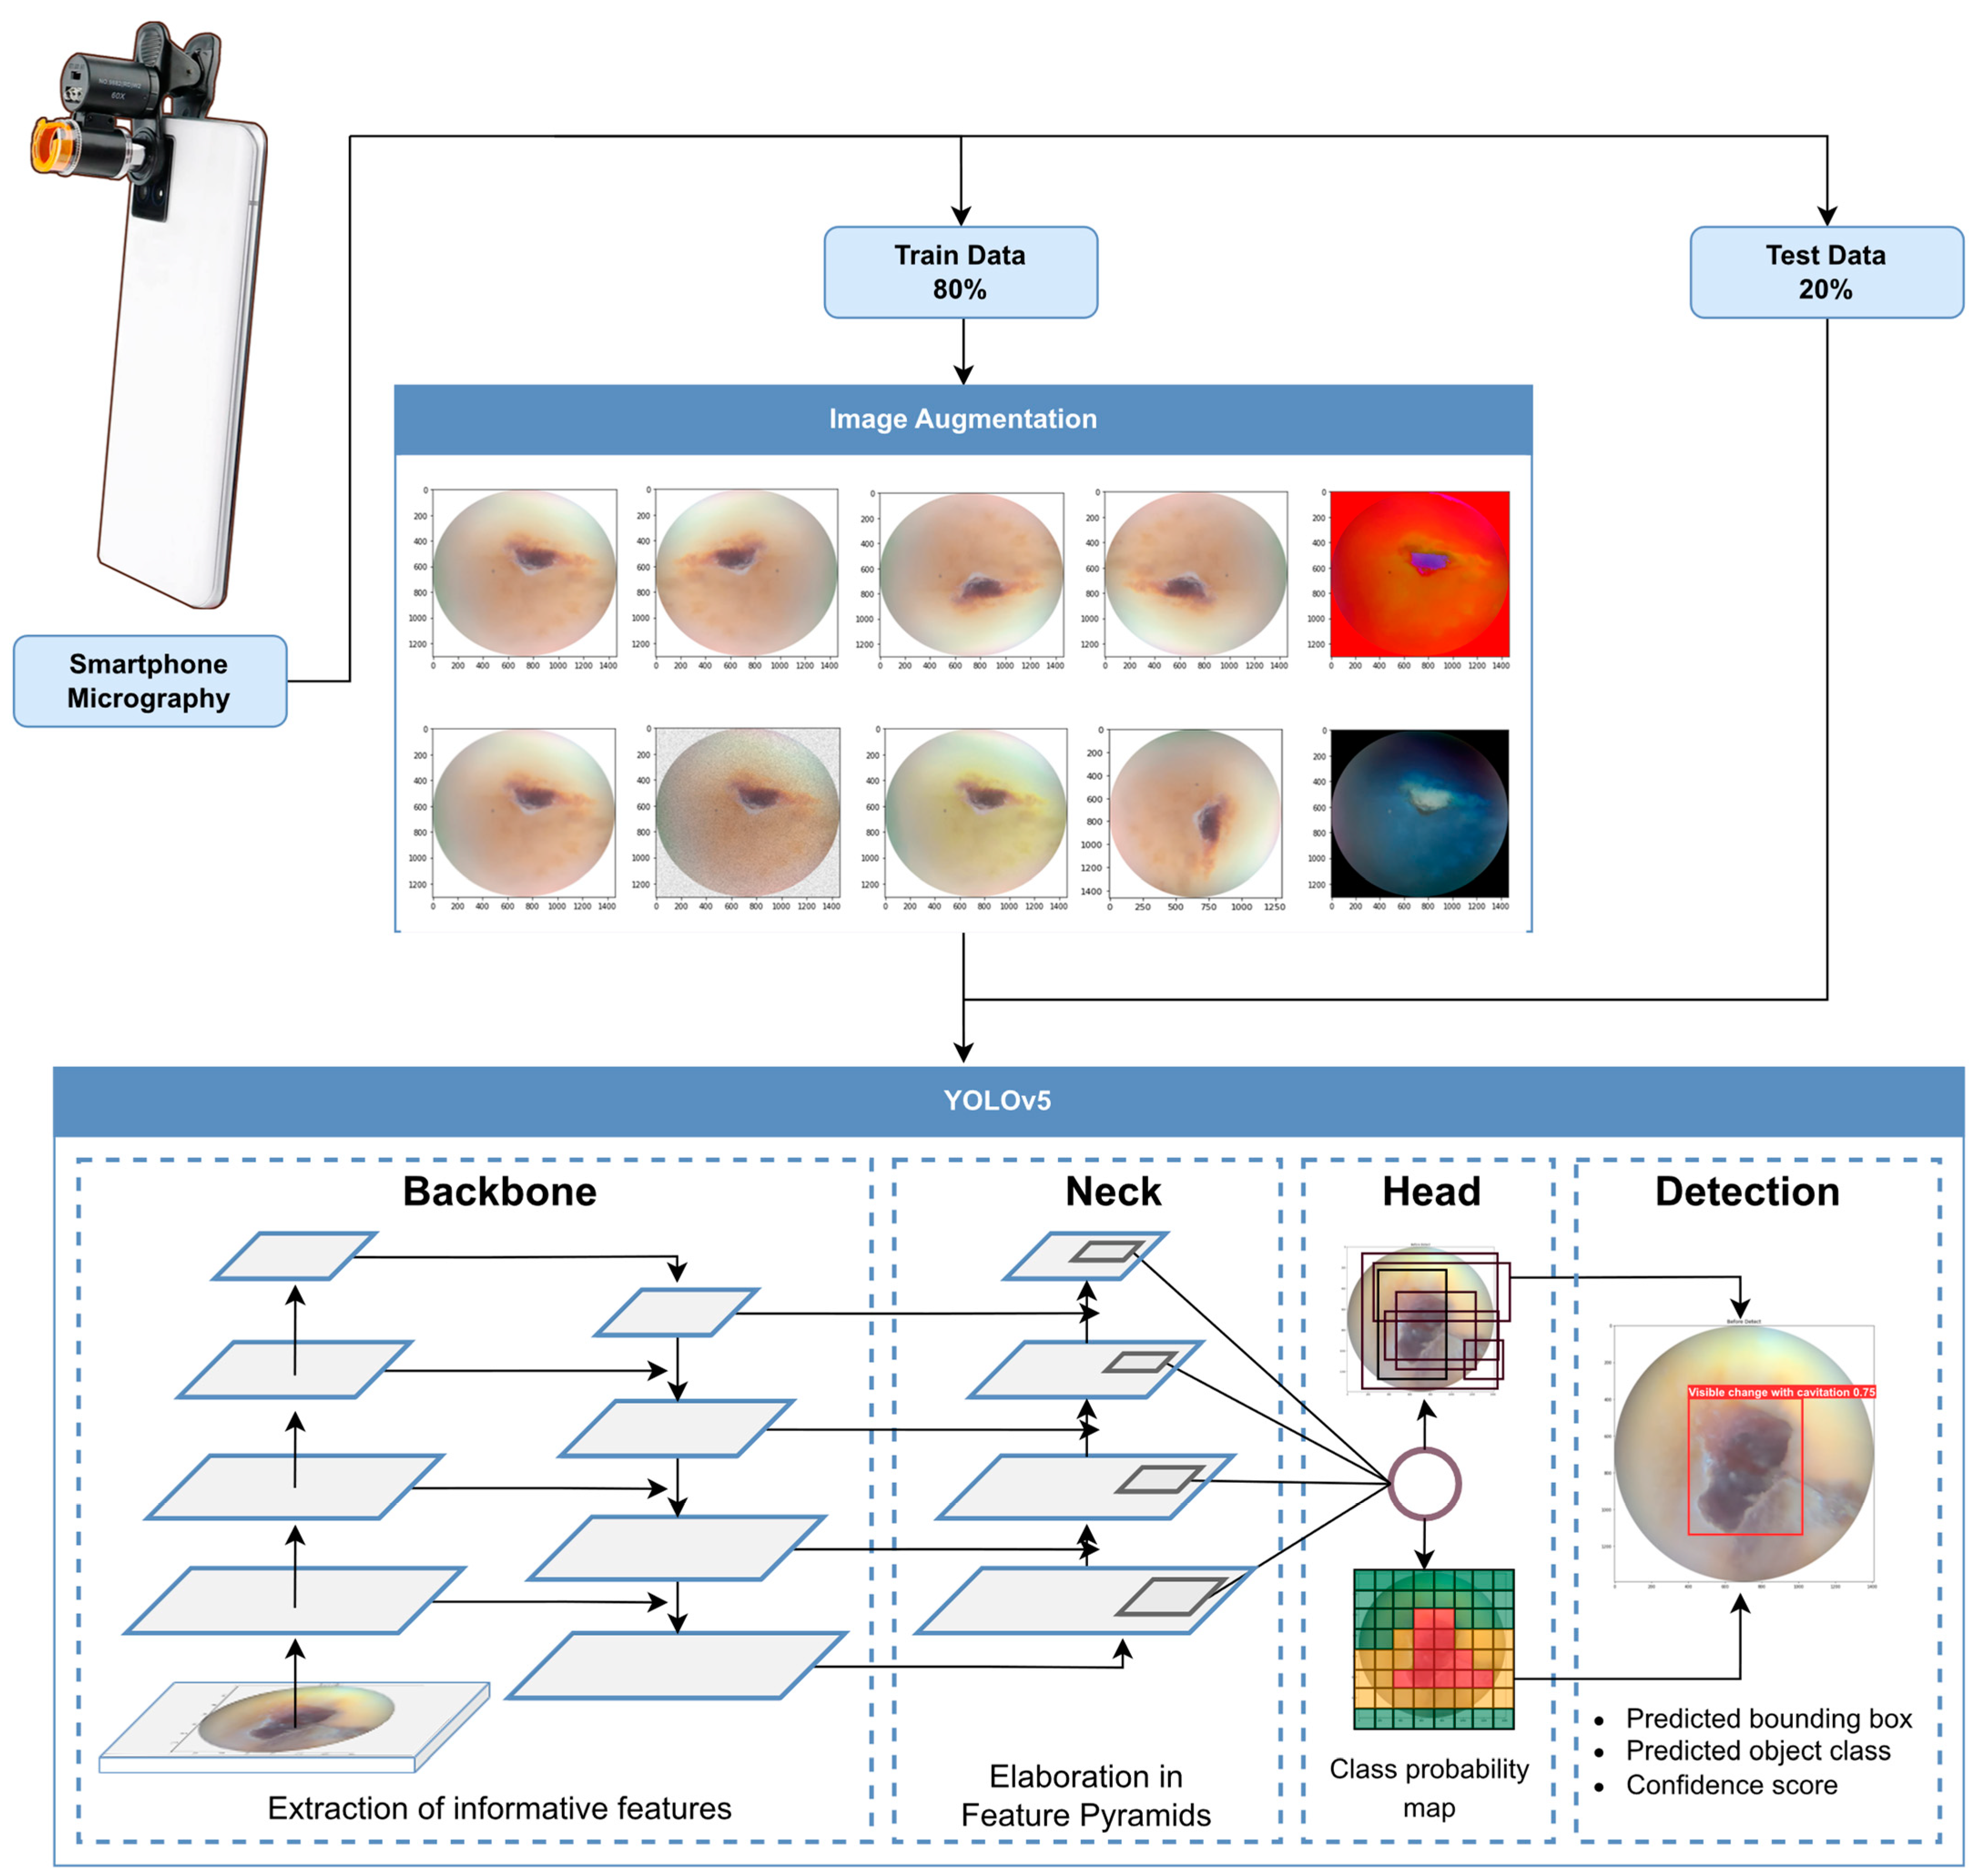
2.4. Training Strategies and Augmentation
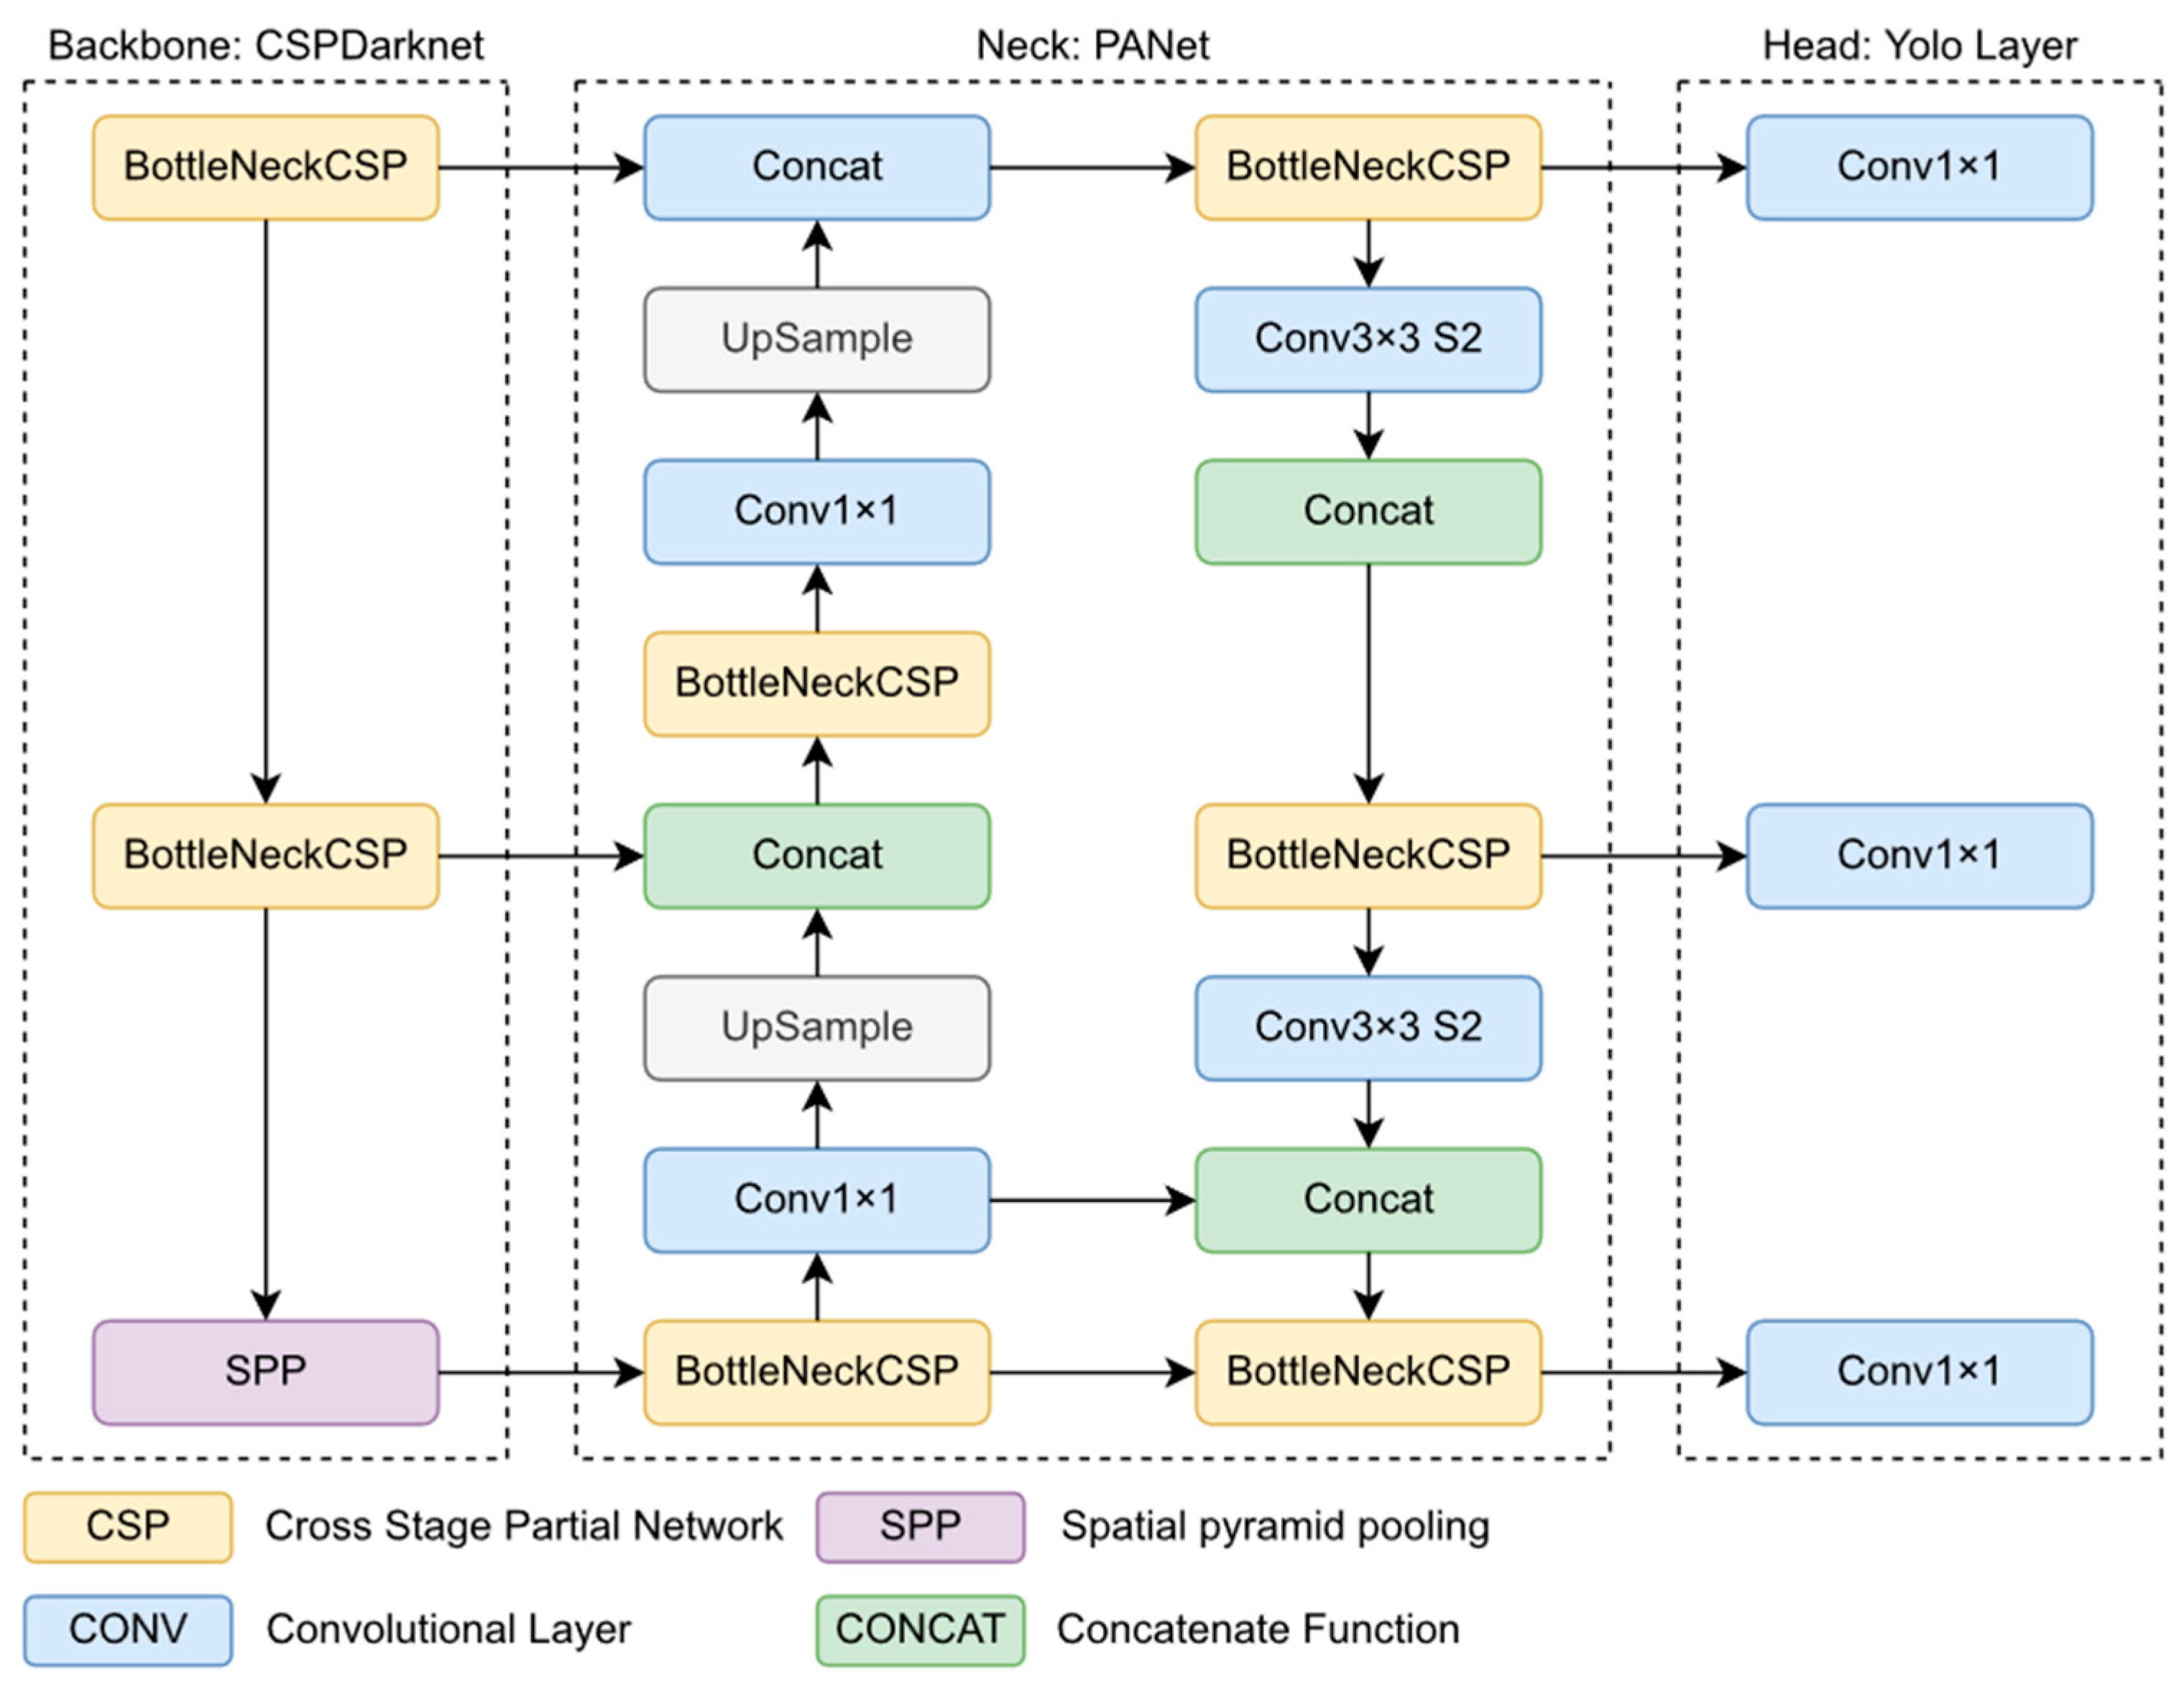
2.5. The Object Detection Model
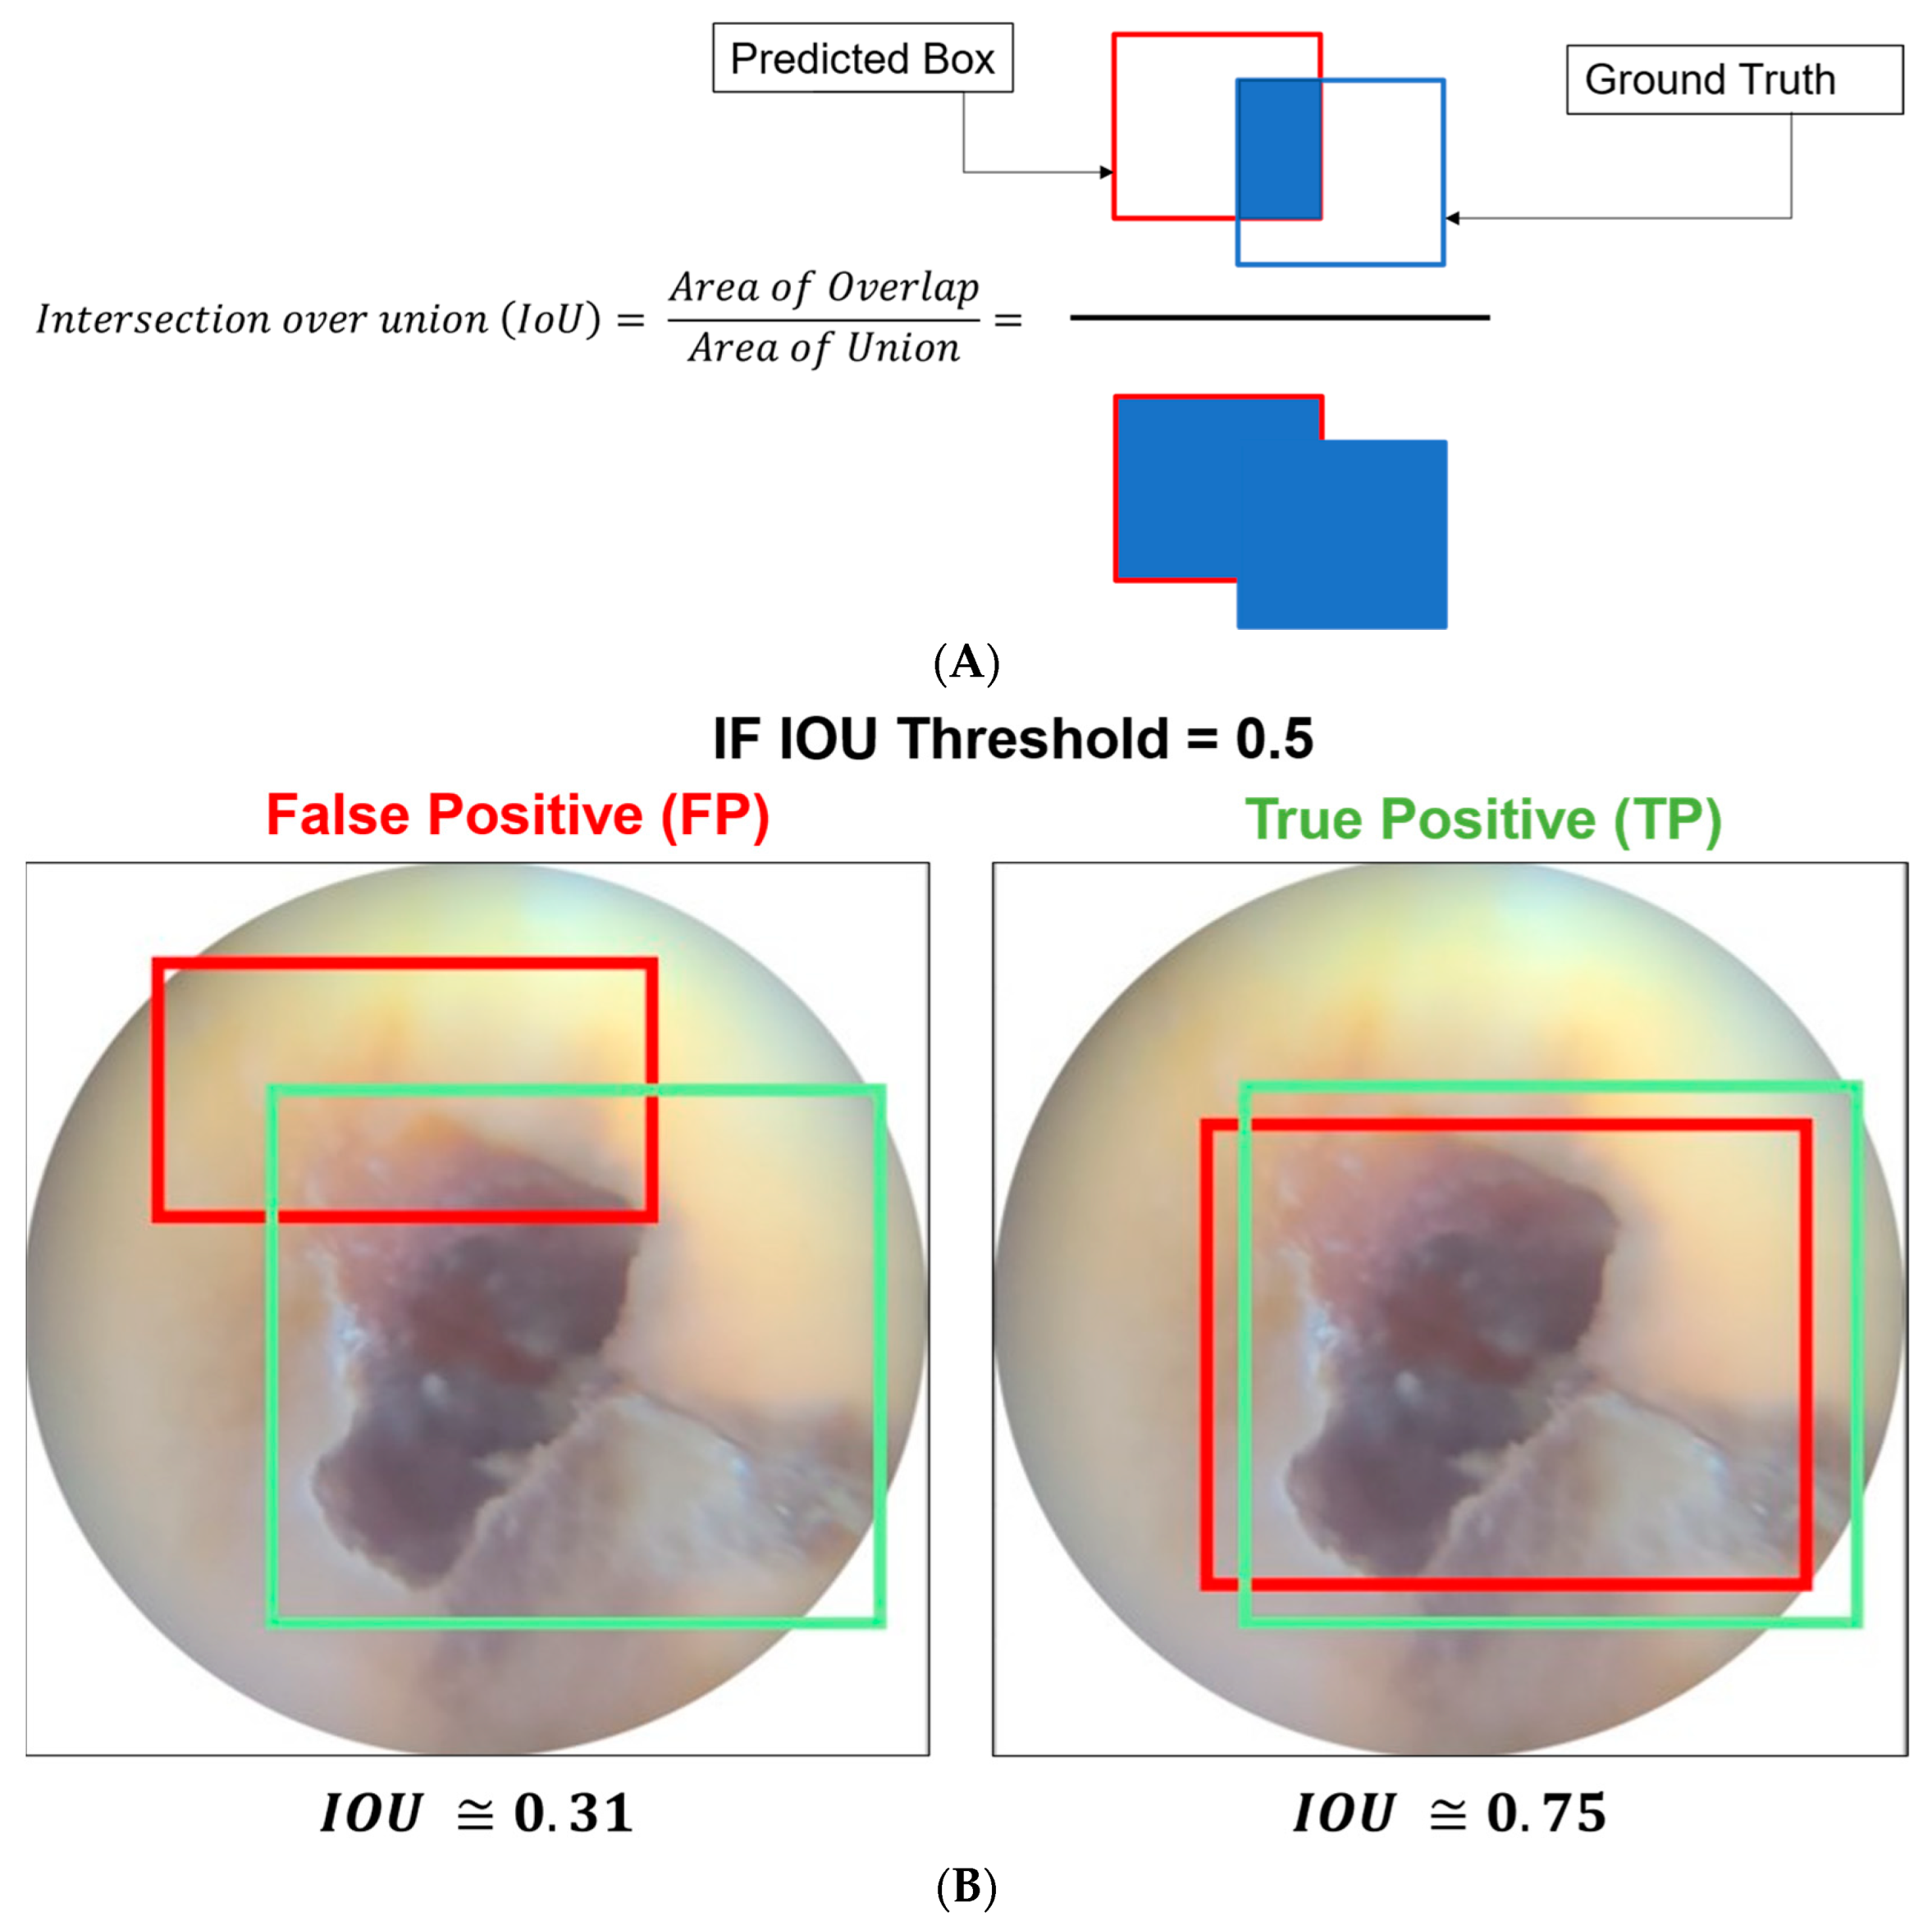
2.6. Evaluation Metrics
2.7. Evaluation Settings
3. Results
4. Discussion
5. Conclusions
Author Contributions
Funding
Data Availability Statement
Conflicts of Interest
References
- Neuhaus, K.W.; Ellwood, R.; Lussi, A.; Pitts, N.B. Traditional lesion detection aids. Detect. Assess. Diagn. Monit. Caries 2009, 21, 42–51. [Google Scholar]
- Duong, D.L.; Kabir, M.H.; Kuo, R.F. Automated caries detection with smartphone color photography using machine learning. Health Inform. J. 2021, 27, 14604582211007530. [Google Scholar] [CrossRef] [PubMed]
- Berdouses, E.D.; Koutsouri, G.D.; Tripoliti, E.E.; Matsopoulos, G.K.; Oulis, C.J.; Fotiadis, D.I. A computer-aided automated methodology for the detection and classification of occlusal caries from photographic color images. Comput. Biol. Med. 2015, 62, 119–135. [Google Scholar] [CrossRef] [PubMed]
- Meharry, M.R.; Dawson, D.; Wefel, J.S.; Harless, J.D.; Kummet, C.M.; Xiao, X. The effect of surface defects in early caries assessment using quantitative light-induced fluorescence (QLF) and micro-digital-photography (MDP). J. Dent. 2012, 40, 955–961. [Google Scholar] [CrossRef]
- Morrison, A.S.; Gardner, J.M. Smart phone microscopic photography: A novel tool for physicians and trainees. Arch. Pathol. Lab. Med. 2014, 138, 1002. [Google Scholar] [CrossRef]
- van Ginneken, B. Fifty years of computer analysis in chest imaging: Rule-based, machine learning, deep learning. Radiol. Phys. Technol. 2017, 10, 23–32. [Google Scholar] [CrossRef] [Green Version]
- Mookiah, M.R.K.; Acharya, U.R.; Chua, C.K.; Lim, C.M.; Ng, E.Y.K.; Laude, A. Computer-aided diagnosis of diabetic retinopathy: A review. Comput. Biol. Med. 2013, 43, 2136–2155. [Google Scholar] [CrossRef]
- Farook, T.H.; Dudley, J. Automation and deep (machine) learning in temporomandibular joint disorder radiomics. A systematic review. J. Oral. Rehabil. 2023. [Google Scholar] [CrossRef]
- Rao, M.A.; Lamani, D.; Bhandarkar, R.; Manjunath, T.C. Automated detection of diabetic retinopathy through image feature extraction. In Proceedings of the 2014 International Conference on Advances in Electronics Computers and Communications, Bangalore, India, 10–11 October 2014; pp. 1–6. [Google Scholar]
- Liu, Z.; Gu, X.; Chen, J.; Wang, D.; Chen, Y.; Wang, L. Automatic recognition of pavement cracks from combined GPR B-scan and C-scan images using multiscale feature fusion deep neural networks. Autom. Constr. 2023, 146, 104698. [Google Scholar] [CrossRef]
- Liu, W.; Quijano, K.; Crawford, M.M. YOLOv5-Tassel: Detecting tassels in RGB UAV imagery with improved YOLOv5 based on transfer learning. IEEE J. Sel. Top. Appl. Earth Obs. Remote Sens. 2022, 15, 8085–8094. [Google Scholar] [CrossRef]
- Wang, D.; Liu, Z.; Gu, X.; Wu, W.; Chen, Y.; Wang, L. Automatic detection of pothole distress in asphalt pavement using improved convolutional neural networks. Remote Sens. 2022, 14, 3892. [Google Scholar] [CrossRef]
- Qu, Z.; Gao, L.Y.; Wang, S.Y.; Yin, H.N.; Yi, T.M. An improved YOLOv5 method for large objects detection with multi-scale feature cross-layer fusion network. Image Vis. Comput. 2022, 125, 104518. [Google Scholar] [CrossRef]
- Al-Jallad, N.; Ly-Mapes, O.; Hao, P.; Ruan, J.; Ramesh, A.; Luo, J.; Wu, T.T.; Dye, T.; Rashwan, N.; Ren, J.; et al. Artificial intelligence-powered smartphone application, AICaries, improves at-home dental caries screening in children: Moderated and unmoderated usability test. PLoS Digit. Health 2022, 1, e0000046. [Google Scholar] [CrossRef] [PubMed]
- Gandhi, M.; Dhanasekaran, R. Diagnosis of diabetic retinopathy using morphological process and SVM classifier. In Proceedings of the 2013 International Conference on Communication and Signal Processing, Melmaruvathur, India, 3–5 April 2013; pp. 873–877. [Google Scholar]
- Redmon, J.; Divvala, S.; Girshick, R.; Farhadi, A. You only look once: Unified, real-time object detection. In Proceedings of the IEEE Conference on Computer Vision and Pattern Recognition, Las Vegas, NV, USA, 27–30 June 2016; pp. 779–788. [Google Scholar]
- Du, N.; Li, Y. Automated identification of diabetic retinopathy stages using support vector machine. In Proceedings of the IEEE 32nd Chinese Control Conference, Xi’an, China, 26–28 July 2013; pp. 3882–3886. [Google Scholar]
- Cohen, J.F.; Korevaar, D.A.; Altman, D.G.; Bruns, D.E.; Gatsonis, C.A.; Hooft, L.; Irwig, L.; Levine, D.; Reitsma, J.B.; De Vet, H.C.; et al. STARD 2015 guidelines for reporting diagnostic accuracy studies: Explanation and elaboration. BMJ Open 2016, 6, e012799. [Google Scholar] [CrossRef] [Green Version]
- Norgeot, B.; Quer, G.; Beaulieu-Jones, B.K.; Torkamani, A.; Dias, R.; Gianfrancesco, M.; Arnaout, R.; Kohane, I.S.; Saria, S.; Topol, E.; et al. Minimum information about clinical artificial intelligence modeling: The MI-CLAIM checklist. Nat. Med. 2020, 26, 1320–1324. [Google Scholar] [CrossRef]
- Yakovlev, A.; Lisovychenko, O. An approach for image annotation automatization for artificial intelligence models learning. Aдanmuвні Cucmeми Aвmoмamuчнoгo Уnpaвлiння 2020, 1, 32–40. [Google Scholar] [CrossRef]
- Mikołajczyk, A.; Grochowski, M. Data augmentation for improving deep learning in image classification problem. In Proceedings of the 2018 International Interdisciplinary PhD Workshop (IIPhDW), Swinoujscie, Poland, 9–12 May 2018; pp. 117–122. [Google Scholar]
- Casado-García, Á.; Domínguez, C.; García-Domínguez, M.; Heras, J.; Inés, A.; Mata, E.; Pascual, V. CLoDSA: A tool for augmentation in classification, localization, detection, semantic segmentation and instance segmentation tasks. BMC Bioinform. 2019, 20, 323. [Google Scholar] [CrossRef] [Green Version]
- Wang, C.Y.; Liao, H.Y.M.; Wu, Y.H.; Chen, P.Y.; Hsieh, J.W.; Yeh, I.H. CSPNet: A new backbone that can enhance learning capability of CNN. In Proceedings of the IEEE/CVF Conference on Computer Vision and Pattern Recognition Workshops, Seattle, WA, USA, 14–19 June 2020; pp. 390–391. [Google Scholar]
- Wang, K.; Liew, J.H.; Zou, Y.; Zhou, D.; Feng, J. Panet: Few-shot image semantic segmentation with prototype alignment. In Proceedings of the IEEE/CVF International Conference on Computer Vision, Seoul, Republic of Korea, 27–28 October 2019; pp. 9197–9206. [Google Scholar]
- Redmon, J.; Farhadi, A. Yolov3: An incremental improvement. arXiv 2018, arXiv:180402767. [Google Scholar]
- Padilla, R.; Netto, S.L.; Da Silva, E.A.B. A survey on performance metrics for object-detection algorithms. In Proceedings of the 2020 international Conference on Systems, Signals and Image Processing (IWSSIP), Niteroi, Brazil, 1–3 July 2020; pp. 237–242. [Google Scholar]
- Ali, L.; Alnajjar, F.; Parambil, M.M.A.; Younes, M.I.; Abdelhalim, Z.I.; Aljassmi, H. Development of YOLOv5-Based Real-Time Smart Monitoring System for Increasing Lab Safety Awareness in Educational Institutions. Sensors 2022, 22, 8820. [Google Scholar] [CrossRef]
- Farook, T.H.; Rashid, F.; Alam, M.K.; Dudley, J. Variables influencing the device-dependent approaches in digitally analysing jaw movement—A systematic review. Clin. Oral. Investig. 2022, 27, 489–504. [Google Scholar] [CrossRef]
- Dlužnevskij, D.; Stefanovic, P.; Ramanauskaite, S. Investigation of YOLOv5 efficiency in iPhone supported systems. Balt. J. Mod. Comput. 2021, 9, 333–344. [Google Scholar] [CrossRef]
- Goossens, H.H.; Opstal, A.V. Human eye-head coordination in two dimensions under different sensorimotor conditions. Exp. Brain Res. 1997, 114, 542–560. [Google Scholar] [CrossRef] [Green Version]
- Musri, N.; Christie, B.; Ichwan, S.J.A.; Cahyanto, A. Deep learning convolutional neural network algorithms for the early detection and diagnosis of dental caries on periapical radiographs: A systematic review. Imaging Sci. Dent. 2021, 51, 237. [Google Scholar] [CrossRef]
- Holtkamp, A.; Elhennawy, K.; Cejudo Grano de Oro, J.E.; Krois, J.; Paris, S.; Schwendicke, F. Generalizability of deep learning models for caries detection in near-infrared light transillumination images. J. Clin. Med. 2021, 10, 961. [Google Scholar] [CrossRef]
- Thanh, M.T.G.; Van Toan, N.; Ngoc, V.T.N.; Tra, N.T.; Giap, C.N.; Nguyen, D.M. Deep learning application in dental caries detection using intraoral photos taken by smartphones. Appl. Sci. 2022, 12, 5504. [Google Scholar] [CrossRef]
- Zhao, Q.; Chen, B.; Xu, H.; Ma, Y.; Li, X.; Feng, B.; Yan, C.; Dai, F. Unbiased IoU for Spherical Image Object Detection. Proc. AAAI Conf. Artif. Intell. 2022, 36, 508–515. [Google Scholar]
- Wu, S.; Li, X.; Wang, X. IoU-aware single-stage object detector for accurate localization. Image Vis. Comput. 2020, 97, 103911. [Google Scholar] [CrossRef] [Green Version]
- van Dyk, D.A.; Meng, X.-L. The art of data augmentation. J. Comput. Graph. Stat. 2001, 10, 1–50. [Google Scholar] [CrossRef]
- Shorten, C.; Khoshgoftaar, T.M. A survey on image data augmentation for deep learning. J. Big Data 2019, 6, 60. [Google Scholar] [CrossRef]
- Chlap, P.; Min, H.; Vandenberg, N.; Dowling, J.; Holloway, L.; Haworth, A. A review of medical image data augmentation techniques for deep learning applications. J. Med. Imaging Radiat. Oncol. 2021, 65, 545–563. [Google Scholar] [CrossRef]
- Tawiah, C.A.; Sheng, V.S. A study on multi-label classification. In Industrial Conference on Data Mining; Springer: Berlin/Heidelberg, Germany, 2013; pp. 137–150. [Google Scholar]
- Ling, C.X.; Sheng, V.S. Cost-sensitive learning and the class imbalance problem. Encycl. Mach. Learn. 2008, 2011, 231–235. [Google Scholar]
- Farook, T.H.; Ahmed, S.; Jamayet, N.B.; Rashid, F.; Barman, A.; Sidhu, P.; Patil, P.; Lisan, A.M.; Eusufzai, S.Z.; Dudley, J.; et al. Computer-aided design and 3-dimensional artificial/convolutional neural network for digital partial dental crown synthesis and validation. Sci. Rep. 2023, 13, 1561. [Google Scholar] [CrossRef] [PubMed]
- Petersen, P.E.; Bourgeois, D.; Ogawa, H.; Estupinan-Day, S.; Ndiaye, C. The global burden of oral diseases and risks to oral health. Bull. World Health Organ. 2005, 83, 661–669. [Google Scholar] [PubMed]


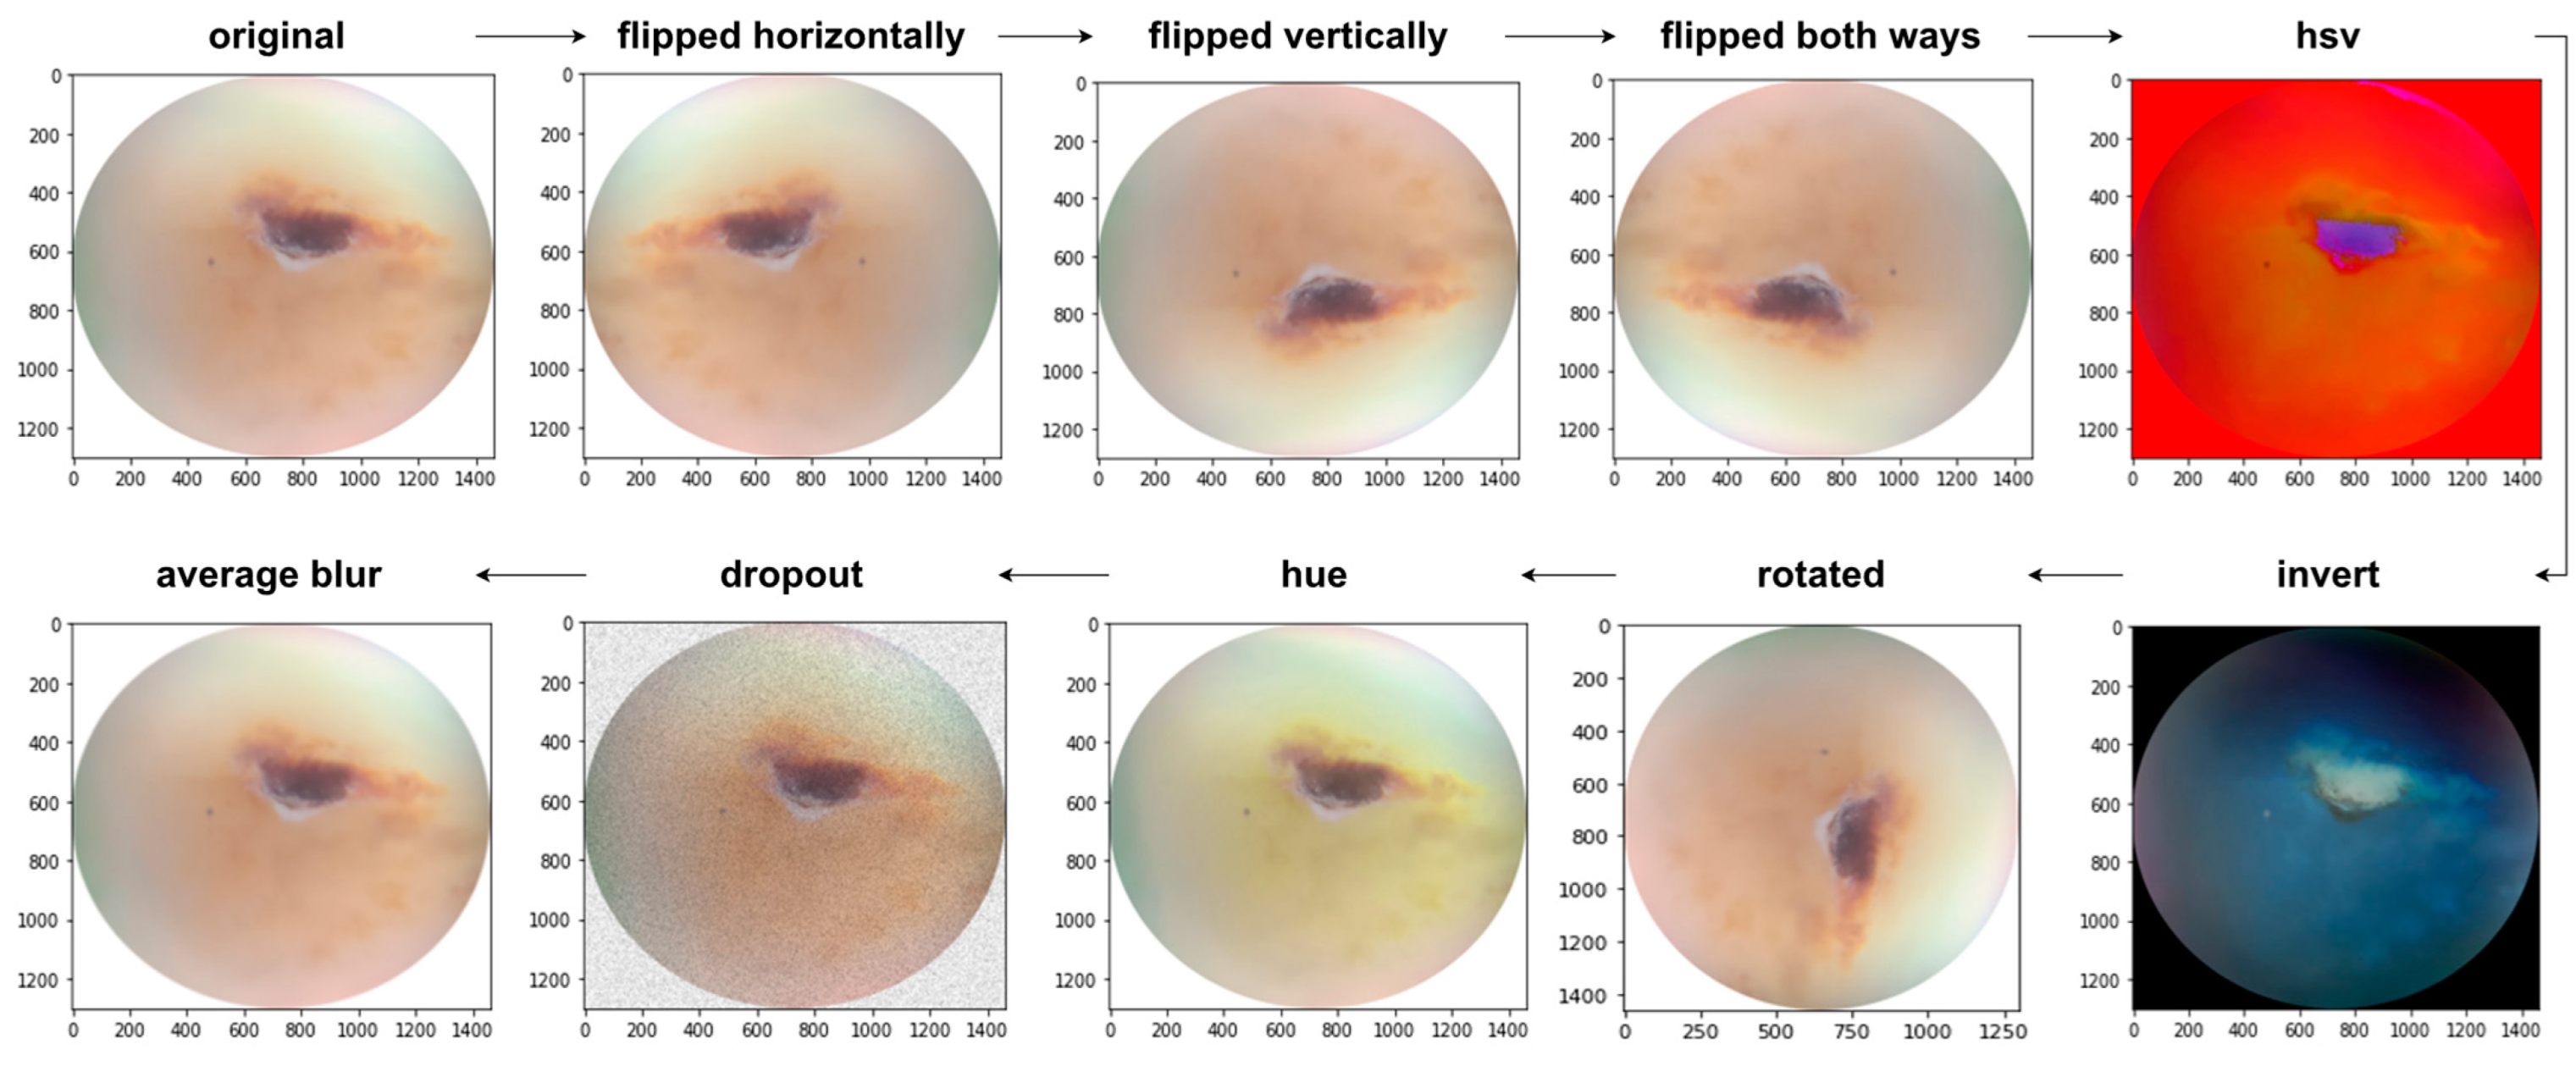
| Augmentation Techniques | Description |
|---|---|
| Flipped horizontally | Reverses the order of the elements in each row |
| Flipped vertically | Reverses the order of the elements in each column |
| Flipped both ways | Reverses the order of the elements in both row and column |
| HSV | Changes the color space from RGB to HSV |
| Average Blur | Smoothens the image using an average filter. |
| Dropout | Randomly sets input elements to zero with a given probability |
| HUE | Raises the hue value |
| Rotated | Rotated 90 degree clockwise |
| Invert | Inverts all values in images, i.e., sets a pixel from value v to 255-v |
| Model | Classification | TP | TN | FP | FN | SN | SP | AC | T.AC |
|---|---|---|---|---|---|---|---|---|---|
| YOLO v5S | Visible change without cavitation | 0.41 | 0.48 | 0.59 | 0.52 | 0.44 | 0.44 | 0.44 | 0.59 |
| Visible change with microcavitation | 0.69 | 0.28 | 0.31 | 0.72 | 0.48 | 0.47 | 0.48 | ||
| Visible change with cavitation | 0.75 | 1 | 0.25 | 0 | 1 | 0.80 | 0.87 | ||
| YOLO v5M | Visible change without cavitation | 0.55 | 0.38 | 0.45 | 0.62 | 0.47 | 0.45 | 0.46 | 0.65 |
| Visible change with microcavitation | 0.65 | 0.36 | 0.35 | 0.64 | 0.64 | 0.64 | 0.50 | ||
| Visible change with cavitation | 1 | 1 | 0 | 0 | 1 | 1 | 1 | ||
| YOLO v5L | Visible change without cavitation | 0.23 | 0.88 | 0.77 | 0.12 | 0.65 | 0.53 | 0.55 | 0.54 |
| Visible change with microcavitation | 0.69 | 0 | 0.31 | 1 | 0.40 | 0 | 0.34 | ||
| Visible change with cavitation | 0.50 | 1 | 0.50 | 0 | 1 | 0.66 | 0.75 | ||
| YOLO v5X | Visible change without cavitation | 0.41 | 0.81 | 0.59 | 0.19 | 0.68 | 0.57 | 0.61 | 0.64 |
| Visible change with microcavitation | 0.62 | 0 | 0.38 | 1 | 0.38 | 0 | 0.31 | ||
| Visible change with cavitation | 1 | 1 | 0 | 0 | 1 | 1 | 1 | ||
| YOLO v5N | Visible change without cavitation | 0.32 | 0.71 | 0.68 | 0.29 | 0.52 | 0.51 | 0.51 | 0.63 |
| Visible change with microcavitation | 0.75 | 0.24 | 0.25 | 0.76 | 0.49 | 0.48 | 0.49 | ||
| Visible change with cavitation | 1 | 0.78 | 0 | 0.22 | 0.81 | 0.78 | 0.89 |
| Model | Classification | Precision | Recall | mAP@0.5 |
|---|---|---|---|---|
| YOLO v5S | Visible change without cavitation | 0.453 | 0.455 | 0.303 |
| Visible change with microcavitation | 0.606 | 0.688 | 0.75 | |
| Visible change with cavitation | 0.797 | 0.984 | 0.895 | |
| Overall | 0.619 | 0.709 | 0.649 | |
| YOLO v5M | Visible change without cavitation | 0.687 | 0.5 | 0.531 |
| Visible change with microcavitation | 0.56 | 0.625 | 0.588 | |
| Visible change with cavitation | 0.887 | 1 | 0.995 | |
| Overall | 0.712 | 0.708 | 0.705 | |
| YOLO v5L | Visible change without cavitation | 0.598 | 0.542 | 0.465 |
| Visible change with microcavitation | 0.667 | 0.75 | 0.712 | |
| Visible change with cavitation | 0.663 | 0.75 | 0.87 | |
| Overall | 0.643 | 0.681 | 0.682 | |
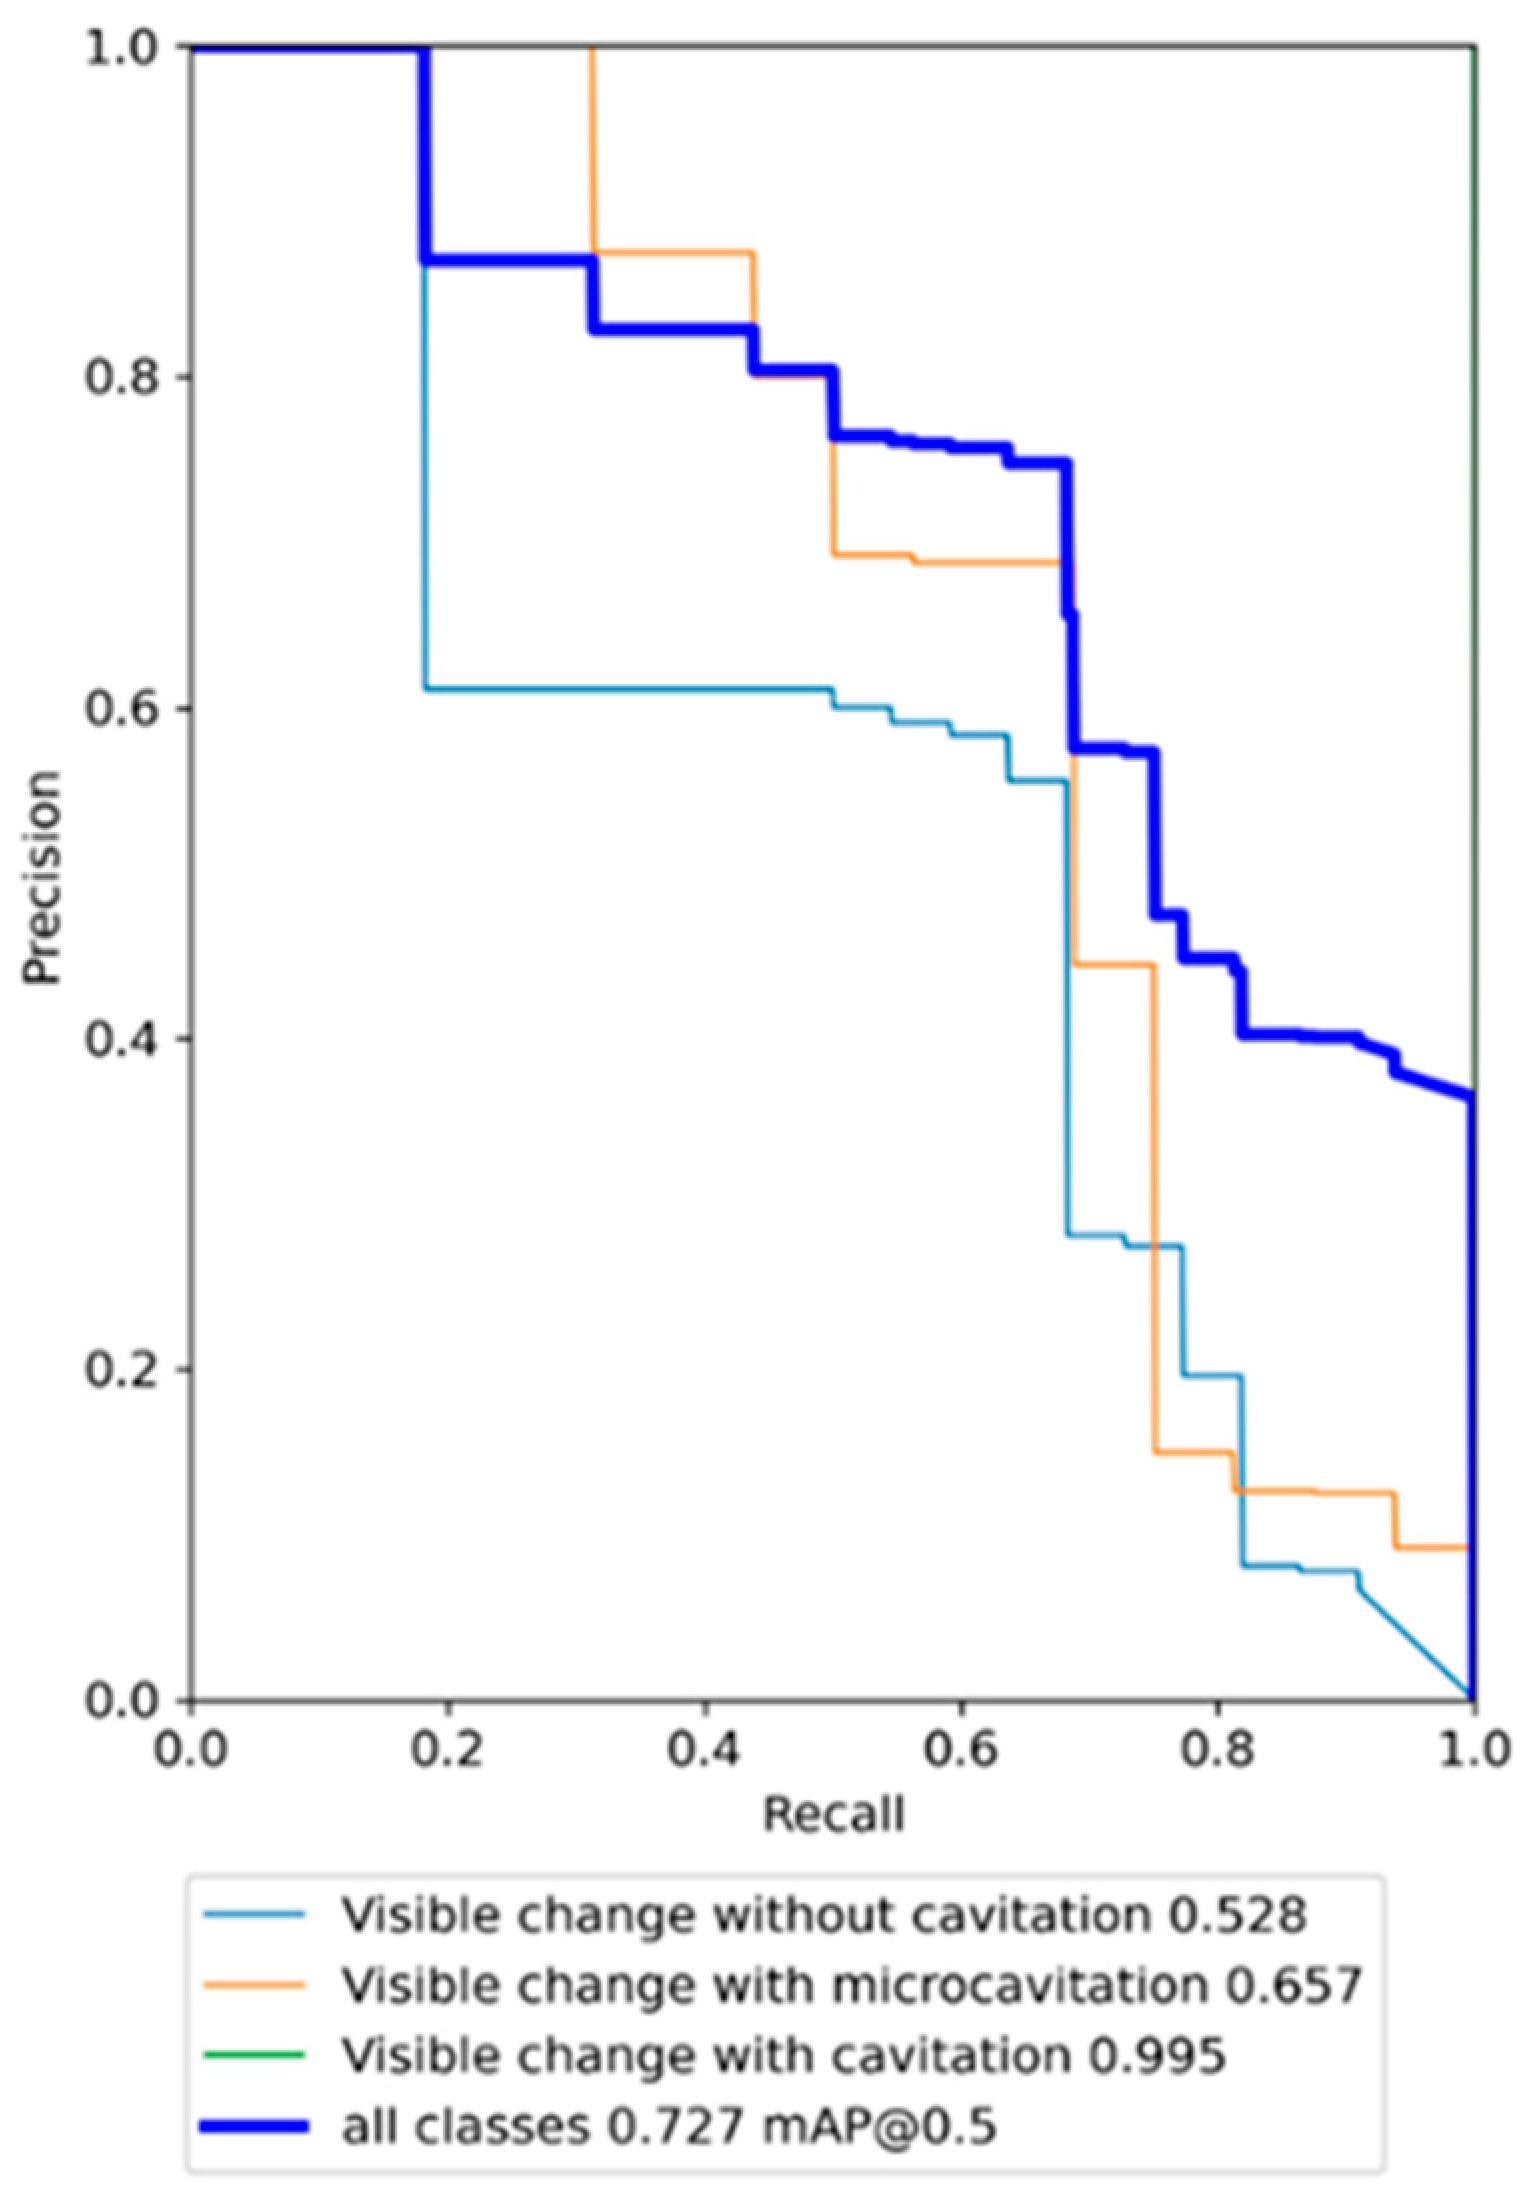
| YOLO v5X | Visible change without cavitation | 0.611 | 0.5 | 0.528 |
| Visible change with microcavitation | 0.677 | 0.688 | 0.657 | |
| Visible change with cavitation | 0.904 | 1 | 0.995 | |
| Overall | 0.731 | 0.729 | 0.727 | |
| YOLO v5N | Visible change without cavitation | 0.545 | 0.273 | 0.367 |
| Visible change with microcavitation | 0.698 | 0.723 | 0.716 | |
| Visible change with cavitation | 0.659 | 1 | 0.845 | |
| Overall | 0.634 | 0.665 | 0.643 |
Disclaimer/Publisher’s Note: The statements, opinions and data contained in all publications are solely those of the individual author(s) and contributor(s) and not of MDPI and/or the editor(s). MDPI and/or the editor(s) disclaim responsibility for any injury to people or property resulting from any ideas, methods, instructions or products referred to in the content. |
© 2023 by the authors. Licensee MDPI, Basel, Switzerland. This article is an open access article distributed under the terms and conditions of the Creative Commons Attribution (CC BY) license (https://creativecommons.org/licenses/by/4.0/).
Share and Cite
Salahin, S.M.S.; Ullaa, M.D.S.; Ahmed, S.; Mohammed, N.; Farook, T.H.; Dudley, J. One-Stage Methods of Computer Vision Object Detection to Classify Carious Lesions from Smartphone Imaging. Oral 2023, 3, 176-190. https://doi.org/10.3390/oral3020016
Salahin SMS, Ullaa MDS, Ahmed S, Mohammed N, Farook TH, Dudley J. One-Stage Methods of Computer Vision Object Detection to Classify Carious Lesions from Smartphone Imaging. Oral. 2023; 3(2):176-190. https://doi.org/10.3390/oral3020016
Chicago/Turabian StyleSalahin, S. M. Siamus, M. D. Shefat Ullaa, Saif Ahmed, Nabeel Mohammed, Taseef Hasan Farook, and James Dudley. 2023. "One-Stage Methods of Computer Vision Object Detection to Classify Carious Lesions from Smartphone Imaging" Oral 3, no. 2: 176-190. https://doi.org/10.3390/oral3020016