
Molecular and Physiological Variability in Bread Wheat and Its Wild Relative (Aegilops tauschii Coss.) Species under Water-Deficit Stress Conditions


Abstract
:1. Introduction
2. Materials and Methods
2.1. Plant Materials and Growth Conditions
2.2. Phenotypic Assessment
2.3. Genotypic Assessment
2.4. Statistical Analysis
3. Results
3.1. Phenotypic Variation
3.2. Genotypic Variation
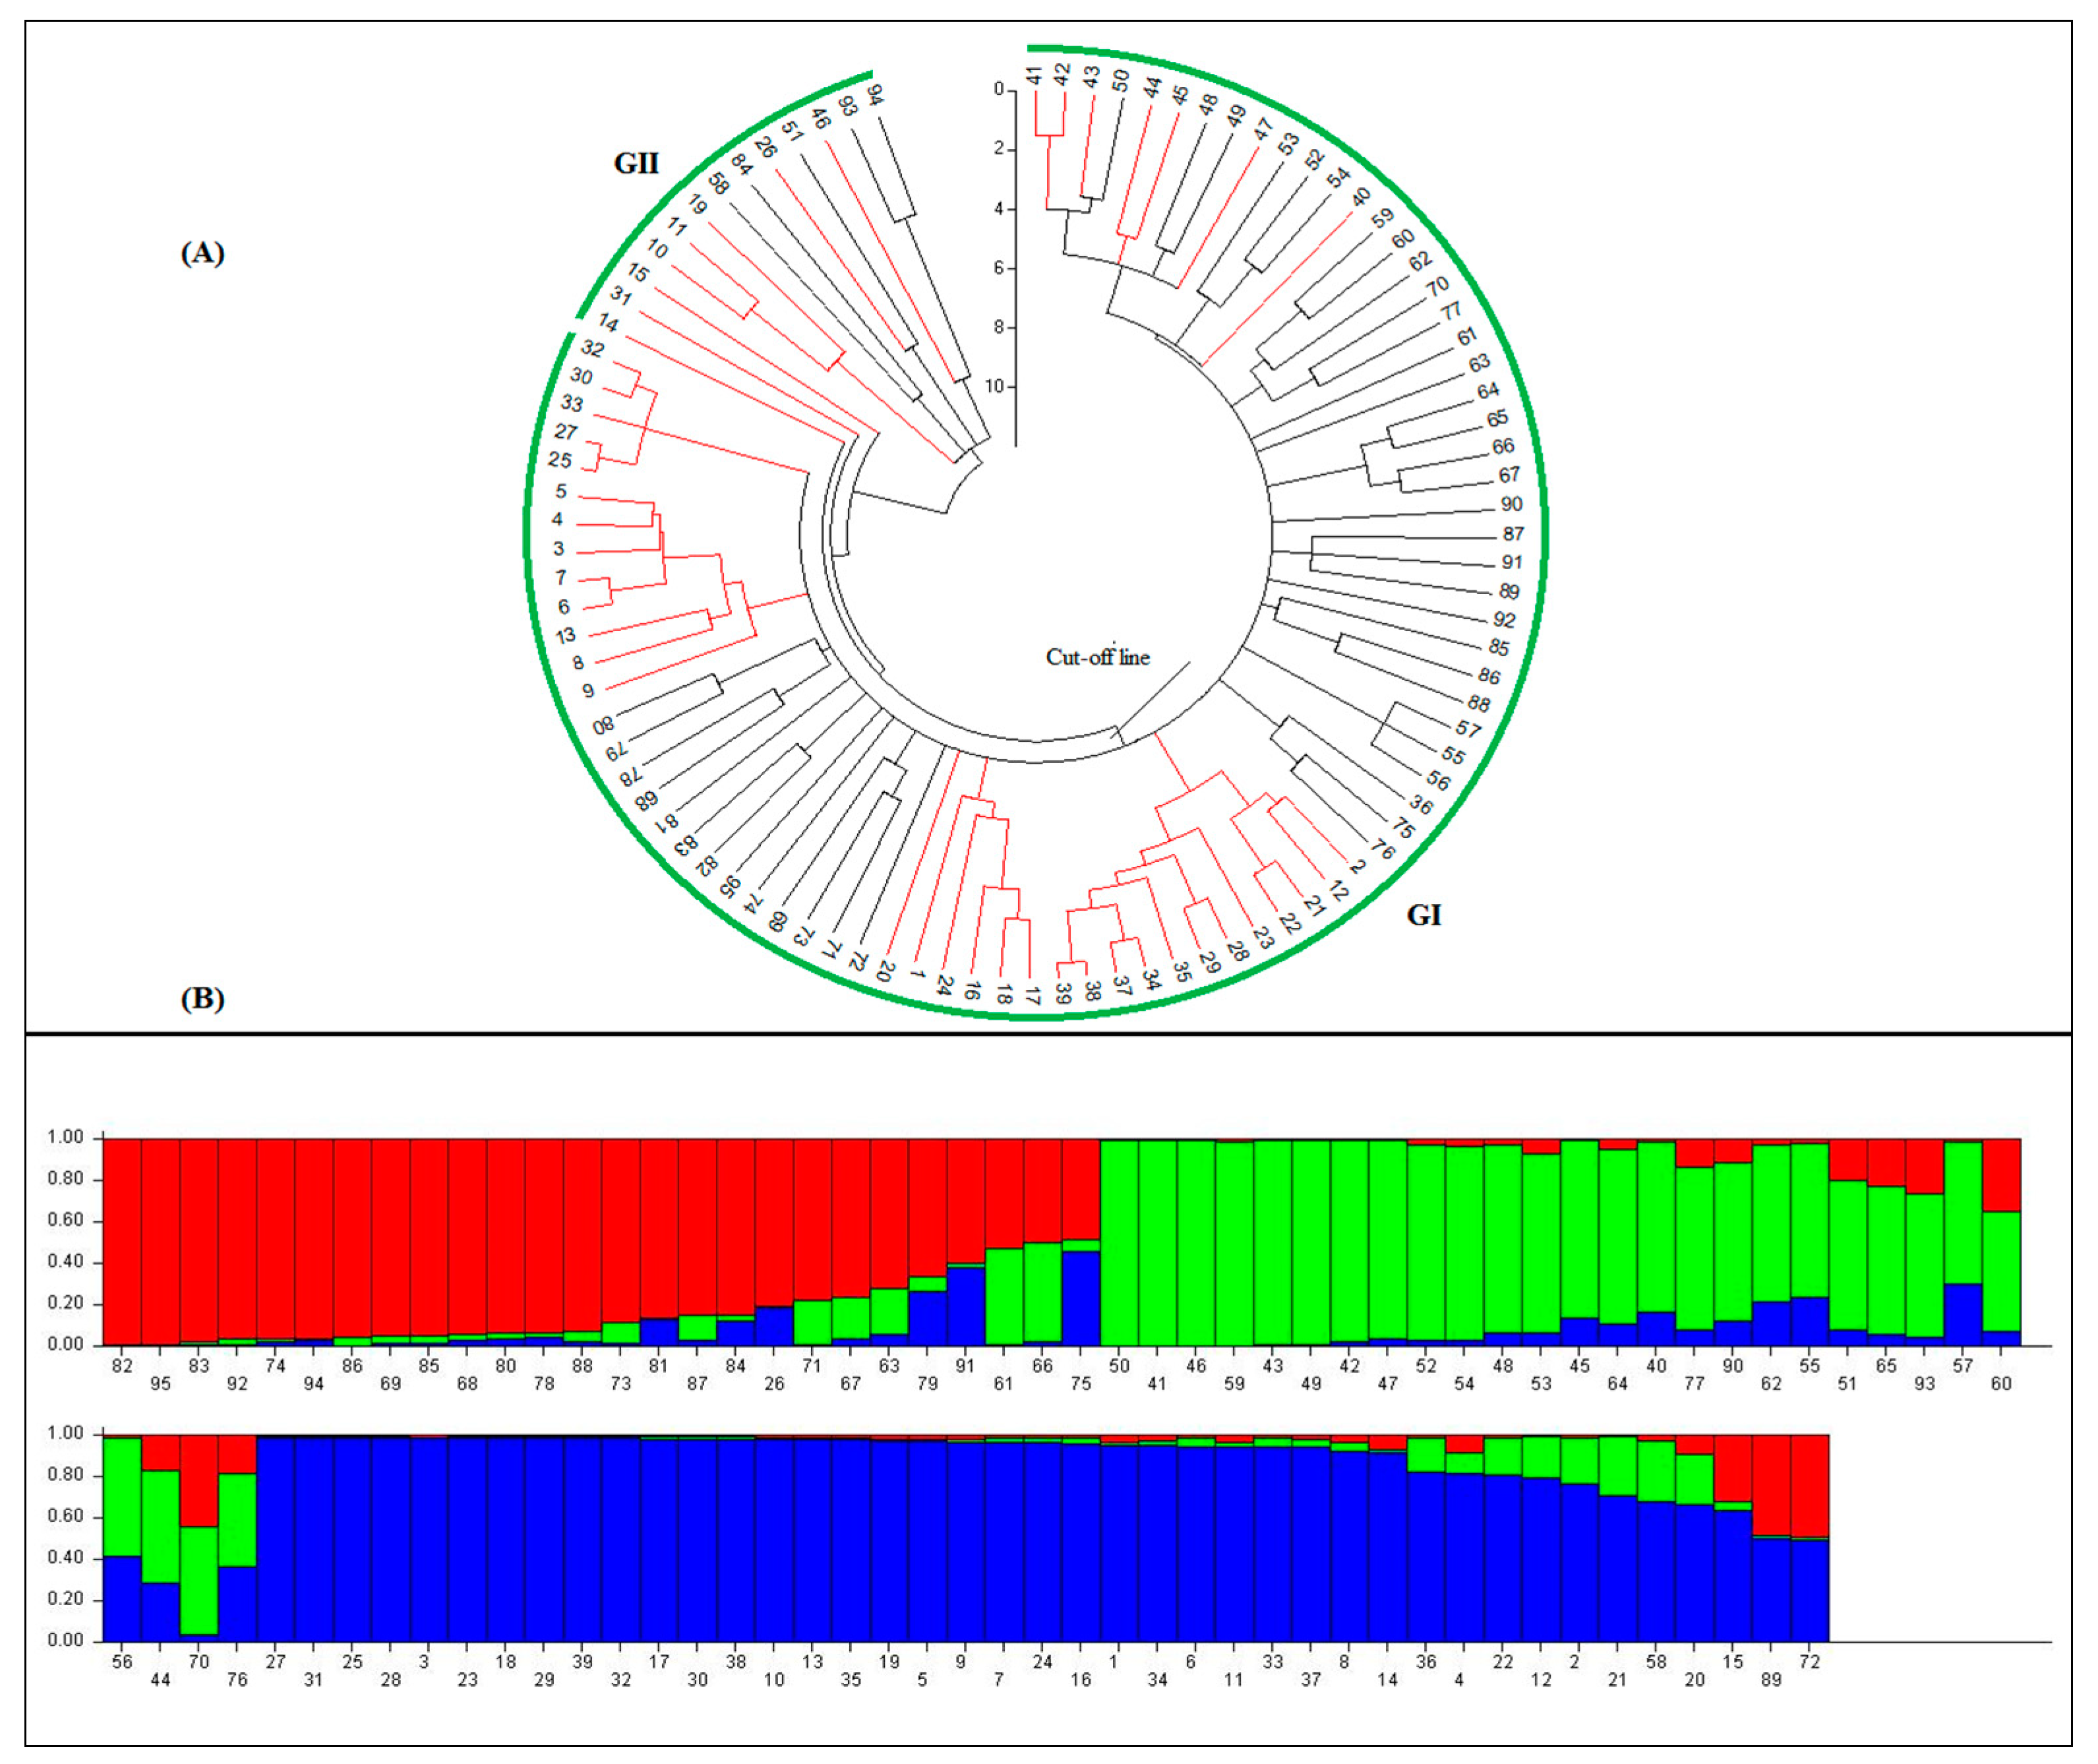
3.3. Population Structure and Marker-Trait Association
4. Discussion
5. Conclusions
Supplementary Materials
Author Contributions
Funding
Institutional Review Board Statement
Informed Consent Statement
Data Availability Statement
Conflicts of Interest
References
- Singh, P.; Mahajan, M.M.; Singh, N.K.; Kumar, D.; Kumar, K. Physiological and molecular response under salinity stress in bread wheat (Triticum aestivum L.). J. Plant Biochem. Biotechnol. 2020, 29, 125–133. [Google Scholar] [CrossRef]
- McFadden, E.S.; Sears, E.R. The origin of Triticum spelta and its free-threshing hexaploid relatives. J. Hered. 1946, 37, 107. [Google Scholar] [CrossRef] [PubMed]
- Pour-Aboughadareh, A.; Kianersi, F.; Poczai, P.; Moradkhani, H. Potential of wild relatives of wheat: Ideal genetic resources for future breeding programs. Agronomy 2021, 11, 1656. [Google Scholar] [CrossRef]
- Colom, M.R.; Vazzana, C. Photosynthesis and PSII functionality of drought-resistant and drought-sensitive weeping love grass plants. Environ. Exp. Bot. 2003, 49, 135–144. [Google Scholar] [CrossRef]
- Comas, L.H.; Becker, S.R.; Cruz, V.M.V.; Byrne, P.F.; Dierig, D.A. Root traits contributing to plant productivity under drought. Front. Plant Sci. 2013, 4, 442. [Google Scholar] [CrossRef] [Green Version]
- Bolhar-Nordenkampf, H.R.; Oquist, G. Chlorophyll fluorescence as a tool in photosynthesis research. In Photosynthesis and Production in a Changing Environment: A Field and Laboratory Manual; Hall, D.O., Scurlock, J.M.O., Bolhar-Nordenkampf, H.R., Leegood, R.C., Long, S.P., Eds.; Chapman & Hall: London, UK, 1993; pp. 193–206. [Google Scholar]
- Hairat, S.; Khurana, P. Evaluation of Aegilops tauschii and Aegilops speltoides for acquired termotolerance: Implications in wheat breeding programmes. Plant Physiol. Biochem. 2015, 95, 6574. [Google Scholar] [CrossRef]
- Fracheboud, Y.; Leipner, J. The application of chlorophyll fluorescence to study light, temperature and drought stress. In Practical Applications of Chlorophyll Fluorescence in Plant Biology; DeEll, J.R., Tiovonen, P.M.A., Eds.; Kluwer Academic Publishers: Boston, MA, USA, 2004; pp. 125–150. [Google Scholar]
- Pour-Aboughadareh, A.; Omidi, M.; Naghavi, M.R.; Etminan, A.; Mehrabi, A.A.; Poczai, P.; Bayat, H. Effect of water deficit stress on seedling biomass and physio-chemical characteristics in different species of wheat possessing the D genome. Agronomy 2019, 9, 522. [Google Scholar] [CrossRef] [Green Version]
- Baker, N.R.; Rosenqvist, E. Applications of chlorophyll fluorescence can improve crop production strategies: An examination of future possibilities. J. Exp. Bot. 2004, 55, 1607–1621. [Google Scholar] [CrossRef] [Green Version]
- Flint-Garcia, S.A.; Thornsberry, J.M.; Buckler, E.S. Structure of linkage disequilibrium in plants. Annu. Rev. Plant Biol. 2003, 54, 357–374. [Google Scholar] [CrossRef] [Green Version]
- Mehrabi, A.A.; Pour-Aboughadareh, A.; Mansouri, S.; Hosseini, A. Genome-wide association analysis of root system architecture features and agronomic traits in durum wheat. Mol. Breed 2020, 40, 55. [Google Scholar] [CrossRef]
- Souza, C.C.; Oliveira, F.A.; Silva, I.F.; Amorim Neto, M.S. Evaluation of methods of available water determination and irrigation management in “terra roxa” under cotton crop. Rev. Bras. De Eng. Agric. E Ambient. 2000, 4, 338–342. [Google Scholar] [CrossRef] [Green Version]
- Lichtenthaler, H.K.; Wellburn, A.R. Determinations of total carotenoids and chlorophylls a and b of leaf extracts in different solvents. Biochem. Soc. Trans. 1983, 11, 591–592. [Google Scholar] [CrossRef] [Green Version]
- Blum, A. Plant Breeding for Water-Limited Environments; Springer: New York, NY, USA, 2015. [Google Scholar]
- Doyle, J.J.; Doyle, J.K. A rapid DNA isolation procedure for small quantities of fresh leaf tissue. Phytochem. Bull. 1987, 19, 11–15. [Google Scholar]
- Roder, M.; Korzun, V.; Wendehake, K.; Plasche, J.; Tixier, M.H.; Leroy, P.; Ganal, M.W. A microsatellite map of wheat. Genetics 1998, 149, 2007–2023. [Google Scholar] [CrossRef] [PubMed]
- Pour-Aboughadareh, A.; Etminan, A.; Abdelrahman, M.; Siddique, K.; Tran, L.S.P. Assessment of biochemical and physiological parameters of durum wheat genotypes at the seedling stage during polyethylene glycol-induced water stress. Plant Growth Regul. 2020, 92, 81–93. [Google Scholar] [CrossRef]
- Peakall, R.O.D.; Smouse, P.E. GENALEX 6: Genetic analysis in Excel. Population genetic software for teaching and research. Mol. Ecol. Notes 2006, 6, 288–295. [Google Scholar] [CrossRef]
- Tamura, K.; Peterson, D.; Peterson, N.; Stecher, G.; Nei, M.; Kumar, S. MEGA5: Molecular evolutionary genetics analysis using maximum likelihood, evolutionary distance, and maximum parsimony methods. Mol. Biol. Evol. 2011, 28, 2731–2739. [Google Scholar] [CrossRef] [PubMed] [Green Version]
- Pritchard, J.K.; Stephens, M.; Donnelly, P. Inference of population structure using multilocus genotype data. Genetics 2000, 155, 945–959. [Google Scholar] [CrossRef]
- Earl, D.A.; von Holdt, B.M. Structure Harvester: A website and program for visualizing STRUCTURE output and implementing the Evanno method. Conserv. Genet. Resour. 2012, 4, 359–361. [Google Scholar] [CrossRef]
- Bradbury, P.J.; Zhang, Z.; Kroon, D.E.; Casstevens, T.M.; Ramdoss, Y.; Buckler, E.S. TASSEL: Software for association mapping of complex traits in diverse samples. J. Bioinform. 2007, 23, 2633–2635. [Google Scholar] [CrossRef]
- Evanno, G.; Regnaut, S.; Goudet, J. Detecting the number of clusters of individuals using the software structure: A simulation study. Mol. Ecol. 2005, 14, 2611–2620. [Google Scholar] [CrossRef] [PubMed]
- Grzesiak, M.T.; Marcinska, I.; Jano Wiak, F.; Rzepka, A.; Hura, T. The relationship between seedling growth and grain yield under drought conditions in maize and triticale genotypes. Acta Physiol. Plant 2012, 34, 1757–1764. [Google Scholar] [CrossRef]
- Kadkhodaie, A.; Zahedi, M.; Razmjoo, J.; Ressarakli, M. Changes in some anti-oxidative enzymes and physiological indices among sesame genotypes (Sesamum indicum L.) in response to soil water deficits under field conditions. Acta Physiol. Plant 2014, 36, 641–650. [Google Scholar] [CrossRef]
- Ahmadi, J.; Pour-Aboughadareh, A.; Fabriki-Ourang, S.; Khalili, P.; Poczai, P. Unravelling salinity stress responses in ancestral and neglected wheat species at early growth stage: A baseline for utilization in future wheat improvement programs. Physiol. Mol. Biol. Plants 2020, 26, 537–549. [Google Scholar] [CrossRef] [PubMed]
- Akbari, M.; Katam, R.; Husain, R.; Farajpour, M.; Mazzuca, S.; Mahna, N. Sodium chloride induced stress responses of antioxidative activities in leaves and roots of pistachio rootstock. Biomolecules 2020, 10, 189. [Google Scholar] [CrossRef] [Green Version]
- Pour-Aboughadareh, A.; Mehrvar, M.R.; Sanjan, S.; Amini, A.; Nikkhah-Chamanabad, H.R.; Asadi, A. Effects of salinity stress on seedling biomass, physiochemical properties, and grain yield in different breeding wheat genotypes. Acta Plant Physiol. 2021, 43, 98. [Google Scholar] [CrossRef]
- Bouchemal, K.; Bouldjadj, R.; Belbekri, M.N.; Ykhlef, N.; Djekoun, A. Differences in antioxidant enzyme activities and oxidative markers in ten wheat (Triticum durum Desf.) genotypes in response to drought, heat and paraquat stress. Arch. Agron. Soil Sci. 2016, 63, 710–722. [Google Scholar] [CrossRef]
- Jaleel, C.A.; Manivannan, P.; Wahid, A.; Farooq, M.; Somasundaram, R.; Panneerselvam, R. Drought stress in plants: A review on morphological characteristics and pigments composition. Int. J. Agric. Biol. 2009, 11, 100–105. [Google Scholar]
- Fitter, A. Characteristics and functions of root systems. In Plant Roots: The Hidden Half; Waisel, Y., Eshel, A., Beeckman, T., Kafkafi, U., Eds.; CRC Press: London, UK, 2002; pp. 15–32. [Google Scholar]
- Naghavi, M.R.; Mardi, M.; Pirseyedi, S.M.; Kazemi, K.; Potki, P.; Ghaffari, M.R. Comparison of genetic variation among accessions of Aegilops tauschii using AFLP and SSR markers. Genet. Resour. Crop. Evol. 2007, 54, 237–240. [Google Scholar] [CrossRef]
- Naghavi, M.R.; Aghaei, M.J.; Taleei, A.R.; Omidi, M.; Hassani, M.E. Genetic diversity of the D-genome in T. aestivum and Aegilops species using SSR markers. Genet. Resour. Crop. Evol. 2009, 56, 499–506. [Google Scholar] [CrossRef]
- Pour-Aboughadareh, A.; Jadidi, O.; Shooshtari, L.; Poczai, P.; Mehrabi, A.A. Association analysis for some biochemical traits in wild relatives of wheat under drought stress conditions. Genes 2022, 13, 1491. [Google Scholar] [CrossRef] [PubMed]
- Gurung, S.; Mamidi, S.; Bonman, J.M.; Xiong, M.; Brown-Guedira, G.; Adhikari, T.B. Genome-wide association study reveals novel quantitative trait loci associated with resistance to multiple leaf spot diseases of spring wheat. PLoS ONE 2014, 9, e108179. [Google Scholar] [CrossRef] [PubMed]
- Maulana, F.; Ayalew, H.; Anderson, J.D.; Kumssa, T.T.; Huang, W.; Ma, X.F. Genome-wide association mapping of seedling heat tolerance in winter wheat. Front. Plant Sci. 2018, 9, 1272. [Google Scholar] [CrossRef] [Green Version]
- Debibakas, S.; Rocher, S.; Garsmeur, O.; Toubi, L.; Roques, D.; D’Hont, A.; Hoarau, J.Y.; Daugrois, J.H. Prospecting sugarcane resistance to sugarcane yellow leaf virus by genome-wide association. Theor. Appl. Genet. 2014, 127, 1719–1732. [Google Scholar] [CrossRef] [PubMed]


| Traits | Replication (df = 2) | Stress (S; df = 1) | Accession (A; df = 94) | S×A (df = 94) | Error (df = 378) | MC † | MS † | RC † |
|---|---|---|---|---|---|---|---|---|
| Relative chlorophyll | 120.94 | 3169.03 *** | 64.12 *** | 34.32 *** | 15.91 | 37.62 | 32.90 | 12.56 |
| Initial fluorescence | 0.001 | 0.019 ns | 0.001 *** | 0.0003 *** | 0.0002 | 0.08 | 0.09 | −15.07 |
| Maximum quantum yield of PSII | 0.076 | 4.93 *** | 0.005 *** | 0.003 ** | 0.003 | 0.81 | 0.62 | 22.98 |
| Maximum primary yield of PSII | 62.72 | 57.54 *** | 1.70 * | 1.16 ns | 1.23 | 3.93 | 3.29 | 16.19 |
| Stomatal conductance | 44.43 | 5729.83 *** | 231.72 *** | 268.78 *** | 75.42 | 51.87 | 31.86 | 38.58 |
| Leaf relative water content | 114.04 | 11,717.41 *** | 208.98 *** | 115.54 ns | 93.07 | 74.04 | 45.95 | 37.94 |
| Chlorophyll a content | 94.27 | 890.51 *** | 3.93 *** | 2.47 *** | 1.72 | 11.93 | 9.42 | 21.02 |
| Chlorophyll b content | 175.53 | 1507.63 *** | 8.01 *** | 3.06 ns | 2.63 | 7.34 | 4.07 | 44.56 |
| Total chlorophyll content | 525.95 | 4715.53 *** | 20.78 *** | 7.53 ns | 6.98 | 19.27 | 13.49 | 29.98 |
| Carotenoid content | 2.41 | 3.29 *** | 0.14 ns | 0.18 ** | 0.11 | 1.80 | 1.65 | 8.33 |
| Shoot fresh biomass | 0.94 | 28.18 *** | 1.01 *** | 0.28 *** | 0.12 | 1.30 | 0.85 | 34.41 |
| Shoot dry biomass | 1.66 | 29.27 *** | 0.05 *** | 0.005 ns | 0.03 | 0.65 | 0.19 | 70.27 |
| Trait | Control Condition | Water-Deficit Stress Condition | |||||||
|---|---|---|---|---|---|---|---|---|---|
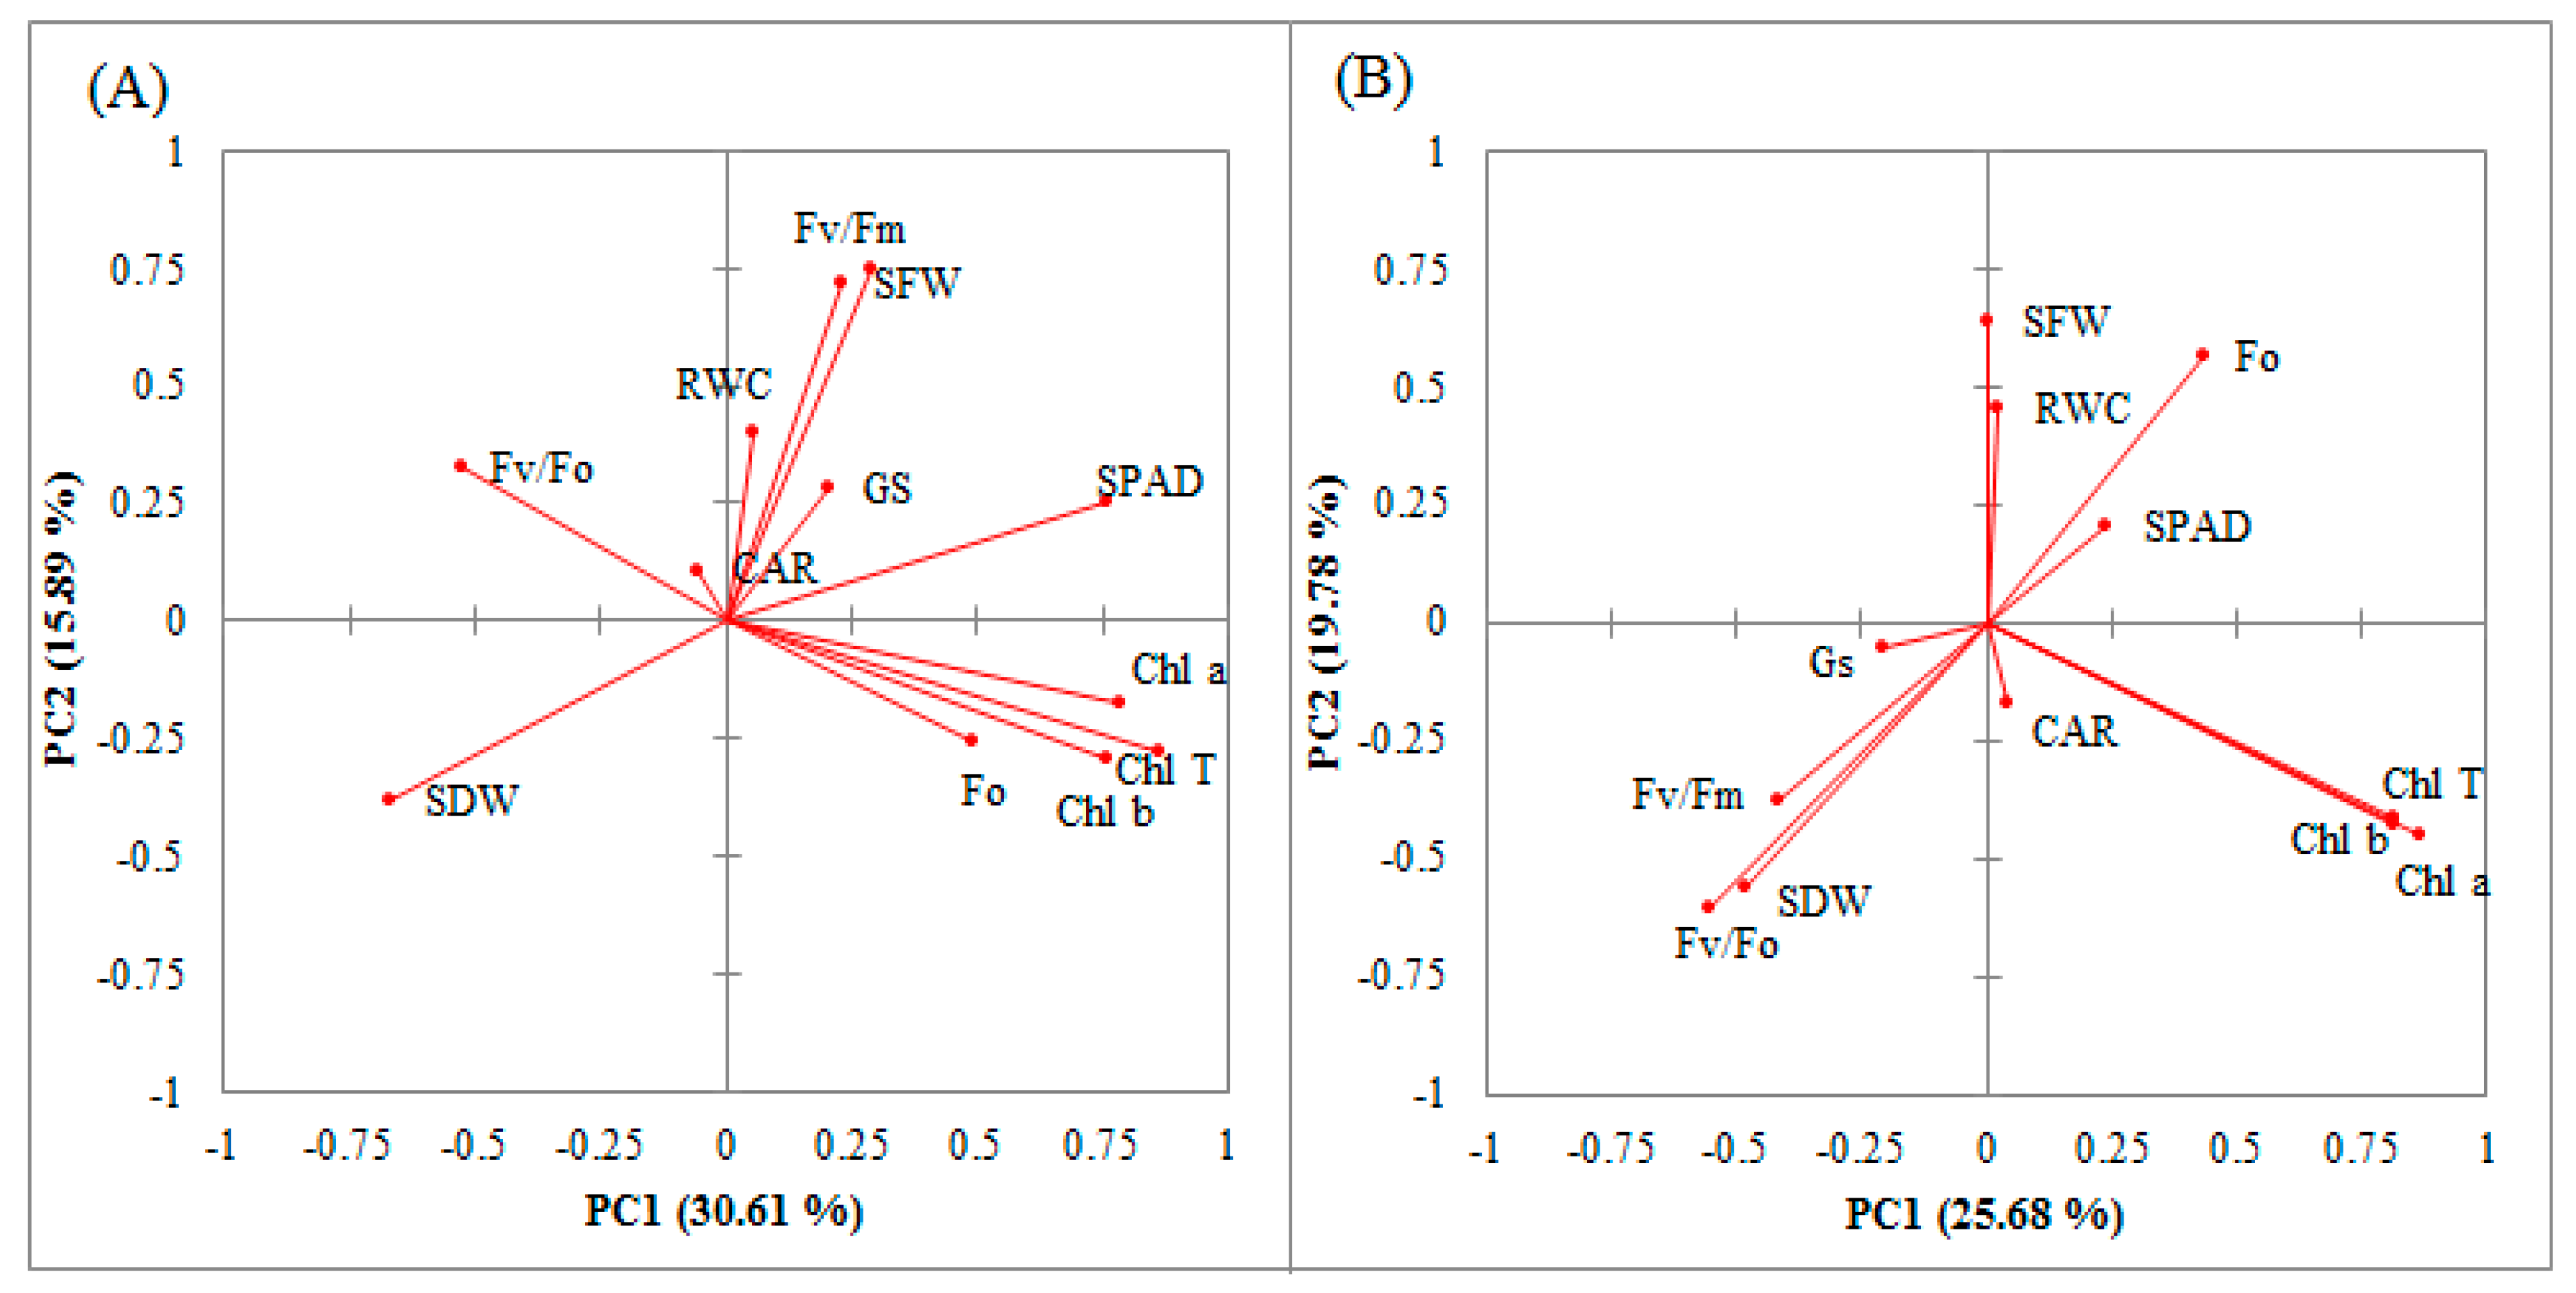
| PC1 | PC2 | PC3 | PC4 | PC1 | PC2 | PC3 | PC4 | PC5 | |
| SPAD | 0.762 | 0.250 | 0.066 | 0.126 | 0.242 | 0.204 | 0.475 | 0.115 | −0.488 |
| Fo | 0.494 | −0.255 | 0.679 | −0.243 | 0.432 | 0.562 | −0.159 | 0.072 | 0.091 |
| Fv/Fm | 0.287 | 0.747 | −0.106 | 0.044 | −0.418 | −0.380 | 0.710 | 0.171 | −0.075 |
| Fv/Fo | −0.529 | 0.328 | −0.568 | 0.273 | −0.553 | −0.603 | 0.459 | 0.123 | −0.026 |
| SFW | 0.229 | 0.720 | −0.045 | −0.206 | 0.002 | 0.635 | 0.539 | 0.112 | 0.062 |
| SDW | −0.670 | −0.385 | −0.263 | −0.060 | −0.485 | −0.562 | −0.209 | −0.080 | 0.025 |
| RWC | 0.052 | 0.403 | 0.267 | −0.512 | 0.024 | 0.451 | 0.562 | 0.165 | 0.342 |
| Chl a | 0.786 | −0.178 | −0.081 | 0.450 | 0.815 | −0.429 | 0.098 | 0.270 | 0.159 |
| Chl b | 0.757 | −0.294 | −0.498 | −0.253 | 0.812 | −0.412 | 0.239 | −0.293 | −0.002 |
| Chl T | 0.863 | −0.276 | −0.365 | 0.044 | 0.868 | −0.448 | 0.186 | −0.036 | 0.077 |
| CAR | −0.057 | 0.109 | 0.499 | 0.797 | 0.043 | −0.169 | −0.344 | 0.886 | 0.168 |
| GS | 0.203 | 0.279 | −0.252 | 0.169 | −0.208 | −0.057 | 0.152 | −0.233 | 0.793 |
| Eigenvalue | 3.67 | 1.91 | 1.64 | 1.39 | 3.08 | 2.37 | 1.86 | 1.11 | 1.06 |
| Variability (%) | 30.61 | 15.89 | 13.69 | 11.60 | 25.68 | 19.78 | 15.49 | 9.23 | 8.86 |
| Cumulative (%) | 30.61 | 46.50 | 60.19 | 71.78 | 25.68 | 45.46 | 60.95 | 70.19 | 79.04 |
| Primer | Chromosome Position | Sequence (5′–3′) | AT | N | H | PIC | Rp | MI | |
|---|---|---|---|---|---|---|---|---|---|
| Xgwm-16 | 5D | F | GCTTGGACTAGCTAGAGTATCATAC | 62.8 | 2 | 0.49 | 0.37 | 1.18 | 0.74 |
| R | CAATCTTCAATTCTGTCGCACGG | ||||||||
| Xgwm-44 | 7D | F | GTTGAGCTTTTCAGTTCGGC | 59.9 | 2 | 0.35 | 0.29 | 1.57 | 0.58 |
| R | ACTGGCATCCACTGAGCTG | ||||||||
| Xgwm-111 | 7D | F | TCTGTAGGCTCTCTCCGACTG | 59.5 | 2 | 0.18 | 0.16 | 1.86 | 0.32 |
| R | ACCTGATCAGATCCCACTCG | ||||||||
| Xgwm-121 | 5D & 7D | F | TCCTCTACAAACAAACACAC | 54.3 | 2 | 0.49 | 0.37 | 1.11 | 0.98 |
| R | CTCGCAACTAGAGGTGTATG | ||||||||
| Xgwm-271 | 5D | F | CAAGATCGTGGAGCCAGC | 58.5 | 2 | 0.43 | 0.34 | 1.43 | 0.74 |
| R | AGCTGCTAGCTTTTGGGACA | ||||||||
| Xgwm-272 | 5D | F | TGCTCTTTGGCGAATATATGG | 55.9 | 2 | 0.25 | 0.21 | 1.75 | 0.68 |
| R | GTTCAAAACAAATTAAAAGGCCC | ||||||||
| Xgwm-292 | 5D | F | TCACCGTGGTCACCGAC | 59.3 | 2 | 0.41 | 0.33 | 1.52 | 0.42 |
| R | CCACCGAGCCGATAATGTAC | ||||||||
| Xgwm-296 | 2D | F | AATTCAACCTACCAATCTCTG | 55.6 | 2 | 0.48 | 0.36 | 1.26 | 0.66 |
| R | GCCTAATAAACTGAAAACGAG | ||||||||
| Xgwm-301 | 2D | F | GAGGAGTAAGACACATGCCC | 59.5 | 2 | 0.49 | 0.37 | 1.25 | 0.72 |
| R | GTGGCTGGAGATTCAGGTTC | ||||||||
| Xgwm-325 | 6D | F | TTTCTTCTGTCGTTCTCTTCCC | 69.3 | 2 | 0.49 | 0.37 | 1.03 | 0.74 |
| R | TTTTTACGCGTCAACGACG | ||||||||
| Xgwm-349 | 2D | F | GGCTTCCAGAAAACAACAGG | 59.5 | 2 | 0.49 | 0.37 | 1.28 | 0.74 |
| R | ATCGGTGCGTACCATCCTAC | ||||||||
| Xgwm-382 | 2D | F | GTCAGATAACGCCGTCCAAT | 59.2 | 2 | 0.48 | 0.36 | 1.20 | 0.74 |
| R | CTACGTGCACCACCATTTTG | ||||||||
| Xgwm-455 | 2D | F | ATTCGGTTCGCTAGCTACCA | 56 | 2 | 0.49 | 0.37 | 1.22 | 0.72 |
| R | ACGGAGAGCAACCTGCC | ||||||||
| Xgwm-469 | 6D | F | CAACTCAGTGCTCACACAACG | 63.5 | 2 | 0.50 | 0.37 | 1.04 | 0.74 |
| R | CGATAACCACTCATCCACACC | ||||||||
| Xgwm-515 | 2D | F | AACACAATGGCAAATGCAGA | 60 | 2 | 0.46 | 0.35 | 1.34 | 0.70 |
| R | CCTTCCTAGTAAGTGTGCCTCA | ||||||||
| Xgwm-565 | 5D | F | GCGTCAGATATGCCTACCTAGG | 62.1 | 2 | 0.30 | 0.26 | 1.69 | 0.52 |
| R | AGTGAGTTAGCCCTGAGCCA | ||||||||
| Xgwm-583 | 5D | F | TTCACACCCAACCAATAGCA | 59.3 | 2 | 0.50 | 0.37 | 1.04 | 0.74 |
| R | TCTAGGCAGACACATGCCTG | ||||||||
| Xgwm-608 | 2D & 4D | F | ACATTGTGTGTGCGGCC | 60.4 | 2 | 0.50 | 0.37 | 1.02 | 0.74 |
| R | GATCCCTCTCCGCTAGAAGC | ||||||||
| Xgwm-624 | 4D | F | TTGATATTAAATCTCTCTATGTG | 51.3 | 2 | 0.49 | 0.38 | 1.14 | 0.76 |
| R | AATTTTATTTGAGCTATGCG | ||||||||
| Xgwm-639 | 5D | F | CTCTCTCCATTCGGTTTTCC | 59.5 | 1 | 0 | 0 | 0 | 0 |
| R | CATGCCCCCCTTTTCTG | ||||||||
| Xgwm-157 | 2D | F | GTCGTCGCGGTAAGCTTG | 60 | 2 | 0.50 | 0.37 | 1.05 | 0.74 |
| R | GAGTGAACACACGAGGCTTG | ||||||||
| Xgwm-212 | 5D | F | AAGCAACATTTGCTGCAATG | 60 | 2 | 0.38 | 0.30 | 1.56 | 0.60 |
| R | TGCAGTTAACTTGTTGAAAGGA | ||||||||
| Xgwm-232 | 1D | F | ATCTCAACGGCAAGCCG | 55 | 2 | 0.15 | 0.14 | 1.88 | 0.28 |
| R | CTGATGCAAGCAATCCACC | ||||||||
| Xgwm-311 | 2D | F | TCACGTGGAAGACGCTCC | 60 | 2 | 0.46 | 0.35 | 1.31 | 0.70 |
| R | CTACGTGCACCACCATTTTG | ||||||||
| Xgwm-484 | 2D | F | ACATCGCTCTTCACAAACCC | 55 | 2 | 0.49 | 0.37 | 1.15 | 0.74 |
| R | AGTTCCGGTCATGGCTAGG | ||||||||
| Mean | 1.96 | 0.41 | 0.32 | 1.27 | 0.80 | ||||
| Genetic Variation Parameter | Ae. tauschii (n = 48) | T. aestivum (n = 47) | Variation between Species | Variation within Species |
|---|---|---|---|---|
| Number of observed alleles (Na) | 1.87 ± 0.05 | 1.65 ± 0.09 | 14% | 86% |
| Number of effective alleles (Ne) | 1.66 ± 0.04 | 1.47 ± 0.09 | ||
| Shannon’s information index (I) | 0.53 ± 0.03 | 0.39 ± 0.05 | ||
| Nei’s genetic diversity (He) | 0.37 ± 0.02 | 0.27 ± 0.04 | ||
| Percentage polymorphism loci (PPL) | 89.8 | 73.47 |
| Trait | Control Condition | Trait | Water-Deficit Stress Condition | ||||
|---|---|---|---|---|---|---|---|
| Marker | p-Value | R2 | Marker | p-Value | R2 | ||
| CAR | Xgwm-121 | 0.004 | 10.884 | CAR | Xgwm-121 | 0.006 | 13.782 |
| CAR | Xgwm-271 | 0.003 | 11.886 | CAR | Xgwm-271 | 0.013 | 14.508 |
| Chla | Xgwm-111 | 0.027 | 8.502 | Chla | Xgwm-111 | 0.011 | 10.496 |
| Chla | Xgwm-44 | 0.039 | 9.141 | Chla | Xgwm-44 | 0.015 | 11.426 |
| Chla | Xgwm-455 | 0.025 | 9.465 | Chla | Xgwm-455 | 0.018 | 12.644 |
| Chlb | Xgwm-111 | 0.975 | 8.053 | Chlb | Xgwm-111 | 0.006 | 12.553 |
| Chlb | Xgwm-44 | 0.876 | 9.281 | Chlb | Xgwm-44 | 0.001 | 11.596 |
| Chlb | Xgwm-455 | 0.014 | 10.334 | Chlb | Xgwm-455 | 0.076 | 11.580 |
| Chlb | Xgwm-484 | 0.045 | 6.789 | Chlt | Xgwm-111 | 0.008 | 15.776 |
| Chlt | Xgwm-272 | 0.042 | 6.052 | Chlt | Xgwm-44 | 0.003 | 10.566 |
| Chlt | Xgwm-325 | 0.039 | 6.180 | Chlt | Xgwm-455 | 0.006 | 16.554 |
| Chlt | Xgwm-455 | 0.037 | 8.785 | Fo | Xgwm-271 | 0.035 | 8.418 |
| Fo | Xgwm-271 | 0.006 | 15.214 | Fo | Xgwm-455 | 0.148 | 11.292 |
| Fv/Fm | Xgwm-272 | 0.005 | 10.554 | Fv/Fm | Xgwm-272 | 0.012 | 14.748 |
| Fv/Fm | Xgwm-292 | 0.008 | 9.742 | Fv/Fm | Xgwm-292 | 0.047 | 16.037 |
| Fv/Fo | Xgwm-292 | 0.020 | 8.676 | Fv/Fo | Xgwm-272 | 0.046 | 5.242 |
| Fv/Fo | Xgwm-484 | 0.009 | 16.919 | Fv/Fo | Xgwm-292 | 0.047 | 5.924 |
| Gs | Xgwm-16 | 0.020 | 8.599 | Gs | Xgwm-272 | 0.008 | 14.198 |
| Gs | Xgwm-272 | 0.020 | 12.427 | RWC | Xgwm-292 | 0.040 | 8.877 |
| RWC | Xgwm-232 | 0.049 | 6.490 | RWC | Xgwm-296 | 0.037 | 9.216 |
| RWC | Xgwm-484 | 0.025 | 5.271 | RWC | Xgwm-301 | 0.022 | 10.017 |
| SDW | Xgwm-484 | 0.045 | 5.614 | SDW | Xgwm-565 | 0.040 | 7.125 |
| SDW | Xgwm-565 | 0.039 | 6.325 | SDW | Xgwm-582 | 0.047 | 6.775 |
| SDW | Xgwm-582 | 0.030 | 6.887 | SFW | Xgwm-232 | 0.016 | 8.761 |
| SFW | Xgwm-455 | 0.015 | 9.750 | SFW | Xgwm-484 | 0.019 | 9.397 |
| SFW | Xgwm-484 | 0.012 | 8.587 | SPAD | Xgwm-111 | 0.057 | 9.644 |
| SPAD | Xgwm-565 | 0.011 | 9.117 | SPAD | Xgwm-44 | 0.020 | 9.612 |
| SPAD | Xgwm-582 | 0.014 | 8.613 | ||||
Disclaimer/Publisher’s Note: The statements, opinions and data contained in all publications are solely those of the individual author(s) and contributor(s) and not of MDPI and/or the editor(s). MDPI and/or the editor(s) disclaim responsibility for any injury to people or property resulting from any ideas, methods, instructions or products referred to in the content. |
© 2022 by the authors. Licensee MDPI, Basel, Switzerland. This article is an open access article distributed under the terms and conditions of the Creative Commons Attribution (CC BY) license (https://creativecommons.org/licenses/by/4.0/).
Share and Cite
Khodadadi, Z.; Omidi, M.; Etminan, A.; Ebrahimi, A.; Pour-Aboughadareh, A. Molecular and Physiological Variability in Bread Wheat and Its Wild Relative (Aegilops tauschii Coss.) Species under Water-Deficit Stress Conditions. BioTech 2023, 12, 3. https://doi.org/10.3390/biotech12010003
Khodadadi Z, Omidi M, Etminan A, Ebrahimi A, Pour-Aboughadareh A. Molecular and Physiological Variability in Bread Wheat and Its Wild Relative (Aegilops tauschii Coss.) Species under Water-Deficit Stress Conditions. BioTech. 2023; 12(1):3. https://doi.org/10.3390/biotech12010003
Chicago/Turabian StyleKhodadadi, Zahra, Mansoor Omidi, Alireza Etminan, Asa Ebrahimi, and Alireza Pour-Aboughadareh. 2023. "Molecular and Physiological Variability in Bread Wheat and Its Wild Relative (Aegilops tauschii Coss.) Species under Water-Deficit Stress Conditions" BioTech 12, no. 1: 3. https://doi.org/10.3390/biotech12010003