
Separating and Purifying Mycosporine-like Amino Acids from Cyanobacteria for Application in Commercial Sunscreen Formulations †

Abstract
:1. Introduction
2. Materials and Methods
2.1. Culture Growth
2.2. Biomass Preparation
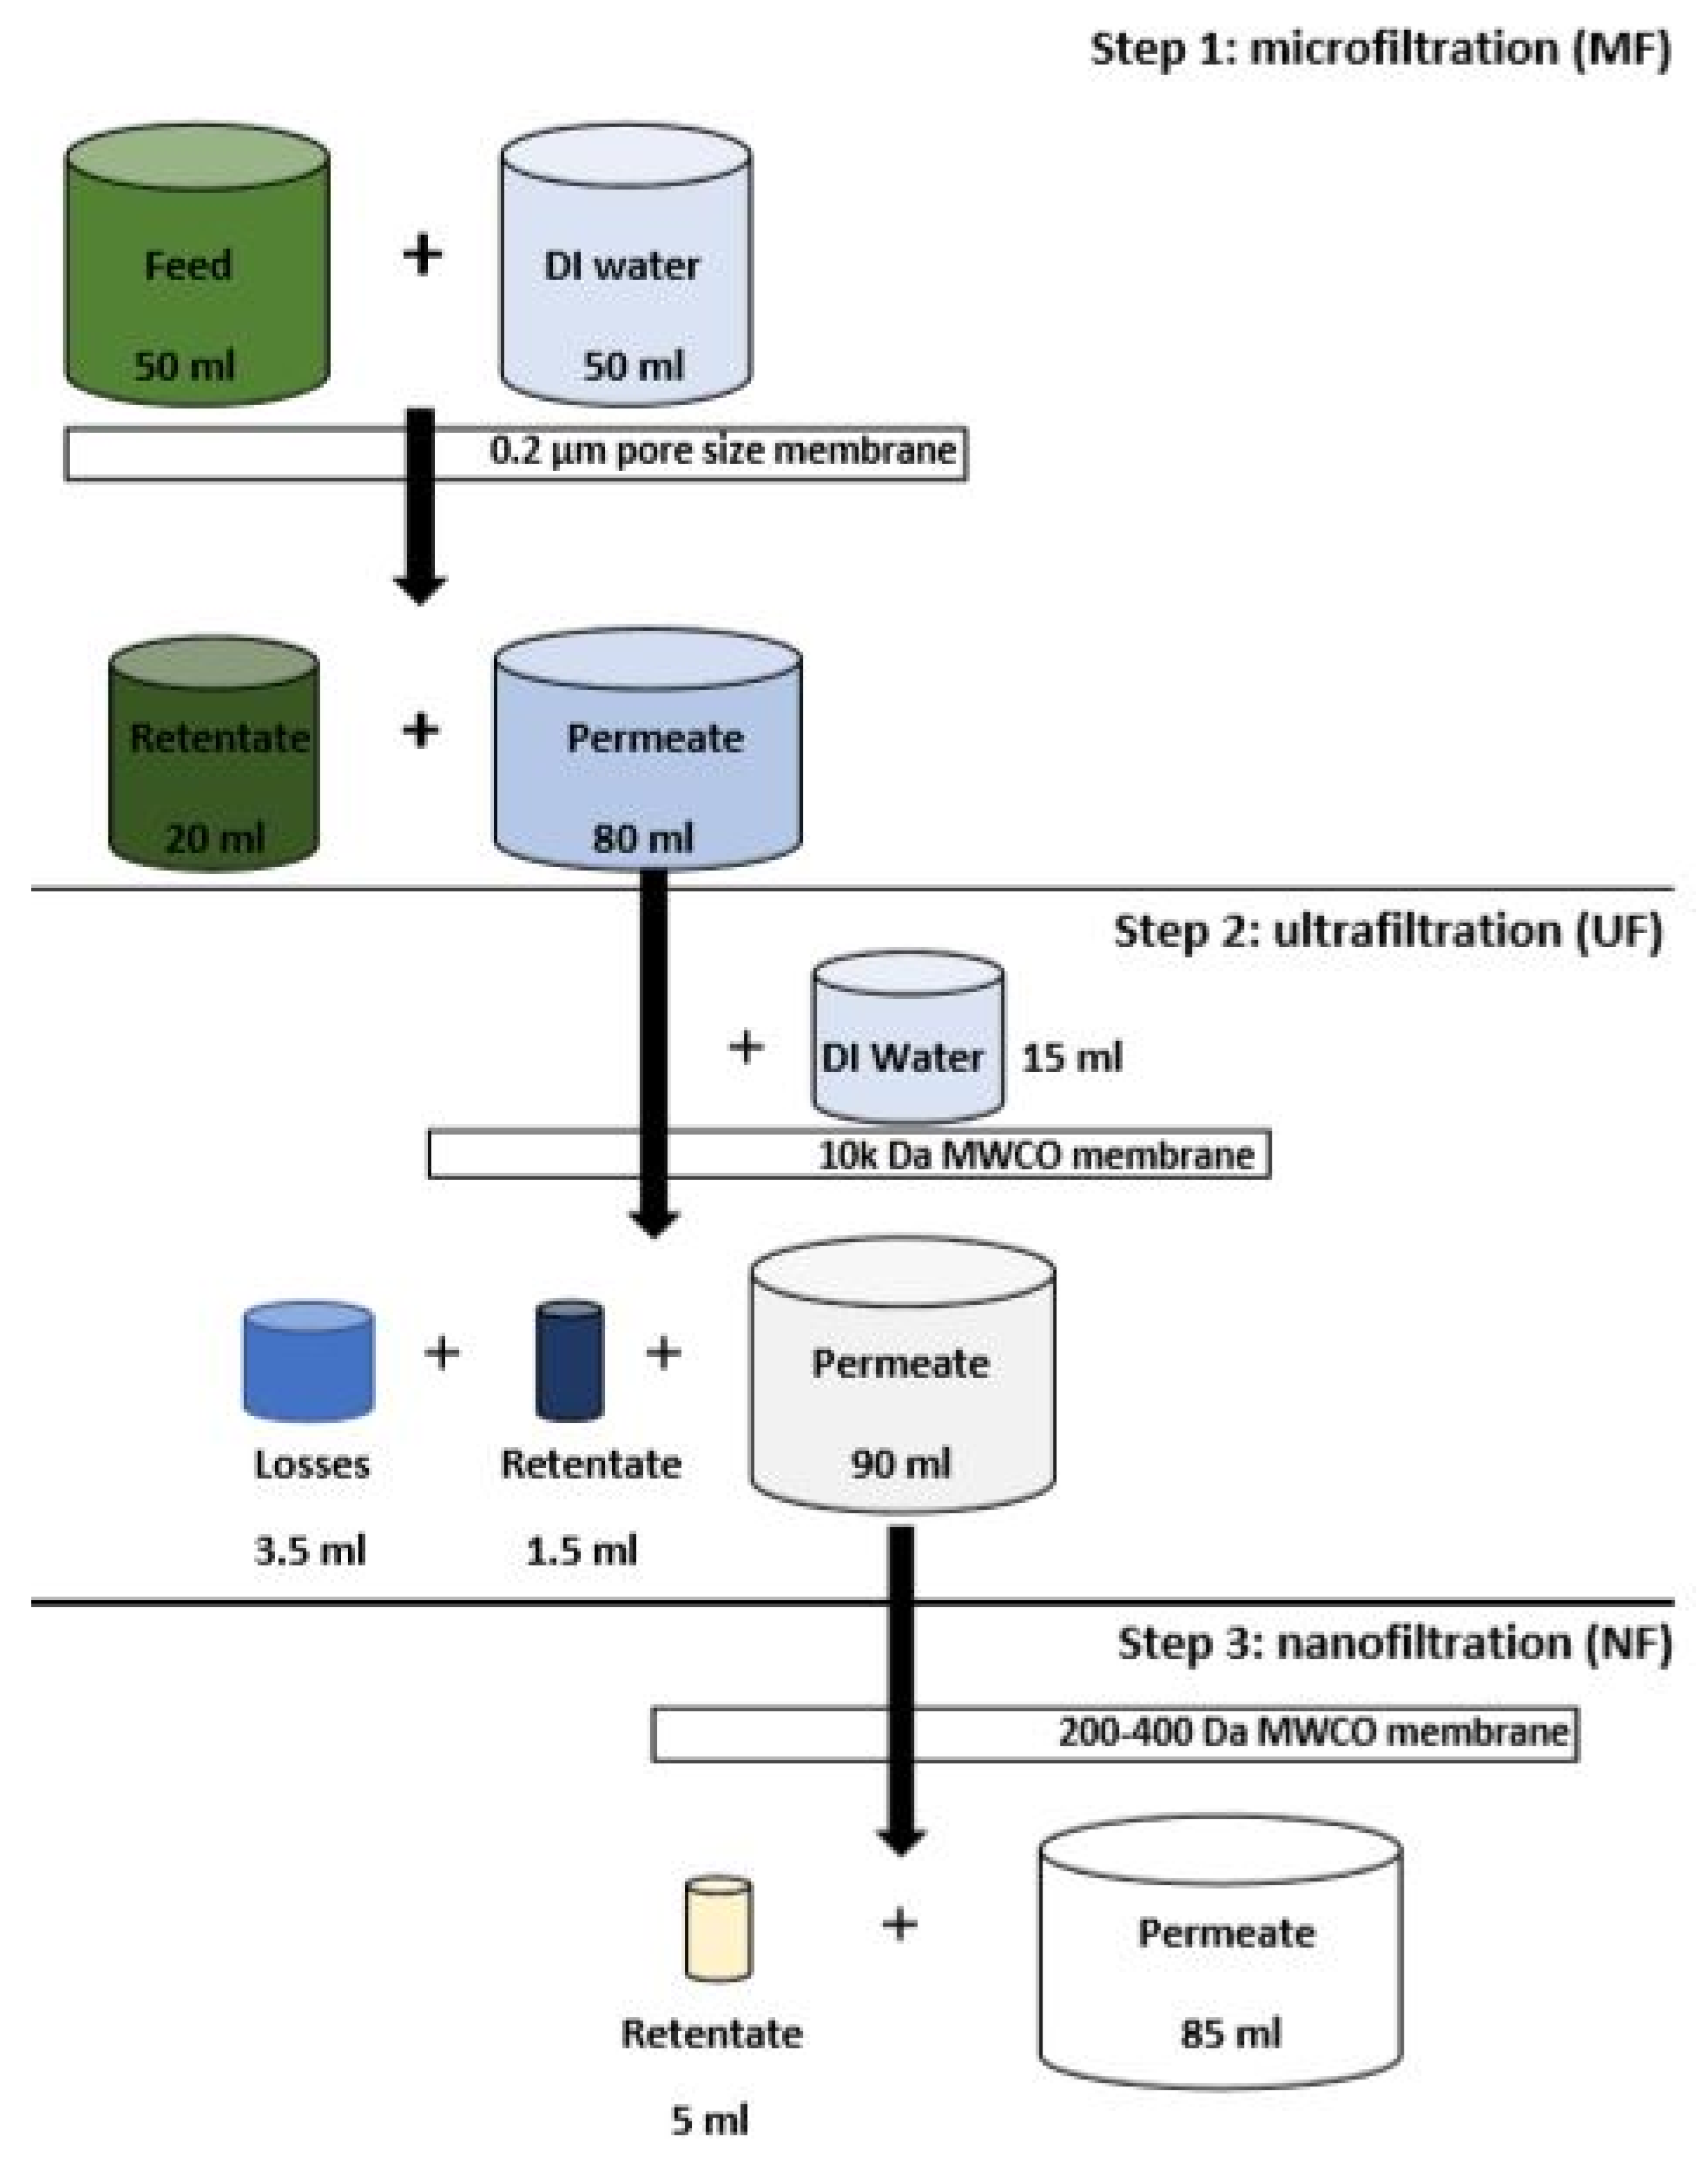
2.3. Membrane Filtration
2.4. Sample Preparation and Analysis
2.4.1. Spectrophotometry
2.4.2. High Performance Liquid Chromatography (HPLC) Analysis
2.4.3. Mass Balance Calculations
3. Results and Discussion
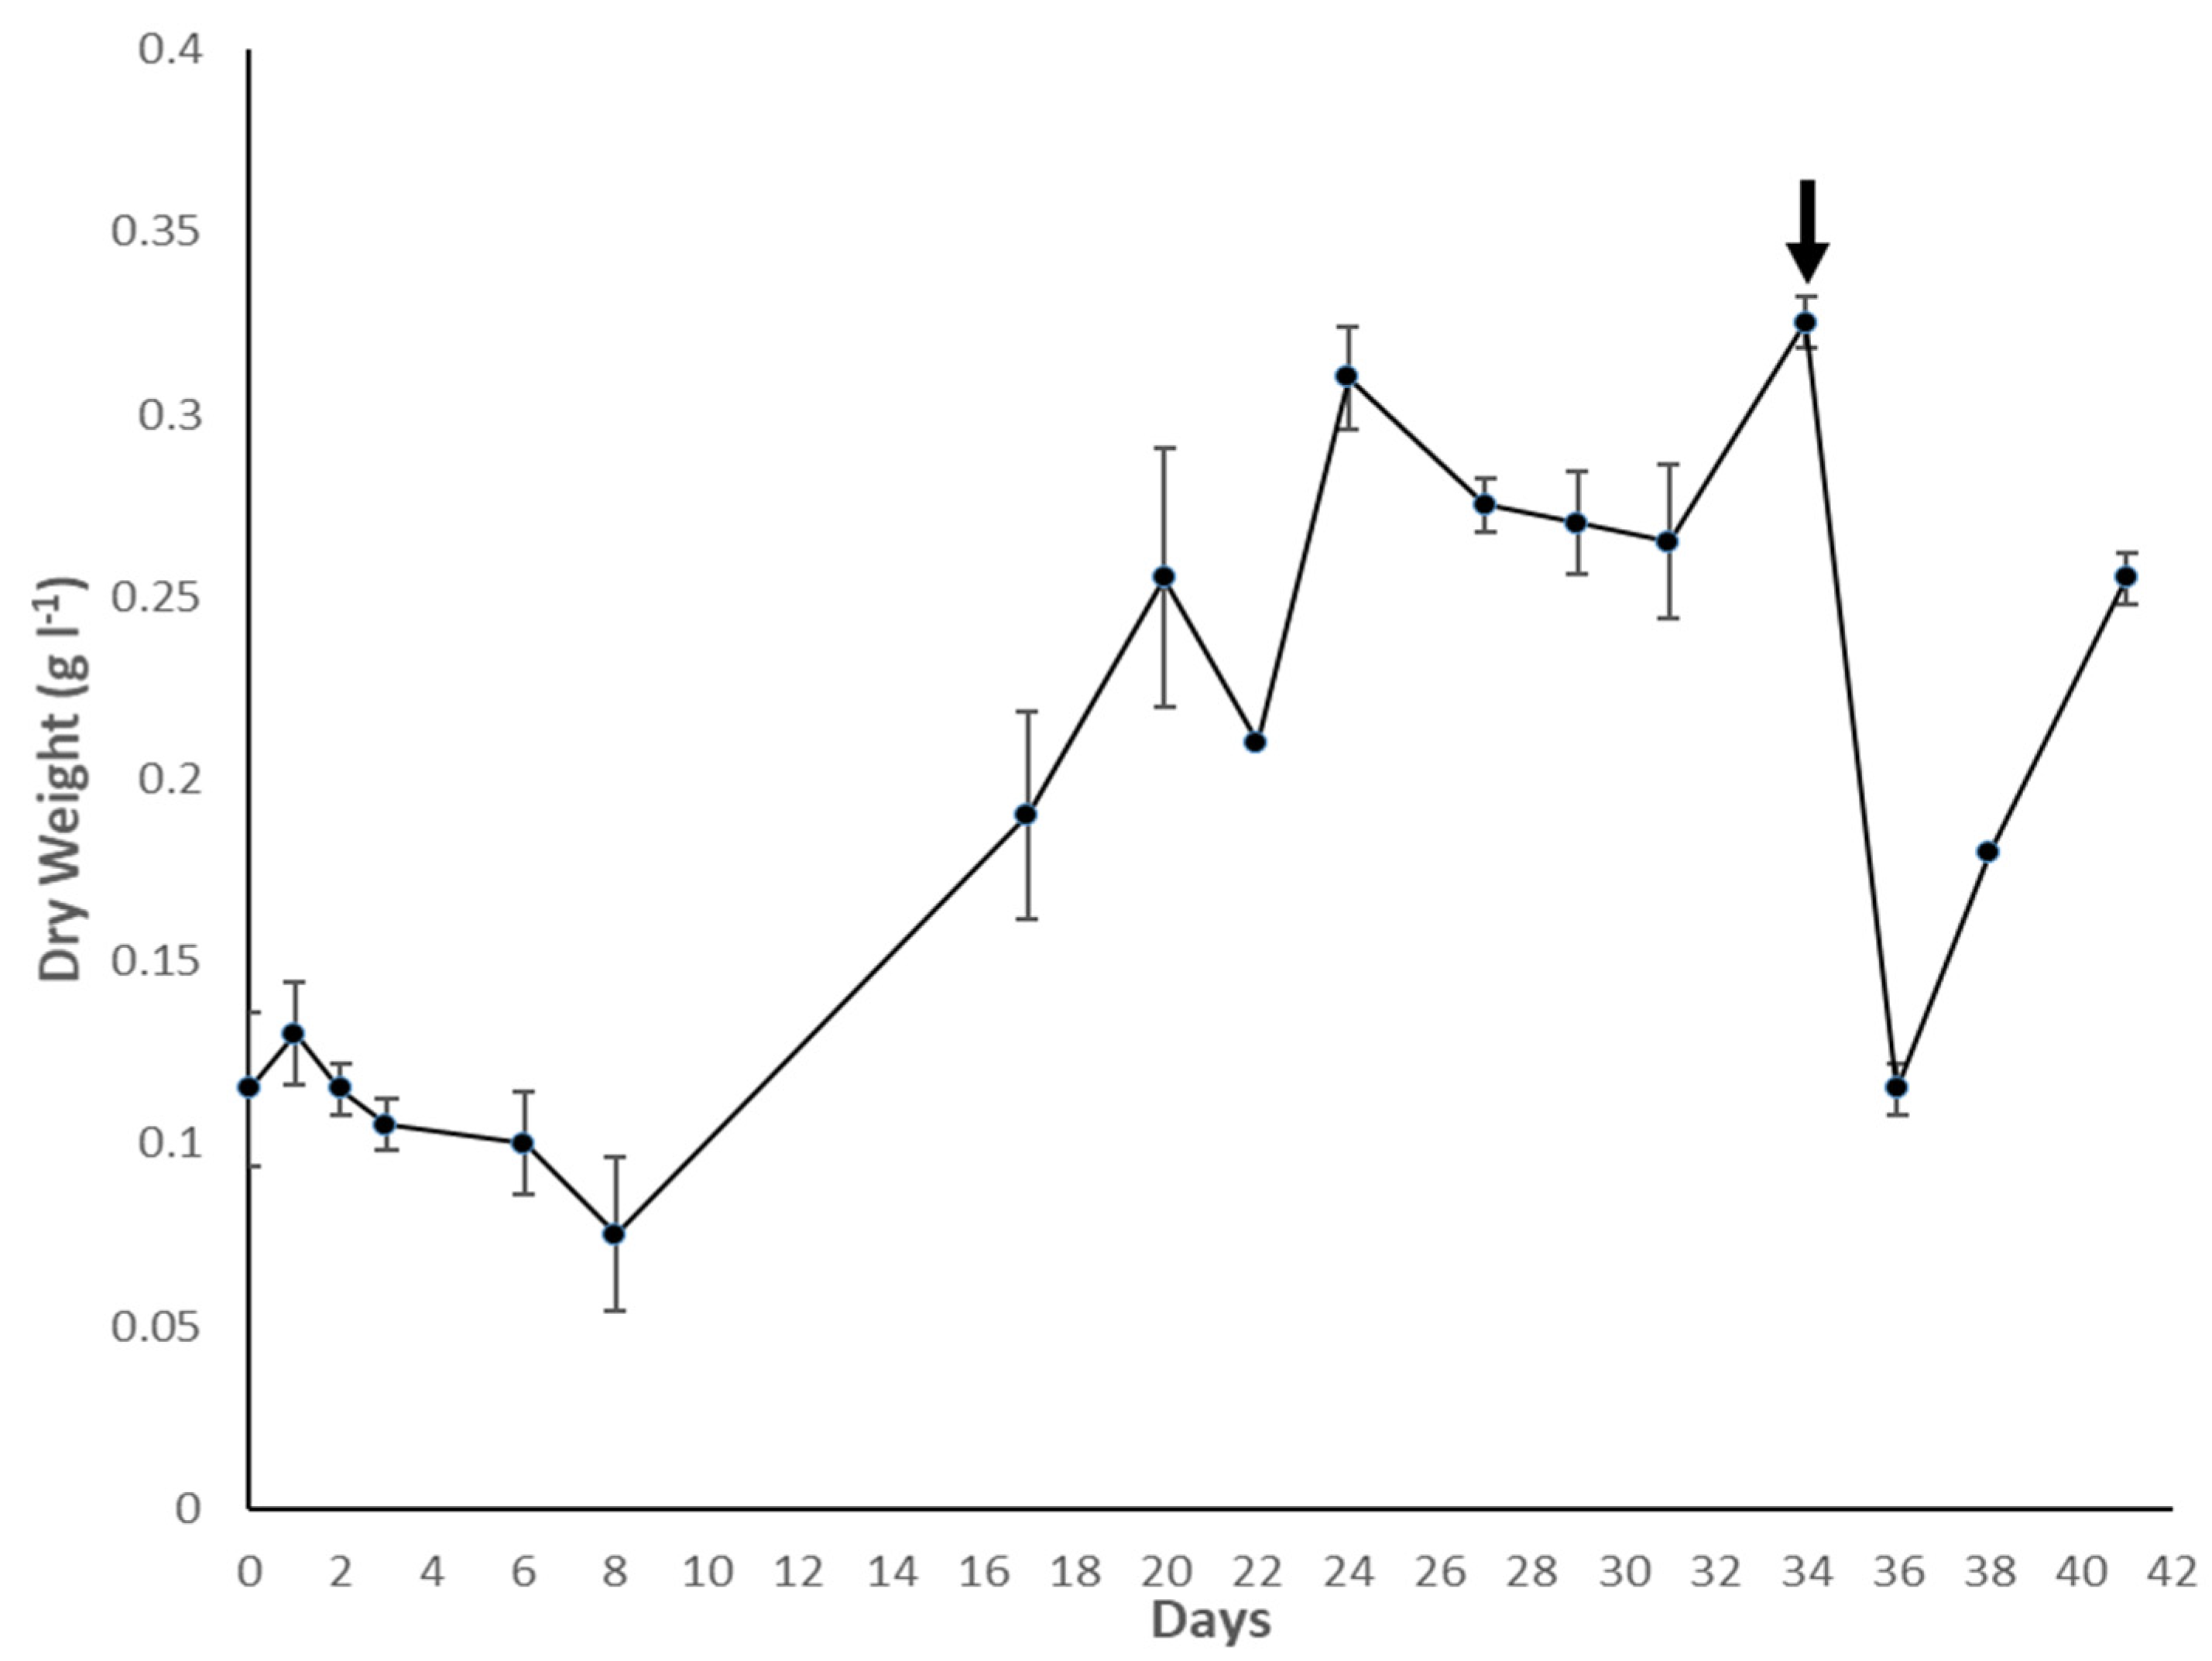
3.1. Culture Growth
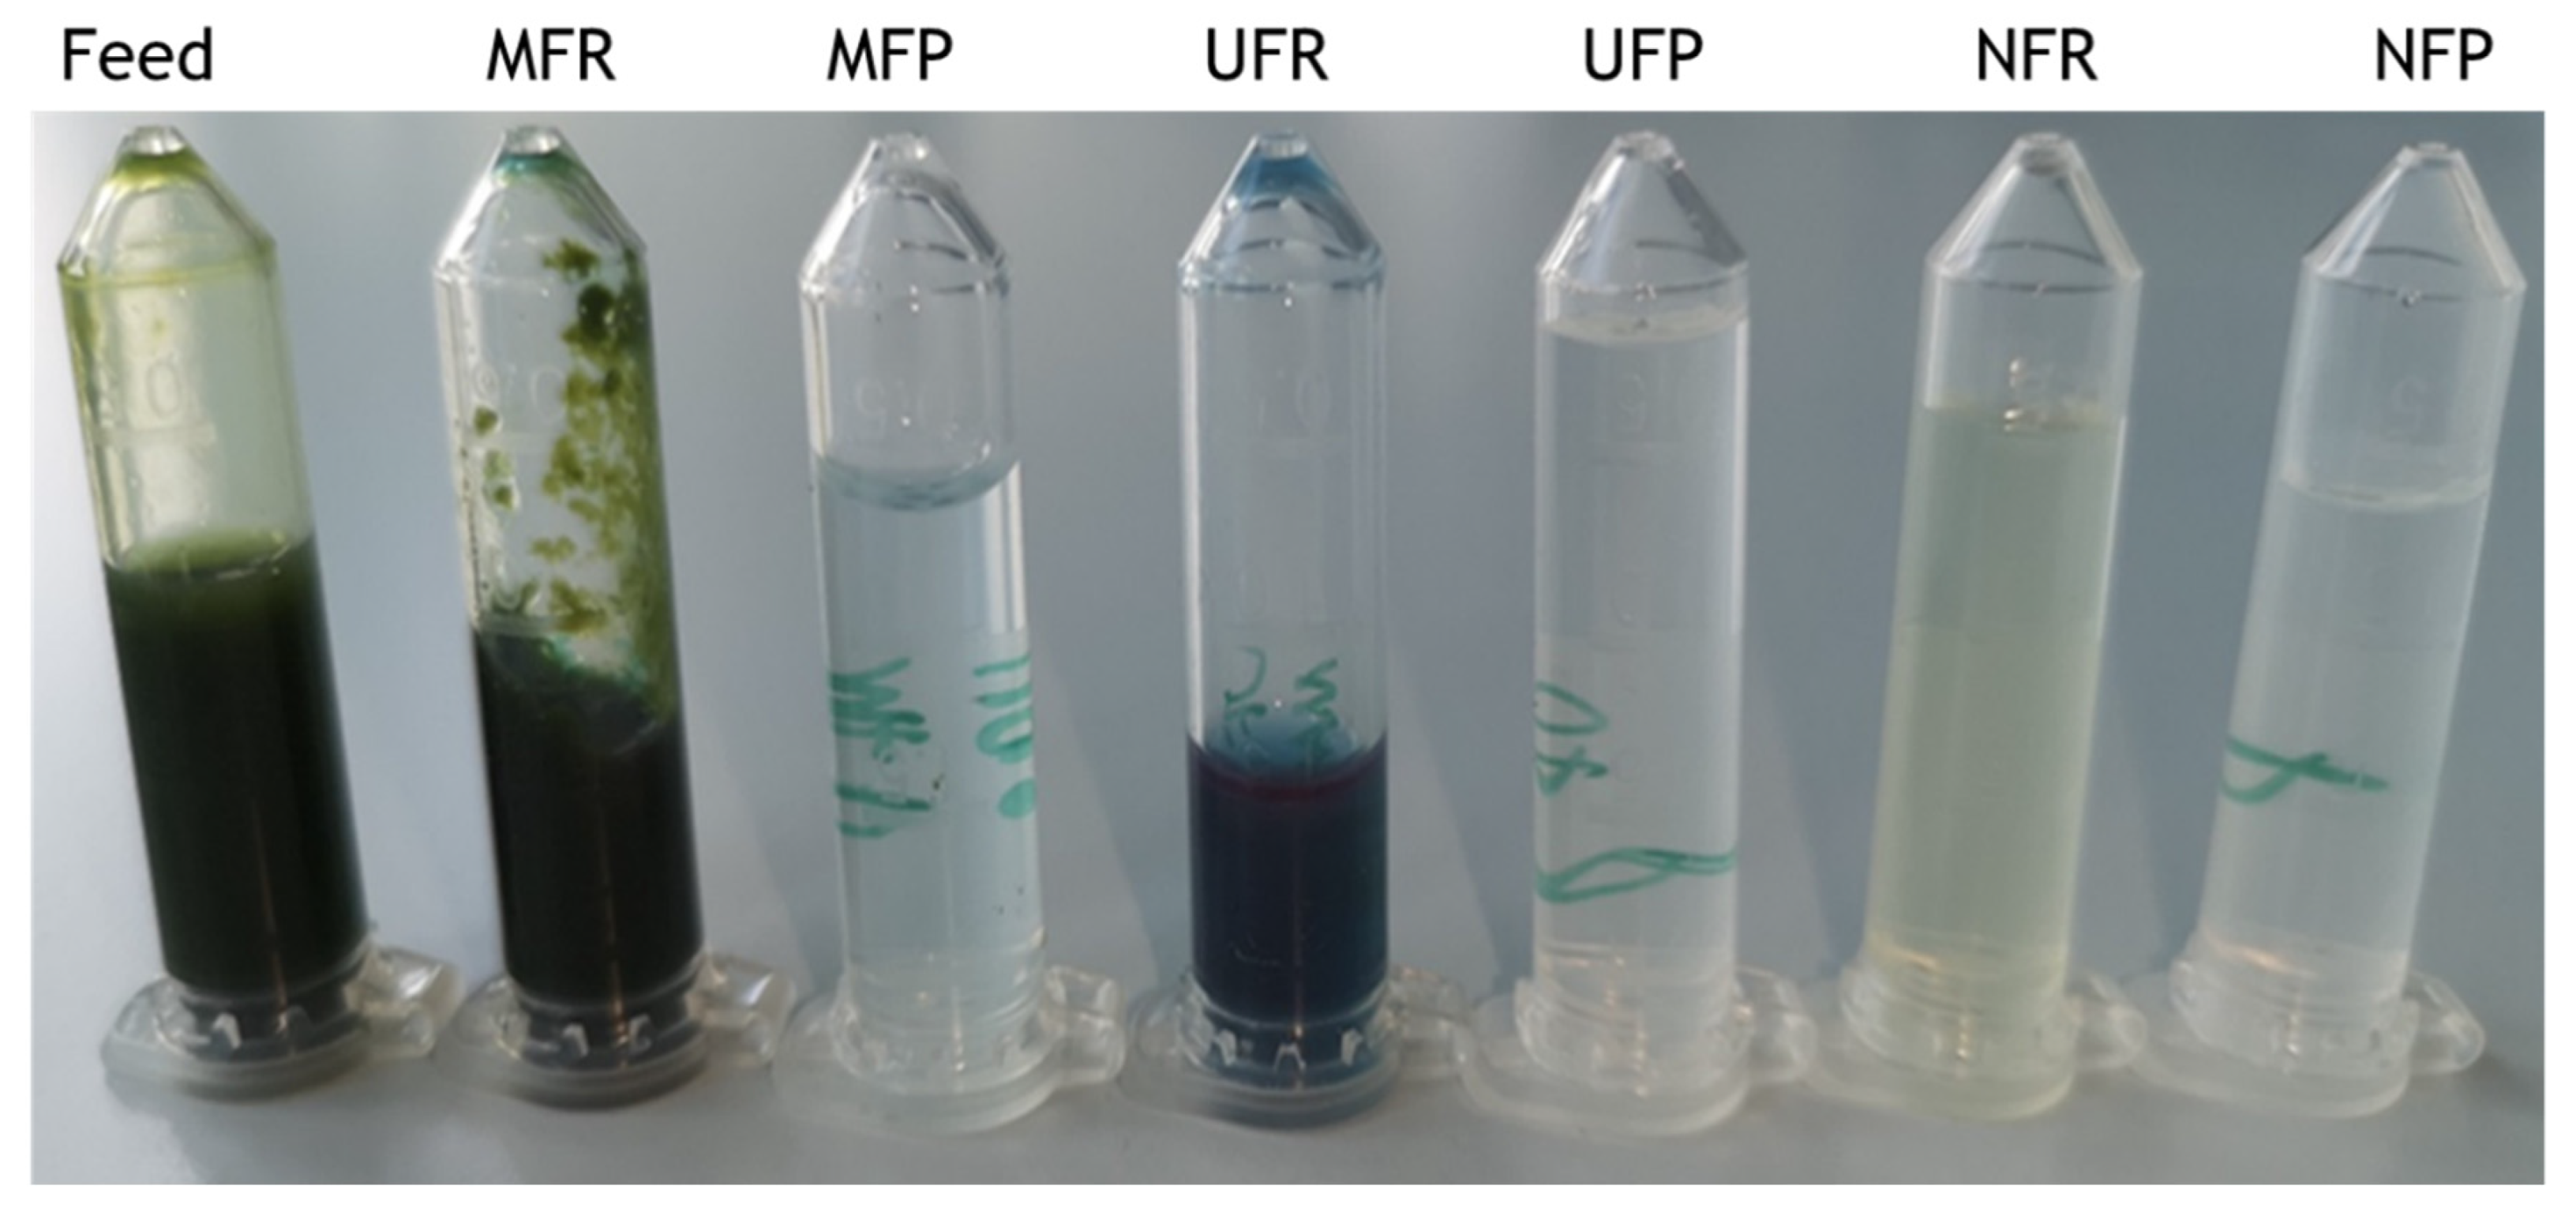
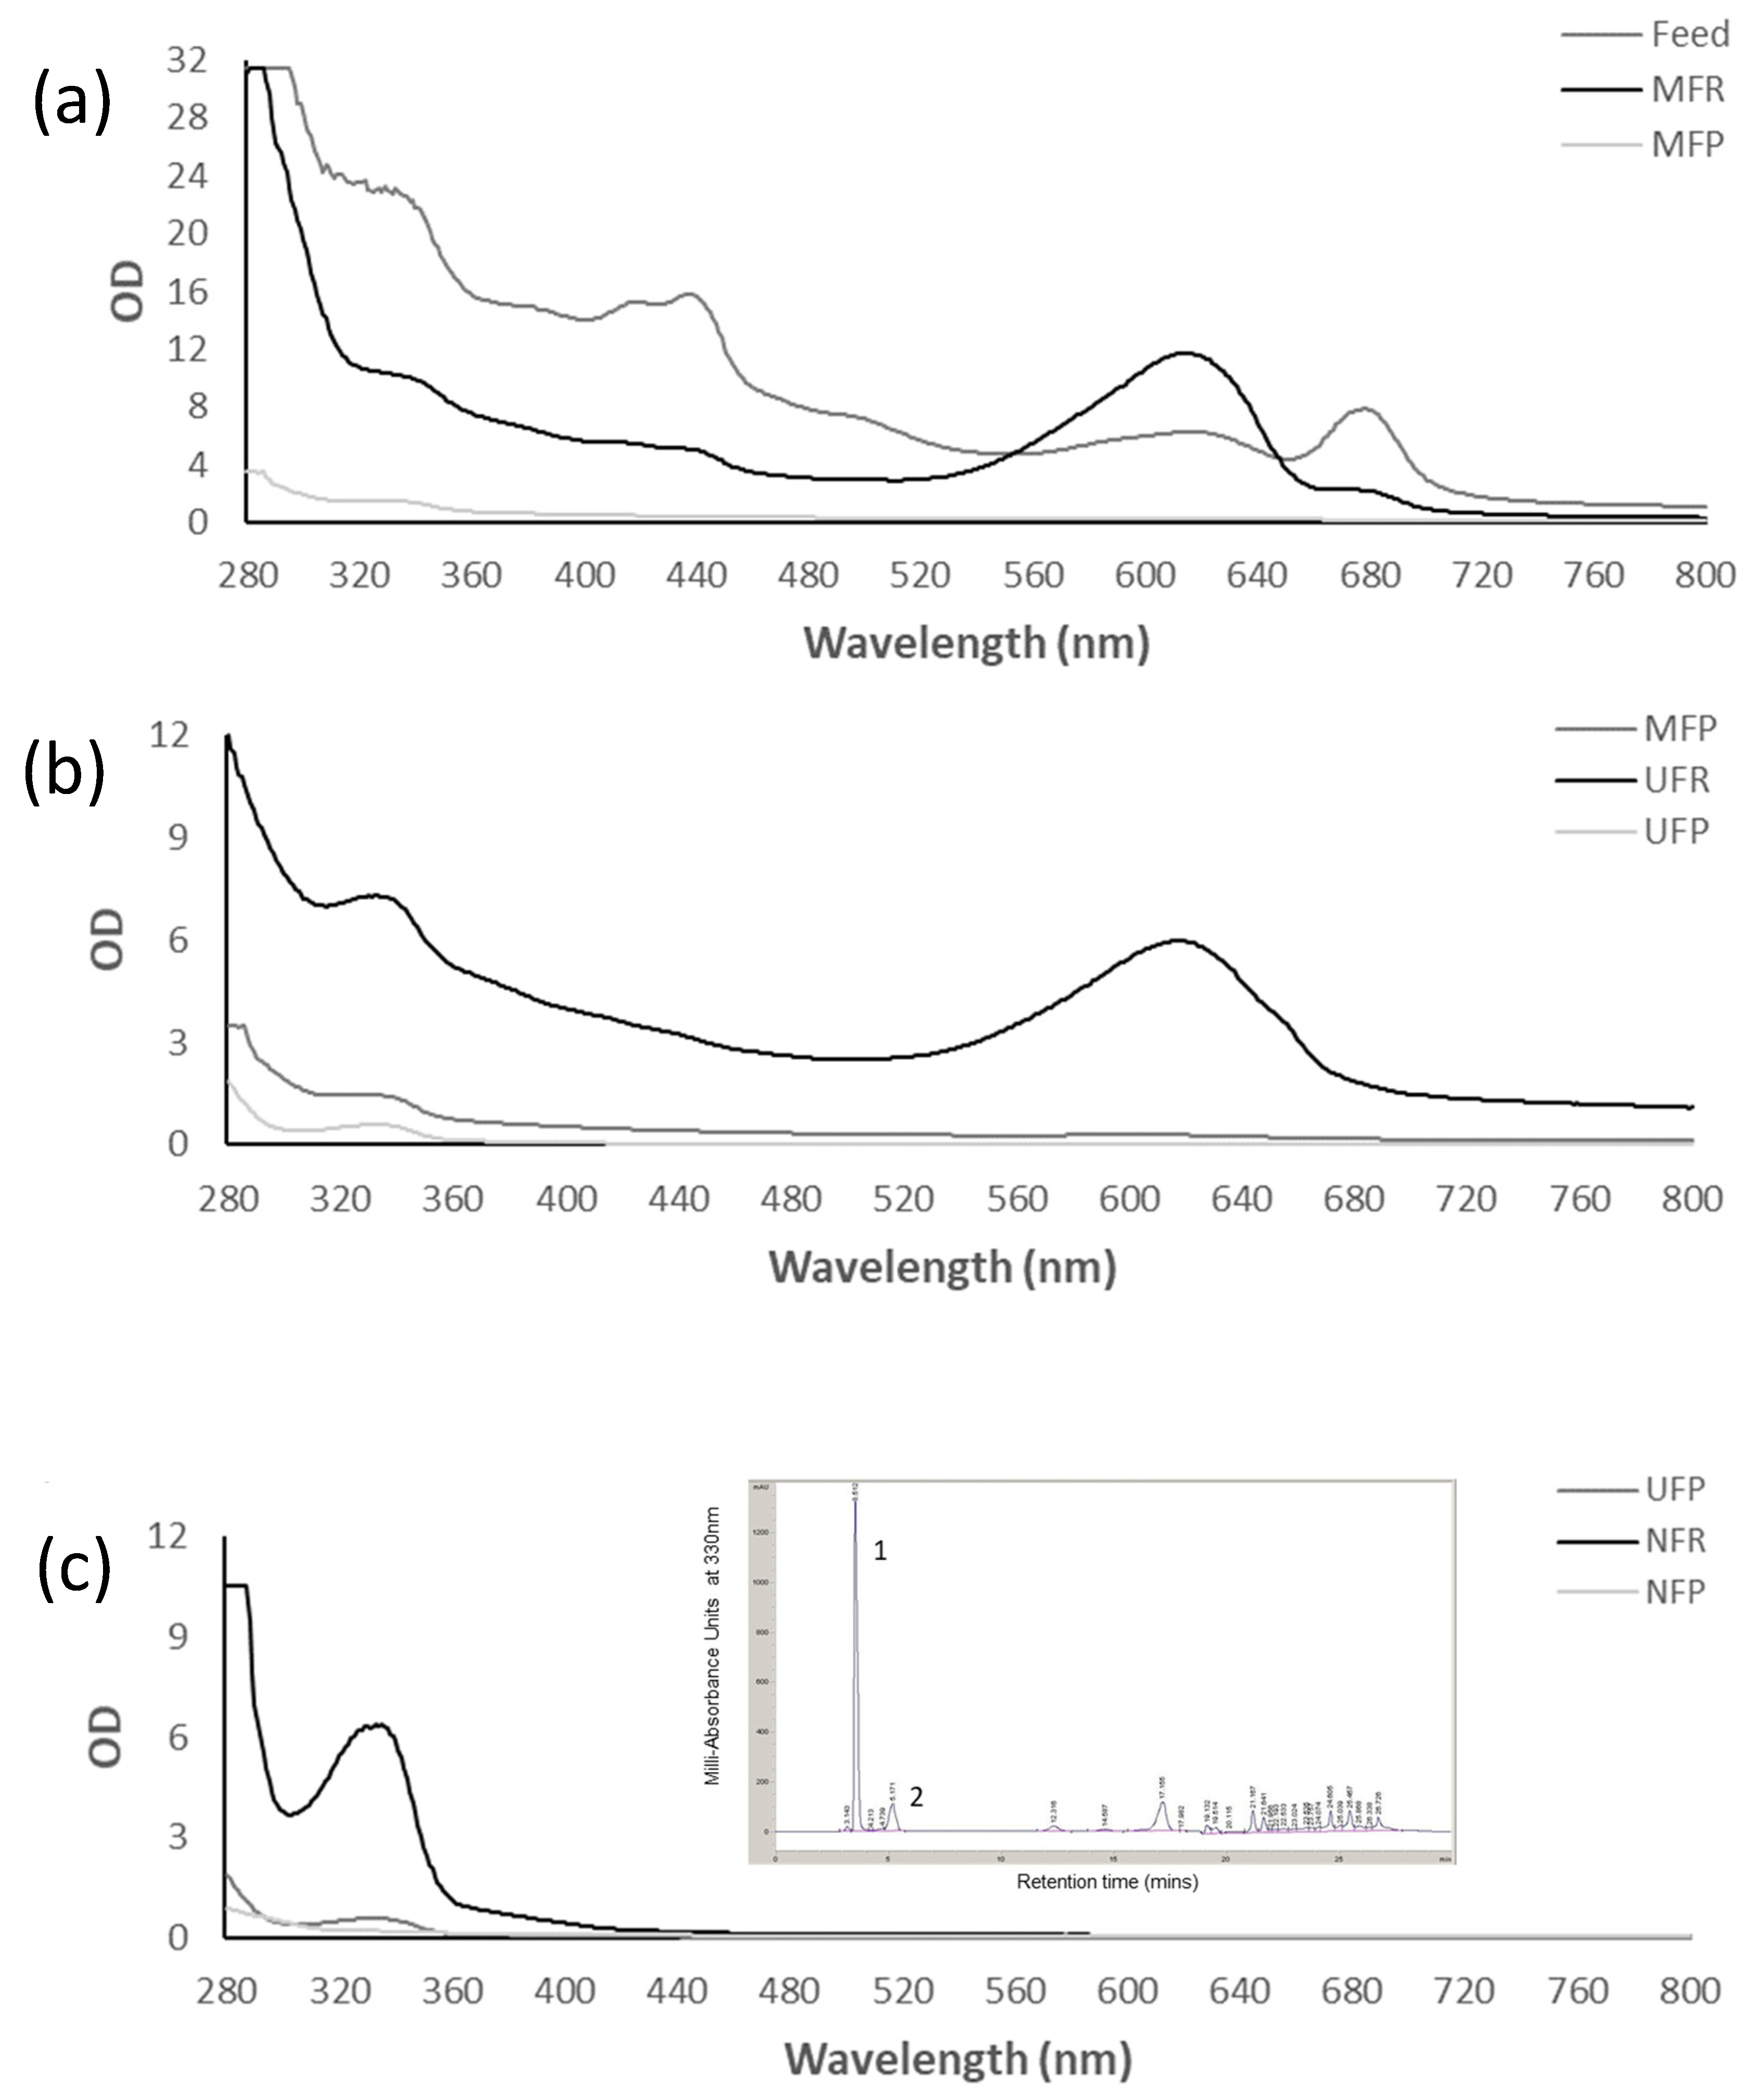
3.2. Filtration Experiment
3.2.1. Phycocyanin
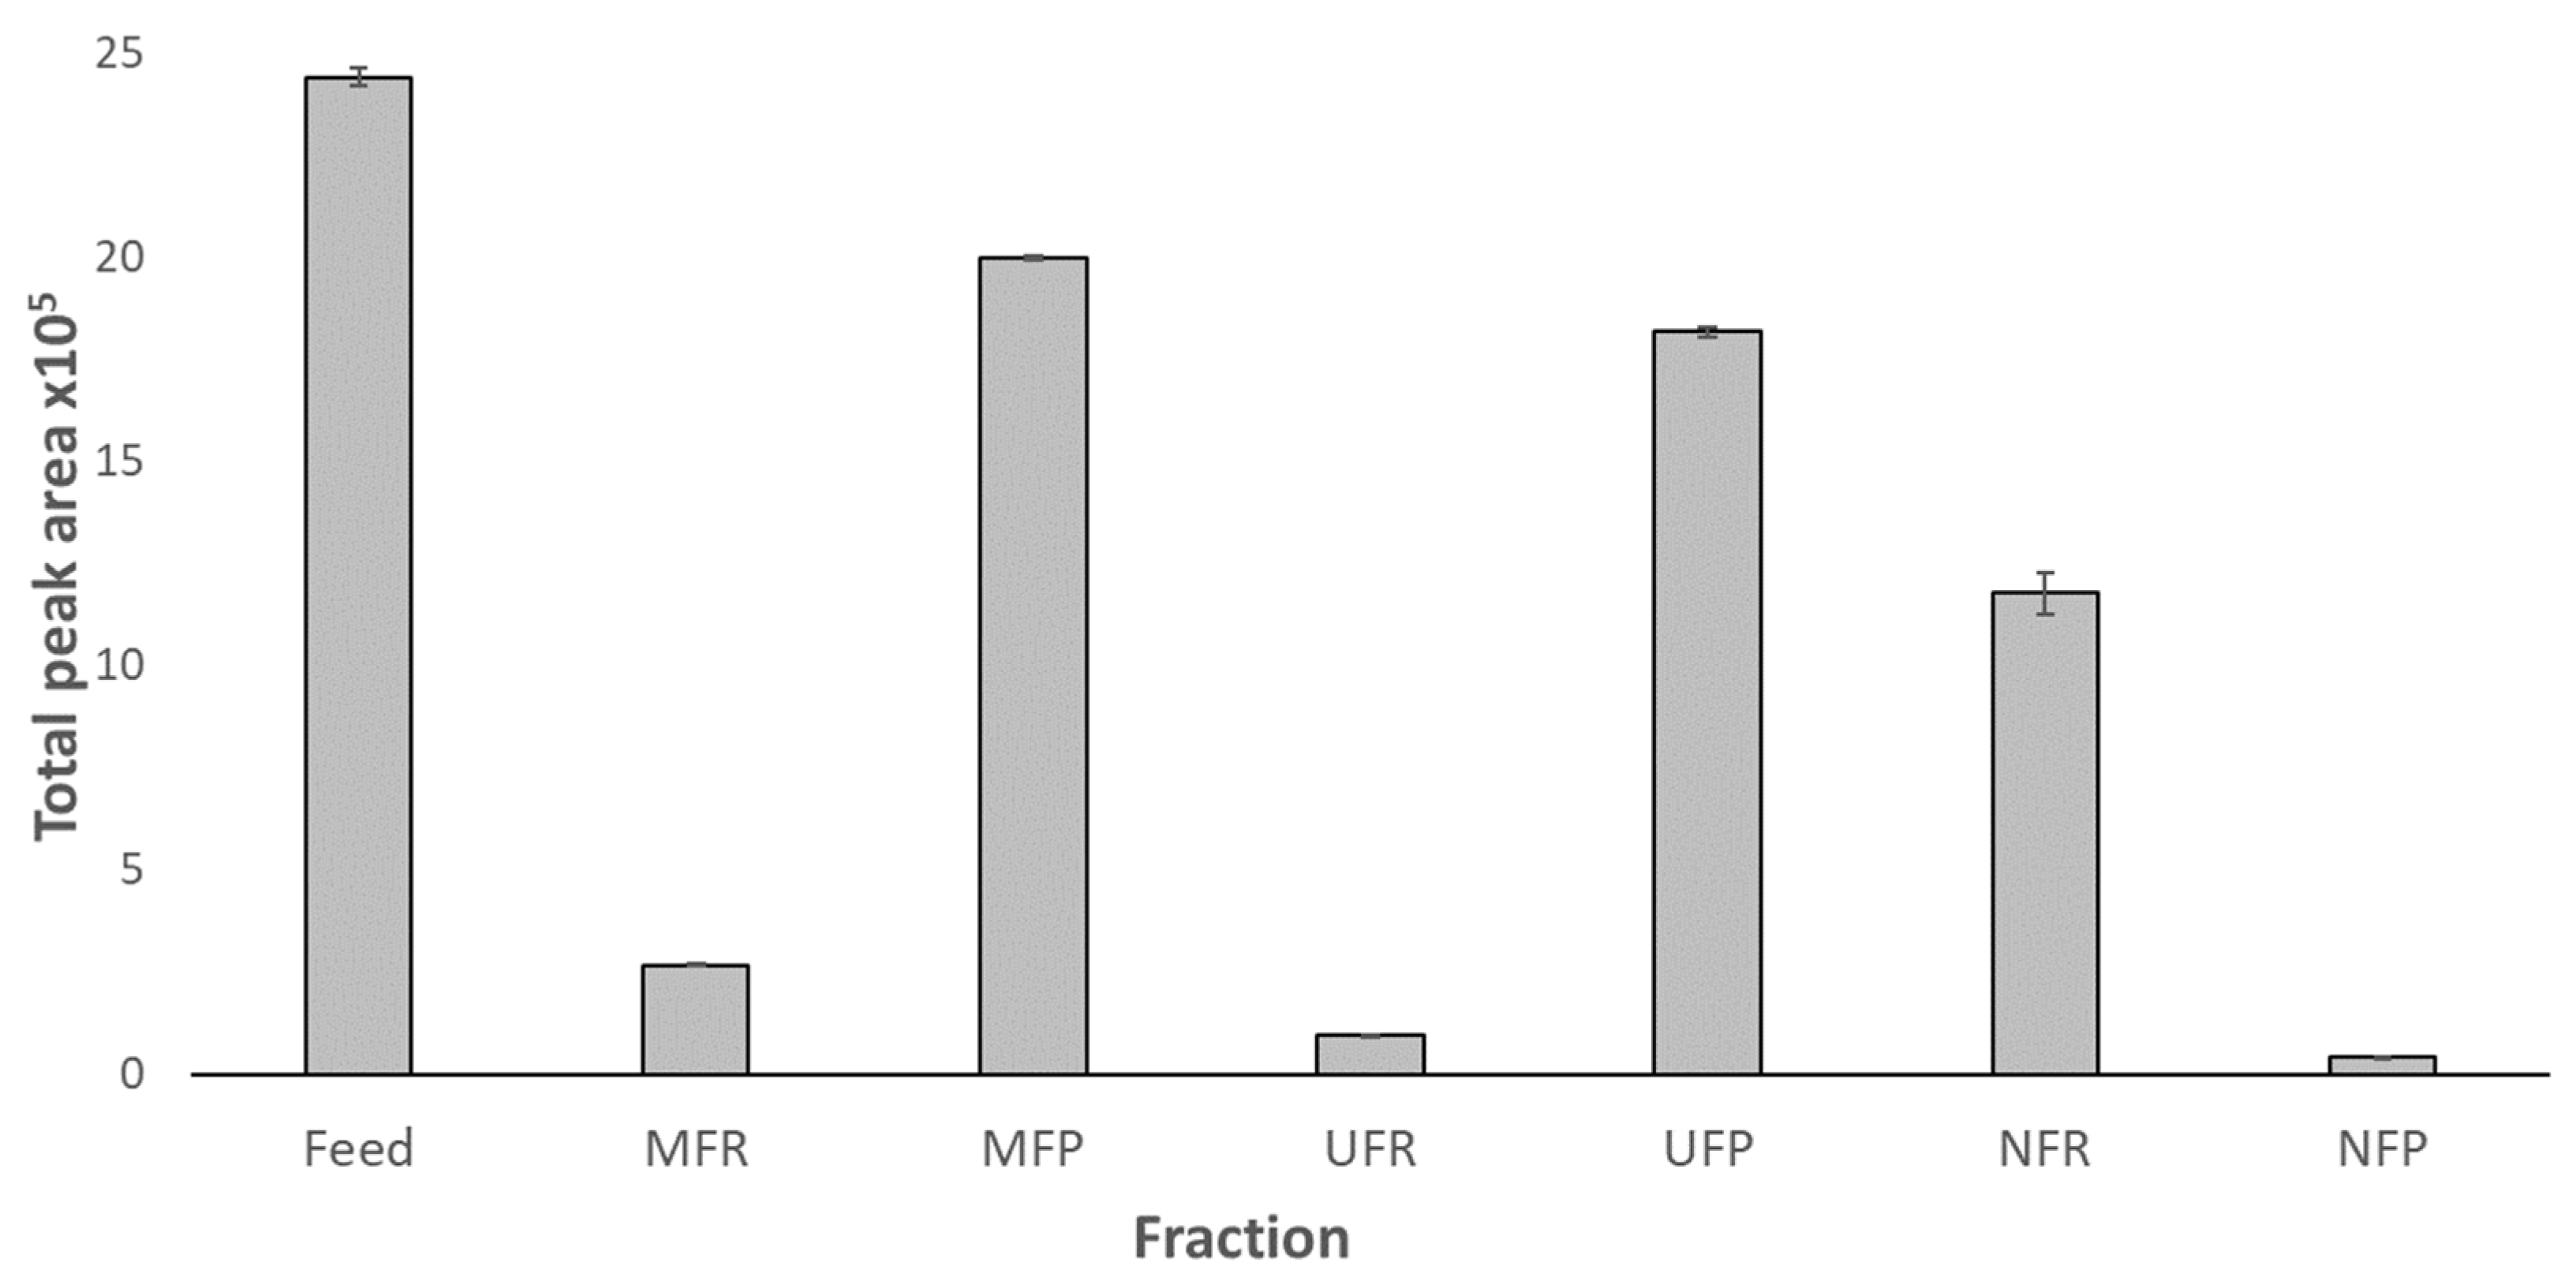
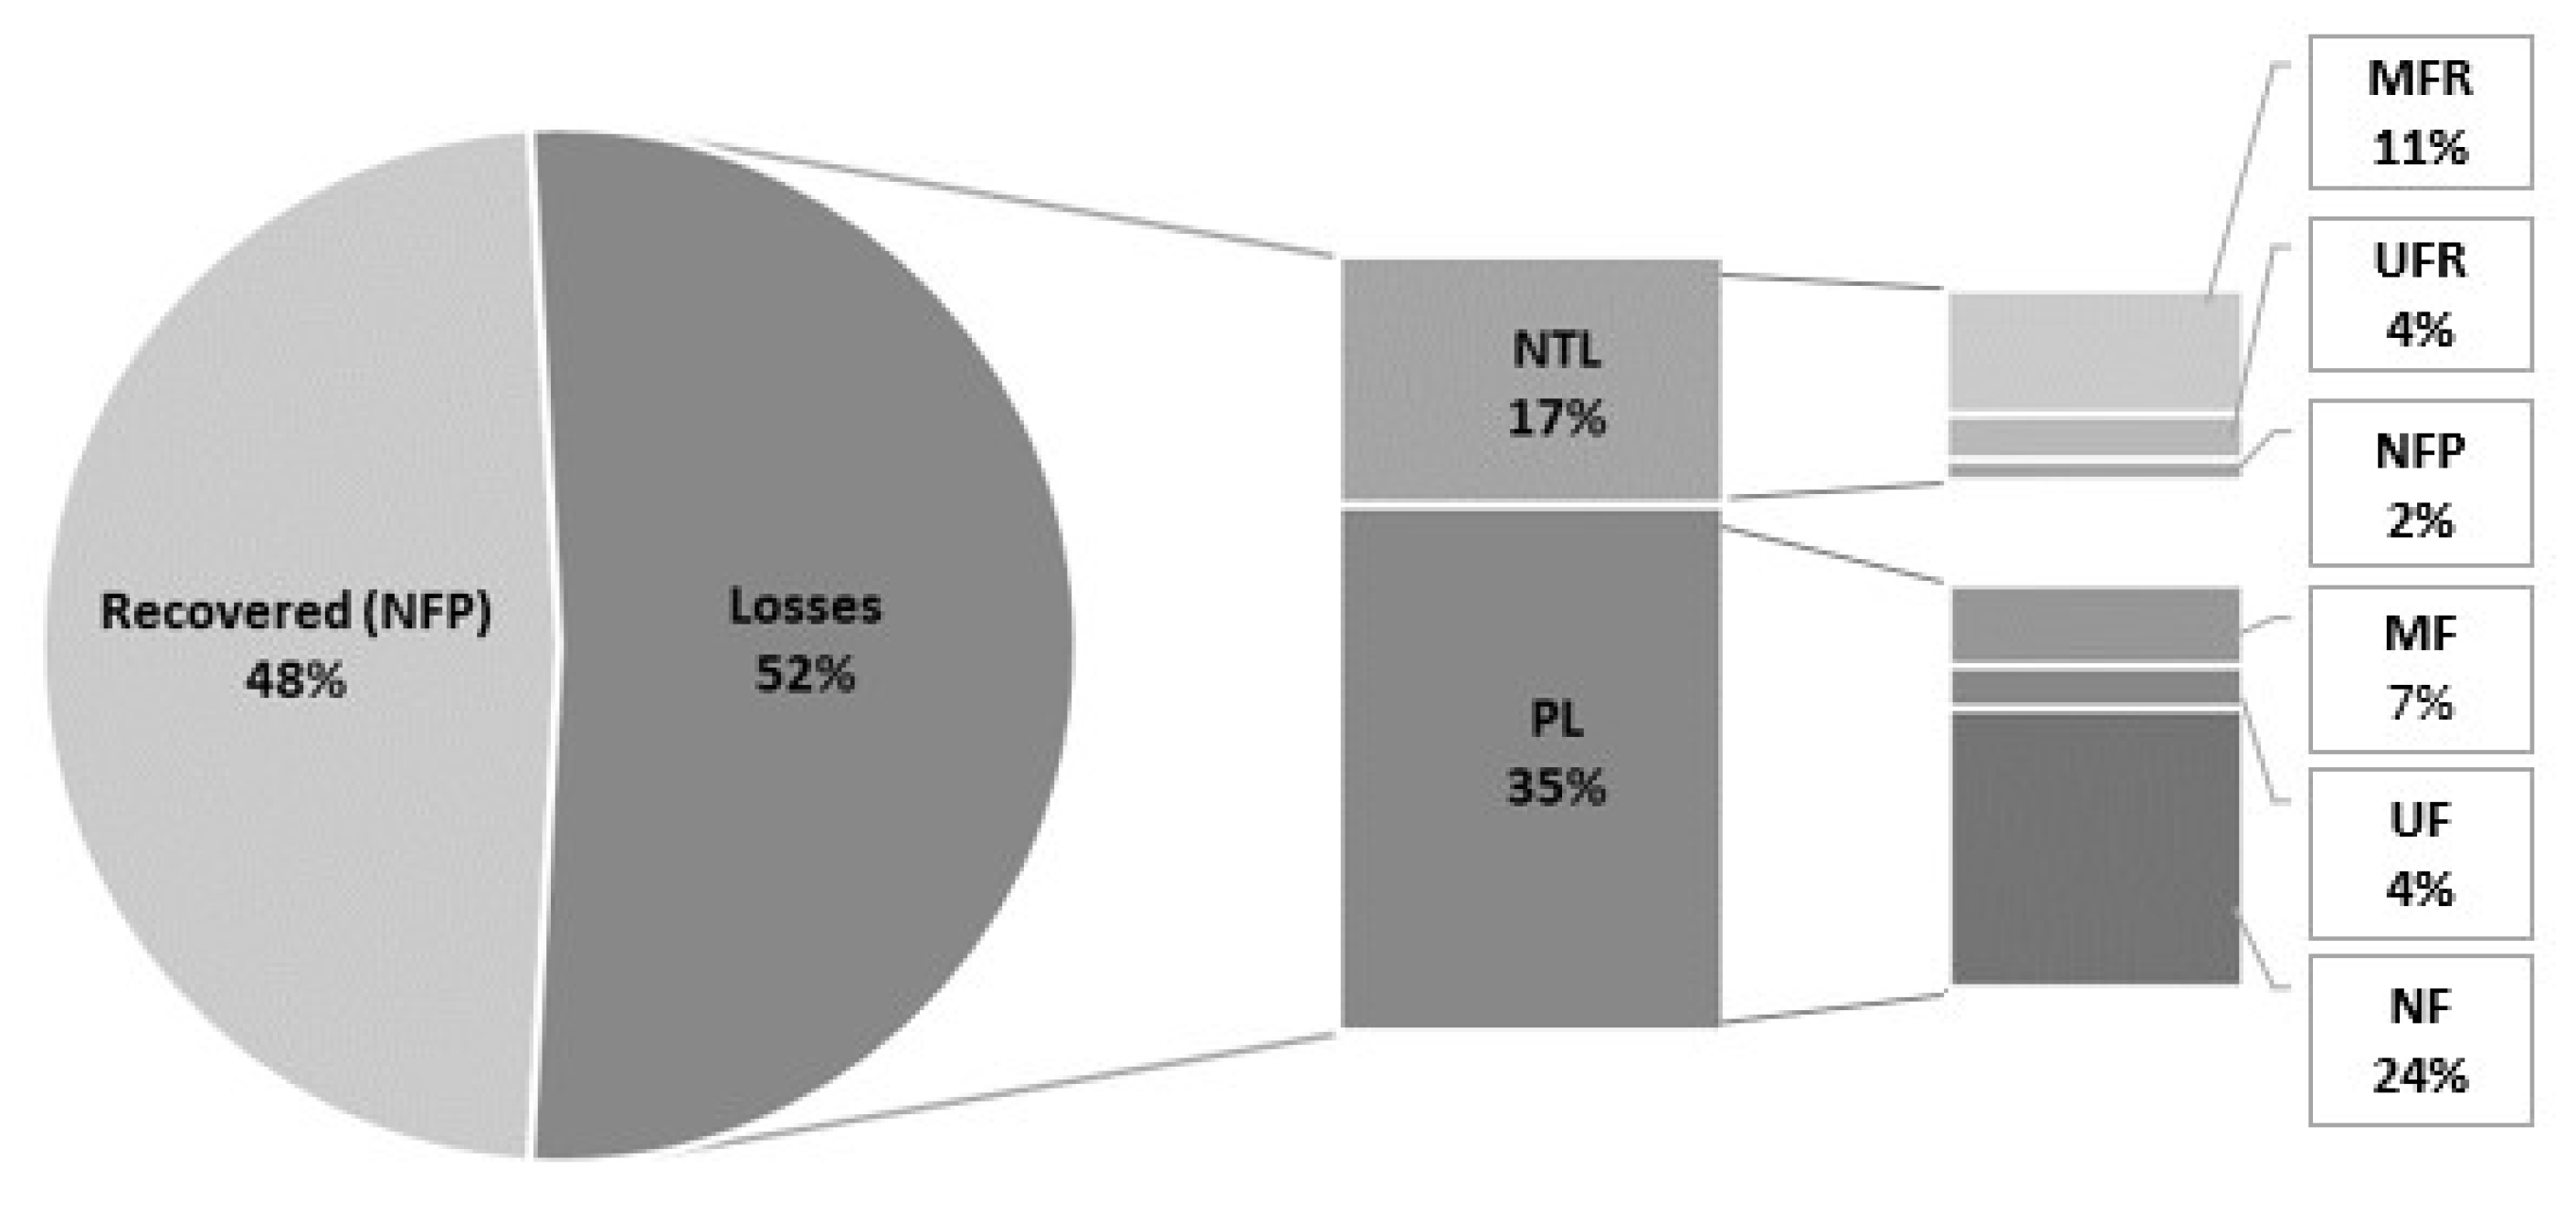
3.2.2. MAAs


4. Conclusions
Author Contributions
Funding
Data Availability Statement
Acknowledgments
Conflicts of Interest
References
- Adler, B.L.; DeLeo, V.A. Sunscreen Safety: A Review of Recent Studies on Humans and the Environment. Curr. Dermatol. Rep. 2020, 9, 1–9. [Google Scholar] [CrossRef]
- Řezanka, T.; Temina, M.; Tolstikov, A.G.; Dembitsky, V.M. Natural Microbial UV Radiation Filters—Mycosporine-like Amino Acids. Folia Microbiol. 2004, 49, 339–352. [Google Scholar] [CrossRef] [PubMed]
- Bandaranayake, W.M. Mycosporines: Are They Nature’s Sunscreens? Nat. Prod. Rep. 1998, 15, 159. [Google Scholar] [CrossRef] [PubMed]
- Carreto, J.I.; Carignan, M.O.; Montoya, N.G. A High-Resolution Reverse-Phase Liquid Chromatography Method for the Analysis of Mycosporine-like Amino Acids (MAAs) in Marine Organisms. Mar. Biol. 2005, 146, 237–252. [Google Scholar] [CrossRef]
- Rastogi, R.P. UV-Induced Oxidative Stress in Cyanobacteria: How Life Is Able to Survive? Biochem. Anal. Biochem. 2015, 4, 2–5. [Google Scholar] [CrossRef]
- Oren, A.; Gunde-Cimerman, N. Mycosporines and Mycosporine-like Amino Acids: UV Protectants or Multipurpose Secondary Metabolites? FEMS Microbiol. Lett. 2007, 269, 1–10. [Google Scholar] [CrossRef]
- Rastogi, R.P.; Sinha, R.P.; Moh, S.H.; Lee, T.K.; Kottuparambil, S.; Kim, Y.J.; Rhee, J.S.; Choi, E.M.; Brown, M.T.; Häder, D.P.; et al. Ultraviolet Radiation and Cyanobacteria. J. Photochem. Photobiol. B 2014, 141, 154–169. [Google Scholar] [CrossRef]
- Conde, F.R.; Churio, M.S.; Previtali, C.M. The Photoprotector Mechanism of Mycosporine-like Amino Acids. Excited-State Properties and Photostability of Porphyra-334 in Aqueous Solution. J. Photochem. Photobiol. B 2000, 56, 139–144. [Google Scholar] [CrossRef]
- Whitehead, K.; Hedges, J.I. Photodegradation and Photosensitization of Mycosporine-like Amino Acids. J. Photochem. Photobiol. B 2005, 80, 115–121. [Google Scholar] [CrossRef]
- Sinha, R.P.; Klisch, M.; Gröniger, A.; Häder, D.P. Mycosporine-like Amino Acids in the Marine Red Alga Gracilaria Cornea—Effects of UV and Heat. Environ. Exp. Bot. 2000, 43, 33–43. [Google Scholar] [CrossRef]
- Carreto, J.I.; Carignan, M.O.; Montoya, N.G. Comparative Studies on Mycosporine-like Amino Acids, Paralytic Shellfish Toxins and Pigment Profiles of the Toxic Dinoflagellates Alexandrium tamarense, A. Catanella and A. Minutum. Mar. Ecol. Prog. Ser. 2001, 223, 49–60. [Google Scholar] [CrossRef]
- Wada, N.; Sakamoto, T.; Matsugo, S. Multiple Roles of Photosynthetic and Sunscreen Pigments in Cyanobacteria Focusing on the Oxidative Stress. Metabolites 2013, 3, 463–483. [Google Scholar] [CrossRef]
- Schmid, D.; Schürch, C.; Zülli, F. Mycosporine-like Amino Acids from Red Algae Protect against Premature Skin-Aging. Euro Cosmet. 2006, 9, 1–4. [Google Scholar]
- Van Hal, J.W.; Huijgen, W.J.J.; López-Contreras, A.M. Opportunities and Challenges for Seaweed in the Biobased Economy. Trends Biotechnol. 2014, 32, 231–233. [Google Scholar] [CrossRef]
- Barros, A.I.; Gonçalves, A.L.; Simões, M.; Pires, J.C.M. Harvesting Techniques Applied to Microalgae: A Review. Renew. Sustain. Energy Rev. 2015, 41, 1489–1500. [Google Scholar] [CrossRef]
- Wijffels, R.H.; Kruse, O.; Hellingwerf, K.J. Potential of Industrial Biotechnology with Cyanobacteria and Eukaryotic Microalgae. Curr. Opin. Biotechnol. 2013, 24, 405–413. [Google Scholar] [CrossRef]
- Sinha, R.P.; Häder, D.P. UV-Protectants in Cyanobacteria. Plant Sci. 2008, 174, 278–289. [Google Scholar] [CrossRef]
- Mitra, A.K. Two New Algae from Indian Soils. Ann. Bot. 1950, 14, 457–464. [Google Scholar] [CrossRef]
- Thomsen, J.K.; Cox, R.P. Upper Temperature Limits for Growth and Diazothrophy in the Thermophilic Cyanobacterium HTF Chlorogloeopsis. Arch. Microbiol. 1993, 159, 423–427. [Google Scholar] [CrossRef]
- Balasundaram, B.; Skill, S.C.; Llewellyn, C.A. A Low Energy Process for the Recovery of Bioproducts from Cyanobacteria Using a Ball Mill. Biochem. Eng. J. 2012, 69, 48–56. [Google Scholar] [CrossRef]
- Kultschar, B.; Dudley, E.; Wilson, S.; Llewellyn, C.A. Intracellular and Extracellular Metabolites from the Cyanobacterium Chlorogloeopsis Fritschii, PCC 6912, During 48 Hours of UV-B Exposure. Metabolites 2019, 9, 74. [Google Scholar] [CrossRef] [PubMed] [Green Version]
- Portwich, A.; Garcia-pichel, F. A Novel Prokaryotic UVB Photoreceptor in the Cyanobacterium Chlorogloeopsis PCC 6912. Photochem. Photobiol. 2000, 71, 493–498. [Google Scholar] [CrossRef] [PubMed]
- Portwich, A.; Garcia-Pichel, F. Ultraviolet and Osmotic Stresses Induce and Regulate the Synthesis of Mycosporines in the Cyanobacterium Chlorogloeopsis PCC 6912. Arch. Microbiol. 1999, 172, 187–192. [Google Scholar] [CrossRef] [PubMed]
- Portwich, A.; Garcia-Pichel, F. Biosynthetic Pathway of Mycosporines (Mycosporine-like Amino Acids) in the Cyanobacterium Chlorogloeopsis Sp. Strain PCC 6912. Phycologia 2003, 42, 384–392. [Google Scholar] [CrossRef]
- Gröniger, A.; Hallier, C.; Häder, D.P. Influence of UV Radiation and Visible Light on Porphyra Umbilicalis: Photoinhibition and MAA Concentration. J. Appl. Phycol. 1999, 11, 437. [Google Scholar] [CrossRef]
- Bhatia, S.; Sharma, K.; Sharma, A.; Garg, A.; Kumar, S.; Purohit, A. Mycosporine and Mycosporine-like Amino Acids: A Paramount Tool against Ultra Violet Irradiation. Pharmacogn. Rev. 2011, 5, 138. [Google Scholar] [CrossRef]
- Katoch, M.; Mazmouz, R.; Chau, R.; Pearson, L.A.; Pickford, R.; Neilan, B.A. Heterologous Production of Cyanobacterial Mycosporine-like Amino Acids Mycosporine-Ornithine and Mycosporine-Lysine in Escherichia Coli. Appl. Environ. Microbiol. 2016, 82, 6167–6173. [Google Scholar] [CrossRef]
- Yang, G.; Cozad, M.A.; Holland, D.A.; Zhang, Y.; Luesch, H.; Ding, Y. Photosynthetic Production of Sunscreen Shinorine Using an Engineered Cyanobacterium. ACS Synth. Biol. 2018, 7, 664–671. [Google Scholar] [CrossRef]
- Drexler, I.L.C.; Yeh, D.H. Membrane Applications for Microalgae Cultivation and Harvesting: A Review. Rev. Environ. Sci. Biotechnol. 2014, 13, 487–504. [Google Scholar] [CrossRef]
- Zhang, X.; Hu, Q.; Sommerfeld, M.; Puruhito, E.; Chen, Y. Harvesting Algal Biomass for Biofuels Using Ultrafiltration Membranes. Bioresour. Technol. 2010, 101, 5297–5304. [Google Scholar] [CrossRef]
- Campinas, M.; Rosa, M.J. Evaluation of Cyanobacterial Cells Removal and Lysis by Ultrafiltration. Sep. Purif. Technol. 2010, 70, 345–353. [Google Scholar] [CrossRef]
- Zhu, Z.; Li, S.; He, J.; Thirumdas, R.; Montesano, D.; Barba, F.J. Enzyme-Assisted Extraction of Polyphenol from Edible Lotus (Nelumbo Nucifera) Rhizome Knot: Ultra-Filtration Performance and HPLC-MS2 Profile. Food Res. Int. 2018, 111, 291–298. [Google Scholar] [CrossRef] [PubMed]
- Knuckles, B.E.; De Fremery, D.; Bickoff, E.M.; Kohler, G.O. Soluble Protein from Alfalfa Juice by Membrane Filtration. J. Agric. Food Chem. 1975, 23, 209–212. [Google Scholar] [CrossRef] [PubMed]
- Zhu, Z.; Guan, Q.; Koubaa, M.; Barba, F.J.; He, J. Preparation of Highly Clarified Anthocyanin-Enriched Purple Sweet Potato Juices by Membrane Filtration and Optimization of Their Sensorial Properties. J. Food Process. Preserv. 2017, 41, 1–7. [Google Scholar] [CrossRef]
- Zhu, Z.; Wu, Q.; Di, X.; Li, S.; Barba, F.J.; Koubaa, M.; Roohinejad, S.; Xiong, X.; He, J. Multistage Recovery Process of Seaweed Pigments: Investigation of Ultrasound Assisted Extraction and Ultra-Filtration Performances. Food Bioprod. Process. 2017, 104, 40–47. [Google Scholar] [CrossRef]
- Richardson, J.F.; Harker, J.H.; Backhurst, J.R.; Coulson, J.M. Chemical Engineering Volume 2: Particle Technology and Separation Processes; Butterworth Heinemann: London, UK, 2013; Volume 2, ISBN 9780080490649. [Google Scholar]
- Chaiklahan, R.; Chirasuwan, N.; Loha, V.; Tia, S.; Bunnag, B. Separation and Purification of Phycocyanin from Spirulina Sp. Using a Membrane Process. Bioresour. Technol. 2011, 102, 7159–7164. [Google Scholar] [CrossRef]
- Beer, S.; Eshel, A. Determining Phycoerythrin and Phycocyanin Concentrations in Aqueous Crude Extracts of Red Algae. Mar. Freshw. Res. 1985, 36, 785. [Google Scholar] [CrossRef]
- Kultschar, B. Metabolite Profiling of a Robust Cyanobacterium for Industrial Biotechnology. Ph.D. Thesis, Swansea University, Swansea, UK, 2019. [Google Scholar]
- Yap, B.H.J.; Dumsday, G.J.; Scales, P.J.; Martin, G.J.O. Energy Evaluation of Algal Cell Disruption by High Pressure Homogenisation. Bioresour. Technol. 2015, 184, 280–285. [Google Scholar] [CrossRef]
- Samarasinghe, N.; Fernando, S.; Faulkner, B. Effect of High Pressure Homogenization on Aqueous Phase Solvent Extraction of Lipids from Nannochloris Oculata Microalgae. J. Energy Nat. Resour. 2012, 1, 1. [Google Scholar] [CrossRef]
- Gerardo, M.L.; Zanain, M.A.; Lovitt, R.W. Pilot-Scale Cross-Flow Microfiltration of Chlorella Minutissima: A Theoretical Assessment of the Operational Parameters on Energy Consumption. Chem. Eng. J. 2015, 280, 505–513. [Google Scholar] [CrossRef]
- Howe, K.; Tchobanoglous, R.; Crittenden, J.C.; Hand, D.W.; Trussell, R.R.; Tchobanoglous, G.; Howe, K.J.; Trussell, R.; Hand, I.W.; Howe, R. Membrane Filtration. In MWH’s Water Treatment: Principles and Design; John Wiley & Sons, Incorporated: Hoboken, NJ, USA, 2012; pp. 819–902. ISBN 9781118103753. [Google Scholar]
- Her, N.; Amy, G.; Yoon, J.; Song, M. Novel Methods for Characterizing Algogenic Organic Matter and Associated Nanofiltration Membrane Fouling. Water Sci. Technol. Water Supply 2003, 3, 165–174. [Google Scholar] [CrossRef]
- Lawrenz, E.; Fedewa, E.J.; Richardson, T.L. Extraction Protocols for the Quantification of Phycobilins in Aqueous Phytoplankton Extracts. J. Appl. Phycol. 2011, 23, 865–871. [Google Scholar] [CrossRef]
- Lipnizki, F.; Boelsmand, J.; Madsen, R.F. Concepts of Industrial-Scale Diafiltration Systems. Desalination 2002, 144, 179–184. [Google Scholar] [CrossRef]


| Filtration | Retention Coefficient (% ±SD) |
|---|---|
| MF | 18.1 ± 0.7 |
| UF | 9.1 ± 0.5 |
| NF | 97.6 ± 0 |
| Fraction | Volume (mL) | Concentration (mg L−1 ± SD) |
|---|---|---|
| Feed | 50 | 5.6 ± 0.7 |
| MFR | 20 | 1.2 ± 0.04 |
| MFP | 80 | 1.9 ± 0.14 |
| UFR | 1.5 | 5.3 ± 0.61 |
| UFP | 90 | 1.2 ± 0.09 |
| NFR | 5 | 18.71 ± 0.29 |
| NFP | 85 | 0.007 ± 0.004 |
Disclaimer/Publisher’s Note: The statements, opinions and data contained in all publications are solely those of the individual author(s) and contributor(s) and not of MDPI and/or the editor(s). MDPI and/or the editor(s) disclaim responsibility for any injury to people or property resulting from any ideas, methods, instructions or products referred to in the content. |
© 2023 by the authors. Licensee MDPI, Basel, Switzerland. This article is an open access article distributed under the terms and conditions of the Creative Commons Attribution (CC BY) license (https://creativecommons.org/licenses/by/4.0/).
Share and Cite
Candelo, V.; Llewellyn, C.A. Separating and Purifying Mycosporine-like Amino Acids from Cyanobacteria for Application in Commercial Sunscreen Formulations. BioTech 2023, 12, 16. https://doi.org/10.3390/biotech12010016
Candelo V, Llewellyn CA. Separating and Purifying Mycosporine-like Amino Acids from Cyanobacteria for Application in Commercial Sunscreen Formulations. BioTech. 2023; 12(1):16. https://doi.org/10.3390/biotech12010016
Chicago/Turabian StyleCandelo, Valeria, and Carole Anne Llewellyn. 2023. "Separating and Purifying Mycosporine-like Amino Acids from Cyanobacteria for Application in Commercial Sunscreen Formulations" BioTech 12, no. 1: 16. https://doi.org/10.3390/biotech12010016