Article

Fruit Color Preference of Frugivorous Birds in an Agroecosystem in Southcentral Mindanao, Philippines

by
Navel Kyla B. Balasa
1,
Jirriza O. Roquero
1,
Asraf K. Lidasan
1,
Lothy F. Casim
2,
Angelo Rellama Agduma
1,3,4 and
Krizler Cejuela Tanalgo
1,*
1
Ecology and Conservation Research Laboratory (Eco/Con Lab), Department of Biological Sciences, College of Science and Mathematics, University of Southern Mindanao, Kabacan 9407, Philippines
2
Molecular Parasitology Research Laboratory, Department of Biological Sciences, College of Science and Mathematics, University of Southern Mindanao, Kabacan 9407, Philippines
3
State Key Laboratory for Conservation and Utilization of Subtropical Agrobioresources, College of Forestry, Guangxi University, Nanning 530004, China
4
Guangxi Key Laboratory of Forest Ecology and Conservation, College of Forestry, Guangxi University, Nanning 530004, China
*
Author to whom correspondence should be addressed.
Birds 2023, 4(2), 190-201; https://doi.org/10.3390/birds4020016
Submission received: 27 February 2023 / Revised: 20 April 2023 / Accepted: 20 April 2023 / Published: 24 April 2023
(This article belongs to the Special Issue Feature Papers of Birds 2022–2023)

Abstract

:

Simple Summary

Plant–animal interactions play a crucial role in the functioning of ecosystems by promoting biodiversity, maintaining ecological balance, and facilitating the provision of resources for both fauna and humans. Failure to maintain these interactions could lead to numerous plant and animal species’ inability to survive, potentially resulting in ecological imbalances. We examined the effects of fruit color and the local landscape on plant–bird interactions in an agroecosystem in Southcentral Mindanao, Philippines. Using artificial fruit models, we found that the proportion of predation and risk was significantly higher in the red fruit model (ripe fruits) compared to the green model (unripe fruits). Furthermore, birds were the dominant predators and were more likely to consume ripe fruits compared to unripe ones, compared to other predators such as mammals and arthropods. Our study showed that fruit color significantly promotes mutualistic interactions, especially for birds, within an agroecosystem.

Abstract

The removal of fruit is a consequence of plant–animal interactions, and is a vital step in the natural regeneration cycle of plant populations. This research aimed to determine the effect of fruit color and local landscape on plant–bird interactions in an agroecosystem in Southcentral Mindanao, Philippines. We set out 1500 artificial fruit models in ten sampling locations within an agroecosystem. We measured the difference in the proportion of predated/removed (%) fruit models and the risk between sites, fruit color, and predators. Approximately a quarter (24.53%) of the artificial fruit models deployed were predated, and the proportion of predation was significantly higher in the red fruit models (mean = 18.74 ± 9.84) compared to the green fruit models (mean = 11.67 ± 6.17). Birds were the most dominant predators compared to mammals and arthropods, and contributed to at least 60% of the predation of red fruits. Our findings are consistent with previous evidence showing birds’ preferences for darker fruit colors. Although landscape variables did not significantly affect fruit predation, tree cover may help increase these interactions. Overall, our study showed that agroecosystems can still support species of frugivorous birds, as indicated by high fruit predation rates, particularly by birds that can permeate different layers of the agroecosystem. Our findings demonstrate an important implication for habitat quality management within agroecosystems. Enriching agroecosystems with pioneer trees with dark-colored fleshy fruits is a sustainable greening strategy that would benefit frugivores and producers in this system.

1. Introduction

Many vital ecological processes in different habitats, such as seed dispersal and pollination, depend on interactions between plants and animals [1,2,3]. Vertebrate frugivores are important indicators of the environmental health and changes in terrestrial ecosystems [4,5,6]. For example, the composition and abundance of fruit bats are significantly higher in a more pristine ecosystem, and even vary in two monocultural systems [7]. Similarly, frugivorous birds are more diverse in pristine habitats compared to disturbed habitats with less vegetation [8,9]. Furthermore, a diverse community of frugivores plays a critical role in providing key ecosystem services, such as the dispersal of seeds in forested and successional zones, which aids in the restoration of many degraded habitats [2,9,10,11,12]. Fruit removal is a primary consequence of many plant-frugivore interactions and is a vital part of the natural regeneration cycle of plant populations and diversification, in which fruit dispersers play a critical role [13,14,15]. Yet, agricultural expansion threatens biodiversity in many countries and is primarily responsible for the widespread destruction and fragmentation of natural vegetation worldwide [16,17,18]. The rise and expansion of urbanization and conversion to monoculture agriculture have exacerbated negative impacts on biodiversity, particularly in developing countries [19,20]. While some frugivores, such as birds, benefit from agricultural landscapes, particularly in rural areas, by providing alternative food sources when food resources are scarce in urbanized area. Yet, some studies have also shown that frugivorous birds would primarily prefer to search and forage for fruits in less disturbed sites (e.g., more rural areas) compared to more urbanized areas. Even within urbanized areas, frugivores would consume berries from trees that are located in less urbanized gradient [21,22].
Fruits commonly undergo color changes, from a cryptic green that blends in with vegetation to brighter and more conspicuous colors such as red, blue, yellow, or black which are visible to frugivores with color vision [13,23]. The color of the fruit substantially affects the probability of fruit consumption by frugivores [24,25]. Understanding the connection between fruit and frugivores requires linking the fruit morphology and accessibility to removal rates by birds and other frugivorous species [25,26,27]. Furthermore, it is important to understand the predation rates by frugivores with various habitat modifications to predict the consequences and maintain biodiversity and ecosystem services provided by seed dispersers [28,29,30,31]. However, studies to understand the effects of local landscape structure and fruit color on plant–animal interactions within tropical agroecosystems are limited, especially in light of growing global agricultural development [32,33,34]. An investigation is necessary to fill the gaps and provide valuable evidence to support the sustainable management of agricultural lands.
The use of artificial fruit models is one of the standard techniques to test the effects of fruit colors on bird detection in different habitat types [27,35,36]. This study aimed to test the effects of fruit color and the local landscape on plant–bird interactions in an agroecosystem in Southcentral Mindanao, Philippines. Specifically, our goals were (1) to assess and compare the proportion of predation (%) by birds versus other predators between fruit colors and (2) to determine the effects of local landscape-level and plot-level variables in explaining the predation risks of fruit models. We hypothesize that the proportion and likelihood of fruit predation within an agroecosystem vary depending on the type of fruit predator and fruit colors. Specifically, we predict that birds, which locate fruits by visual cues, will exhibit higher levels of fruit predation compared to mammals and arthropod predators, which rely on smell for locating fruits. Furthermore, we hypothesize that landscape variables may also influence plant-frugivore interactions within an agroecosystem. Specifically, we predict that higher vegetation characteristics will positively influence plant-frugivore interactions.

2. Materials and Methods

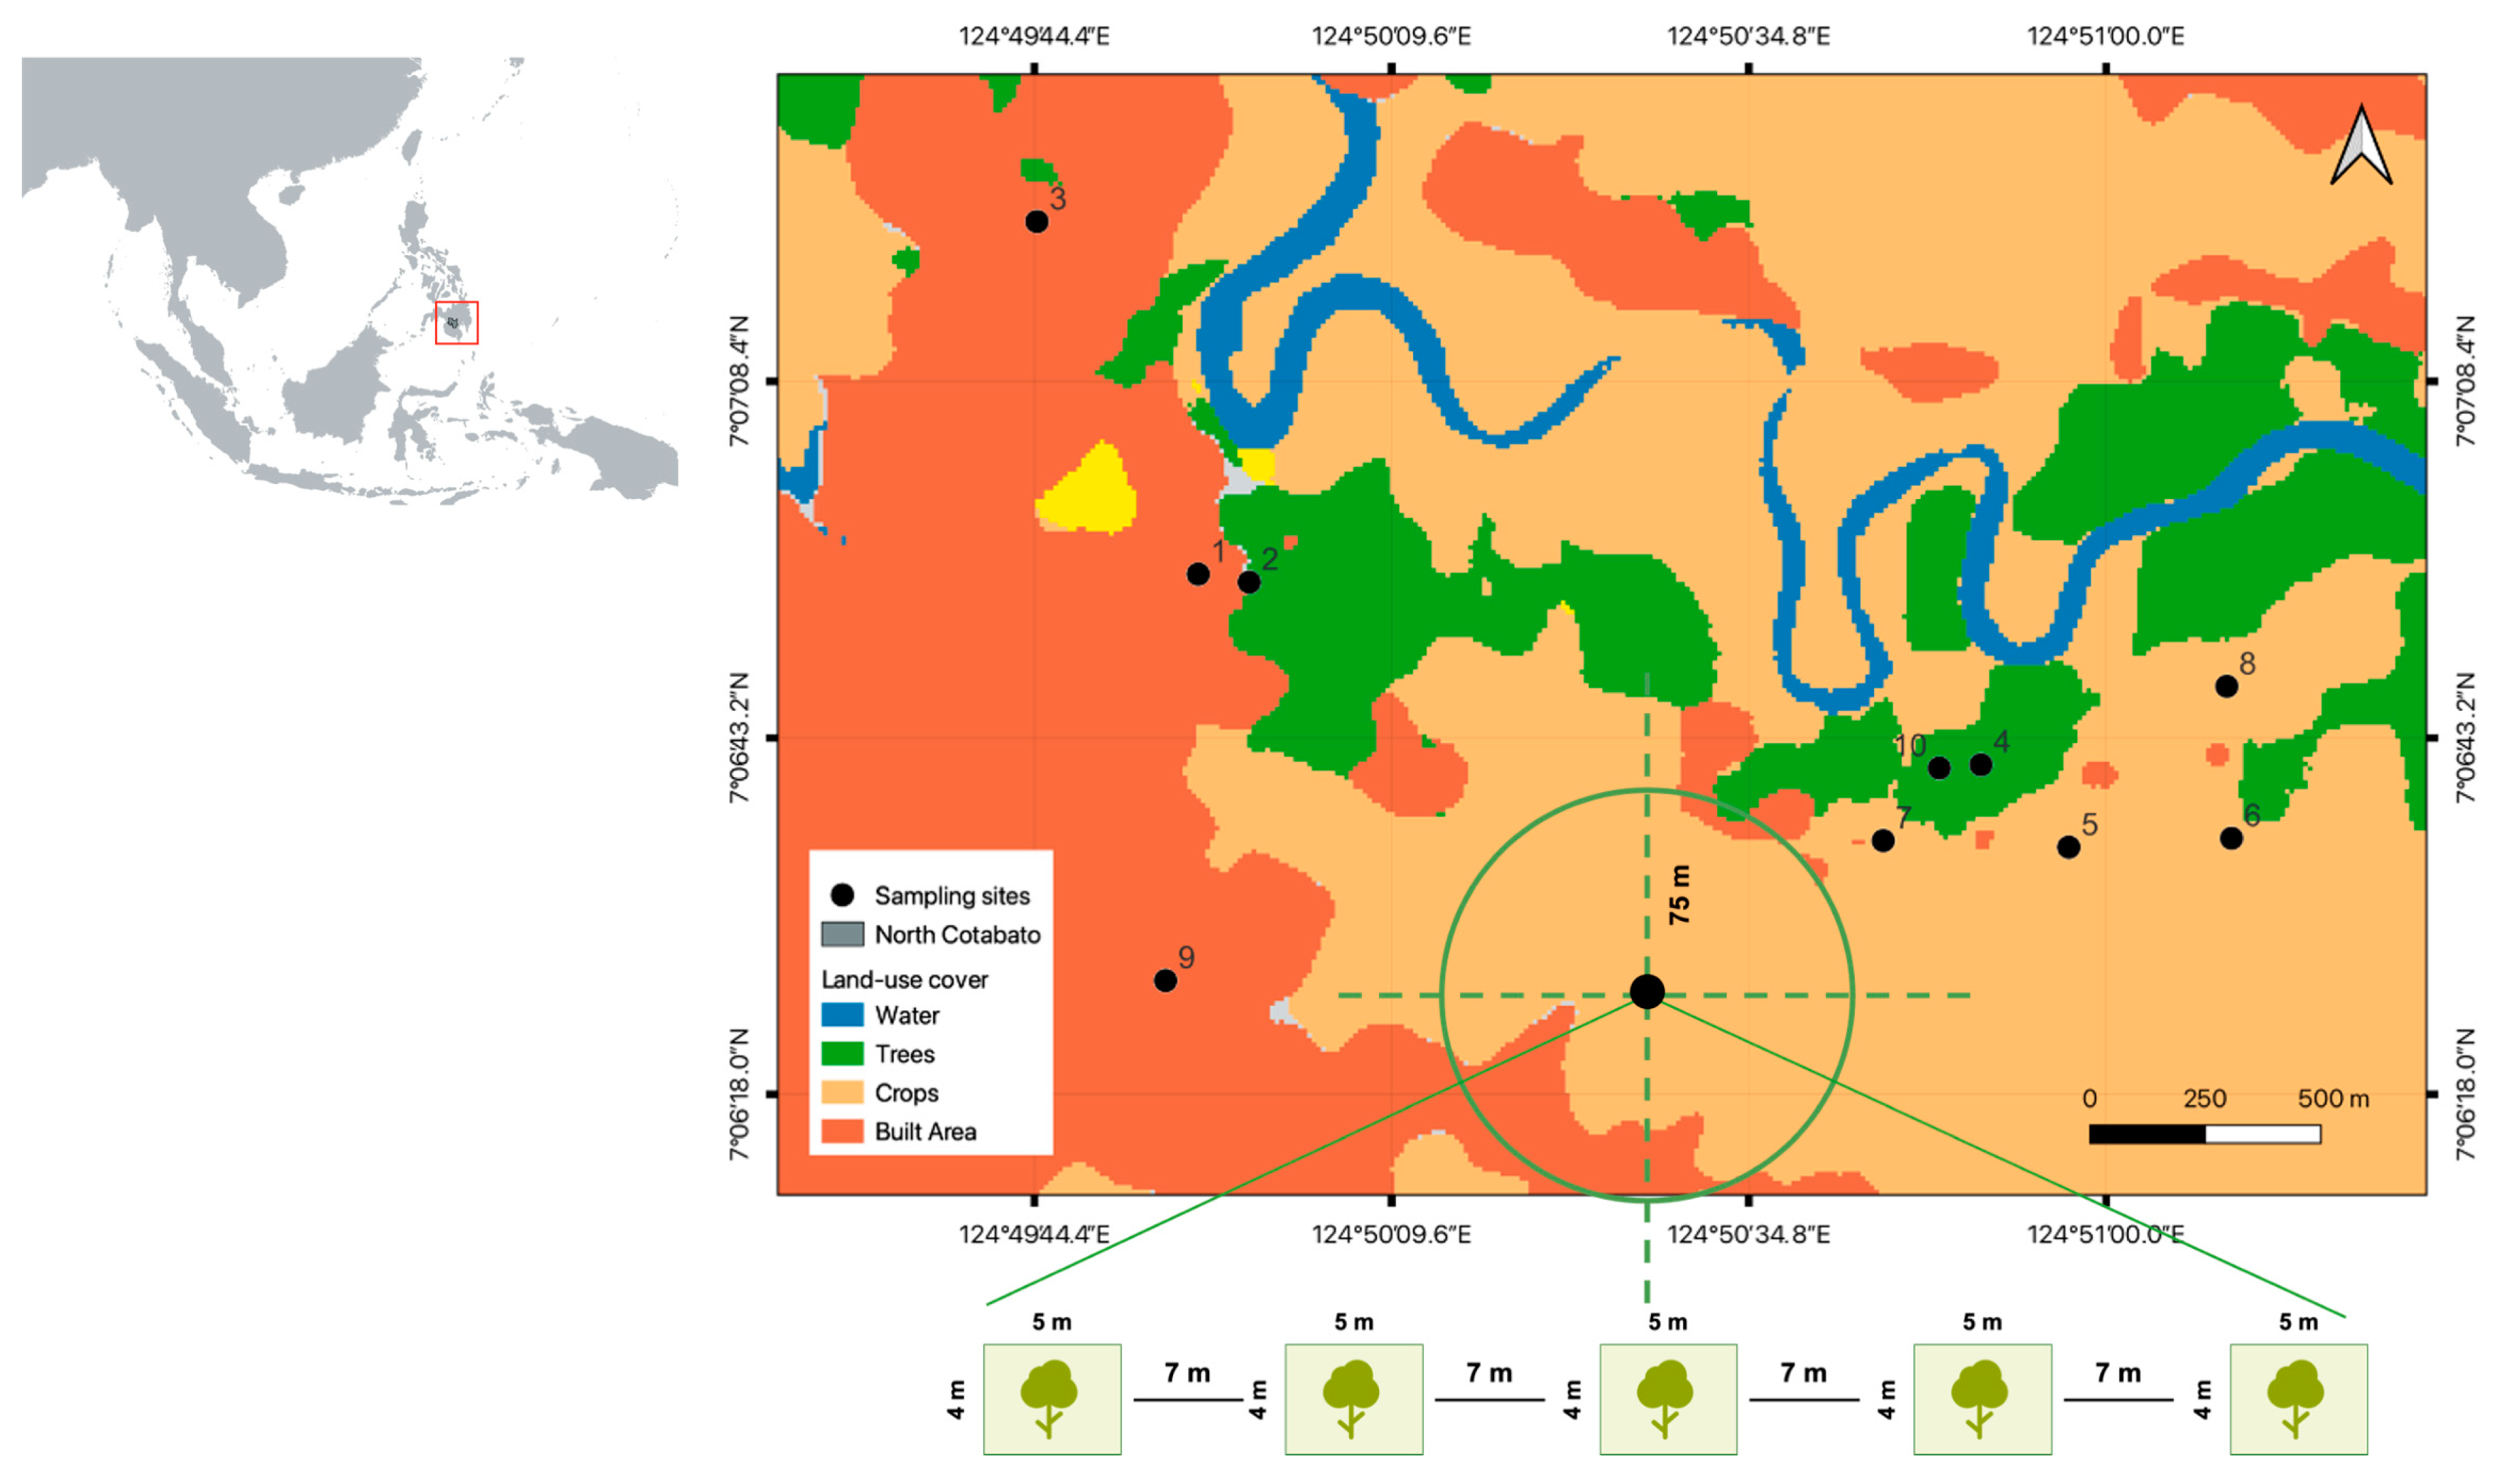
2.1. Study Areas and Sampling Design

A common garden experiment was carried out in the agricultural areas of the University of Southern Mindanao in the Southcentral Mindanao region of the Philippines (Figure 1) from July to December 2022. The study site has a warm and humid tropical climate, with temperatures ranging from 23 °C to 35 °C. The dry season begins in November and ends in May, while the wet season peaks in June, with an average annual rainfall of 172 mm. The study area is predominantly classified as an agroecosystem, consisting of remnants of forest cover surrounded by urban built-up structures, fruit orchards, and monoculture Oil palm (Elaeis guineensis) and Rubber (Hevea brasiliensis) plantations. During the sampling period, we observed several patches of fruit-bearing plant species, including common figs (Ficus spp.), Nasturtium tree (Macaranga spp.), Soursoup (Annona muricata), Aratiles (Muntingia calabura), Papaya (Carica papaya), Rambutan (Nephelium lappaceum), Chico (Manilkara zapota), Mabolo (Diospyros blancoi), Bell fruit (Syzygium aqueum), Guava (Psidium guajava), Star fruit (Averrhoa carambola), and Lanzones (Lansium sp.), which are potential plant foods of frugivores in the area.
We selected ten sampling locations with a radius of 75 m and at a minimum distance of 100 m apart (Figure 1) (see Pena et al. [37]). We selected sites with trees to set up our clay model experiments. Four (4) 4 × 5 m plots with 7 m distance intervals from the centroid of each sampling site were established. We used an oil-based and non-toxic clay to create artificial fruit models. In each plot, we placed 30 clay balls (20 mm in diameter) (15 red and 15 green) on a sturdy tree branch using a steel wire, and placed them at a minimum of 1 m apart (Figure 1). Trees with fruit models were marked with transparent ribbons at least 25 m away to reduce the effect of visual bias on predator behavior. We then exposed the artificial fruit models for seven (7) days to measure the predation rates, the probability of predation and the removal of fruits.
Figure 1. A map of the sampling sites showing the land-use cover of the agroecosystem. The land-use cover is based on Sentinel-2 10 m land-use/land cover data [38]. The sampling plots are also shown.
Birds 04 00016 g001
We considered artificial models to be predated by the presence of a distinct bite mark on the model [39,40]. Predator bite marks were visually distinctive and identified based on the shape of the following bite marks [40]. Birds are indicated with V-shaped marks, predatory arthropods leave cut-shaped marks (mandibles), and mammals leave incisor-shaped or square-shaped teeth marks (Figure 2). Unidentifiable bite marks and missing models were excluded from the analysis. Models attacked by multiple predators (e.g., mammals and arthropods) were counted separately (i.e., two types of predator damage recorded in one model). The proportion (%) of predated fruit models per site was calculated as the number of predations per area divided by the number of predations in all areas multiplied by 100 [39]. On the other hand, the risk of predation was based on the likelihood (1—attacked, 0—not attacked) of the fruit model being attacked by any of the predator types based on the fruit color (i.e., the frequency of fruits being attacked).

2.2. Land Use Cover and Environmental Variables

We aimed to determine the effects of environmental variables at the plot level and in the local landscape. At the plot level, all trees within the 4 × 5 m grid were measured for their diameter at breast height (DBH). The diameter of the tree from the base to the height of the breast was used to calculate the DBH (1.2 m from the tree base). We used the mean DBH of all trees in the analysis. Using the Canopeo mobile application (https://canopeoapp.com/) (accessed on 2 October 2022), canopy openness (%) was measured from the center of the grid. At the local landscape level, we calculated the proportion of land use cover within a 75 m radius of the sampling site using spatial statistics and the buffer zone function in QGIS [41]. We used spatial data from the Sentinel-2 10 m land use/land cover to quantify the percentage of local landscape structure and agricultural area [38].

2.3. Statistical Analyses

We performed all our statistical analyses based on the fruits recovered from the study sites. A Kruskal–Wallis H test was used to compare the proportion of predated fruit models (%) between sites and predator types, and a Mann–Whitney U test was used for comparison of artificial fruit colors. A Chi-square test of association (χ2) was used to determine the relationship between the frequency of attacks and site, fruit colors, and predator types. We used a generalized linear mixed model (GLMM) with a binomial error distribution (log-link) to investigate the effects of fruit color, predator types, plot level, and local landscape-level variables. Fruit color (red and green), predator types (birds, mammals, arthropods), DBH, canopy cover, and tree cover were included as explanatory variables. We had study sites and plots as random effects. We selected the best model based on the lowest values of the corrected Akaike information criterion (AICc) and Akaike weight (wAICc) [42]. Using the significant predictors from the best model, we built another separate binomial generalized linear mixed model (GLMM) to determine the risk of predation between fruit colors. We used predator type and tree cover as explanatory variables, and sites as random effects. We tested all continuous data for collinearity prior to the final modeling.
All statistical tests and data visualization were performed using the open software JAMOVI 2.3.22 [43] and GraphPad Prism 9 [44]. All spatial analyses were performed in QGIS 3.26 [41]. The significance level was set at p < 0.05.

3. Results

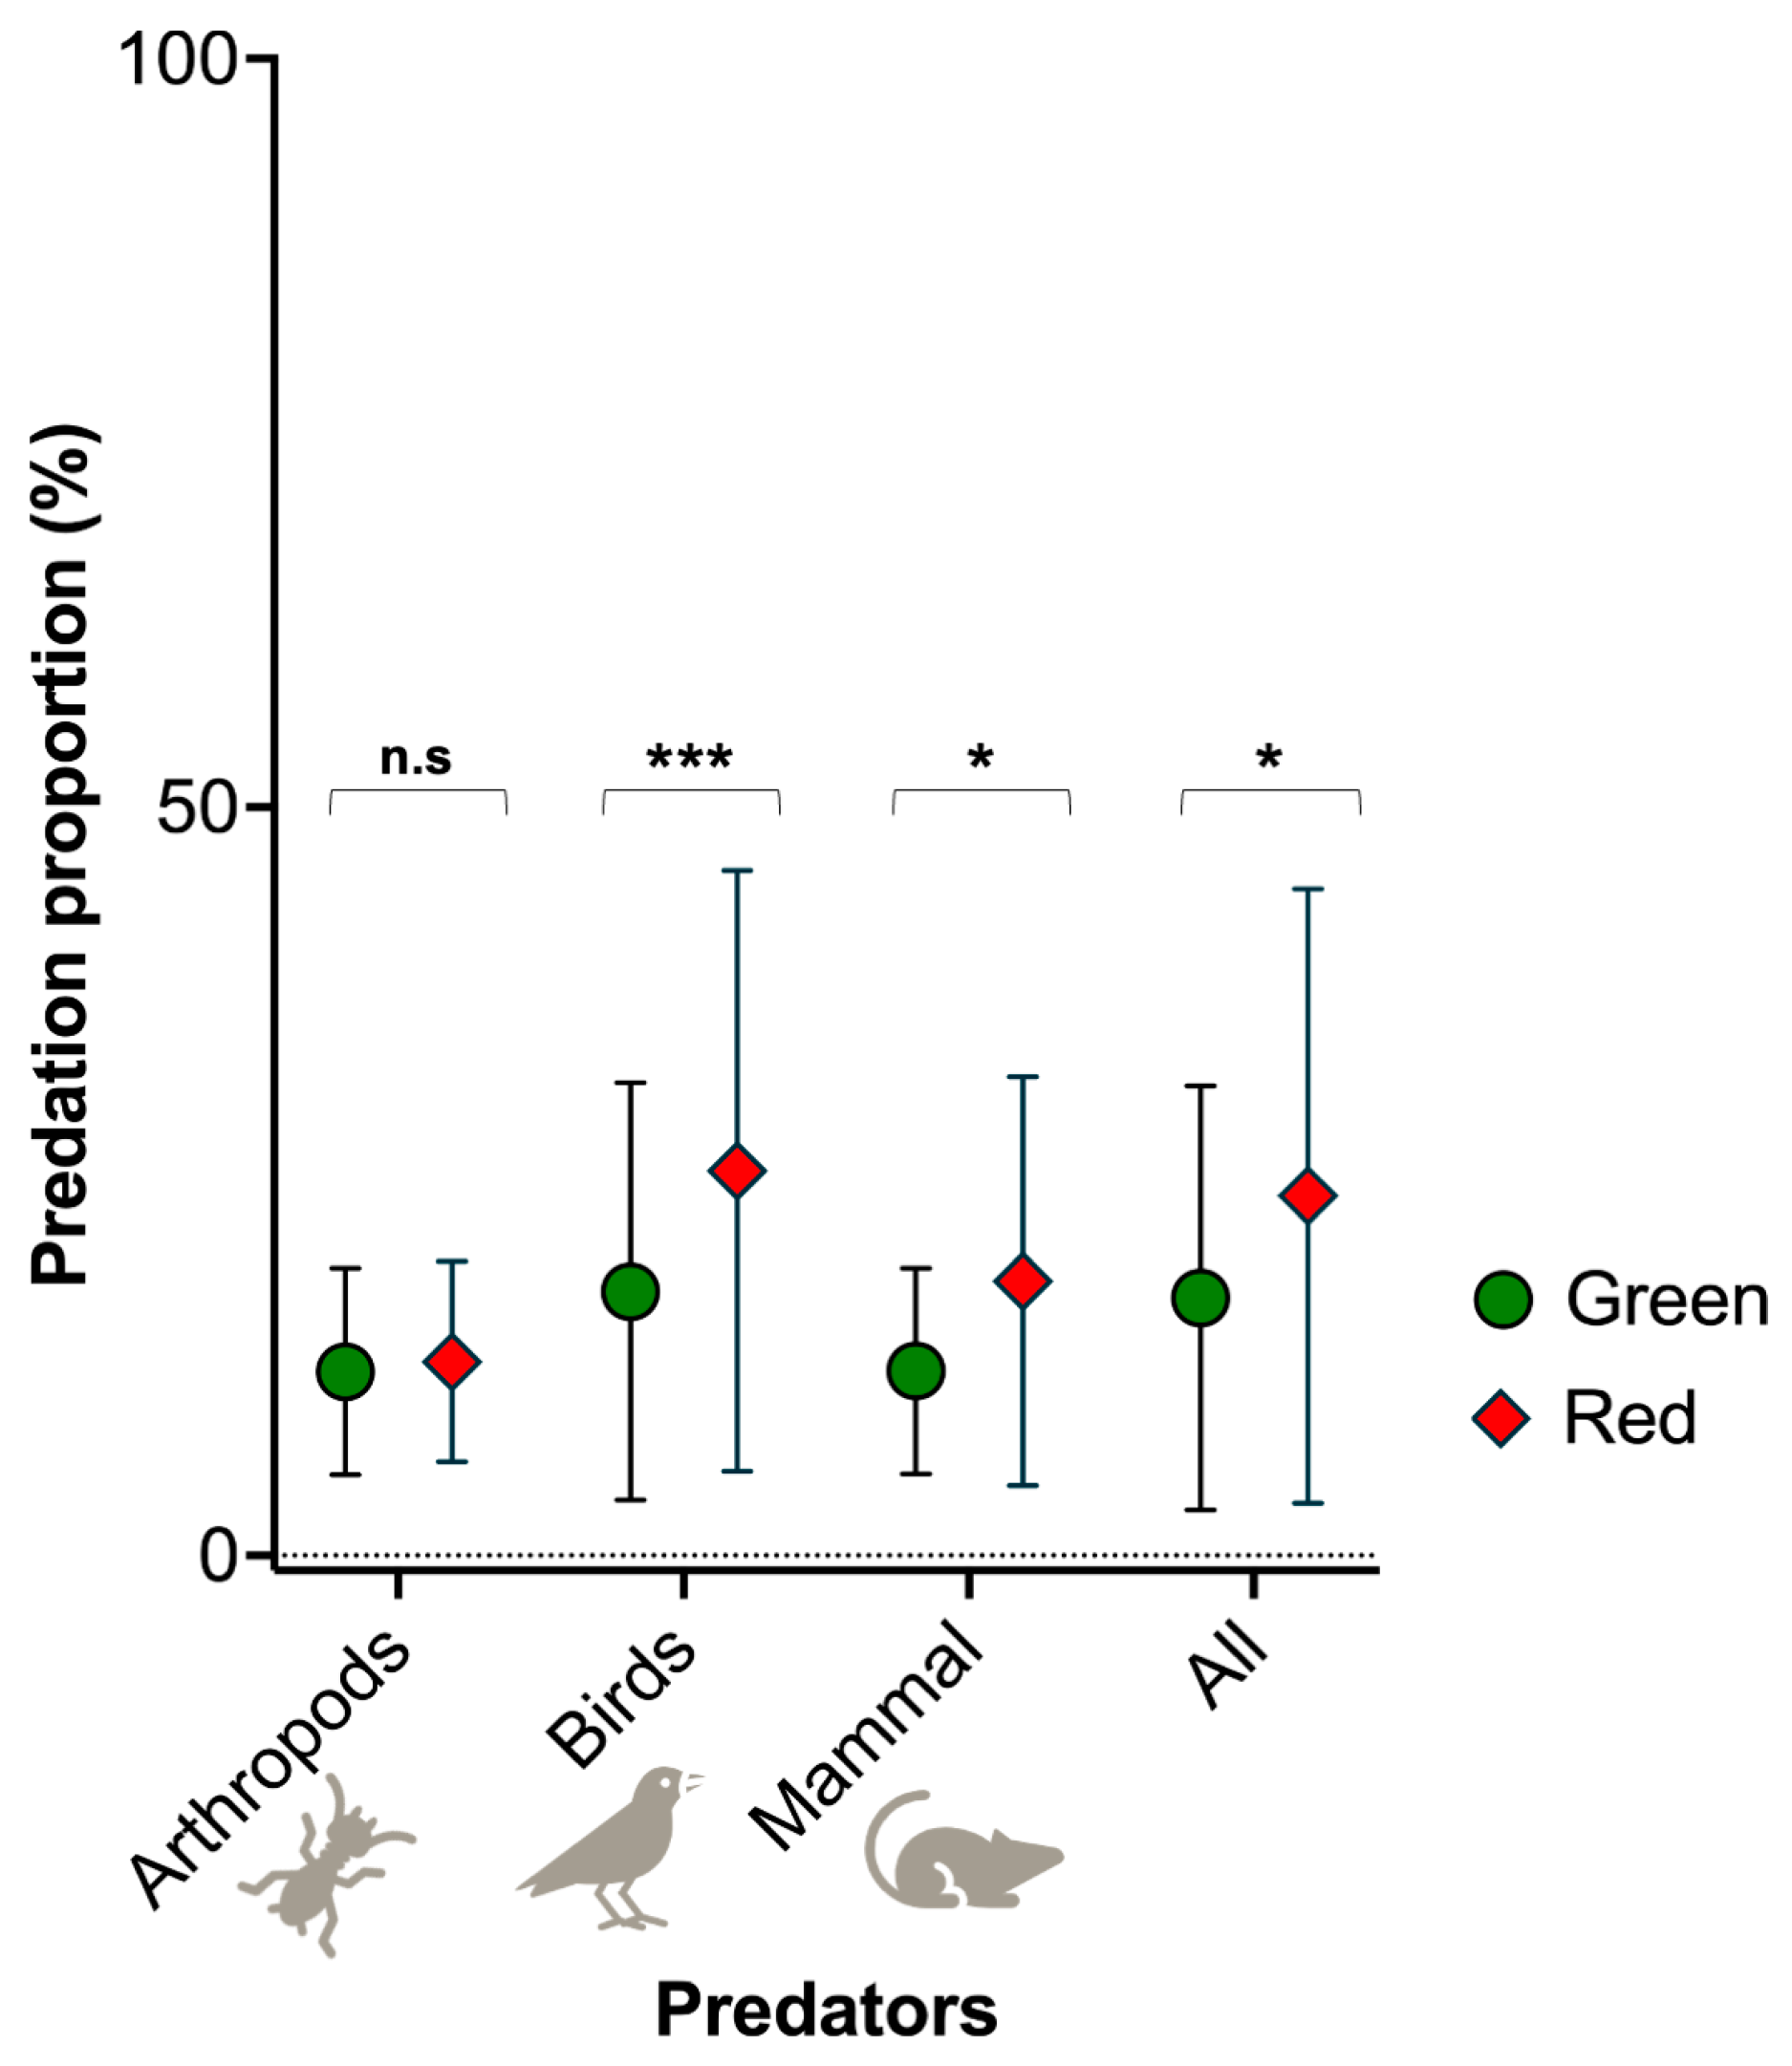
3.1. Fruit Predation Proportion (%) in an Agroecosystem

Of the 1500 artificial fruit models set up within the agroecosystem sites, 368 (24.53%) were predated, with a higher proportion of predation in red fruit models (n = 255, 69.3%) compared to the green fruit models (n = 113, 30.7%) (example of predation of fruits shown in Figure 2). Forty-two (n = 42, 2.8%) fruit models were reported missing (red, n = 28; green, n = 14). We found that the proportion of predation based on the color of the fruit model did not differ between the study sites within the sampled agroecosystem (KW test, Red: H = 10.70, df = 9, p = 0.297; Green: H = 5.96, df = 9, p = 0.744).

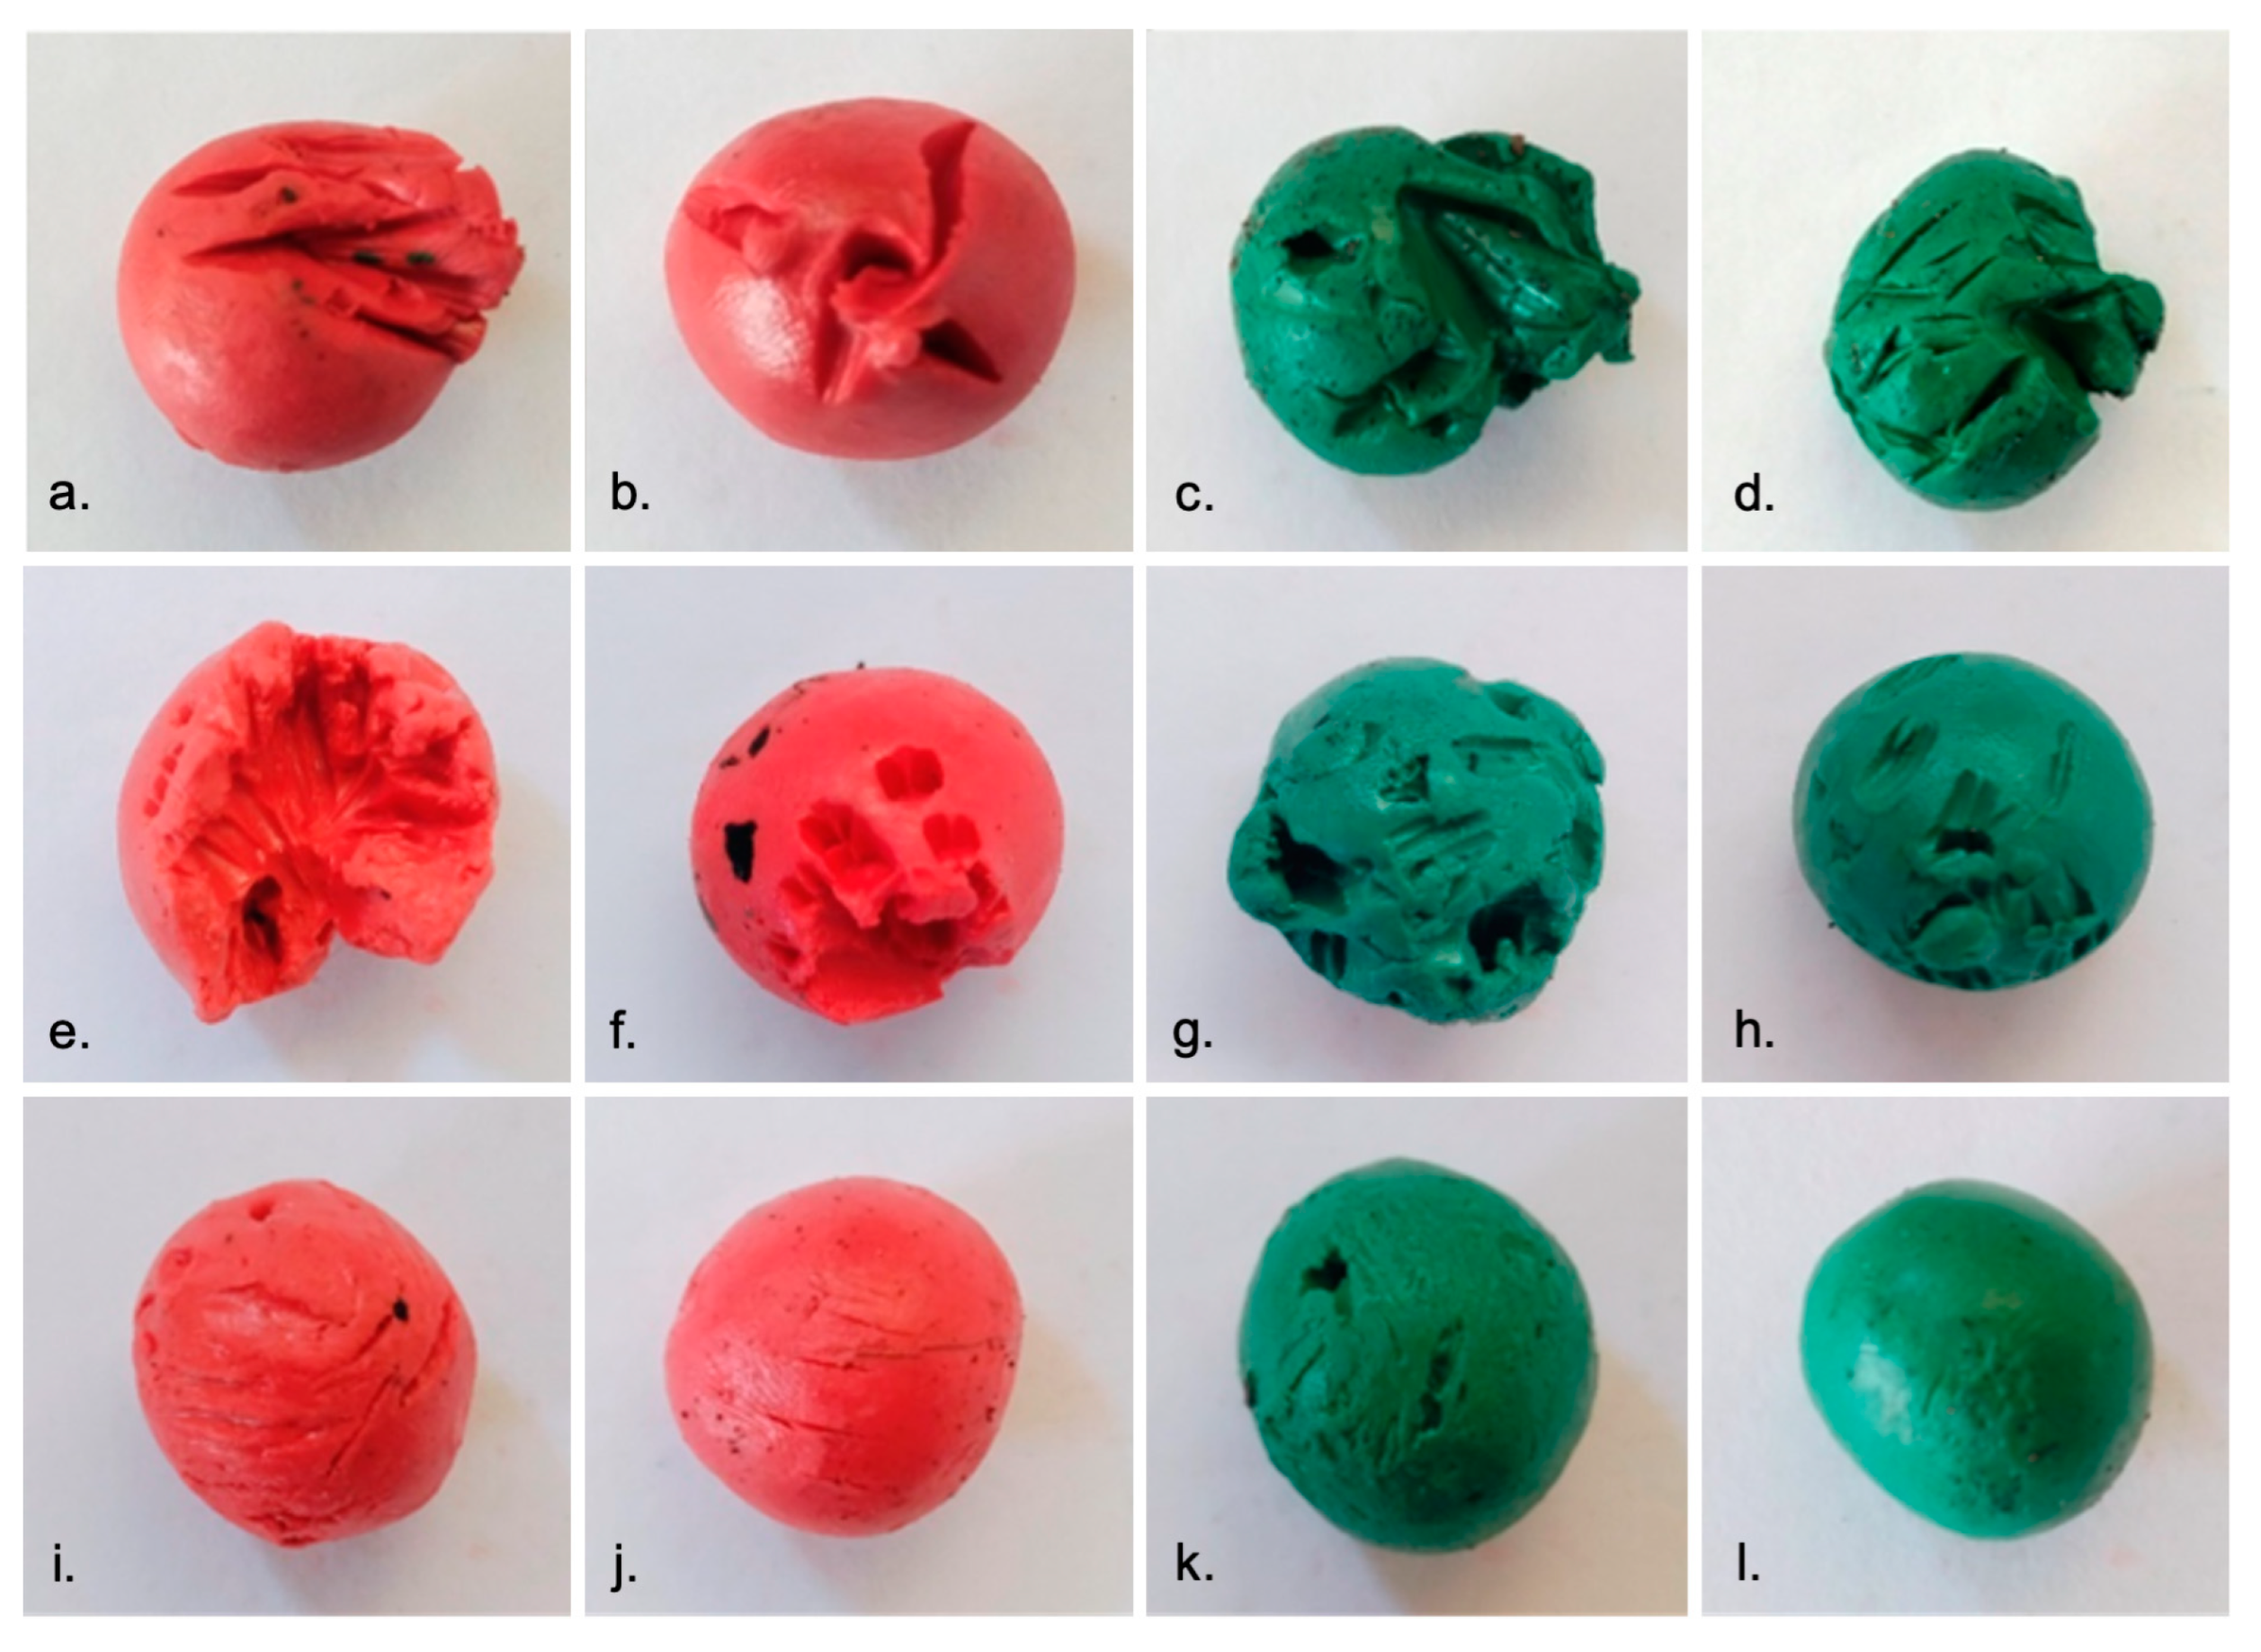
3.2. Risk of Predator Attack

Predation proportion by predators only significantly differed in birds (MWU test = 276, p < 0.001) and mammals (MWU test = 161, p = 0.031) but not in arthropods (MWU test = 91.50, p = 0.277) (Figure 3). Among fruit predators, bird predation represented the majority of identifiable marks (red = 20.9%, n = 223; green = 8.8%, n = 66) (χ² = 43.619, df = 1, p < 0.001), followed by mammals (red = 8.5%, n = 64; green = 3.7, n = 28) (χ² = 15.059, df = 1, p < 0.001), and arthropods (red = 4.5%, n = 34; green = 2.5%, n = 19) (χ² = 4.422, df = 1, p = 0.035).

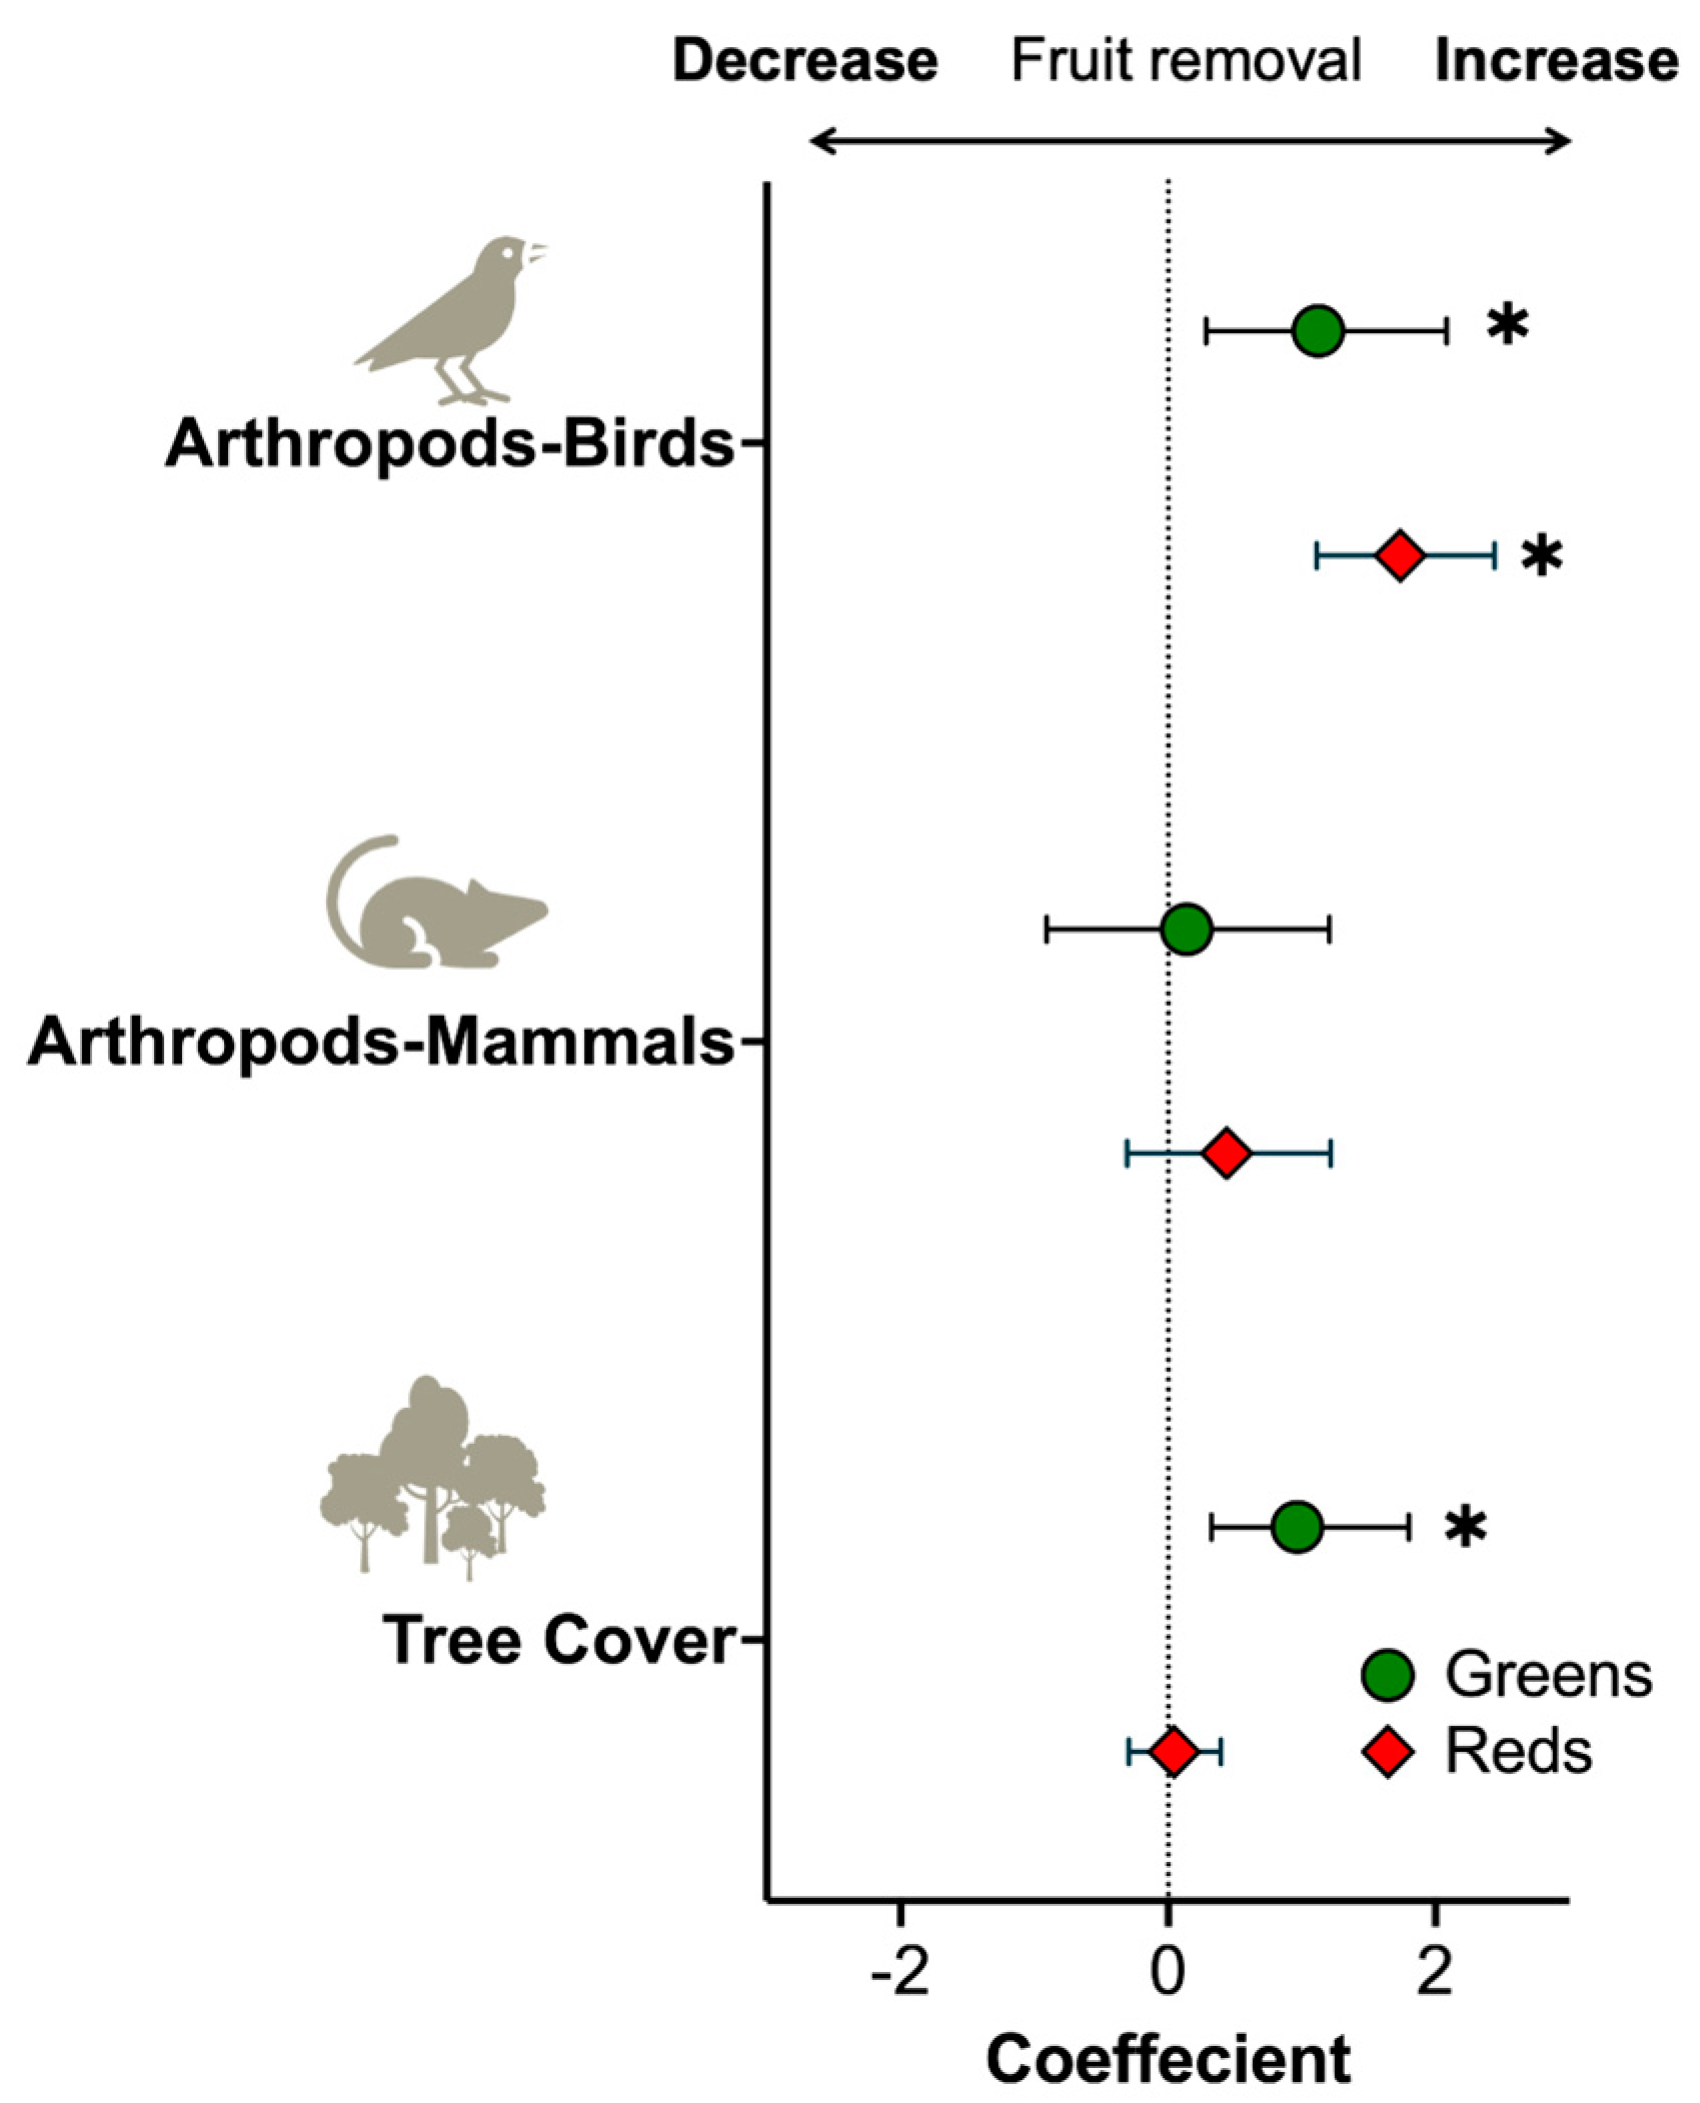
3.3. Risk of Predation by Fruit Color

Our field experiment showed that red-colored models (i.e., ripe fruits) have a higher probability of being attacked (i.e., predation risk) than green-colored (i.e., unripe fruits) (χ² = 59.813, df = 1, p < 0.001). The mean proportion of predation (%) of red-colored models (18.74 ± 9.84) was significantly higher than that of the green-colored models (11.667 ± 6.172) (MWU test = 1609, p < 0.001). Furthermore, the predation risk did not differ between study sites (χ² = 11.409, df = 9, p < 0.249).
Among the six (6) GLMM models built (Table 1), the combination of color, predators, their interactions, and tree cover was the best model to predict predation risk (Model #6, AICc = 741.285) (Table 1, Figure 4). The red-colored models were more likely to be predated than the green-colored models (β = 0.869, p < 0.001). Compared to arthropods, birds are the more dominant predictor (β = 1.421, p < 0.001) of predation probability. On the other hand, mammals (β = 0.288, p = 0.377) did not significantly affect the likelihood of fruit model predation. Meanwhile, tree cover only showed a marginally significant effect on predation. The separate models consistently demonstrated that birds were a significant predator in determining the probability of fruit removal, with a stronger effect observed in the red-colored models (β = 1.724, p < 0.001) compared to the green-colored model (β = 1.126, p = 0.013). (Figure 5). Contrary to our expectations, increased tree cover significantly influences the likelihood of predation in green-colored fruit models (β = 0.968, p = 0.008).

4. Discussion

Our field experiment found the usefulness of clay models in understanding plant-animal interactions in an agroecosystem. Various ecological studies have used modeling clays to study plant–animal interactions under different habitat conditions and successfully regulated the variables [45], since artificial fruits can change fruit characteristics independently [36]. Our present study utilized clay models to demonstrate the proportion of fruit removal and the variations in risk from various frugivores in an agroecosystem in Southcentral Mindanao, Philippines. We found that birds were the dominant fruit predators within the agroecosystem, contributing to at least 61% of predation success. More importantly, we found that fruit color is a significant factor in increasing the probability of predation of fruits, particularly by birds.
The dominance of bird predation on our model fruits can be attributed to their highly developed color vision and excellent visual acuity; therefore, they often use visual cues such as the color of the object during their foraging to locate and identify foodstuffs [26]. Preferences for fruits based on colors have been widely studied in several species of birds, and it has been shown that they prefer red and darker fruits [25,27,46], which can signal the ripeness of the fruit. Galleti et al. [26] demonstrated that darker fruits, such as red and black fruits, were more predated than less conspicuous colors, such as white models. They also showed that artificial fruit experiments could quantify the influence of habitat structure on fruit removal. In a separate field experiment using three colors of artificial fruits (red, brown, and white), around 62.2% of artificial red fruits were pecked the most, followed by brown (57.2%) and white (26.7%) [47]. Their findings suggest that darker fruit colors significantly predict fruit removal. The color of the fruits functions mainly to attract the attention of potential dispersers who use vision as the key sense to find food and to influence the selective pressure of birds in foraging [24,25,45,47]. Cazetta et al. [25] stressed that fruit color is an important factor in plant–bird interactions because it aids in attracting potential dispersers and increases plant diversity. Although some species prefer less appealing colors such as green, the predation of green fruits is lower compared to more apparent colors [48]. This provides insight into the co-evolution of plants and seed dispersers, as immature green fruits of plants that disperse their seeds primarily through ornithocoric means are not yet ready to germinate [24,49].
An alternative explanation for the observed patterns is that bird predators may have a preference for red-colored fruit models over green-colored ones, not necessarily due to an innate color preference, but because they are more easily noticeable in the area due to their greater conspicuousness [27]; this shows that predators perceive artificial fruits as a type of natural fruit. Among predators, birds are dominant compared to mammals and arthropods. This is possibly because birds rely on visual signals, as artificial fruits do not have scent or taste. Most mammals and arthropods would not be attracted to visual cues, but instead to the olfactory [50,51]. Furthermore, fruit dichotomy is a strong determinant of the removal of fruits by predators; for example, mammals consume more orange, yellow, or brown fruits, and birds consume more red or black fruits [13,52]. Although mammals are less attracted to red-colored fruits and contribute lower fruit model predation, they can still be a potential predator and aid in seed dispersal.
Although we did not find any of the local landscape variable to be a significant factor in predation risk, our analysis showed that increasing tree cover and habitat structure would enhance bird–fruit interactions. Forest fragmentation and conversion to agricultural land impact frugivory and seed dispersal through several mechanisms, such as habitat loss [53], fragment isolation and edge effects, and modifications in habitat quality [54]. Without an appropriate approach, quantifying the impact of the land modification on plant–animal interactions is challenging [55]. Previous field investigations showed that seed dispersal interactions are negatively affected by forest loss and fragmentation [15,56]. Frugivores in tropical regions are key conservation priorities due to their higher risk of extinction than other trophic levels, and their sensitivity to habitat modifications, such as agricultural land conversion [57]. However, some species occupy agricultural space and benefit from fruit production and suitable habitats available for foraging [7,28]. In our study, although the investigated agroecosystem is degraded, the plant–bird interaction remained comparable to previous studies in other ecosystems, such as Arruda et al. [47] and Gagetti et al. [58]. The high abundance and proportion of common frugivorous birds, such as Yellow-vented Bulbul (Pycnonotus goiavier), Black-naped Oriole (Oriolus chinensis), Asian Glossy Starling (Aplonis panayensis), and several species of fruit doves that mainly forage at the edge of the forest compared to the inner part of the forest, may also explain the dominance of birds as fruit predators at the study sites [8,59,60,61,62]. This suggests that frugivorous birds can still function, as bird-dispersed fleshy fruits within agroforests are often consumed and dispersed primarily by generalist species that are least sensitive to habitat changes [8,63].
Our results also show that the risk of predation of green-colored fruit models increases with tree cover. This means that increasing tree cover, for example, with more extensive fruit orchards, agroforests, or more forests adjacent to the fruit orchard (i.e., within a 75 m radius in this study), increases the probability of premature fruit removal from fruit trees. This could be due to the increased number of predators, as predicted by the species–area relationship [64], competing for food resources. The availability of forests around the study site also served as a source of frugivore species that can immigrate or colonize the area [65]. Maintaining the remaining native and intact vegetation within the agroecosystem would enhance the diversity of frugivore species, especially birds, within fragmented habitats. Therefore, to effectively ensure the population of frugivorous birds and maximize their ecosystem services as seed dispersers (consequently maximizing habitat quality improvement), an enrichment strategy for agroecosystems and adjacent forests with pioneer trees with dark fleshy fruits such as Aratiles (Muntingia calabura), Mulberry (Morus spp.), Currant tree (Antidesma bunius), Java plum (Syzygium cumini), and figs (Ficus spp.) is highly recommended. This approach would be a sustainable alternative and may benefit frugivores and farmers by increasing the availability of stable food sources for frugivores, rather than relying entirely on the food provided by fruit crops in a monoculture production system, and reducing the disservices of frugivorous birds to crop yields.
Our observed high predation proportion of fruit models showed that agroecosystems can still support frugivorous species, particularly birds. Although most frugivores in agroforests may be generalist species [8,60], frugivorous birds are more mobile, can permeate various habitat types, and disperse seeds more efficiently than other predators [10,12]. Overall, our study provides important management implications, especially in improving habitat quality within an agroecosystem.
Although we conducted our study in a small area and on a localized scale, we have demonstrated the effectiveness (i.e., high predation turnover of clay models) of using clay models to study plant–animal interactions in an agroecosystem. Studying the ecology of plant–animal interactions in different habitat settings is also possible using this technique. Lastly, we acknowledge several caveats in our study. For instance, we did not consider the potential impact of visually attractive fruit colors or olfactory cues that might be more effective for other frugivores, such as mammals. Further research with different fruit colors is needed to explore this aspect. Additionally, the scent of the clay may have influenced the predation rate, which should also be investigated in future studies. We also did not consider the species diversity of frugivores that predated the fruit models in the area. We recommend future studies to integrate methods to study this, for example, using camera traps to identify fruit predators [66,67]. Frugivore communities can vary depending on the types of agroecosystems [8,68], as some systems have higher and better vegetation cover than others [69]. Future studies in the Philippines should also investigate fruit removal and preference in different habitat types and other ecological conditions, including seasonal variation.

Author Contributions

Conceptualization, K.C.T., N.K.B.B. and A.R.A.; methodology, K.C.T. and A.R.A.; validation, K.C.T., N.K.B.B., L.F.C. and A.R.A.; formal analysis, K.C.T., A.R.A. and N.K.B.B.; investigation, N.K.B.B., J.O.R., A.K.L. and K.C.T.; fieldwork, N.K.B.B., J.O.R. and A.K.L.; resources, K.C.T. and N.K.B.B.; data curation, N.K.B.B. and K.C.T.; writing—original draft preparation, N.K.B.B. and K.C.T.; writing—review and editing, N.K.B.B., K.C.T., L.F.C., A.K.L., J.O.R. and A.R.A.; visualization, K.C.T. and N.K.B.B.; supervision, K.C.T. and A.R.A. All authors have read and agreed to the published version of the manuscript.

Funding

This research received no external funding.

Institutional Review Board Statement

Not applicable.

Data Availability Statement

Data are available upon request.

Acknowledgments

We would like to thank the two anonymous reviewers and the editor for their encouraging and insightful comments that significantly improved the quality of the manuscript. We would like to thank Efren Magulama of the University of Southern Mindanao Agricultural Research and Development Center (USMARDC) for the permission to perform the experiment in the USMARDC vicinity.

Conflicts of Interest

The authors declare that the research was conducted without any commercial or financial relationship that could be construed as a potential conflict of interest.

References

  1. Aziz, S.A.; McConkey, K.R.; Tanalgo, K.; Sritongchuay, T.; Low, M.-R.; Yong, J.Y.; Mildenstein, T.L.; Nuevo-Diego, C.E.; Lim, V.-C.; Racey, P.A. The Critical Importance of Old World Fruit Bats for Healthy Ecosystems and Economies. Front. Ecol. Evol. 2021, 9, 641411. [Google Scholar] [CrossRef]
  2. Camargo, P.H.S.A.; Carlo, T.A.; Brancalion, P.H.S.; Pizo, M.A. Frugivore Diversity Increases Evenness in the Seed Rain on Deforested Tropical Landscapes. Oikos 2022, 2022, e08028. [Google Scholar] [CrossRef]
  3. Monteiro, E.C.S.; Pizo, M.A.; Vancine, M.H.; Ribeiro, M.C. Forest Cover and Connectivity Have Pervasive Effects on the Maintenance of Evolutionary Distinct Interactions in Seed Dispersal Networks. Oikos 2022, 2022, e08028. [Google Scholar] [CrossRef]
  4. Canterbury, G.E.; Martin, T.E.; Petit, D.R.; Petit, L.J.; Bradford, D.F. Bird Communities and Habitat as Ecological Indicators of Forest Condition in Regional Monitoring. Conserv. Biol. 2000, 14, 544–558. [Google Scholar] [CrossRef]
  5. Fraixedas, S.; Lindén, A.; Piha, M.; Cabeza, M.; Gregory, R.; Lehikoinen, A. A State-of-the-Art Review on Birds as Indicators of Biodiversity: Advances, Challenges, and Future Directions. Ecol. Indic. 2020, 118, 106728. [Google Scholar] [CrossRef]
  6. Newbold, T.; Hudson, L.; Hill, S.; Contu, S.; Lysenko, I.; Senior, R.; Börger, L.; Bennett, D.; Choimes, A.; Collen, B.; et al. Global Effects of Land Use on Local Terrestrial Biodiversity. Nature 2015, 520, 45–50. [Google Scholar] [CrossRef]
  7. Tanalgo, K.C.; Sritongchuay, T.; Hughes, A.C. Seasonal Activity of Fruit Bats in a Monoculture Rubber and Oil Palm Plantation in the Southern Philippines. Conservation 2021, 1, 258–269. [Google Scholar] [CrossRef]
  8. Tanalgo, K.C.; Achondo, M.J.M.M.; Hughes, A.C. Small Things Matter: The Value of Rapid Biodiversity Surveys to Understanding Local Bird Diversity Patterns in Southcentral Mindanao, Philippines. Trop. Conserv. Sci. 2019, 12, 1940082919869482. [Google Scholar] [CrossRef]
  9. Gonzales, R.; Ingle, N.; Lagunzad, D.; Nakashizuka, T. Seed Dispersal by Birds and Bats in Lowland Philippine Forest Successional Area. Biotropica 2009, 41, 452–458. [Google Scholar] [CrossRef]
  10. Ingle, N.R. Seed Dispersal by Wind, Birds, and Bats between Philippine Montane Rainforest and Successional Vegetation. Oecologia 2003, 134, 251–261. [Google Scholar] [CrossRef]
  11. Heleno, R.H.; Ross, G.; Everard, A.; Memmott, J.; Ramos, J.A. The Role of Avian ‘Seed Predators’ as Seed Dispersers. Ibis 2011, 153, 199–203. [Google Scholar] [CrossRef]
  12. Sritongchuay, T.; Gale, G.A.; Stewart, A.; Kerdkaew, T.; Bumrungsri, S. Seed Rain in Abandoned Clearings in a Lowland Evergreen Rain Forest in Southern Thailand. Trop. Conserv. Sci. 2014, 7, 572–585. [Google Scholar] [CrossRef]
  13. Willson, M.F.; Traveset, A. The Ecology of Seed Dispersal. In Seeds: The Ecology of Regeneration in Plant Communities; CABI: Wallingford, UK, 2000; pp. 85–110. [Google Scholar] [CrossRef]
  14. Wang, B.; Smith, T. Closing the Seed Dispersal Loop. Trends Ecol. Evol. 2002, 17, 379–386. [Google Scholar] [CrossRef]
  15. Camargo, P.H.S.A.; Pizo, M.A.; Brancalion, P.H.S.; Carlo, T.A. Fruit Traits of Pioneer Trees Structure Seed Dispersal across Distances on Tropical Deforested Landscapes: Implications for Restoration. J. Appl. Ecol. 2020, 57, 2329–2339. [Google Scholar] [CrossRef]
  16. Pilling, D.; Bélanger, J.; Hoffmann, I. Declining Biodiversity for Food and Agriculture Needs Urgent Global Action. Nat. Food 2020, 1, 144–147. [Google Scholar] [CrossRef]
  17. Raven, P.H.; Wagner, D.L. Agricultural Intensification and Climate Change Are Rapidly Decreasing Insect Biodiversity. Proc. Natl. Acad. Sci. USA 2021, 118, e2002548117. [Google Scholar] [CrossRef]
  18. Sun, Z.; Behrens, P.; Tukker, A.; Bruckner, M.; Scherer, L. Global Human Consumption Threatens Key Biodiversity Areas. Environ. Sci. Technol. 2022, 56, 9003–9014. [Google Scholar] [CrossRef]
  19. Koh, L.P.; Wilcove, D.S. Cashing in Palm Oil for Conservation. Nature 2007, 448, 993–994. [Google Scholar] [CrossRef]
  20. Sodhi, N.S.; Koh, L.P.; Clements, R.; Wanger, T.C.; Hill, J.K.; Hamer, K.C.; Clough, Y.; Tscharntke, T.; Posa, M.R.C.; Lee, T.M. Conserving Southeast Asian Forest Biodiversity in Human-Modified Landscapes. Biol. Conserv. 2010, 143, 2375–2384. [Google Scholar] [CrossRef]
  21. Suhonen, J.; Jokimäki, J. Fruit Removal from Rowanberry (Sorbus aucuparia) Trees at Urban and Rural Areas in Finland: A Multi-Scale Study. Landsc. Urban Plan. 2015, 137, 13–19. [Google Scholar] [CrossRef]
  22. Suhonen, J.; Jokimäki, J.; Lassila, R.; Kaisanlahti-Jokimäki, M.-L.; Carbó-Ramírez, P. Effects of Roads on Fruit Crop and Removal Rate from Rowanberry Trees (Sorbus aucuparia) by Birds in Urban Areas of Finland. Urban For. Urban Green. 2017, 27, 148–154. [Google Scholar] [CrossRef]
  23. Lomascolo, S.; Schaefer, H. Signal Convergence in Fruits: A Result of Selection by Frugivores? J. Evol. Biol. 2010, 23, 614–624. [Google Scholar] [CrossRef] [PubMed]
  24. Martin Schaefer, H.; Schaefer, V.; Vorobyev, M. Are Fruit Colors Adapted to Consumer Vision and Birds Equally Efficient in Detecting Colorful Signals? Am. Nat. 2007, 169 (Suppl. 1), S159–S169. [Google Scholar] [CrossRef]
  25. Cazetta, E.; Schaefer, H.M.; Galetti, M. Why Are Fruits Colorful? The Relative Importance of Achromatic and Chromatic Contrasts for Detection by Birds. Evol. Ecol. 2009, 23, 233–244. [Google Scholar] [CrossRef]
  26. Galetti, M.; Alves-Costa, C.; Cazetta, E. Effects of Forest Fragmentation, Anthropogenic Edges and Fruit Colour on the Consumption of Ornithocoric Fruits. Biol. Conserv. 2003, 111, 269–273. [Google Scholar] [CrossRef]
  27. Melo, G.; Penatti, N.; Raizer, J. Fruit of a Contrasting Colour Is More Detectable by Frugivores. J. Trop. Ecol. 2011, 27, 319–322. [Google Scholar] [CrossRef]
  28. Rey, P.J. Preserving Frugivorous Birds in Agro-Ecosystems: Lessons from Spanish Olive Orchards. J. Appl. Ecol. 2011, 48, 228–237. [Google Scholar] [CrossRef]
  29. Bieber, A.G.D.; Silva, P.S.D.; Sendoya, S.F.; Oliveira, P.S. Assessing the Impact of Deforestation of the Atlantic Rainforest on Ant-Fruit Interactions: A Field Experiment Using Synthetic Fruits. PLoS ONE 2014, 9, e90369. [Google Scholar] [CrossRef]
  30. Sritongchuay, T.; Kremen, C.; Bumrungsri, S. Effects of Forest and Cave Proximity on Fruit Set of Tree Crops in Tropical Orchards in Southern Thailand. J. Trop. Ecol. 2016, 32, 269–279. [Google Scholar] [CrossRef]
  31. Enriquez, T.; Perez-Torres, J.; Ruiz, C.; Suarez, A. Seed Dispersal by Fruit Bats in Colombia Generates Ecosystem Services. Agron. Sustain. Dev. 2020, 40, 1–15. [Google Scholar] [CrossRef]
  32. Genes, L.; Dirzo, R. Restoration of Plant-Animal Interactions in Terrestrial Ecosystems. Biol. Conserv. 2022, 265, 109393. [Google Scholar] [CrossRef]
  33. Teixido, A.L.; Fuzessy, L.F.; Souza, C.S.; Gomes, I.N.; Kaminski, L.A.; Oliveira, P.C.; Maruyama, P.K. Anthropogenic Impacts on Plant-Animal Mutualisms: A Global Synthesis for Pollination and Seed Dispersal. Biol. Conserv. 2022, 266, 109461. [Google Scholar] [CrossRef]
  34. Sritongchuay, T.; Dalsgaard, B.; Wayo, K.; Zou, Y.; Simla, P.; Tanalgo, K.C.; Orr, M.C.; Hughes, A.C. Landscape-Level Effects on Pollination Networks and Fruit-Set of Crops in Tropical Small-Holder Agroecosystems. Agric. Ecosyst. Environ. 2022, 339, 108112. [Google Scholar] [CrossRef]
  35. Sallabanks, R. Hierarchical Mechanisms of Fruit Selection by an Avian Frugivore. Ecology 1993, 74, 1326. [Google Scholar] [CrossRef]
  36. Alves-Costa, C.; Lopes, A. Using Artificial Fruits to Evaluate Fruit Selection by Birds in the Field1. Biotropica 2006, 33, 713–717. [Google Scholar] [CrossRef]
  37. Pena, J.C.; Aoki-Gonçalves, F.; Dáttilo, W.; Ribeiro, M.C.; MacGregor-Fors, I. Caterpillars’ Natural Enemies and Attack Probability in an Urbanization Intensity Gradient across a Neotropical Streetscape. Ecol. Indic. 2021, 128, 107851. [Google Scholar] [CrossRef]
  38. Karra, K.; Kontgis, C.; Statman-Weil, Z.; Mazzariello, J.C.; Mathis, M.; Brumby, S.P. Global Land Use / Land Cover with Sentinel 2 and Deep Learning. In Proceedings of the 2021 IEEE International Geoscience and Remote Sensing Symposium IGARSS, Brussels, Belgium, 11–16 July 2021; pp. 4704–4707. [Google Scholar]
  39. Leles, B.; Xiao, X.; Pasion, B.; Nakamura, A.; Tomlinson, K. Does Plant Diversity Increase Top-down Control of Herbivorous Insects in Tropical Forest? Oikos 2017, 126, 1142–1149. [Google Scholar] [CrossRef]
  40. Low, P.A.; Sam, K.; McArthur, C.; Posa, M.R.C.; Hochuli, D.F. Determining Predator Identity from Attack Marks Left in Model Caterpillars: Guidelines for Best Practice. Entomol. Exp. Appl. 2014, 152, 120–126. [Google Scholar] [CrossRef]
  41. QGIS Development Team QGIS Geographic Information System. Open Source Geospatial Foundation Project. 2022. Available online: http://qgis.osgeo.org (accessed on 12 December 2022).
  42. Burnham, K.P.; Anderson, D.R. Multimodel Inference: Understanding AIC and BIC in Model Selection. Sociol. Methods Res. 2004, 33, 261–304. [Google Scholar] [CrossRef]
  43. The Jamovi Project Jamovi (Version 2.3) [Computer Software]. 2023. Available online: https://www.jamovi.org/ (accessed on 3 January 2023).
  44. GraphPad Prism; GraphPad Software, Inc.: San Diego, CA, USA, 2022.
  45. Lim, G.; Burns, K.C. Do Fruit Reflectance Properties Affect Avian Frugivory in New Zealand? New Zealand J. Bot. 2022, 60, 319–329. [Google Scholar] [CrossRef]
  46. Willson, M.; Graff, D.; Whelan, C. Color Preferences of Frugivorous Birds in Relation to the Colors of Fleshy Fruits. Condor 1990, 92, 545–555. [Google Scholar] [CrossRef]
  47. Arruda, R.; Rodrigues, D.J.; Izzo, T.J. Rapid Assessment of Fruit-Color Selection by Birds Using Artificial Fruits at Local Scale in Central Amazonia. Acta Amaz. 2008, 38, 291–296. [Google Scholar] [CrossRef]
  48. Spironello, W.R.; de Tarso Barbosa Sampaio, P.; Ronchi-Teles, B. Produção e predação de frutos em Aniba rosaeodora Ducke var. amazonica Ducke (Lauraceae) em sistema de plantio sob floresta de terra firme na Amazônia Central. Acta Bot. Bras. 2004, 18, 801–807. [Google Scholar] [CrossRef]
  49. Lomáscolo, S.B.; Speranza, P.; Kimball, R.T. Correlated Evolution of Fig Size and Color Supports the Dispersal Syndromes Hypothesis. Oecologia 2008, 156, 783–796. [Google Scholar] [CrossRef]
  50. Beauchamp, G. Exploring the Role of Vision in Social Foraging: What Happens to Group Size, Vigilance, Spacing, Aggression and Habitat Use in Birds and Mammals That Forage at Night? Biol. Rev. 2007, 82, 511–525. [Google Scholar] [CrossRef]
  51. Thompson, C.L.; Bottenberg, K.N.; Lantz, A.W.; de Oliveira, M.A.B.; Melo, L.C.O.; Vinyard, C.J. What Smells? Developing in-Field Methods to Characterize the Chemical Composition of Wild Mammalian Scent Cues. Ecol. Evol. 2020, 10, 4691–4701. [Google Scholar] [CrossRef]
  52. Flörchinger, M.; Braun, J.; Böhning-Gaese, K.; Schaefer, H.M. Fruit Size, Crop Mass, and Plant Height Explain Differential Fruit Choice of Primates and Birds. Oecologia 2010, 164, 151–161. [Google Scholar] [CrossRef]
  53. García, D.; Chacoff, N.P. Scale-Dependent Effects of Habitat Fragmentation on Hawthorn Pollination, Frugivory, and Seed Predation. Conserv. Biol. 2007, 21, 400–411. [Google Scholar] [CrossRef]
  54. Lehouck, V.; Spanhove, T.; Colson, L.; Adringa-Davis, A.; Cordeiro, N.; Lens, L. Habitat Disturbance Reduces Seed Dispersal of a Forest Interior Tree in a Fragmented African Cloud Forest. Oikos 2009, 118, 1023–1034. [Google Scholar] [CrossRef]
  55. Fahrig, L. Effects of Habitat Fragmentation on Biodiversity. Annu. Rev. Ecol. Evol. Syst. 2003, 34, 487–515. [Google Scholar] [CrossRef]
  56. Santos, A.S.; Cazetta, E.; Dodonov, P.; Faria, D.; Gaiotto, F.A. Landscape-Scale Deforestation Decreases Gene Flow Distance of a Keystone Tropical Palm, Euterpe Edulis Mart (Arecaceae). Ecol. Evol. 2016, 6, 6586–6598. [Google Scholar] [CrossRef]
  57. Atwood, T.B.; Valentine, S.A.; Hammill, E.; McCauley, D.J.; Madin, E.M.P.; Beard, K.H.; Pearse, W.D. Herbivores at the Highest Risk of Extinction among Mammals, Birds, and Reptiles. Sci. Adv. 2020, 6, eabb8458. [Google Scholar] [CrossRef]
  58. Gagetti, B.L.; Piratelli, A.J.; Piña-Rodrigues, F.C.M. Fruit Color Preference by Birds and Applications to Ecological Restoration. Braz. J. Biol. Rev. Brasleira Biol. 2016, 76, 955–966. [Google Scholar] [CrossRef]
  59. Watson, J.E.M.; Whittaker, R.J.; Dawson, T.P. Habitat Structure and Proximity to Forest Edge Affect the Abundance and Distribution of Forest-Dependent Birds in Tropical Coastal Forests of Southeastern Madagascar. Biol. Conserv. 2004, 120, 311–327. [Google Scholar] [CrossRef]
  60. Tanalgo, K.C.; Pineda, J.A.F.; Agravante, M.E.; Amerol, Z.M. Bird Diversity and Structure in Different Land-Use Types in Lowland South-Central Mindanao, Philippines. Trop. Life Sci. Res. 2015, 26, 85–103. [Google Scholar]
  61. Chaves, P.P.; Timóteo, S.; Gomes, S.; Rainho, A. Response of Avian and Mammal Seed Dispersal Networks to Human-Induced Forest Edges in a Sub-Humid Tropical Forest. J. Trop. Ecol. 2022, 38, 199–209. [Google Scholar] [CrossRef]
  62. Española, C.P.; Collar, N.J.; Mallari, N.A.D.; Marsden, S.J. Large Avian Frugivores in the Philippines Show Linear Responses to Improvements in Forest Quality. For. Ecol. Manag. 2016, 375, 127–133. [Google Scholar] [CrossRef]
  63. Rey, P.J.; Alcántara, J.M. Effects of Habitat Alteration on the Effectiveness of Plant-Avian Seed Dispersal Mutualisms: Consequences for Plant Regeneration. Perspect. Plant Ecol. Evol. Syst. 2014, 16, 21–31. [Google Scholar] [CrossRef]
  64. Li, W.; Zhu, C.; Grass, I.; Vázquez, D.P.; Wang, D.; Zhao, Y.; Zeng, D.; Kang, Y.; Ding, P.; Si, X. Plant-Frugivore Network Simplification under Habitat Fragmentation Leaves a Small Core of Interacting Generalists. Commun. Biol. 2022, 5, 1–10. [Google Scholar] [CrossRef]
  65. Cornell, H.V.; Harrison, S.P. What Are Species Pools and When Are They Important? Annu. Rev. Ecol. Evol. Syst. 2014, 45, 45–67. [Google Scholar] [CrossRef]
  66. Séguigne, M.; Coutant, O.; Bouton, B.; Picart, L.; Guilbert, É.; Forget, P.-M. Arboreal Camera Trap Reveals the Frequent Occurrence of a Frugivore-Carnivore in Neotropical Nutmeg Trees. Sci. Rep. 2022, 12, 7513. [Google Scholar] [CrossRef] [PubMed]
  67. Zhu, C.; Li, W.; Gregory, T.; Wang, D.; Ren, P.; Zeng, D.; Kang, Y.; Ding, P.; Si, X. Arboreal Camera Trapping: A Reliable Tool to Monitor Plant-Frugivore Interactions in the Trees on Large Scales. Remote Sens. Ecol. Conserv. 2022, 8, 92–104. [Google Scholar] [CrossRef]
  68. Azhar, B.; Puan, C.L.; Aziz, N.; Sainuddin, M.; Adila, N.; Samsuddin, S.; Asmah, S.; Syafiq, M.; Razak, S.A.; Hafizuddin, A.; et al. Effects of in Situ Habitat Quality and Landscape Characteristics in the Oil Palm Agricultural Matrix on Tropical Understory Birds, Fruit Bats and Butterflies. Biodivers. Conserv. 2015, 24, 3125–3144. [Google Scholar] [CrossRef]
  69. Agduma, A.R.; Achondo, M.J.M.M.; Bretana, B.L.P.; Bello, V.P.; Remollo, L.L.; Mancao, L.S.; Supremo, J.P.; Salem, J.G.C.; Salvaña, F.R.P. Diversity of Vascular Plant Species in an Agroforest: The Case of a Rubber (Hevea brasiliensis) Plantation in Makilala, North Cotabato. Philipp. J. Crop Sci. 2011, 36, 57–64. [Google Scholar]
Figure 2. Examples of typical attack marks of birds (ad), mammals (eh), and arthropods (il).
Birds 04 00016 g002
Figure 3. Comparison of the predation proportion (%) of different predator types in red and green artificial fruit models. Whiskers represent the SD, * p < 0.05, ** p < 0.01, *** p < 0.001, n.s. = not significantly different.
Birds 04 00016 g003
Figure 4. Visualized results of the best binomial generalized linear model (GLM). The dots represent the coefficients, and the whiskers represent the lower and upper bounds of the 95% CI. Silhouettes in dark colors represent significant relationships at p < 0.05.
Birds 04 00016 g004
Figure 5. Comparison of the binomial generalized linear mixed models (GLMM) results between the predation risk of two artificial fruit models. The diamonds and dots represent the coefficients, and the whiskers represent the lower and upper bounds of the 95% CI. The * denotes significant relationships at p < 0.05.
Birds 04 00016 g005
Table 1. List of candidate models for the best binomial generalized linear mixed model (GLMM) predicting the risk of fruit removal. The best model is shown in bold.
ModelsTermsAICcΔAICcRLwAICDc
1Color + Predator + Color × Predator + DBH + Canopy + Tree cover747.1600.5100.7750.510
2Color + Predator + Color × Predator + DBH + Canopy747.7601.1100.5740.378
3Predator + DBH + Canopy765.10018.4500.0000.000
4Predator +Color + Predator × Color747.0600.4100.8150.536
5DBH + Canopy + Tree Cover808.78062.1300.0000.000
6Color + Predator + Color × Predator + Tree Cover746.6500.0001.0000.658
Disclaimer/Publisher’s Note: The statements, opinions and data contained in all publications are solely those of the individual author(s) and contributor(s) and not of MDPI and/or the editor(s). MDPI and/or the editor(s) disclaim responsibility for any injury to people or property resulting from any ideas, methods, instructions or products referred to in the content.

