Article

Flight Type and Seasonal Movements Are Important Predictors for Avian Collisions in Wind Farms

by
Alfonso Balmori-de la Puente
†,‡ and
Alfonso Balmori
*
C/Navarra N°1 5° B, 47007 Valladolid, Spain
*
Author to whom correspondence should be addressed.
Current address: CIBIO, Centro de Investigação em Biodiversidade e Recursos Genéticos, InBIO Laboratório Associado, Universidade do Porto, Campus de Vairão, 4485-661 Vairão, Portugal.
BIOPOLIS Program in Genomics, Biodiversity and Land Planning, CIBIO, 4485-661 Vairão, Portugal.
Birds 2023, 4(1), 85-100; https://doi.org/10.3390/birds4010007
Submission received: 27 September 2022 / Revised: 1 February 2023 / Accepted: 2 February 2023 / Published: 9 February 2023
(This article belongs to the Special Issue Feature Papers of Birds 2022–2023)

Abstract

:

Simple Summary

Wind farms are an alternative energy source mitigating environmental pollution. However, they can have adverse effects, causing an increase in mortality for wildlife through collision with wind turbines. In this work, we analysed the dead birds involved in wind farm collisions in Spain over a period of 16 years (2001–2016; full dataset: n = 3130) in order to better understand their propensity to collide with wind turbines. We found that the flight type was the most important variable to understand collision vulnerability, followed by seasonal movement type and the Spanish population. In addition, we observed that species with hovering, song-flights and active soaring flights are more susceptible to collisions with wind farms, and the seasonality of collisions depends on the seasonal movement types.

Abstract

Wind farms are an alternative energy source mitigating environmental pollution. However, they can have adverse effects, causing an increase in mortality for wildlife through collision with wind turbines. The aim of this study was to investigate the risks of bird collisions with wind turbines linked to species-specific variables. For this purpose, we have analysed the dead birds involved in wind farm collisions that were admitted to two rescue centres in Spain over a period of 16 years (2001–2016; full dataset: n = 3130). All the birds analysed in this study were killed by turbines in wind farms. We performed two linear models using all species and a reduced dataset (bird of prey and passerine having more than four collisions) that included group, seasonal movements, flight type, length, and the number of pairs for the Spanish and European populations. The coefficients and the percent of variance explained by each relevant variable were determined in the models and the real values were compared with predicted values to visualise the goodness of fit. We found that the flight type was the most important variable explaining 35% of the total variability for the model including all species and 29% for the reduced dataset respectively, followed by seasonal movement type (4%/17% respectively) and the Spanish population (4%/6%). Subsequent analyses suggested that species with hovering, song-flights and active soaring flights are more susceptible to collisions with wind farms, and that species showing partial migration have a significant peak of collisions across spring and autumn. The estimated species-specific collision index can help in modelling the theoretical risk of collision with wind turbines, depending on the species existing in the area and their predicted values of vulnerability, which is linked to flight types and seasonal movements.

1. Introduction

Many species of vertebrates are experiencing significant population declines, and determining the causes can lead to take the most appropriate management actions [1]. While the main drivers are habitat loss, invasive species and climate change, there are specific problems that cause significant direct mortality on wild birds [2]. A notable proportion of vertebrate mortality results from direct anthropogenic sources (e.g., collisions with man-made structures or traffic casualties), and accurate mortality quantification is essential to inform policy decisions. The use of mortality estimates to assess whether a threat has a biologically important impact is critical for conservation [3].
Concerns about anthropogenically caused climate change have resulted in running out of fuel, and the development of renewable energy sources, mainly wind farms and solar technologies [4,5]. The development of recent technologies, such as wind energy, has positive and negative impacts: Wind farms are an alternative energy source mitigating environmental pollution. However, they can have adverse effects for wildlife, causing an increase in mortality through collision with wind turbines [4,5,6,7,8,9,10,11,12]. There are also other indirect effects on bird populations such as noise pollution, displacement, and a reduction of habitat availability around wind parks [13,14,15,16,17,18,19,20]. For instance, territories within 500 m from the turbines experienced significantly lower breeding success after the construction of wind farms [21]. Further, the impact of wind farms occurs both in large birds, such as raptors [22,23,24], as well as in small endangered birds, such as Dupont’s Lark (Chersophilus duponti) [25]. The associated influences of wind farms, especially the built of new power-lines and also the new roads, increase the probability of collisions on power-lines [26] and vehicle collisions [27] respectively.
Collision risk is related to bird characteristics (morphometric, behaviour, bird vision, flight speed and phenology) and wind turbine properties (including size, rotor speed and spatial distribution), as well as low visibility circumstances, landscape type and weather [28,29,30]. In order to adopt the corresponding damping measures, the advances in knowledge of the main factors influencing collision risk for avian fatality in wind farms, is considered a priority research topic. According to Marques et al. (2014) [29] the priority areas for research can be grouped into three main categories: (i) the risk characteristics for species, (ii) the site, and (iii) the wind farm features. Although the risk for bird collisions with wind turbines results from complex interactions between all these factors, the bird’s behaviour, a species-specific feature, is the more frequently reported [29].
However, there is still a lack of information on the underlying reasons for the different susceptibility to collisions among bird species. It is, therefore, necessary to change the scale of these studies to work at a species-specific level to unveil a clear relationship between predicted risk and the recorded bird mortality at wind farms [24]. Generally, studies have been carried out at a few wind farms or for a small number of species. However, to be able to make well-founded conclusions, it is necessary to carry out studies using a big dataset, including a high number of species and a large number of wind farms over a wide territory.
According to the Global Wind Energy Council data [31], Spain is the fifth-highest world producer of wind power (4.7%) after China, the USA, Germany, and India. In this study, we focused on the factors that make some species more susceptible to collisions in wind farms. We aimed to investigate in-depth, the risks linked to the species-specific factors, according to Marques et al. [29]. We have studied the dead birds who have collided with wind turbines in Castilla y León (Spain) for 16 years, with the specific aim of testing if the type of flight of the species can influence their mortality. We predicted that, especially for those flight types which are not only related with the mission of displacement, but that involve at the same time searching for food or mating, birds will be more sensitive to collisions. Finally, we try to develop a species collision risk index which can help in future modelling approaches depending on the species existing in the area.

2. Materials and Methods

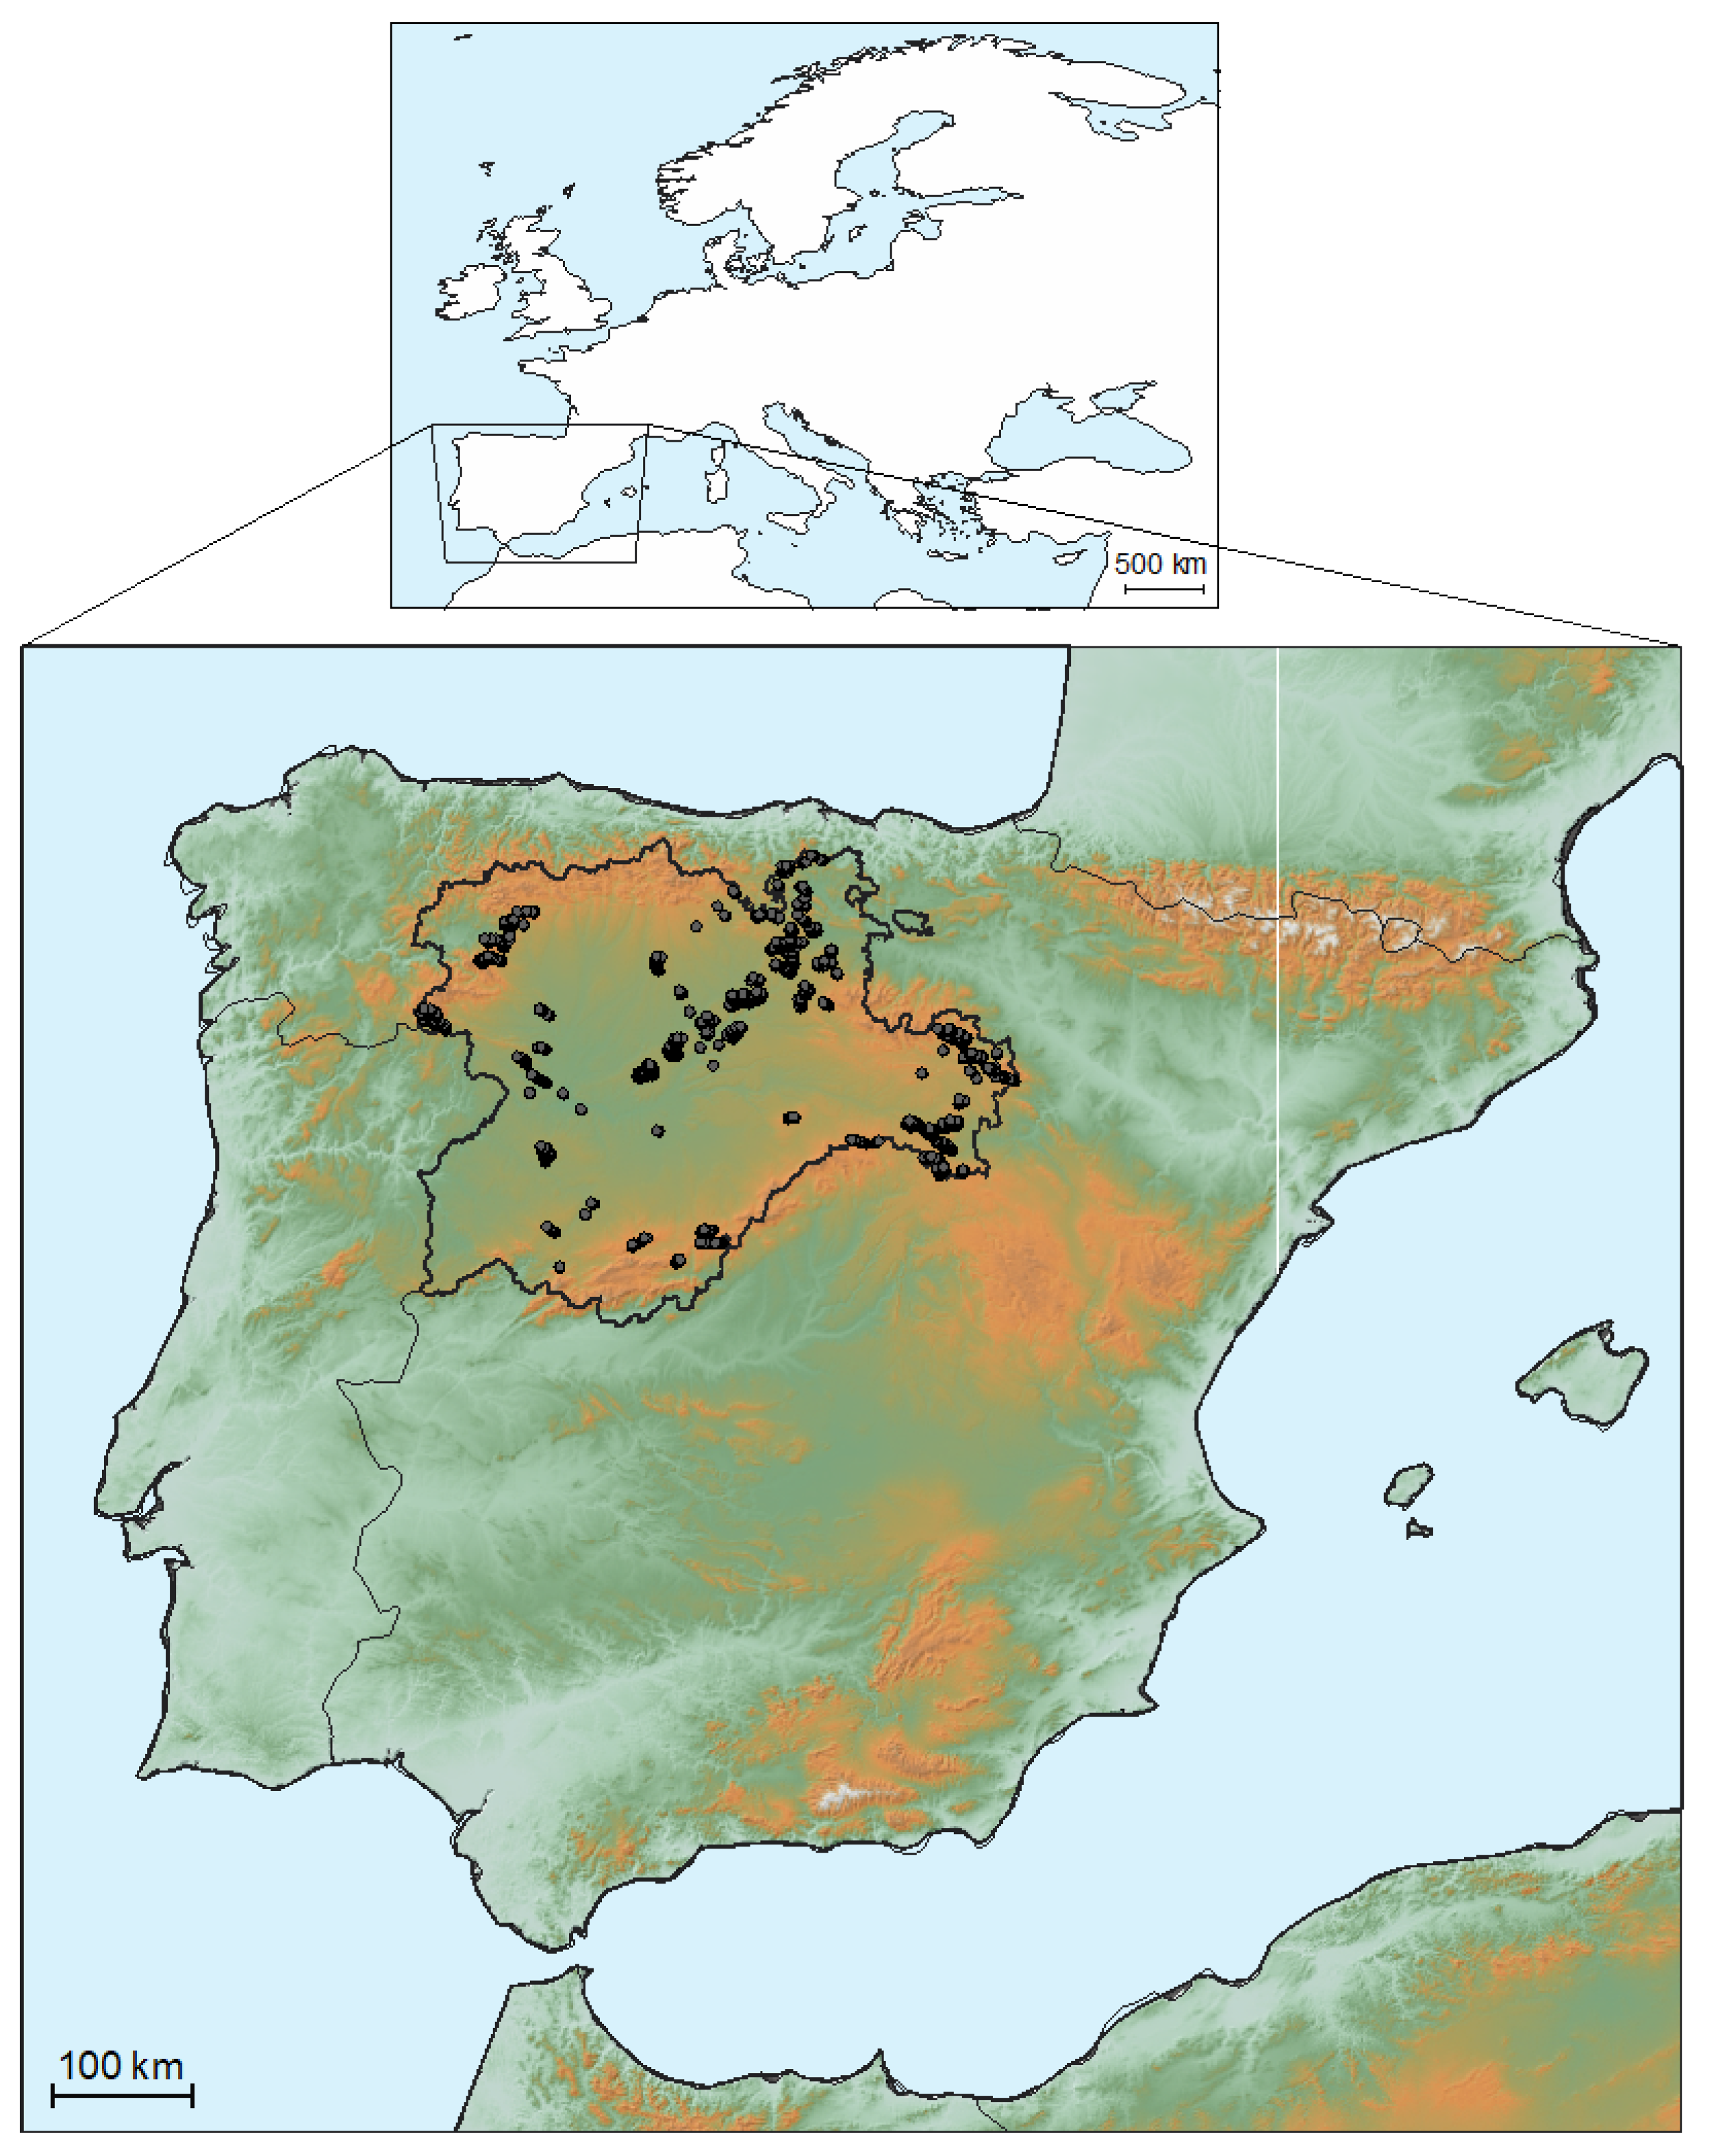
2.1. Study Area and Materials

Castilla y León is the largest region in Spain and Europe with a surface of 94,222 km2. The centre of the region is a fairly flat area (plateau), which is surrounded by mountains (Figure 1). Within Spain, the administrative division Castilla y León has 243 wind farms with an amount of 5593 MW, representing 24.2% of the installed power in Spain [32]. At the beginning of the 21st century, the wind farms were mainly installed in the mountainous areas but, thanks to technological improvement, wind farms have recently been installed on the plains in the centre of the region. Due to the change, the installed turbines now affect not only birds from mountainous areas but all bird species.
This study analysed birds which have been killed by wind turbines and been admitted to two rescue centres in Castilla y León. All the specimens were found dead under wind turbines after colliding with them in wind farms, and were collected by the companies that carry out the official monitoring and by environmental agents until their arrival at the rescue centers of the environmental department. The monitoring of bird mortality at the foot of each wind turbine was carried out along the line of the wind turbines, with an impact of 100 m. on each side and with a search effort of 20 min per wind turbine covered on foot. The precise places, the date and the state in which the remains of birds were found was noted, immediately notifying the environmental department of Junta de Castilla y León to proceed with the collection by its personnel. In addition, the coordinates of the place were taken by GPS. Once there, a veterinarian thoroughly examined the specimens and confirmed their death due to a collision with the wind turbines. For more information about the region and the organisation of wildlife rehabilitation centres in Castilla y León, see Balmori (2019) [33].
A database was prepared including the scientific name, date, group, seasonal movements, IUCN red list category, flight type, and length, as well as the number of Spanish and European population (pairs) of the dead birds arriving at these rescue centres for 16 years (2001–2016). The sex data of some specimens were also included.
Seasons were defined considering the week number of collisions; being 49–53 and 1–8 winter, 9–22 spring, 23–35 summer, 36–48 autumn. For the seasonal movement type of each species, three categories were considered: aestival, sedentary and partial migration. Aestival is a species which only remains in Europe in spring and summer, and winters south of the Sahara Desert (long-distance migrants crossing the Sahara, e.g., the Short-toed Snake Eagle Circaetus gallicus). Wintering species in the Iberian Peninsula that remain throughout all the year are considered sedentary, e.g., the Golden Eagle (Aquila chrysaetos). Pre-Saharan migrants, that usually make shorter and more variable displacements than trans-Saharan migrants, are considered partially migrants (short-distance migrants, not crossing the Sahara, e.g., the Eurasian Sparrowhawk Accipiter nisus). The Iberian Peninsula receives many European pre-Saharan migrants (partially migrants) in winter. However, there were species with several categories and, in those cases the predominant category in the Iberian Peninsula was considered, following Peterson et al. (1973) [34].
Each species was classified according to his predominant flight type, within the following categories: flapping, active soaring, passive soaring, hovering, song-flights, and high-speed. Since some species have several flight types and use different flight speeds [35], the flight type considered more typical of the species was selected. For instance, in Common Kestrel (Falco tinnunculus) the predominant flight types are flapping and hovering, but hovering was selected. Similarly, in Skylark (Alauda arvensis), the predominant flight types are flapping and songflights, but songflights was selected.
For size, the length of each species (measurement between the tip of the bill and the tip of the tail) following Mullarney et al. (2000) [36] was used. In cases where a range of lengths existed within the same species or there was a size differences between sexes, the mean value was used. For each species, the number of breeding couples from Spanish and European populations was obtained following Heath and Hagemeijer (2000) [37].

2.2. Statistical Analyses
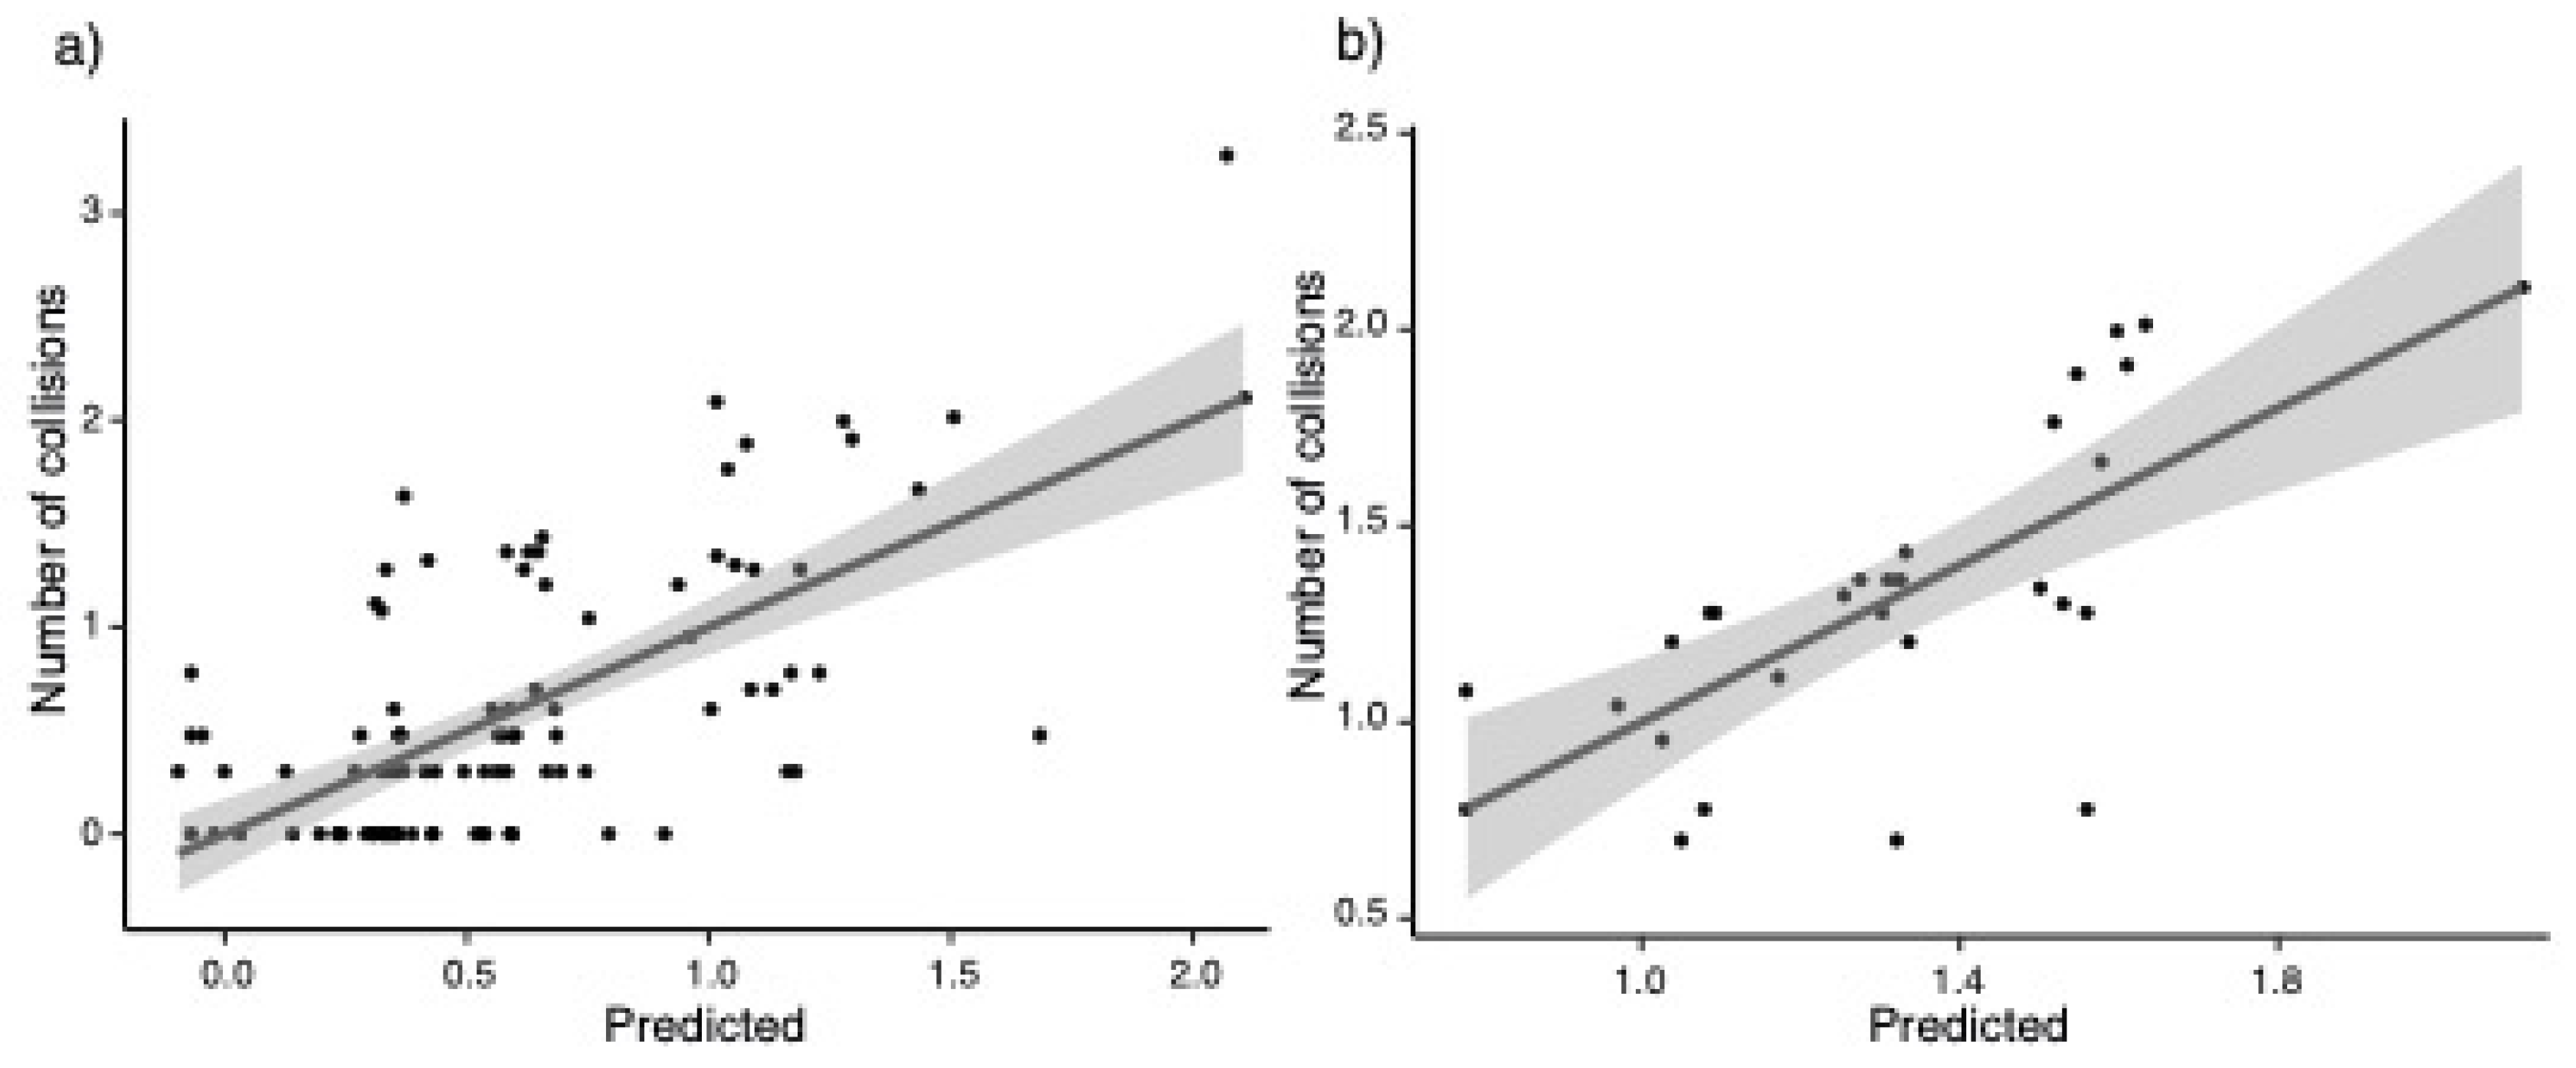
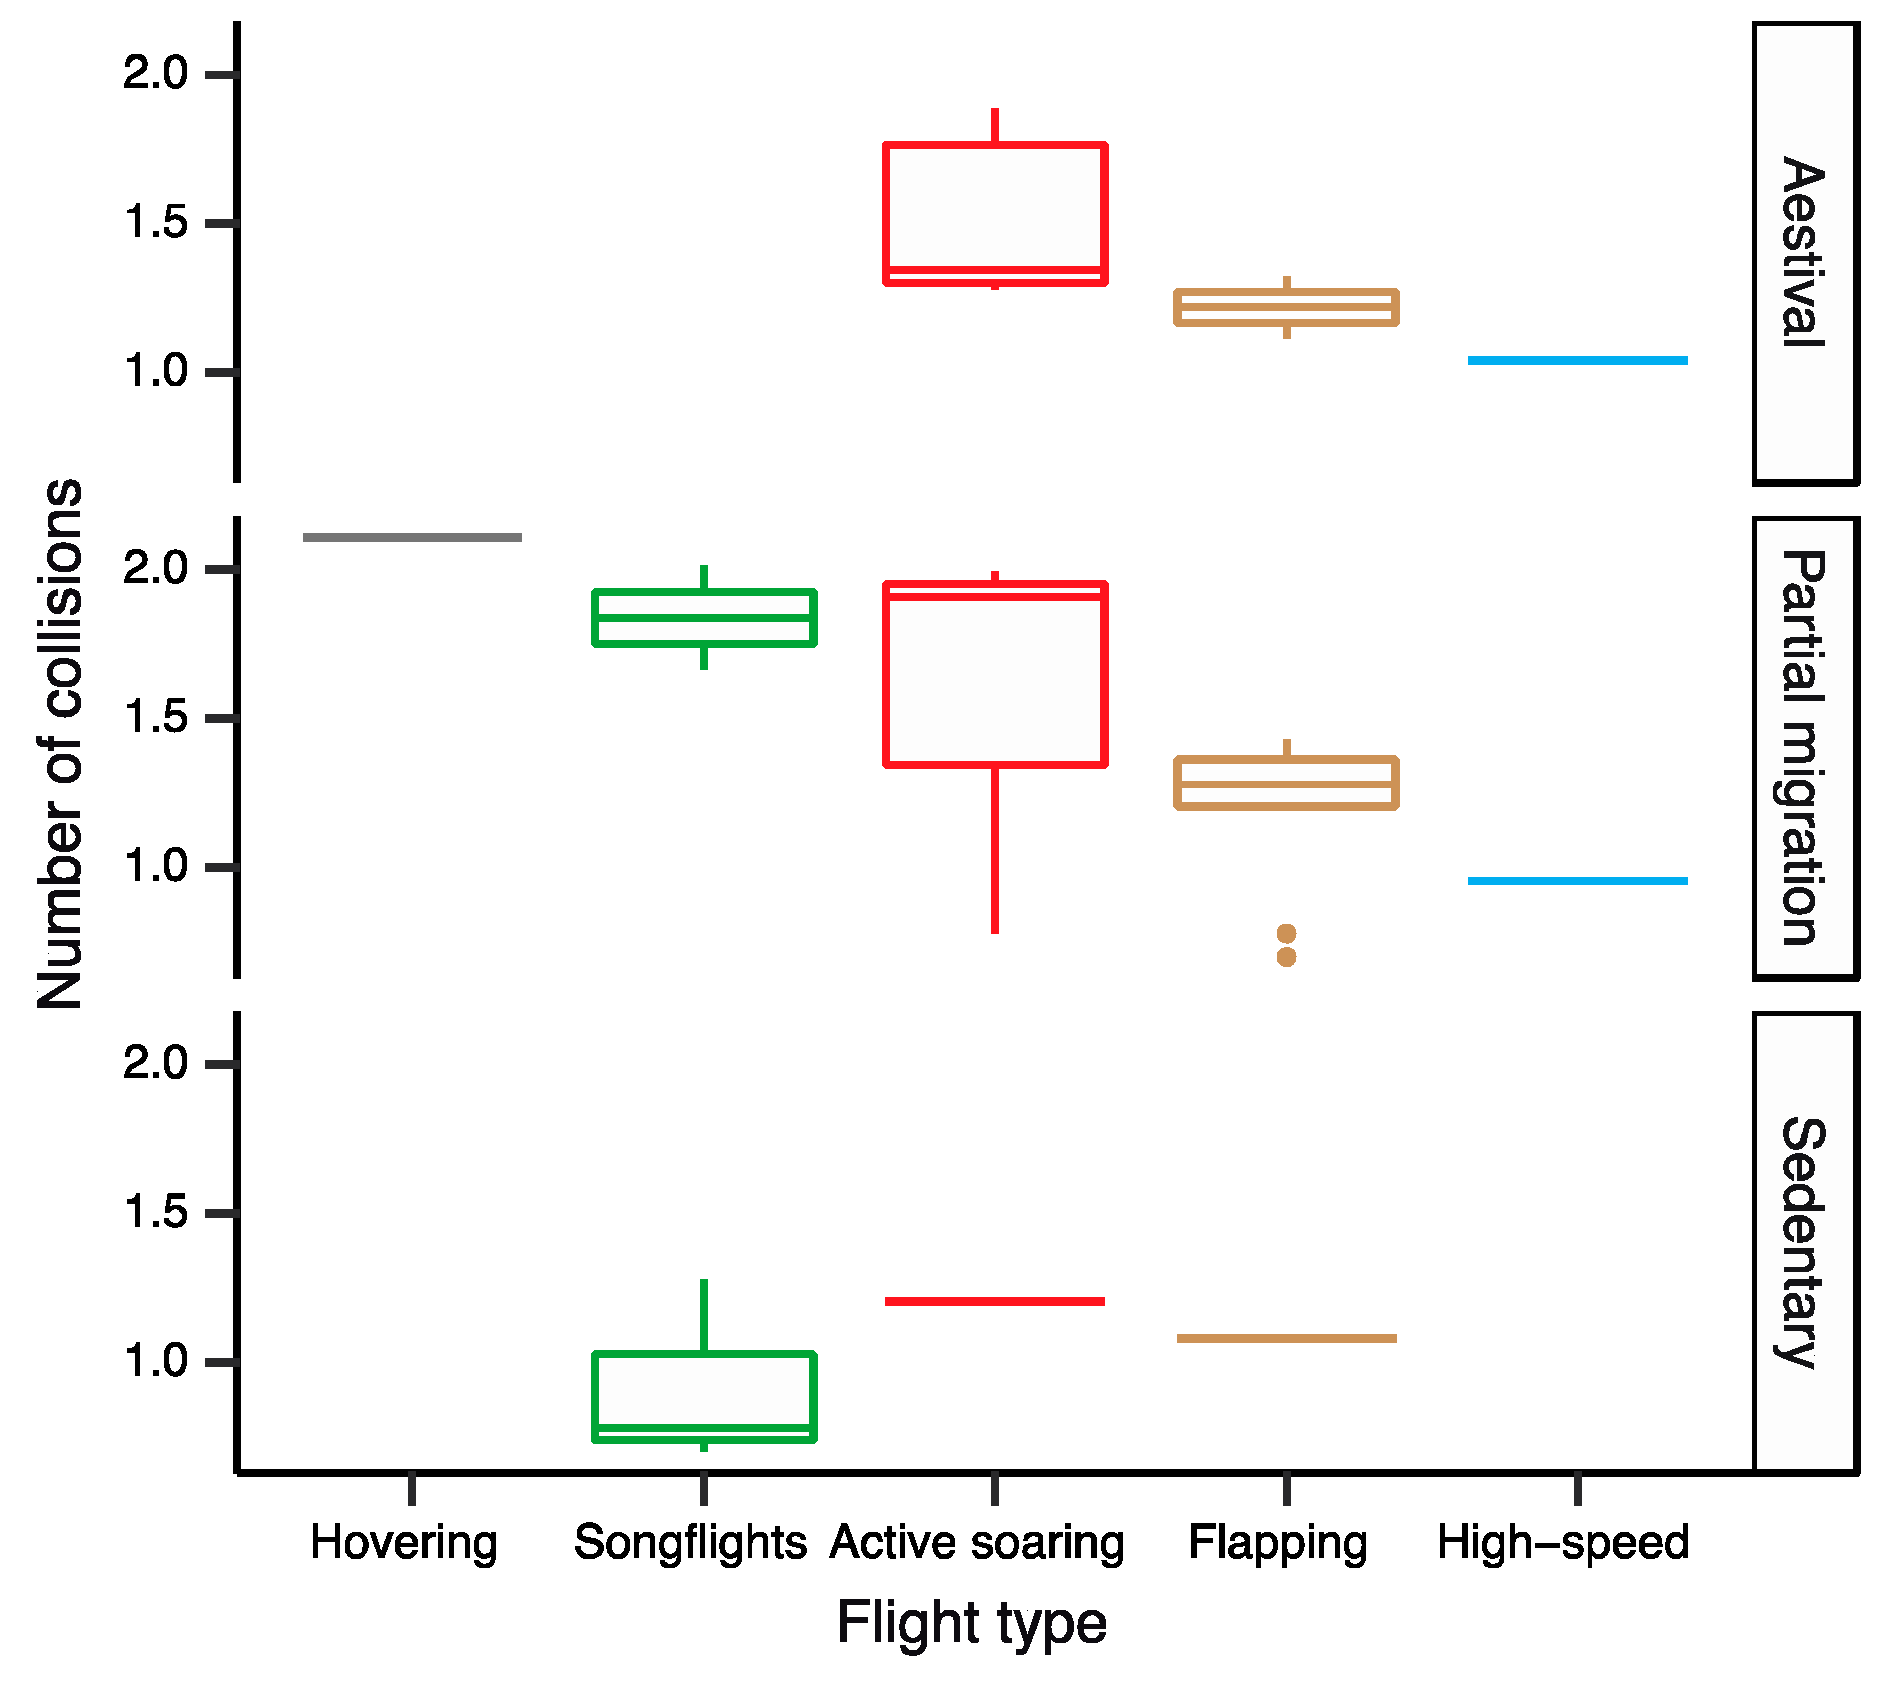
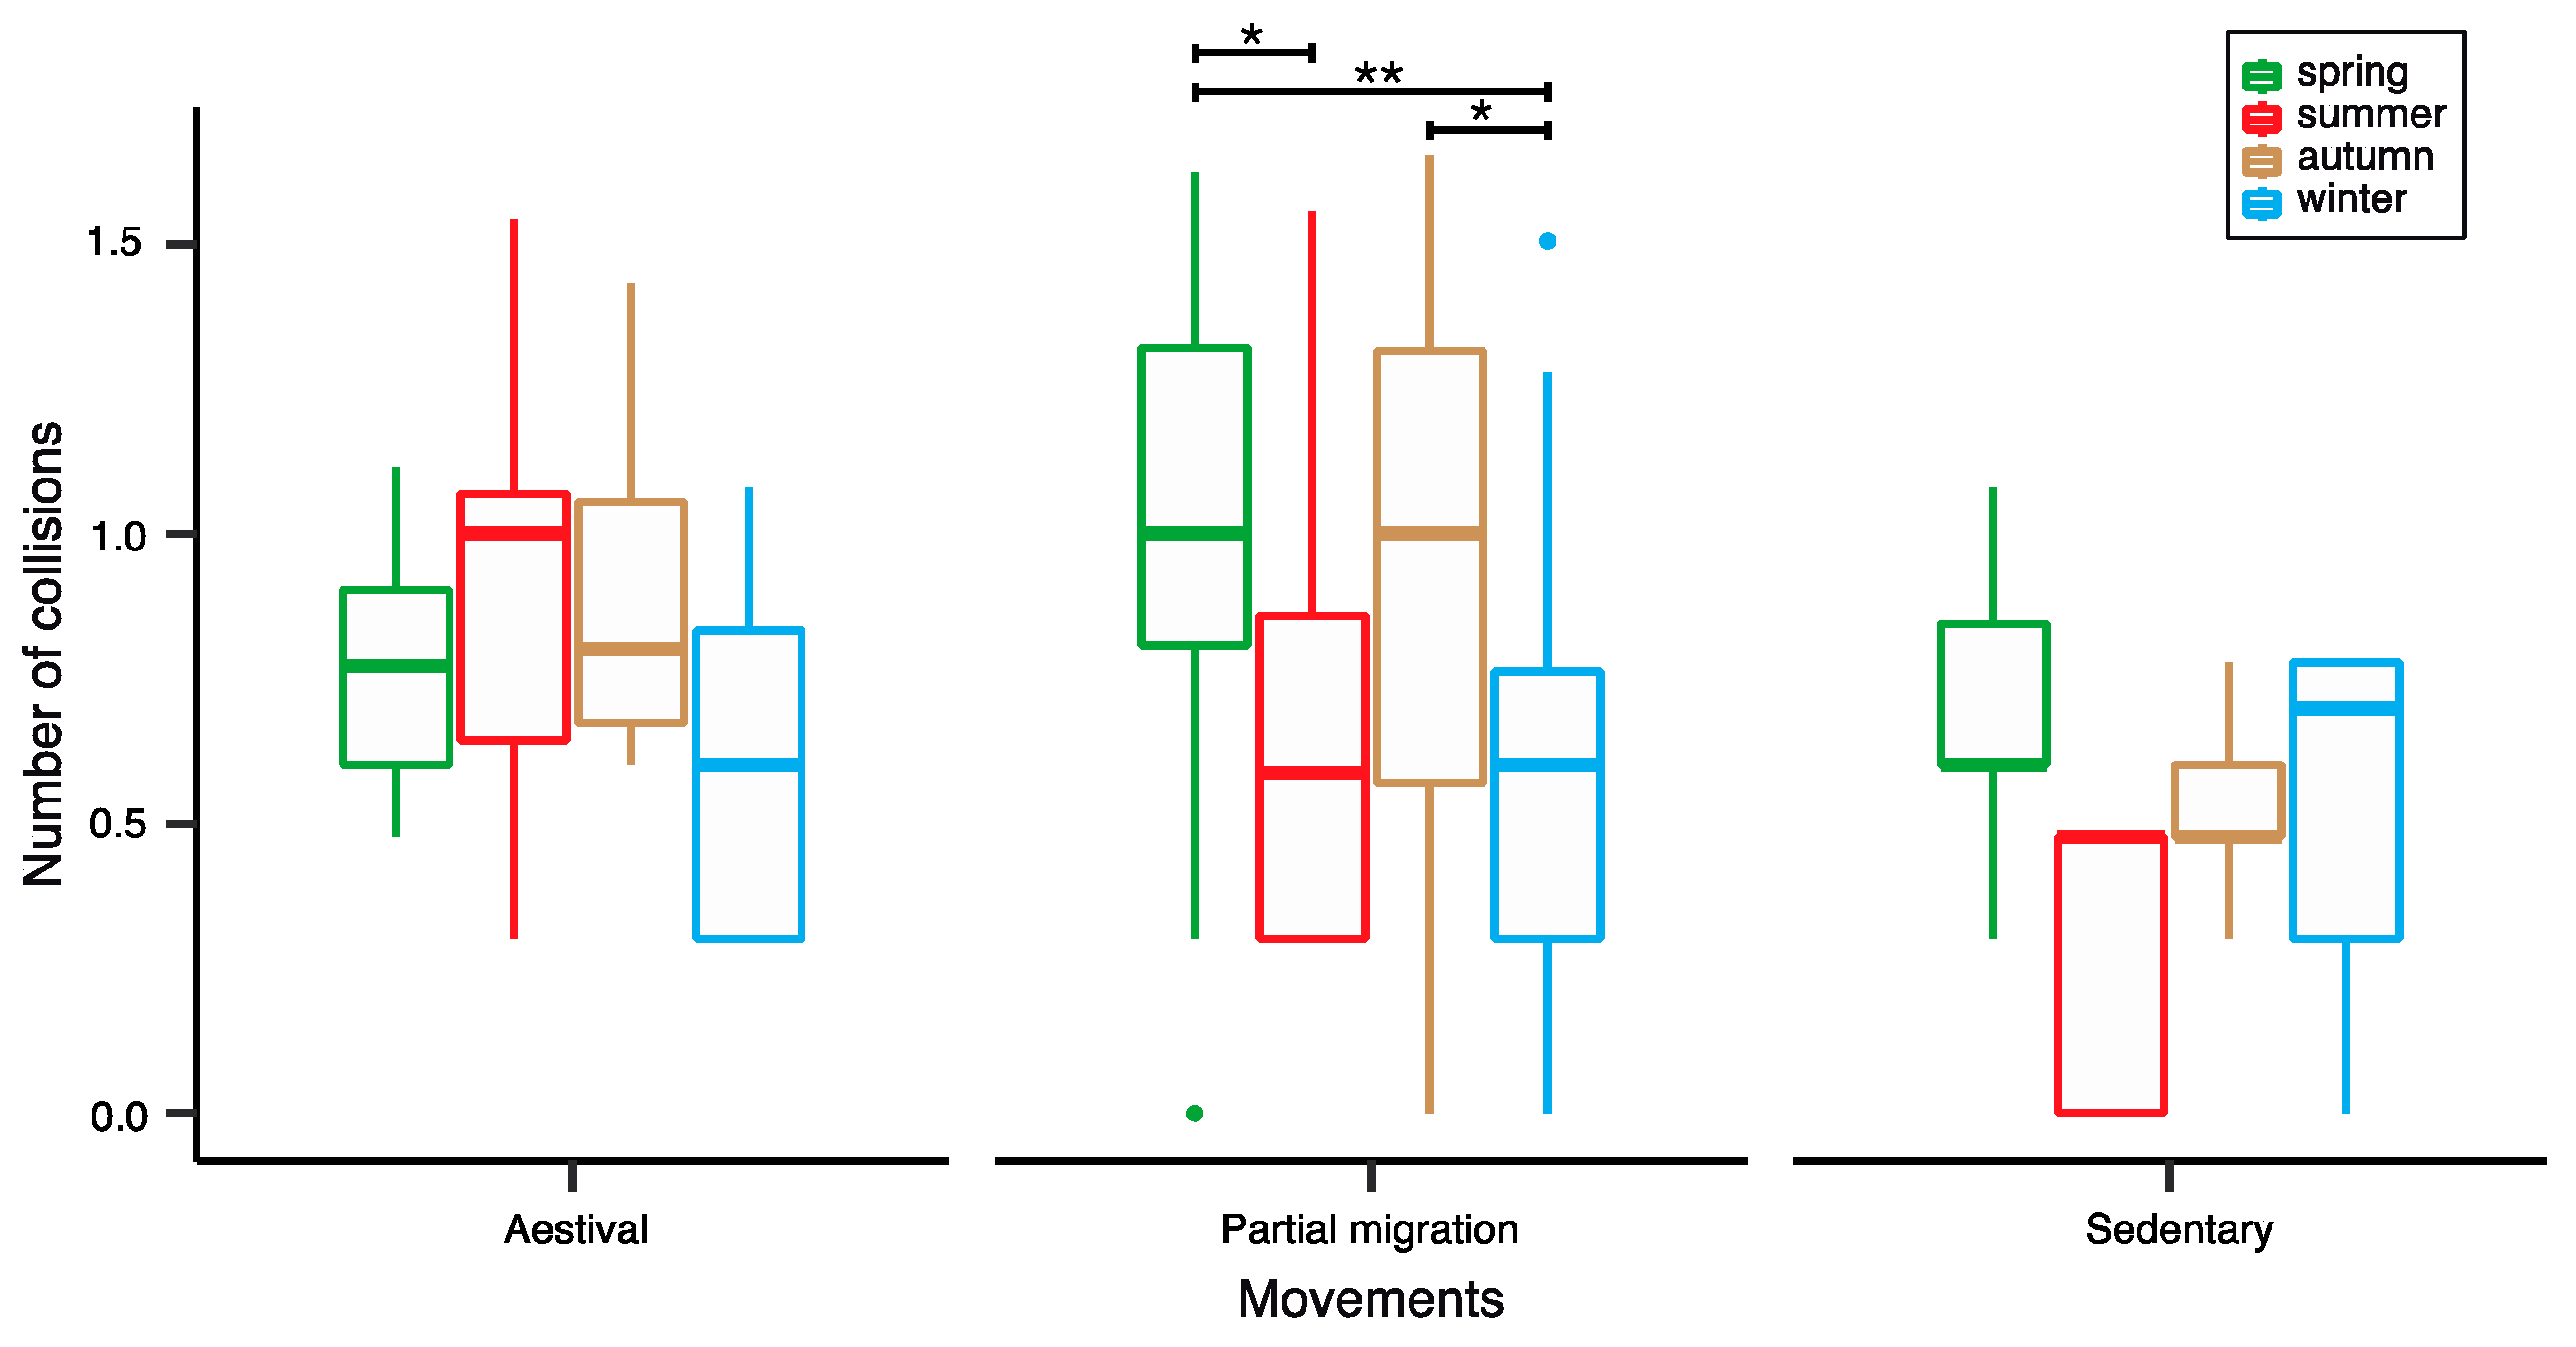
Linear models were created in order to detect factors influencing the number of collisions occurring in every species. First, a model including all species was constructed. In addition, we also fit another model using a smaller dataset in order to corroborate the most important predictors (see below and also ANOVA analyses). This second linear model included only bird of prey and passerine having more than four collisions. These groups accounted for the large majority of collisions and the purpose was determining more in-depth patterns in these cases avoiding anecdotal data. In addition, the Griffon Vulture (Gyps fulvus) was the species with the highest number of collisions (n = 1901). Due to its high number of collisions, this species was not included in the second model to avoid bias, but was considered independently. Finally, a total of 29 out of 101 species belonging to the Bird of prey and Passerine groups remained in the second model.
Quantitative variables were log10 transformed for normalizing values distributions and the test assumptions both for the linear regression (linear relationship and homoscedasticity of residuals) and the ANOVA analyses (|skeweness and kurtosis| < 1, homoscedasticity) were checked. We performed a stepwise model selection by Akaike Information Criterion (AIC) in R software [38], including the following variables, without considering interactions: taxonomic order or group (for detecting potential phylogenetic influence), seasonal movements, flight type, length, and the number of couples for the Spanish and European populations. Sex was not included in the model due to the few sexed specimens. The stepwise algorithm search was performed in both directions (backward and forward) and the model selected only relevant predictors to estimate the number of collisions. Once we knew the important predictors, the coefficients and the percent of variance explained by each relevant variable were determined by the linear model, and real values were compared with predicted values to visualize the goodness of fit. The functions were applied to the species used to construct the model. Based on the result of the model including all the species, we obtained a species collision risk index.
A two-way ANOVA was also performed with the two more important predictors selected by the model. Furthermore, repeated-measures ANOVA was carried out to study the collision seasonality and to relate it to the seasonal movement type of the different species.

3. Results

During the 16 years of the study period, a total of 3130 specimens belonging to 101 bird species died by collisions with wind turbines in Castilla y León. The total number of collisions and their seasonality along with the other data for each species are included in Table 1.
First, a model including all the species registered was adjusted and a total of three of the studied variables were included by AIC in the stepwise regression. Flight type was the most important variable, explaining 35% of the total variability, followed by seasonal movement type (4%) and the Spanish population (4%). The function: “Predicted number of collisions (log 10) = 0.31 + 0.28 * Flight type_Active soaring-0.67 * Flight type_Flapping + 1.01 * Flight type_Hovering + 1.03 * Flight type_Passive soaring + 0.16 * Flight type _Songflights + 0.06 * Movements_Aestival + 0.29 * Movements_Partial migration + 0.11 * Spanish population (log10 + 1)”, was applied to the whole dataset of 101 species in order to estimate the predicted number of collisions. For instance, if we consider the Wood Lark (Lullula arborea) case (with Sonflights, Partial migration and a Spanish population of 900,000 individuals), the Predicted number (log10) = 0.31 + 0.16 (Flight type_Songflights) + 0.29 (Movements_Partial migration) + 0.11 * log10 (900,000 + 1) (Spanish population) will result in a log10 value of 1.41 (that is, 26 individuals; note that the slight difference with table values is due to decimal rounding performed in the model coefficients). The model (R2 = 0.43; p < 0.001) predicted the real number of collisions for all the species quite accurately (Figure 2a). Further, we have developed a species collision risk index based on the result of the model including all the species (predicted value, Table 1).
The same three variables were included by AIC in the stepwise regression in the second model adjusted with the reduced dataset. Flight type was the most important variable, explaining 29% of the total variability, followed by seasonal movement type (17%) and the Spanish population (6%). The function: “Predicted number of collisions (log 10) = 0.23 + 0.54 * Flight type_Active soaring + 0.03 * Flight type_Flapping + 0.98 * Flight type_Hovering + 0.32 * Flight type _Songflights + 0.45 * Movements_Aestival + 0.52 * Movements_Partial migration + 0.09 * Spanish population (log10 + 1)”, was applied to the 29 species used to construct the model. The model (R2 = 0.52; p = 0.017) predicted the real number of collisions for the reduced subset of species used to construct the model quite accurately (Figure 2b).
The two-way ANOVA performed with the two most important predictors included in the regression model (flight type and seasonal movement type) for the 29 selected species showed differences between the flight types (F value = 3.177, df = 4, p = 0.039), supporting the importance of this predictor on the probability of collisions with wind turbines. Tukey post-hoc pairwise comparisons did not reveal meaningful differences between specific groups due to the fact that the p-value is adjusted for multiple comparisons. Low sample sizes in the different groups might have also affected the power of the tests. However, the model suggested that species with hovering, song-flight and active soaring flight types were most affected by collisions, while flapping and high-speed species showed a lower number of collisions (Figure 3).
The repeated measures ANOVA for the 29 selected species to study the relationship between collision seasonality and seasonal movement type, showed that some seasons have a greater amount of collision than others (F value = 8.730, df = 3, p < 0.001) and that collisions in every season interact to some extent with the seasonal movement type (F value = 2.431, df = 6, p = 0.033) following predictions (Figure 4). Tukey contrasts revealed that species showing partial migration have a significant peak of collisions across spring and autumn. Finally, the results also indicated that sedentary species collide much less in summer compare to the former and suggested that aestival species have the most collisions during summer and autumn.
The sex was obtained for only a very few specimens, and was not included in the model. However, it is interesting to note that for Skylarks, a bird with song-flight, the five sexed specimens available were all males (n = 103 collided). In the rest of species with sex information, no differences between sexes were detected.

4. Discussion

The most important species-specific factors influencing the probability of colliding with wind turbines appear to be the flight type, which influenced the vulnerability of each species, and the seasonal movements, which influenced the period of accidents. The abundance of each species also influenced the number of collisions but to a lesser extent. We have developed a species collision risk index based on the result of the model including all the species and tested it against observed data showing an acceptable fit.
The large dataset of birds available in this study has allowed us to investigate the main species-specific factors according to Marques et al. (2014) [29] influencing the risk for collisions with wind turbines. Since Castilla y León is a large region, this makes it an ideal place to investigate this aspect, which is not possible in studies with a narrower spatial scope.
It is important to note that other species from monospecific families removed from the reduced dataset to avoid statistical noise also suffer a high number of collisions, for example Swifts (Apus apus) (n = 123) and Partridges (Alectoris rufa) (n = 43). The flight height of the swifts searching for aeroplankton possibly influences these results. The importance of the flight height of the species has also been demonstrated in other works [35]. Bat mortality at wind turbines may also be linked to high-altitude feeding on migrating insects that accumulate at the turbine towers [39]. In studies carried out with marine species, it has been shown that, in addition to low maneuverability, fast flight is also an important risk factor [14]. The reasons for the high vulnerability of Partridges should be studied more deeply but its high population size and habitat preferences may contribute to this vulnerability.

4.1. Flight Type

According to the results of this study, flight type is the most important factor in determining the probability of a bird to collide. For instance, species with hovering, song-flights and active soaring flight types are more susceptible to collisions with wind farms, although differences between species depending on their seasonal movements also could be found. For partially migrating species, the three flight types mentioned showed a higher risk of collision with wind turbines. For aestival species, active soaring is the flight type with a higher risk.
Flight type, when associated with hunting and foraging strategies, seems to play an important role in collision risk with wind turbines [29]. Certain flight types, like soaring and hovering, are more suitable for looking for food. Hunting raptors, when they are on the lookout for prey, do not perceive the risk and, hence, collide [29]. On the other hand, the song-flight type is done to attract females. According to the results of this study, when the bird focuses his attention on foraging or partner attraction, collisions are more likely to occur.

4.2. Seasonality

The patterns of risky flights have a temporal component and the deaths are concentrated in specific seasons [40]. In this study, considering the evolution of impacts through the year, it is remarkable that spring and autumn are the seasons with the most collisions. We have shown that aestival species have the most collisions during summer and autumn, while partial migration species have the peak of collisions across spring and autumn. This result is expected as a consequence of the movements performed by many migratory species, and is also found in other studies [28,41,42,43]. The location of wind farms in migration areas may cause higher mortality rates [44,45], and passerine species appear to be at the greatest risk of colliding during spring and autumn migrations [28]. The rapid expansion of wind farms in northern Spain urgently requires preventive measures to protect migratory species in particular [45].
It has been suggested that, due to their knowledge of the terrain, resident birds would be less prone to collision with structures [7]. However, comparable data on collision rates for resident birds is lacking [29]. According to the results of this study, sedentary species collide mostly in spring and winter, possibly because they make more movements in these periods, although to a lesser degree than migratory species. In some studies, resident populations have more collisions than migratory species [41], but this is probably due to the bias produced by a large number of collisions of a single species. For instance, the Griffon Vulture (although in this study is considered a partial migratory species and is removed from the reduced dataset) accounted for most of the collisions.

4.3. Species and Group

Raptors are considered the most vulnerable bird species for collisions in wind farms [28,36,41,46]. However, according to the result of this study, the bird group (passerines, raptors, etc.) does not play an important role regarding the collision risk with wind turbines.
In this work, the Griffon Vulture was the most affected species. The high susceptibility of Griffon Vultures to wind farms has already been described in other works [41,46], and their vulnerability may be a result of its flight pattern, the search for food in flight, and its large size and reduced maneuverability [44]. Therefore, this species may be causing a bias in the studies done so far by increasing the mortality of raptors by a single species. Griffon Vulture collisions occur throughout the year, but especially in spring and autumn. The increase in collisions in these periods can be explained by the increase of movements during the breeding season, a possible increased need to search for food, and immature bird dispersal in autumn.
Another species highly susceptible to collisions are the Kestrels, and this happens with both American (Falco sparverius) [28], and European species, Common Kestrel (Falco tinnunculus) [40]. Its hovering flight and concentration on prey probably influence its high mortality [29], as already discussed.
As we have pointed out, the models in this study quite accurately predicted the real number of collisions for the total number of species, and for the reduced subset of species studied. Analyses performed in this study show essential factors that should be taken into account when developing environmental impact studies associated with wind farms. Specific measures towards the identification of more vulnerable species, particularly those with higher predicted values, could help in choosing the location for wind turbines or restrict their activity the months of the year in which the largest amount of collisions occur. These actions could decrease the number of collisions for species most affected by wind farms.
Taking into account the IUCN Red List of Threatened Species, and with the results predicted by the model, the endangered species most at risk for collisions are: Cinereous Vulture (Aegypius monachus), Red Kite (Milvus milvus) (both near threatened according to IUCN), and Egyptian Vulture (Neophron percnopterus) (endangered).

4.4. Abundance and Size

Another factor traditionally considered important for the number of collisions, is the abundance of the species, although, as has been verified in this study, flight-related factors are more important than abundance [29]. Collision fatality of raptors in wind farms does not depend on their abundance [46]. In our models, the number of couples from the Spanish population explained 4% of the variability whereas the European population was not relevant. This factor can help explain the high mortality for the Griffon Vulture and the Common Kestrel, since these species represent large populations with a complete distribution on the Iberian Peninsula. Additionally, in Castilla y León, there are colonies of Griffon Vulture in several of the canyons on the main rivers, and the presence of nearby colonies is a risk factor as has been shown with Seagulls [41] and Lesser Kestrels [47].
According to the results of the model in this study, size does not seem to be an important explanatory factor on bird collisions and these results go against the knowledge that exists so far [29]. As discussed before, it could be that the griffon vulture has produced a bias due to the large number of collisions and its big size.

4.5. Sex

A sex bias on wind collision has already been found in previous works [29]. In a study from Portugal, the 22 Skylark carcasses collected revealed a higher incidence of adult males (90%), suggesting the occurrence of a sex differential mortality [48]. The carcasses were mainly found between April and May, within the breeding season, when Skylark males perform their characteristic song-flights. In this study, the Skylark was a species that collided frequently (n = 103), and had one of the highest predicted values in the model (32.1). Also, from five sexed specimens in this study, all were males. On the other hand, sex-biased collision mortality in Common Terns (Sterna hirundo) reflects differences in foraging frequency between males and females during egg-laying and incubation [49].

4.6. Modelling Approaches to Quantify the Theoretical Risk of Collision in Wind Farms and Ways to Avoid it

The results of this study can help in future modelling approaches by providing improvements in knowledge of factors influencing collision and quantifying the theoretical risk of collision in wind farms depending on the species existing in the area and their predicted values linked to flight types and seasonal movements. For many years, modelling approaches to quantify the theoretical risk for collision have been developed [31,35]. The Band model, a valuable tool for impact assessment, is widespread in the UK [50]. However, birds’ behaviour is poorly understood and this can have a large effect on the model outputs [35].
There are good technical documents that could help for the adoption of measures to avoid damage to wildlife at wind farms [5,29,51,52,53]. The location of wind farms is still the most effective measure to avoid bird fatalities [29,54,55,56]. Unlike other non-natural causes of bird mortality, wind farm fatalities can be lowered by powering down or removing risky turbines and by placing them outside critical areas for endangered birds [6]. The spatial distribution and aggregation of some threatened species should be used as criteria for environmental planning [23]. The use of selective stopping techniques for turbines with the highest mortality rates can help to mitigate the impacts of wind farms on birds, with a minimal effect on energy production [22].

4.7. Limitations of this Study

In the human dimension of finding, catching and transporting dead birds to a rescue centre there are some assumptions necessary to let the database reflect true turbine mortality. The dead-injured ratio, the ability of an injured bird to draw attention to people, the abundance of people in the neighborhood of windfarms and the abundance of local predators might negatively affect injured numbers and biases from such data can affect the results in different ways [57]. These problems can happen especially for the small species that may have high numbers not reported or not found. On the other hand, species may be more prone to occur in some areas than others, so site-specific (orientation, location etc.) and wind farms features, are also important explanatory factors when investigating the causes of collisions with wind turbines that have not been analysed in this work [58].
The collisions with wind farms may also be influenced by behaviour associated with a specific age [29]. In this work, it has not been possible to verify the importance of age in collisions due to the absence of this data, but we predict that young birds are more vulnerable due to lack of experience and knowledge of the territory.
The dataset used for this work was a small part of the animals that die in the field, since many of them may not be found [59], or due to detection bias and loss of carcasses from scavenging [60]. On the other hand, it is possible that some specimens have arrived at the rescue centres a few weeks after the collision has occurred, although such cases should be anecdotal and should not have influenced the seasonally patterns observed. Finally, the population data to estimate the abundance of the different species in this study is the number of breeding couples [40]. However, there are species that winter but do not breed in the Iberian Peninsula, and in these cases its reproductive population is zero couples.

5. Conclusions

Flight type and seasonal movements explain the accidents in wind farms in a relevant way. The flight type influences the vulnerability of each species, and the seasonal movements influence the period of accidents. The abundance of each species also influences the number of collisions but to a lesser extent. Species with hovering, song-flights and active soaring flights are more susceptible to collisions with wind farms, although differences between species could also be found based on their seasonal movements. According to the results of this study, for the flight types in which the bird focuses his attention to foraging or partner attraction, collisions are more likely to occur. The results of this study can help in modelling the theoretical risk of collision with wind turbines, depending on the species existing in the area and their predicted values of vulnerability, which is linked to flight types and seasonal movements, in a similar way to that already proposed in previous studies [61].

Author Contributions

Conceptualization, A.B.-d.l.P. and A.B.; Methodology, A.B.-d.l.P. and A.B.; Software, A.B.-d.l.P.; Validation, A.B.-d.l.P. and A.B.; Formal analysis, A.B.-d.l.P.; Investigation, A.B.-d.l.P. and A.B.; Resources, A.B.; Data curation, A.B.-d.l.P. and A.B.; Writing—original draft, A.B.-d.l.P. and A.B.; Writing—review & editing, A.B.-d.l.P. and A.B.; Visualization, A.B.-d.l.P. and A.B.; Supervision, A.B.-d.l.P. and A.B. All authors have read and agreed to the published version of the manuscript.

Funding

This research received no external funding.

Institutional Review Board Statement

Not applicable.

Data Availability Statement

Data is unavailable due to privacy or ethical restrictions.

Acknowledgments

The environmental department of Junta de Castilla y León provided the information for this work through a formal request.

Conflicts of Interest

The authors declare no conflict of interest.

References

  1. Hoffmann, M.; Hilton-Taylor, C.; Angulo, A.; Böhm, M.; Brooks, T.M.; Butchart, S.H.M.; Carpenter, K.E.; Chanson, J.; Collen, B.; Cox, N.A.; et al. The Impact of Conservation on the Status of the World’s Vertebrates. Science 2010, 330, 1503–1509. [Google Scholar] [CrossRef] [PubMed]
  2. Sodhi, N.S.; Ehrlich, P.R. (Eds.) Conservation Biology for All; Oxford University Press: Oxford, UK, 2010. [Google Scholar]
  3. Loss, S.R.; Will, T.; Marra, P.P. Direct human-caused mortality of birds: Improving quantification of magnitude and assessment of population impact. Front. Ecol. Environ. 2012, 10, 357–364. [Google Scholar] [CrossRef]
  4. Stewart, G.B.; Pullin, A.S.; Coles, C.F. Poor evidence-base for assessment of wind farm impacts on birds. Environ. Conserv. 2007, 34, 1–11. [Google Scholar] [CrossRef]
  5. Thaxter, C.B.; Buchanan, G.M.; Carr, J.; Butchart, S.H.; Newbold, T.; Green, R.E.; Tobias, J.A.; Foden, W.B.; O’Brien, S.; Pearce-Higgins, J.W. Bird and bat species’ global vulnerability to collision mortality at wind farms revealed through a trait-based assessment. Proc. R. Soc. B 2017, 284, 20170829. [Google Scholar] [CrossRef]
  6. Carrete, M.; Sánchez-Zapata, J.A.; Benítez, J.R.; Lobón, M.; Donázar, J.A. Large scale risk-assessment of wind-farms on population viability of a globally endangered long-lived raptor. Biol. Conserv. 2009, 142, 2954–2961. [Google Scholar] [CrossRef]
  7. Drewitt, A.L.; Langston, R.H.W. Assessing the impacts of wind farms on birds. IBIS 2006, 148, 29–42. [Google Scholar] [CrossRef]
  8. Farfán, M.A.; Vargas, J.M.; Duarte, J.D.; Real, R. What is the impact of wind farms on birds? A case of study in southern Spain. Biodivers. Conserv. 2009, 18, 3743–3758. [Google Scholar] [CrossRef]
  9. Tellería, J.L. Wind power plants and the conservation of birds and bats in Spain: A geographical assessment. Biodivers. Conserv. 2008, 18, 1781–1791. [Google Scholar] [CrossRef]
  10. Saidur, R.; Rahim, N.A.; Islam, M.R.; Solangi, K.H. Environmental impact of wind energy. Renew. Sustain. Energy Rev. 2011, 15, 2423–2430. [Google Scholar] [CrossRef]
  11. Williams, D.R.; Child, M.F.; Dicks, L.V.; Ockendon, N.; Pople, R.G.; Showler, D.A.; Walsh, J.C.; Ermgassen, E.K.H.J.; Sutherland, W.J. Bird Conservation. In What Works in Conservation 2019; Sutherland, W., Dicks, L., Ockendon, N., Petrovan, S., Eds.; Open Book Publishers: Cambridge, UK, 2019; pp. 141–290. [Google Scholar]
  12. Serrano, D.; Margalida, A.; Pérez-García, J.M.; Juste, J.; Traba, J.; Valera, F.; Carrete, M.; Aihartza, J.; Real, J.; Mañosa, S.; et al. Renewables in Spain threaten biodiversity. Science 2020, 370, 1282–1283. [Google Scholar] [CrossRef]
  13. Chamberlain, D.E.; Rehfisch, M.R.; Fox, A.D.; Desholm, M.; Anthony, S.J. The effect of avoidance rates on bird mortality predictions made by wind turbine collision risk models. IBIS 2006, 148, 198–202. [Google Scholar] [CrossRef]
  14. Larsen, J.K.; Guillemette, M. Effects of wind turbines on flight behaviour of wintering common eiders: Implications for habitat use and collision risk. J. Appl. Ecol. 2007, 44, 516–522. [Google Scholar] [CrossRef]
  15. Marques, A.T.; Santos, C.D.; Hanssen, F.; Muñoz, A.R.; Onrubia, A.; Wikelski, M.; Moreira, F.; Palmeirim, J.M.; Silva, J.P. Wind turbines cause functional habitat loss for migratory soaring birds. J. Anim. Ecol. 2020, 89, 93–103. [Google Scholar] [CrossRef]
  16. Marques, A.T.; Batalha, H.; Bernardino, J. Bird Displacement by Wind Turbines: Assessing Current Knowledge and Recommendations for Future Studies. Birds 2021, 2, 460–475. [Google Scholar] [CrossRef]
  17. Masden, E.; Cook, A. Avian collision risk models for wind energy impact assessments. Environ. Impact Assess. Rev. 2015, 56, 43–49. [Google Scholar] [CrossRef]
  18. Tanskanen, A. Impact on breeding birds of a semi-offshore island-based windmill park in Åland, Northern Baltic Sea. Ornis Svec. 2012, 22, 9–15. [Google Scholar] [CrossRef]
  19. Balotari-Chiebao, F.; Valkama, J.; Byholm, P. Assessing the vulnerability of breeding bird populations to onshore wind-energy developments in Finland. Ornis Fenn. 2021, 98, 59–73. [Google Scholar]
  20. Zimmerling, J.R.; Pomeroy, A.C.; D’Entremont, M.V.; Francis, C.M. Canadian Estimate of Bird Mortality Due to Collisions and Direct Habitat Loss Associated with Wind Turbine Developments. Avian Conserv. Ecol. 2013, 8, 10. [Google Scholar] [CrossRef]
  21. Dahl, E.L.; Bevanger, K.; Nygård, T.; Røskaft, E.; Stokke, B.G. Reduced breeding success in white-tailed eagles at Smøla windfarm, western Norway, is caused by mortality and displacement. Biol. Conserv. 2012, 145, 79–85. [Google Scholar] [CrossRef]
  22. De Lucas, M.; Ferrer, M.; Bechard, M.J.; Muñoz, A.R. Griffon vulture mortality at wind farms in southern Spain: Distribution of fatalities and active mitigation measures. Biol. Conserv. 2012, 147, 184–189. [Google Scholar] [CrossRef]
  23. Carrete, M.; Sánchez-Zapata, J.A.; Benítez, J.R.; Lobón, M.; Montoya, F.; Donázar, J.A. Mortality at wind-farms is positively related to large-scale distribution and aggregation in griffon vultures. Biol. Conserv. 2012, 145, 102–108. [Google Scholar] [CrossRef] [Green Version]
  24. Ferrer, M.; de Lucas, M.; Janss, G.F.E.; Casado, E.; Muñoz, A.R.; Bechard, M.J.; Calabuig, C.P. Weak relationship between risk assessment studies and recorded mortality in wind farms. J. Appl. Ecol. 2011, 49, 38–46. [Google Scholar] [CrossRef]
  25. Gómez-Catasús, J.; Garza, V.; Traba, J. Wind farms affect the occurrence, abundance and population trends of small passerine birds: The case of the Dupont’s lark. J. Appl. Ecol. 2018, 55, 2033–2042. [Google Scholar] [CrossRef]
  26. Martin, G.; Shaw, J. Bird collisions with power lines: Failing to see the way ahead? Biol. Conserv. 2010, 143, 2695–2702. [Google Scholar] [CrossRef]
  27. Fernández-López, J.; Blanco-Aguiar, J.A.; Vicente, J.; Acevedo, P. Can we model distribution of population abundance from wildlife–vehicles collision data? Ecography 2022, 2022, e06113. [Google Scholar] [CrossRef]
  28. Osborn, R.G.; Dieter, C.D.; Higgins, K.F.; Usgaard, R.E. Bird Flight Characteristics Near Wind Turbines in Minnesota. Am. Midl. Nat. 1998, 139, 29–38. [Google Scholar] [CrossRef]
  29. Marques, A.T.; Batalha, H.; Rodrigues, S.; Costa, H.; Pereira, M.J.R.; Fonseca, C.; Mascarenhas, M.; Bernardino, J. Understanding bird collisions at wind farms: An updated review on the causes and possible mitigation strategies. Biol. Conserv. 2014, 179, 40–52. [Google Scholar] [CrossRef]
  30. Smallwood, K.S.; Rugge, L.; Morrison, M.L. Influence of Behavior on Bird Mortality in Wind Energy Developments. J. Wildl. Manag. 2009, 73, 1082–1098. [Google Scholar] [CrossRef]
  31. Global Wind Energy Council Data. Available online: http://www.gwec.net/wp-content/uploads/2017/04/5_Top-10-cumulative-capacity-Dec-2016-1.jpg (accessed on 31 January 2020).
  32. AEE (Asociación Empresarial Eólica). 2017 La Voz del Sector. Available online: https://www.aeeolica.org/es/comunicacion/publicaciones-aee/anuarios (accessed on 31 January 2020).
  33. Balmori, A. Endangered bird mortality by gunshots: Still a current problem. Biodivers. Conserv. 2019, 28, 2555–2564. [Google Scholar] [CrossRef]
  34. Peterson, R.; Mountfort, G.; Hollom, P.A.D. Guía de Campo de las Aves de España y de Europa; Omega: Barcelona, Spain, 1973. [Google Scholar]
  35. Madders, M.; Whitfield, D.P. Upland raptors and the assessment of wind farm impacts. IBIS 2006, 148, 43–56. [Google Scholar] [CrossRef]
  36. Mullarney, T.; Svensson, L.; Zetterström, D.; Grant, P.J. The Complete Guide to the Birds of Europe; Harper Collins Publishers: London, UK, 2000. [Google Scholar]
  37. Heath, M.F.; Hagemeijer, W.J. European Bird Populations: Estimates and Trends; (No. 10); BirdLife International: Cambridge, UK, 2000. [Google Scholar]
  38. R Core Team. R: A Language and Environment for Statistical Computing; R Foundation for Statistical Computing: Vienna, Austria, 2018; Available online: https://www.R-project.org/ (accessed on 31 January 2020).
  39. Rydell, J.; Bach, L.; Dubourg-Savage, M.-J.; Green, M.; Rodrigues, L.; Hedenström, A. Mortality of bats at wind turbines links to nocturnal insect migration? Eur. J. Wildl. Res. 2010, 56, 823–827. [Google Scholar] [CrossRef] [Green Version]
  40. De Barrios, L.; Rodriguez, A. Behavioural and environmental correlates of soaring-bird mortality at on-shore wind turbines. J. Appl. Ecol. 2004, 41, 72–81. [Google Scholar] [CrossRef]
  41. Thaxter, C.B.; Ross-Smith, V.H.; Bouten, W.; Clark, N.A.; Conway, G.J.; Masden, E.A.; Clewley, G.D.; Barber, L.J.; Burton, N.H.K. Avian vulnerability to wind farm collision through the year: Insights from lesser black-backed gulls (Larus fuscus) tracked from multiple breeding colonies. J. Appl. Ecol. 2019, 56, 2410–2422. [Google Scholar] [CrossRef]
  42. Desholm, M. Avian sensitivity to mortality: Prioritising migratory bird species for assessment at proposed wind farms. J. Environ. Manag. 2009, 90, 2672–2679. [Google Scholar] [CrossRef]
  43. Aschwanden, J.; Stark, H.; Peter, D.; Steuri, T.; Schmid, B.; Liechti, F. Bird collisions at wind turbines in a mountainous area related to bird movement intensities measured by radar. Biol. Conserv. 2018, 220, 228–236. [Google Scholar] [CrossRef]
  44. De Kikuchi, R. Adverse impacts of wind power generation on collision behaviour of birds and anti-predator behaviour of squirrels. J. Nat. Conserv. 2008, 16, 44–55. [Google Scholar] [CrossRef]
  45. Tellería, J.L. Potential impacts of wind farms on migratory birds crossing Spain. Bird Conserv. Int. 2009, 19, 131–136. [Google Scholar] [CrossRef]
  46. De Lucas, M.; Janss, G.F.; Whitfield, D.P.; Ferrer, M. Collision fatality of raptors in wind farms does not depend on raptor abundance. J. Appl. Ecol. 2008, 45, 1695–1703. [Google Scholar] [CrossRef]
  47. Duriez, O.; Pilard, P.; Saulnier, N.; Boudarel, P.; Besnard, A. Windfarm collisions in medium-sized raptors: Even increasing populations can suffer strong demographic impacts. Anim. Conserv. 2022. [Google Scholar] [CrossRef]
  48. Morinha, F.; Travassos, P.J.; Seixas, F.; Martins, A.; Bastos, R.; Carvalho, D.; Magalhães, P.C.L.F.D.S.; Santos, M.; Bastos, E.; Cabral, J. Differential mortality of birds killed at wind farms in Northern Portugal. Bird Study 2014, 61, 255–259. [Google Scholar] [CrossRef]
  49. Stienen, E.W.M.; Courtens, W.; Everaert, J.; Van De Walle, M. Sex-Biased Mortality of Common Terns in Wind Farm Collisions. Condor 2008, 110, 154–157. [Google Scholar] [CrossRef] [Green Version]
  50. Band, W.; Madders, M.; Whitfield, D.P. Developing field and analytical methods to assess avian collision risk at wind farms. In Birds and Wind Power; De Lucas, M., Janss, G., Ferrer, M., Eds.; Lynx Edicions: Barcelona, Spain, 2005. [Google Scholar]
  51. Kunz, T.H.; Arnett, E.B.; Cooper, B.M.; Erickson, W.P.; Larkin, R.P.; Mabee, T.; Morrison, M.L.; Strickland, M.D.; Szewczak, J.M. Assessing impacts of wind-energy development on nocturnally active birds and bats: A guidance document. J. Wildl. Manag. 2007, 71, 2449–2483. [Google Scholar] [CrossRef]
  52. Atienza, J.C.; Martín, I.; Infante, O.; Valls, J.; Domínguez, J. Directrices para la Evaluación del Impacto de los Parques Eólicos en aves y Murciélagos (Versión 3.0); SEO/BirdLife: Madrid, Spain, 2012. [Google Scholar]
  53. González, F.; Alcalde, J.T.; Ibáñez, C. Directrices Básicas para el Estudio del Impacto de Instalaciones Eólicas Sobre Poblaciones de Murciélagos en España; SECEMU: Barbastella, Spain, 2013; Volume 6, pp. 1–31. [Google Scholar]
  54. Tikkanen, H.; Balotari-Chiebao, F.; Laaksonen, T.; Pakanen, V.M.; Rytkönen, S. Habitat use of flying subadult White-tailed Eagles (Haliaeetus albicilla): Implications for land use and wind power plant planning. Ornis Fenn. 2018, 95, 137–150. [Google Scholar]
  55. Tikkanen, H.; Rytkönen, S.; Karlin, O.-P.; Ollila, T.; Pakanen, V.-M.; Tuohimaa, H.; Orell, M. Modelling golden eagle habitat selection and flight activity in their home ranges for safer wind farm planning. Environ. Impact Assess. Rev. 2018, 71, 120–131. [Google Scholar] [CrossRef]
  56. Loss, S.R.; Will, T.; Marra, P.P. Estimates of bird collision mortality at wind facilities in the contiguous United States. Biol. Conserv. 2013, 168, 201–209. [Google Scholar] [CrossRef]
  57. Rodríguez, B.; Rodríguez, A.; Siverio, F.; Siverio, M. Causes of Raptor Admissions to a Wildlife Rehabilitation Center in Tenerife (Canary Islands). J. Raptor Res. 2010, 44, 30–39. [Google Scholar] [CrossRef]
  58. Schuster, E.; Bulling, L.; Köppel, J. Consolidating the State of Knowledge: A Synoptical Review of Wind Energy’s Wildlife Effects. Environ. Manag. 2015, 56, 300–331. [Google Scholar] [CrossRef]
  59. Del Valle, J.D.; Peralta, F.C.; Arjona, M.I.J. Factors affecting carcass detection at wind farms using dogs and human searchers. J. Appl. Ecol. 2020, 57, 1926–1935. [Google Scholar] [CrossRef]
  60. Erickson, W.P.; Wolfe, M.M.; Bay, K.J.; Johnson, U.H.; Gehring, J.L. A Comprehensive Analysis of Small-Passerine Fatalities from Collision with Turbines at Wind Energy Facilities. PLoS ONE 2014, 9, e107491. [Google Scholar] [CrossRef]
  61. Soares, M.; Bernardino, J.; Nogueira, A.J.A.; Bispo, R. An avian relative fatality risk index for Iberian species on wind farms based on zero inflated count models. Bachelor’s Degree Thesis, University of Aveiro, Aveiro, Portugal, 2014; pp. 21–42. [Google Scholar]
Figure 1. Zoom-in to the Iberian Peninsula showing the country borders and the administrative division Castilla y león (Spain) in the center of the region. The dots represent the indicative distribution of wind turbines (4291) installed at the end of this study. The map was generated using QGIS 3.16 in WGS 84 reference system (top) and ETRS89/UTM zone 30N projection (bottom).
Birds 04 00007 g001
Figure 2. Estimated values (log10) for the number of collisions predicted by the formulas (x-axis) and real values (y-axis) for all species included in the model ((a); R2 = 0.43) and the reduced dataset of 29 species ((b); R2 = 0.52). Regression line and 95% confidence intervals are shown with a dark line and grey shadow. Baseline levels for each factor (High-speed for the “Flight type” predictor and Sedentary for the “Movements” predictor) have a coefficient of 0.
Birds 04 00007 g002
Figure 3. Graph showing the boxplots for the two-way ANOVA assessing the number of collisions (log10) for species depending on flight types and movements.
Birds 04 00007 g003
Figure 4. Depiction of repeated measures ANOVA assessing the number of collisions through the year (log10 + 1) depending on each species movement. Species sharing movements are displayed using boxplots for each season. Tukey contrasts significance codes are included for relevant pairwise comparisons: ‘**’ 0.01, ‘*’ 0.05.
Birds 04 00007 g004
Table 1. Birds species that collided with wind turbines over 16 years (2001–2016) from two rescue centres in Spain. The Table shows the group, seasonal movement type, IUCN category, flight type, length, Spanish population, European population, the total number of collisions, collision seasonality, and predicted values of collisions obtained with the linear model including all the species. The 29 species used in the reduced dataset are indicated with asterisks beside the predicted values obtained.
SpeciesGroupSeasonal Movement TypeIUCN CategoryFlight TypeLengthSpanish PopulationEuropean PopulationNumber of CollisionsSpringSummerAutumnWinterPredicted Values
Accipiter gentilisBird of preySedentaryLeast concernFlapping532650155,000101001.1
Accipiter nisusBird of preyPartial migrationLeast concernFlapping323500330,0001984342.2 *
Aegypius monachusBird of preySedentaryNear threatenedPassive soaring107110014003120048.4
Alauda arvensisPasserinePartial migrationLeast concernSongflights174,000,00040,000,0001033726221832.1 *
Alectoris rufaGalliformeSedentaryLeast concernFlapping342,600,0003,300,0004311516112.3
Anthus campestrisPasserineAestivalLeast concernFlapping17520,0001,000,000430102.2
Anthus pratensisPasserinePartial migrationNear threatenedFlapping15015,000,000621030.9 *
Anthus spinolettaPasserinePartial migrationLeast concernFlapping1624,000450,000110002.7
Anthus trivialisPasserineAestivalLeast concernFlapping15350,00026,000,000100102.1
Apus apusApodiformeAestivalLeast concernHigh-speed18525,0007,500,0001233027353110.4
Apus melbaApodiformeAestivalLeast concernHigh-speed225850165,000101006.2
Apus pallidusApodiformeAestivalLeast concernHigh-speed17220028,000200115.6
Aquila chrysaetosBird of preySedentaryLeast concernActive soaring86123090001660558.6 *
Ardea cinereaPelecaniformePartial migrationLeast concernFlapping931510180,000110002.0
Asio flammeusBird of preyPartial migrationLeast concernFlapping37370,000210011.0
Asio otusBird of preyPartial migrationLeast concernFlapping345700450,000110002.3
Bubo buboBird of preySedentaryLeast concernFlapping6556028,000320100.9
Burhinus oedicnemusCaradriformePartial migrationLeast concernFlapping4226,000100,000101002.7
Buteo buteoBird of preyPartial migrationLeast concernActive soaring525250850,00081232030819.8 *
Caprimulgus europaeusCaprimulgiformesAestivalLeast concernFlapping26100,000535,000210101.9
Carduelis cannabinaPasserinePartial migrationLeast concernFlapping132,500,00014,500,000271241014.5 *
Carduelis carduelisPasserinePartial migrationLeast concernFlapping131,850,00016,000,000511214.4 *
Ciconia ciconiaCiconiformeAestivalLeast concernActive soaring1037901140,0005140012.2
Ciconia nigraCiconiformeAestivalLeast concernActive soaring982107900101008.1
Circaetus gallicusBird of preyAestivalLeast concernActive soaring651900990022397310.4 *
Circus aeruginosusBird of preyPartial migrationLeast concernActive soaring4950070,0002110015.1
Circus cyaneusBird of preyPartial migrationLeast concernActive soaring5035026,5002110014.5
Circus pygargusBird of preyAestivalLeast concernActive soaring45410038,00020793111.3 *
Clamator glandariusCuculiformesAestivalLeast concernFlapping3760,00065,000100101.8
Coccothraustes coccothraustesPasserinePartial migrationLeast concernFlapping1745001,500,000101002.2
Columba liviaColumbiformesSedentaryLeast concernFlapping322,140,00013,000,000320102.3
Columba palumbusColumbiformesPartial migrationLeast concernFlapping40220,00011,500,000210103.4
Corvus coraxPasserineSedentaryLeast concernFlapping6075,000830,000100011.6
Corvus coronePasserineSedentaryLeast concernFlapping48425,00013,000,000312001.9
Coturnix coturnixGalliformePartial migrationLeast concernFlapping17380,0001,600,000300213.7
Cuculus canorusCuculiformesAestivalLeast concernFlapping34230,0002,700,000101002.0
Delichon urbicaPasserineAestivalLeast concernFlapping142,150,00021,000,0002162492.6 *
Emberiza ciaPasserineSedentaryLeast concernFlapping161,400,0002,600,000200112.2
Emberiza cirlusPasserineSedentaryLeast concernFlapping16650,0002,800,000110002.0
Emberiza citrinellaPasserinePartial migrationLeast concernFlapping16155,00080,000,000110003.3
Erithacus rubeculaPasserinePartial migrationLeast concernFlapping132,100,000100,000,0002394914.4 *
Falco columbariusBird of preyPartial migrationLeast concernHigh-speed30046,000301023.9
Falco naumanniBird of preyAestivalLeast concernActive soaring30650015,00077123426511.9 *
Falco peregrinusBird of preyPartial migrationLeast concernHigh-speed4516809300961209.2 *
Falco subbuteoBird of preyAestivalLeast concernHigh-speed32250090,0001124415.6 *
Falco tinnunculusBird of preyPartial migrationLeast concernHovering3427,500370,0001284135448128.0 *
Ficedula hypoleucaPasserineAestivalLeast concernFlapping13240,00010,000,0001331812.0 *
Fringilla coelebsPasserinePartial migrationLeast concernFlapping154,500,000160,000,000301024.8
Galerida cristataPasserineSedentaryLeast concernSongflights18700,0004,600,0005122013.6 *
Galerida theklaePasserineSedentaryLeast concernSongflights161,500,0001,550,0006302114.8 *
Gallinago gallinagoCaradriformesPartial migrationLeast concernFlapping26706,400,000110001.4
Garrulus glandariusPasserinePartial migrationLeast concernFlapping34800,00013,500,000310114.0
Grus grusGruiformesPartial migrationLeast concernFlapping107067,000321000.9
Gyps fulvusBird of preyPartial migrationLeast concernPassive soaring102807410,2001901693305518385117.8
Hieraaetus pennatusBird of preyAestivalLeast concernActive soaring473000520058718221110.9 *
Hirundo rusticaPasserineAestivalLeast concernFlapping19795,00026,000,000200022.3
Jynx torquillaPiciformesAestivalLeast concernFlapping1749,000550,000100011.7
Lanius collurioPasserineAestivalLeast concernFlapping17370,0004,500,000101002.2
Lanius meridionalisPasserinePartial migrationLeast concernFlapping24225,000300,000110003.4
Locustella naeviaPasserineAestivalLeast concernFlapping132751,000,000100011.0
Loxia curvirostraPasserineSedentaryLeast concernFlapping16165,0002,000,000110001.7
Lullula arboreaPasserinePartial migrationLeast concernSongflights14900,0002,200,0004619619227.1 *
Luscinia megarhynchosPasserineAestivalLeast concernFlapping161,100,0009,500,000101002.4
Melanocorypha calandraPasserineSedentaryLeast concernSongflights182,200,00010,000,000191121515.5 *
Miliaria calandraPasserinePartial migrationLeast concernFlapping182,800,00011,000,0001672434.6 *
Milvus migransBird of preyAestivalLeast concernActive soaring53900085,00019493312.4 *
Milvus milvusBird of preyPartial migrationNear threatenedActive soaring67370021,50099287333119.0 *
Motacilla albaPasserinePartial migrationLeast concernFlapping18200,00015,000,000101003.4
Neophron percnopterusBird of preyPartial migrationEndangeredActive soaring60135050006012316.9 *
Oenanthe oenanthePasserineAestivalLeast concernFlapping15345,0009,000,000100102.1
Otis tardaGruiformesSedentaryVulnerableFlapping9018,00029,500211001.3
Parus majorPasserinePartial migrationLeast concernFlapping143,000,000110,000,000200024.6
Passer domesticusPasserineSedentaryLeast concernFlapping159,600,000120,000,000200202.7
Pernis apivorusBird of preyAestivalLeast concernActive soaring551500125,0004012110.1
Petronia petroniaPasserineSedentaryLeast concernFlapping161,000,0001,100,0001232342.1 *
Phoenicurus ochrurosPasserinePartial migrationLeast concernFlapping14650,0004,500,000101003.9
Phylloscopus bonelliPasserineAestivalLeast concernFlapping111,900,0002,600,000200112.6
Phylloscopus collybitaPasserinePartial migrationLeast concernFlapping11550,00080,000,0002391943.8 *
Phylloscopus trochilusPasserineAestivalLeast concernFlapping1260100,000,000200020.8
Pica picaPasserineSedentaryLeast concernFlapping45700,00021,000,000110002.0
Podiceps cristatusPodicipediformesPartial migrationLeast concernFlapping482800800,000100012.1
Prunella modularisPasserinePartial migrationLeast concernFlapping14700,00017,000,000100103.9
Ptyonoprogne rupestrisPasserinePartial migrationLeast concernFlapping1592,000300,000200113.1
Regulus ignicapillusPasserinePartial migrationLeast concernFlapping101,400,0004,100,00023142704.2 *
Regulus regulusPasserinePartial migrationLeast concernFlapping9370,00070,000,000200113.6
Saxicola torquataPasserinePartial migrationLeast concernFlapping12500,0002,100,000300303.8
Scolopax rusticolaCaradriformesPartial migrationLeast concernFlapping35660,0002,200,000100013.9
Serinus serinusPasserinePartial migrationLeast concernFlapping125,300,0009,600,000201104.9
Sturnus unicolorPasserineSedentaryLeast concernFlapping212,125,0002,800,000301112.3
Sturnus vulgarisPasserinePartial migrationLeast concernFlapping21600,00080,000,000401213.9
Sylvia atricapillaPasserinePartial migrationLeast concernFlapping141,150,00030,000,00019411044.2 *
Sylvia borinPasserineAestivalLeast concernFlapping14550,00014,000,000211002.3
Sylvia communisPasserineAestivalLeast concernFlapping14525,00015,000,000100102.2
Sylvia hortensisPasserineAestivalLeast concernFlapping15310,000350,000201102.1
Sylvia melanocephalaPasserineSedentaryLeast concernFlapping141,400,0004,000,000100012.2
Sylvia undataPasserineSedentaryNear threatenedFlapping142,300,0002,500,000321002.3
Turdus iliacusPasserinePartial migrationNear threatenedFlapping2106,000,000100010.9
Turdus merulaPasserinePartial migrationLeast concernFlapping264,100,00052,000,000410214.8
Turdus philomelosPasserinePartial migrationLeast concernFlapping21300,00018,000,000411113.6
Turdus viscivorusPasserinePartial migrationLeast concernFlapping28550,0002,800,000210103.8
Upupa epopsUpupiformesAestivalLeast concernFlapping27600,0001,100,000100012.3
Disclaimer/Publisher’s Note: The statements, opinions and data contained in all publications are solely those of the individual author(s) and contributor(s) and not of MDPI and/or the editor(s). MDPI and/or the editor(s) disclaim responsibility for any injury to people or property resulting from any ideas, methods, instructions or products referred to in the content.

