
Greenhouse Gas Emissions of the Poultry Sector in Greece and Mitigation Potential Strategies


Laboratory of Animal Breeding and Husbandry, Department of Animal Science, Agricultural University of Athens, 75 Iera Odos Street, 11855 Athens, Greece
*
Author to whom correspondence should be addressed.
Gases 2023, 3(1), 47-56; https://doi.org/10.3390/gases3010003
Submission received: 28 December 2022
/
Revised: 9 March 2023
/
Accepted: 10 March 2023
/
Published: 14 March 2023
Abstract
:The poultry sector is considered to be one of the most industrialized sectors of livestock production. Although the livestock sector contributes the 14.5% of total anthropogenic greenhouse gas (GHG) emissions, less attention has been paid in the respective emissions of the poultry sector compared to other farmed animals such as ruminants. The aim of the study was to estimate the carbon footprint of the poultry sector (layers, broilers, and backyards) in the Greek territory during the last 60 years as a means of exploring further mitigation strategies. Tier 2 methodology was used to estimate GHG emissions. Different mitigation scenarios related to changes in herd population, feeds, and manure management were examined. GHG emissions showed an increased trend over time. The different scenarios explored showed moderate to high mitigating potential depending on the parameters that were changed. Changes in manure management or diet revealed to have a higher potential to eliminate GHG emissions. Changes in population numbers showed a low mitigating potential. However, if mortality could be improved within industrialized farming systems, then it could be an indirect increase in product quantities with a slight increase in emissions. Therefore, depending on national priorities, the sector could improve its environmental impact by targeting aspects related to husbandry/management practices.
1. Introduction
The increase in human population is nowadays a certainty and according to the projections, it is expected to reach over nine billion in 2050 [1]. This population growth, combined with the increase in urbanization rate and the improvement of human social status, are expected to lead to a further increase in the future needs for livestock products (meat, milk, and eggs). According to the FAO, these needs are estimated to at least to be doubled by 2050, and, specifically, meat and milk demands are expected to increase over 70% and 50%, respectively [1,2]. Therefore, the livestock sector will require larger amounts of natural resources to meet these demands, which will lead to a higher environmental footprint of the livestock sector.
Livestock is considered to be one of the major contributors to the global amount of greenhouse gas emissions (GHGs) that are emitted by human activities. The estimated emissions by the sector are over 7.1. Gt CO2-eq per year, representing 14.5% of the total anthropogenic GHG emissions [3,4]. The emissions from the livestock sector are either direct (e.g., enteric fermentation, manure management, energy consumption) or indirect (e.g., feed production, transfer facilities) depending on the processes that are included upon the delivery of the final product. These emissions are mainly carbon dioxide (CO2; 5–9%), methane (CH4; 35–44%), and nitrous oxide (N2O; 53–65%) [4]. In addition, there is great concern about ruminant sector (cattle, goats, and sheep), and especially about the beef and dairy production sector due to their higher contribution to livestock’s GHGs (41% and 21%, respectively). However, monogastric species (e.g., pigs or poultry species) contribute, also, to these emissions significantly.
Many monogastric species are characterized by a fast-growth ability, enhancing therefore, their usage in industrialized farming systems under all-in/all-out farming. Such a specie is the chicken, which, due to its fast growth, its products have gained a high preference of the consumers due to socio-economic status, ethical concerns, religious beliefs, traditions, and/or dietary scandals [5]. Chickens are playing a significant role in the diet of people as many of them trade red meat for poultry. Eggs are also a very nutritious food product that is extensively consumed worldwide. It is a natural source of many macro- and micro-nutrients, including high quality protein, vitamins, minerals, trace elements, and bioactive compounds. Although the poultry sector is a well-developed sector worldwide, there is a misconception that it has a low environmental impact in terms of global potential warming (CO2-eq) because, unlike ruminants, their digestive processes do not produce methane. According to Gerber et al. [3], the poultry sector represents 9% (0.6 Gg CO2-eq/year) of the livestock sector’s emissions. However, these emissions are higher if specific countries are targeted, such as South Korea [6] or China [7]. According to previous studies [8,9], approximately 50% of the emissions derived from the poultry sector are generated at the stage of farming (egg production or fattening).
The assessment of the livestock carbon footprint is based on the estimation of GHG emissions. According to the guidelines of the Intergovernmental Panel on Climate Change (IPCC), the estimation of GHG emissions can be achieved following different tier methodologies (Tier 1, 2 or 3) according to the available data [10,11]. These methodologies are based on specific equations of elevated computational power according to the available data (e.g., population number, animal categories, feed parameters, etc.). Therefore, in moving from a Tier 1 approach to a Tier 3 approach, more elaborated equations are used. Thus, in Tier 3 methodology, more specific data are, usually, required, even including models and inventory measurement systems tailored to case studies or national circumstances, repeated over time, and driven by high-resolution activity data. According to the IPCC [10], the higher Tier methodologies that are implemented, the more accurate estimations of GHGs are achieved. In any case, due to the difficulties of developing Tier 3 approaches in each country, the Tier 2 approach, if it can be used, is more preferable than the Tier 1 approach. To facilitate the implementation of Tier 2, the Food and Agriculture Organization (FAO) developed a software that utilizes a Tier 2 approach, named “Global Livestock Environmental Assessment Model” (GLEAM-i) [12]. The software adopts a life-cycle approach (LCA), calculates the emissions arising along the supply chain from cradle to retail point, and creates a spatially explicit database on the livestock sector.
Many studies have been previously reported the environmental impact of the poultry sector (egg/meat) considering different farming systems and estimating methods. According to Nielsen et al. [9], the production of 1 kg of Danish broiler adds 3.85 kg of CO2 equivalents to the global warming potential. Hatch egg production had the lowest emissions (0.39 kg CO2 eq) when compared to the broiler production or slaughter stage (2.94 kg and 0.52 kg CO2 eq, respectively). Several other studies indicated similar values [13], but the results are not easily comparable due to different methods, functional units, or farming system boundaries used during the assessment. Considering egg production, free range systems showed a higher environmental impact than organic systems, barn systems, or even cage systems utilized in the past in terms of potential warming, eutrophication, and acidification [14]. In addition, Nielsen et al. [8] reported that 1.8 Kg CO2-eq are emitted per 1 kg of Danish eggs produced. Williams et al. [15] evaluated, also, the organic, free-range, and conventional farming systems for meat broiler or egg production. In both examined cases (eggs or meat production) the free-range systems showed a higher carbon footprint than the organic or conventional systems.
The poultry sector in Greece is considered as one of the most industrialized husbandry sectors. It covers approximately 80% and 97% in meat and egg demands, respectively [16]. In addition, according to the Hellenic Statistical Authority [17], there has been an increase in the number of chickens that are bred either for egg or meat production during the last two decades. However, there is missing information about the environmental footprint of the sector, which is needed to be able to implement further mitigation measures or certain policies. Therefore, the aim of this study is to estimate the GHG emissions from the chicken farming sector (meat and egg production) under different production systems (layers, broilers, and backyards) at the national level using Tier 2 methodology. Different scenarios in farming indexes were examined, and their potential was quantified as a proxy to identify further mitigation measures. To the best of the authors’ knowledge, this is the first comprehensive assessment regarding the emissions of poultry farming at the national level, as well as the first attempt to highlight potential mitigation strategies that could be applied to eliminate GHG emissions in certain livestock sectors. The results would be useful for stakeholders of the sector to further drive more elaborate measures.
2. Materials and Methods
2.1. Area of Study
2.2. Population Data
Secondary sources of data were used in this study. Specifically, population data were obtained from the statistic division of the Food and Agriculture Organization of the United Nations (FAOSTAT) [18] and the Hellenic Statistical Authority [17]. As there was not much variation in the herd parameters on a yearly basis, the data were classified into six groups, each group having a ten (10) year interval (1961–1970, 1971–1980, 1981–1990, 1991–2000, 2001–2010, and 2011–2020) (Supplementary Table S1). According to the retrieved data, the portion of the population reared under industrialized systems and backyard farming represented 90% and 10%, respectively.
2.3. GHG Emissions’ Estimation
Emissions derived from the sector for the targeted periods were firstly estimated using a Tier 2 approach for the poultry sector. Specifically, the Global Livestock Environment Assessment Model (GLEAM-i software v. 2.0) developed by the FAO [12] was used to estimate the emissions of GHG from the targeted sector at a national level (Region: Western Europe; Country: Greece). Layers, Broilers, and Backyard farming systems were chosen from the respective modules of GLEAM. The collected data were formatted following the requirements of the GLEAM-i tool for the quantification of GHG emissions. The major data types were livestock population and herd parameters, feed resources, and manure management. Except for population numbers, the default values were used for the rest of the required data because these parameters reflect the respective country’s average values [12,19]. GLEAM-i, apart from the Tier 2 methodology approach that follows, also incorporates a Life Cycle Assessment (LCA) method to identify all the main emission sources along the supply chain. It quantifies GHG emissions for spatially defined geographic units, and it is built on five modules reproducing the main elements of livestock supply chains: the herd module, the feed module, the manure module, the system module, and the allocation module. Therefore, a better and more accurate representation of emissions is achieved. In addition, the software was developed to assist a comprehensive assessment interaction between livestock and environmental impact, and to reduce manual calculation errors. It provides, also, options to run different scenarios for mitigation options [19]. Thus, in the present study, GLEAM-i was used to estimate the emission of GHGs from the poultry population and evaluate the mitigation potential of the sector at the national level. All on-farm emissions, as well as emissions from feed production to the processing point related to poultry farming (cradle-to-processing point), were considered to estimate the total GHG emissions (CO2-eq). Land-use changes related to feed crops (e.g., soy) were also considered. First, the emissions derived from the different reared populations were assessed (layers, broilers, and backyards) for the studied period. Then, mitigation potentials with respect to management practices were evaluated as follows.
2.4. Mitigation Scenarios Explored at the National Level
After the estimation of GHG emissions at the national level, three different mitigation scenarios were evaluated separately, following the approaches identified by FAO [3]. The different evaluated scenarios were selected at the base of their feasibility of adoption by the stakeholders of the sector at the national level. As a baseline scenario, the emissions of the last year of the latter targeted period (2011–2020) was selected. The different scenarios were related to changes in parameters of herd, diet, and manure management compared with the baseline scenario (Supplementary Table S2). The rest of the implemented values remained the same as in the baseline scenario.
2.4.1. Scenario-I (S-I): Population Increase–Decrease
In this group of mitigation approaches, different scenarios of animal population variations were evaluated. Specifically, we evaluated: (a) the improvement of mortality in different animal categories of layers and broilers, and, specifically, in young animals and adult chickens, by 1% (S-Ia), which can be considered achievable under better management, hygiene, and/or the use of precision livestock solutions; (b) the improvement of self-sufficiency in eggs and chicken meat at the national level by 10% and 30%, respectively, which reflects an increase in animal population to meet self-sufficiency (S-Ib), which could potentially be a state policy; and (c) the decline of 10% of the broiler and layer populations, followed by an increase of 10% in backyard populations, as a means of improving welfare (S-Ic) and, which may also offer a value-added benefit in the final product.
2.4.2. Scenario-II (S-II): Changes in Diet’s Feeds
In this scenario, the decrease in the use of soy in the diets of industrialized reared chicken populations (layers and broilers) was examined as a means of mitigating GHG emissions and as a proxy for eliminated feed costs. Specifically, we explored the possibility of replacing part of the soybeans with (a) other protein beans (i.e., Leguminous beans except soy) (S-IIa) and (b) with other feeds representing byproducts from oil production, cotton seed, and crop residue (leguminous plants) (S-IIb), as there are feasible possibilities to use such types of feeds in diets.
2.4.3. Scenario-III (S-III): Improved Manure Management
Anaerobic digestion, aeration, reducing storage time, and storage cover with straw were among the strategies recommended by the FAO [3,4]. However, these management systems are not commonly practiced at the national level. Therefore, in this scenario, holistic or partial changing of manure management systems within the different reared populations were examined (layers, broilers, and backyards) following the available options that GLEAM offered in each case of farming system under its manure module. Herd and feed parameters remained the same as in baseline scenario, while changes in the manure module were applied. Specifically in layers, partial changes of manure treatment from the ones typically used, such as pit storage (42%), dry lot (50%), and manure with litter (8%), were examined as follows: (a) dry lot (100%) (S-III_La), and (b) pit storage (40%), dry lot (40%), and solid storage (20%) (S-III_Lb). In broilers, the typically implemented manure management, referring to manure with litter (100%), was changed to (a) solid storage (100%) (S-III_Br_a), and (b) solid storage (8%) and manure with litter (92%) (S-III_Br_b). Finally, in the case of backyard populations, the typically used treatment referring to daily manure spread (50%) and pasture/paddock spread (50%) was changed to: (a) daily spread (100%) (S-III_Bk_a) and (b) daily spread (50%), and pasture/paddock spread (45%) and solid storage (5%) (S-III_Bk_b).
2.5. Data Formatting and Analysis
Data was formatted according to GLEAM-i requirements and was entered in separate sheets for each examined case. Once the analysis was completed, the results were exported into an Excel sheet, and descriptive statistics and graphical interpretations were made.
3. Results
3.1. Overall GHG Emissions at the National Level and between Production Systems
The estimated GHG emissions for the examined period at the national level are shown in Table 1. The average overall GHG emissions during the six-decade internals showed an increasing trend. Specifically, it increased from 20.6 × 10⁹ kg CO2-eq/year in 1961–1970 to 34.5 × 10⁹ kg CO2-eq/year in 2011–2020 (67.5%). Between each decade, an increase in the emissions was observed for 1971–1980 (42.80%), 2001–2010 (7.19%), and 2011–2020 (13.08%), while a slight decrease was noted in 1981–1990 (−0.92%) and 1991–2000 (−2.61%). The fluctuation in the estimated emissions was similar to the respective changes in the poultry population (Supplementary Table S1).
Regarding farming systems, it was observed that the industrialized systems (layers and broilers) had higher emissions compared to backyard farming. In addition, broilers had higher emissions compared to layers. Within the target period, the emissions of each farming system showed similar fluctuations to average estimated emissions.
3.2. Effect of Mitigation Potential on GHG Emissions
Table 2 shows the results of Scenario-I (S-I) mitigation measures, which consider changes in animal populations. The estimated total greenhouse gas emissions of the chicken population for the baseline at the national level was 40.69 × 10⁹ kg CO2-eq/year. The breakdown of these emissions is as follows: (a) layers: 19.22 × 10⁹ kg CO2-eq/year; (b) broilers: 21.12 × 10⁹ kg CO2-eq/year; and backyards: 0.35 × 10⁹ kg CO2-eq/year. In the case of improving mortality (S-Ia) or improving self-sufficiency in the final products (S-Ib), an increase in total emissions was noted. Specifically, compared to the baseline, they were raised from 40.69 × 10⁹ kg CO2-eq/year to 41.27 × 10⁹ kg CO2-eq/year (S-Ia) and 48.7 × 10⁹ kg CO2-eq/year (S-Ib). In the case of reducing the number of broilers and layers by 10% and increasing backyard reared populations by 10%, (S-Ic), a reduction in total emissions from 40.69 × 10⁹ kg CO2-eq/year to 36.68 × 10⁹ kg CO2-eq/year (−9.8%) was noted.
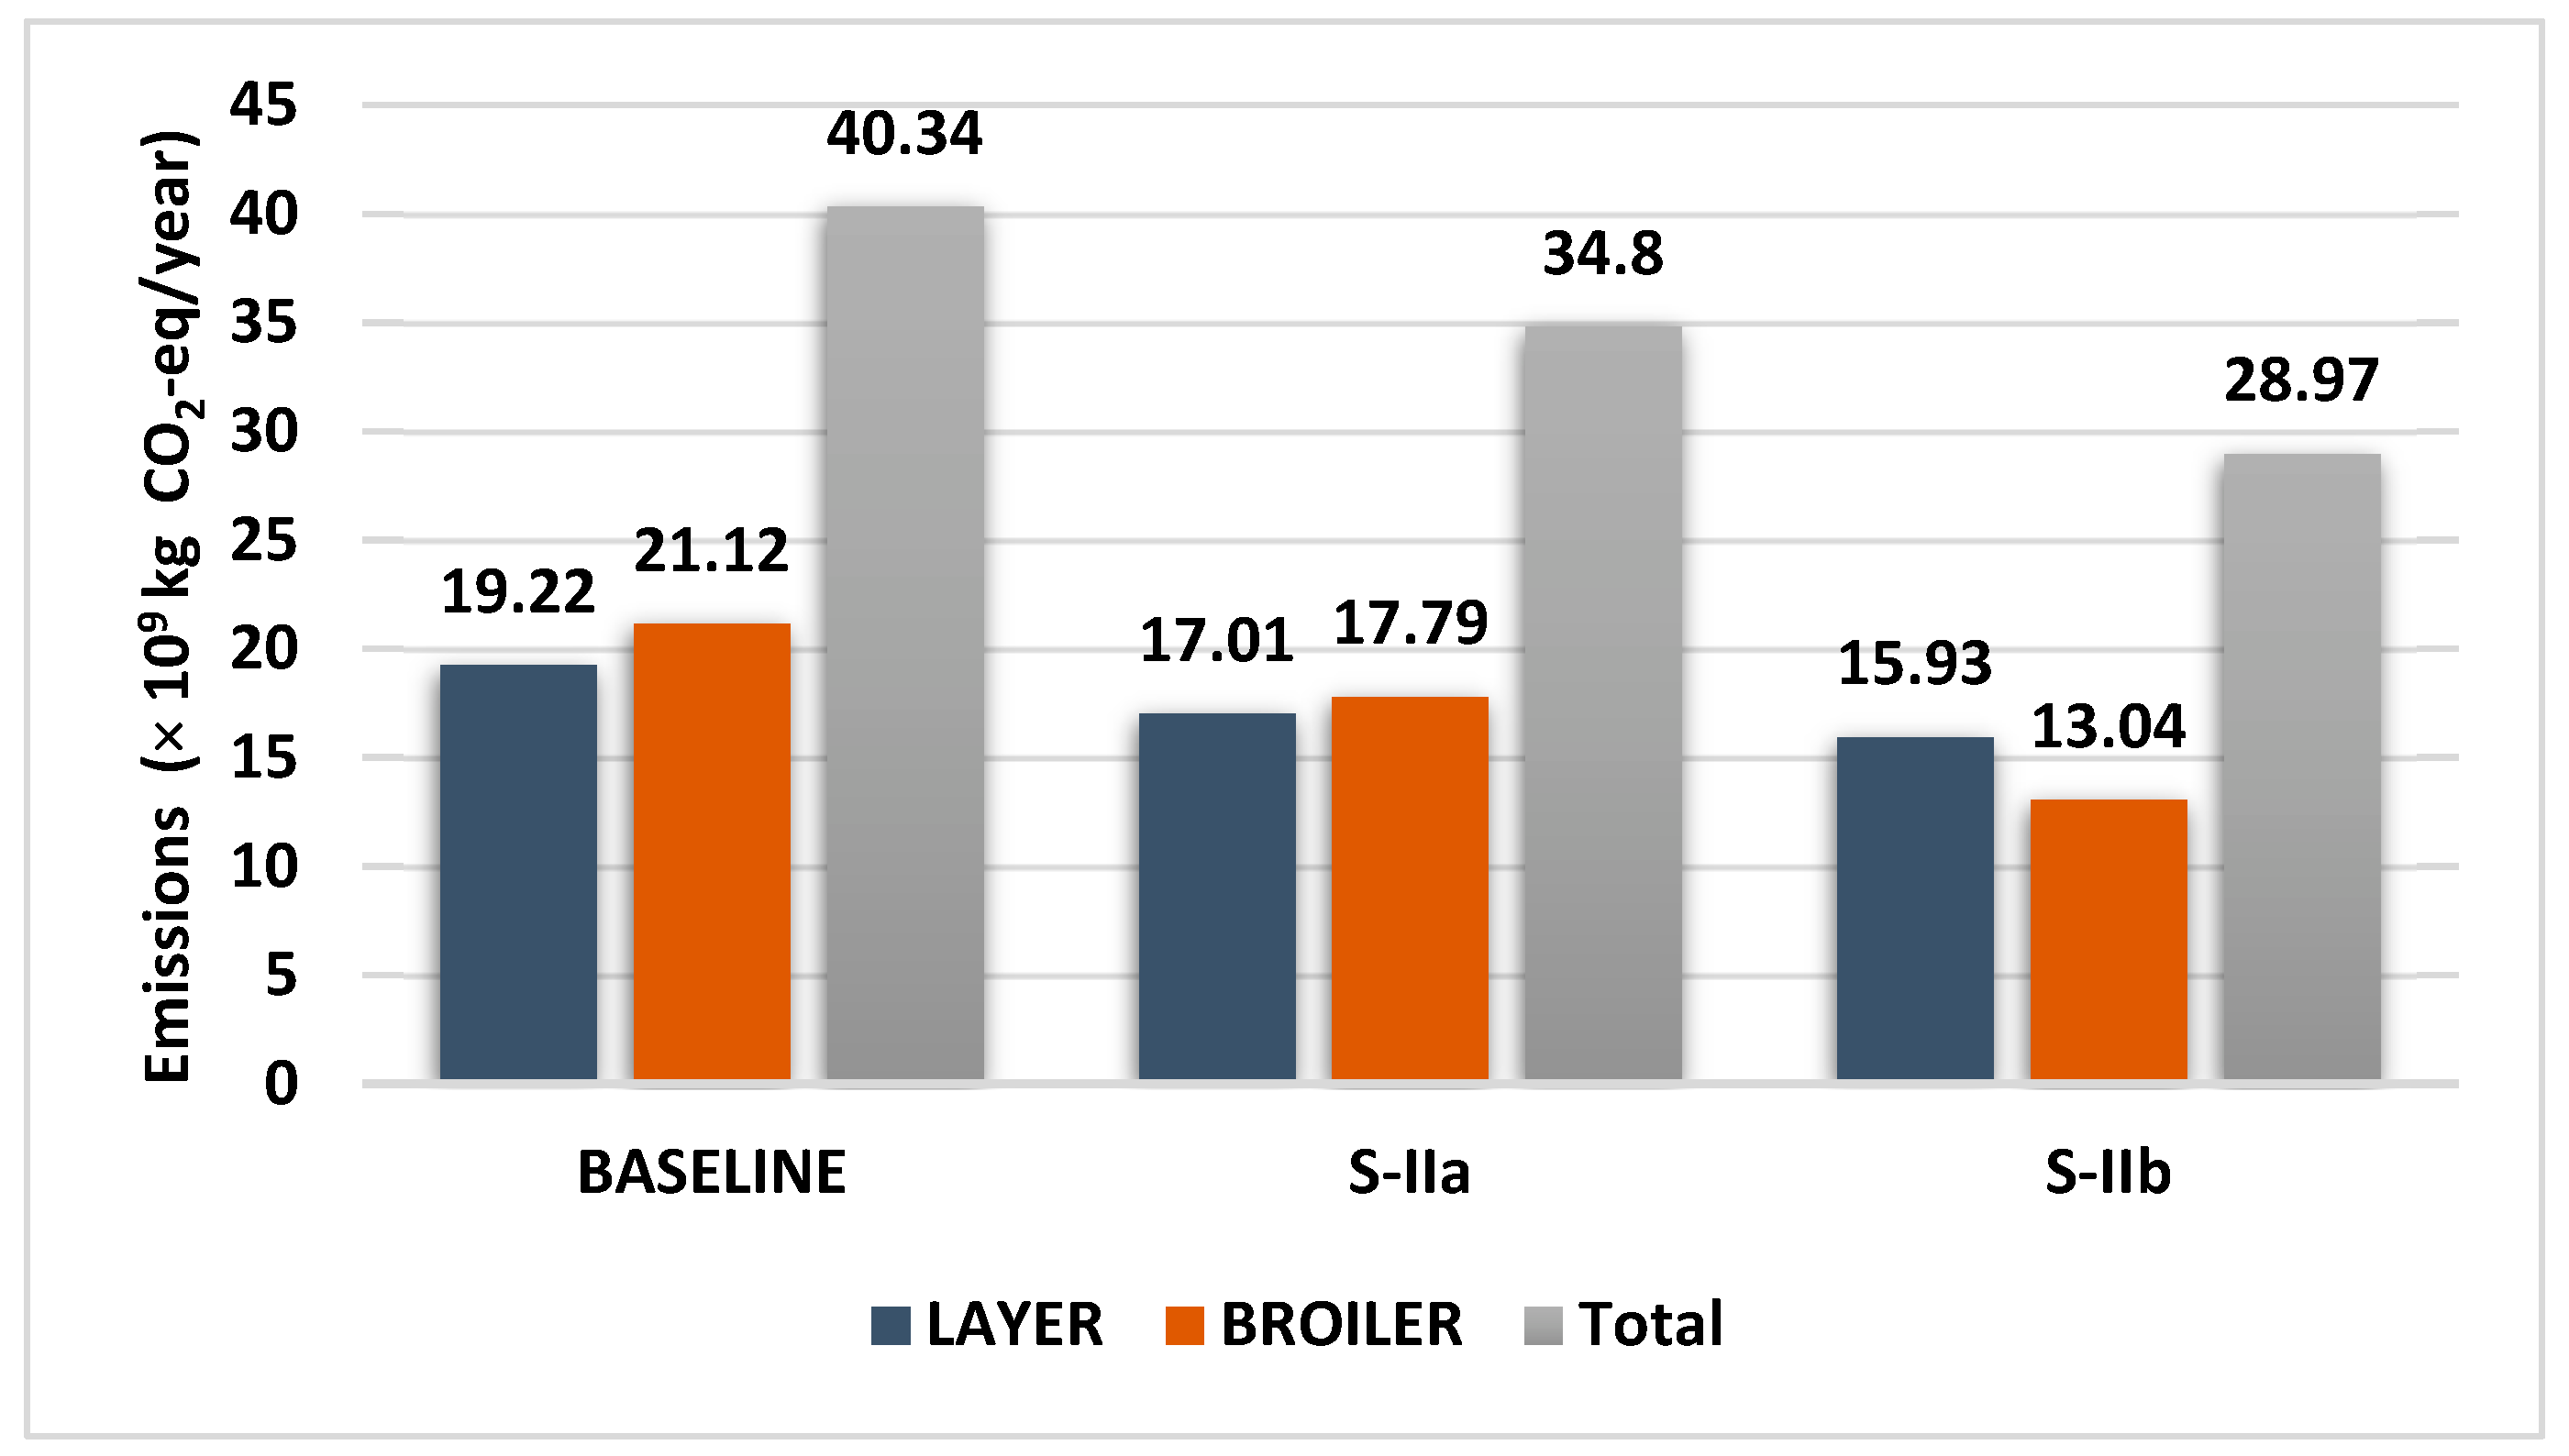
Regarding Scenario-II (S-II), which is related to changes in diet, we noted a decrease in the total GHG emissions compared to the baseline (Figure 1). In both examined cases, the partial replacement of soy with other protein-rich feeds such as beans (e.g., leguminous beans; S-IIa) or other type of feeds (e.g., byproducts of crops; S-IIb) lead to a reduction of total emissions as well as of those within each reared population (broilers and layers). Specifically, total emissions decreased from 40.34 × 10⁹ kg CO2-eq/year (baseline) to 34.80 × 10⁹ kg CO2-eq/year (S-IIa) and 28.97 × 10⁹ kg CO2-eq/year (S-IIb). In addition, emissions related to broilers showed a higher decrease compared with those related to layers in the examined scenarios. In S-IIa, emissions related to broilers decreased by 15.8% compared with baseline, while the respective emissions related to layers decreased by 11.5% compared with baseline. In S-IIb, the emissions decreased by 38.3% and 17.1%, respectively.
The results of Scenario-III (S-III), which is related to changes of manure management within each reared population (layers, broilers, and backyards), are shown in Table 3. Apart from broilers, we observed a decrease in the respective emissions according to the implemented change of manure management, which ranged from 1.2% to 42.9%.
4. Discussion
In the present study, a retrospective analysis of the GHG emissions of the chicken population (layers, broilers, and backyards) reared in Greece was conducted over a six-decade-period (from 1961–1970 to 2011–2020). In addition, further hypothetical scenarios were explored as a means of mitigating emissions of the sector. An increasing trend of GHG was observed from 1961–1970 to 2011–2020, which can be explained mainly due to the increase in the reared chicken population during the examined period. Broilers contributed to a higher proportion to these emissions due to their higher population compared to other reared populations, as well as due to the intensity of farming (approximately 7–8 productive cycles/year). The contribution of GHG from livestock is, generally, expected to grow due to the increase livestock population, which is triggered by the increasing demand of animal protein, especially in developing countries [20]. However, the demand for chicken products (white meat, eggs) is of major concern among consumers as they are considered more affordable compared to red meat and of high nutrient content. In addition, white meat has not yet been associated with various diseases, like red meat has, with reference to to following a healthier diet [5,21,22,23]. Projecting the GHGs of the sector in the future at the country level is a great challenge that could assist any implemented policy. However, making projections based only on the trend of the recorded emissions, which reflects only the fluctuations in herd numbers in the past, could lead to controversial and biased conclusions. Many other factors, such as consumer preferences, economic status, prices, etc., may contribute to the increase or decrease in livestock population numbers, and such parameters should be considered when projections are made. In any case, the increasing trend of the chicken reared population is aiming to follow consumer demands but also contributes to higher GHG emissions, from which a need emerges to take appropriate mitigation measures.
Therefore, different scenarios considering changes in parameters related to herd, diet, and manure management were explored as a proxy of mitigating the produced GHG at the national level. Improving the herd’s productivity through reducing mortality resulted in a slight increase in GHG (+1.4%). In contrast, if higher levels of productivity are targeted by increasing population number to meet self-sufficiency levels, the total emissions of the examined sector were increased drastically (over 15%). Thus, improving husbandry practices that may lower the levels of mortality could assist in keeping GHG emissions at similar levels to the baseline scenario, achieving, simultaneously, a better final productivity. In addition, welfare is a major concern in the poultry sector [24]. Moving from the industrialized farming systems to traditional ones, such as backyard systems, seems to have potential for improving animal well-being. Such a transition seems to have a promising potential for eliminating GHG emissions from the poultry sector. The evaluation of such scenario resulted in a decrease in total GHG emissions (−9.8%), which is reasonable as the population of layers and broilers was decreased. Interestingly, the emissions related to backyard systems showed a slight increase compared with the baseline scenario (from 0.35 × 10⁹ CO2-eq to 0.38 × 10⁹ kg CO2-eq) although their population increased. Thus, there are mitigation potentials that could target both welfare aspects and eliminating GHGs.
Improving feeding management practices is one of the dietary strategies for reducing GHG emissions. In the poultry sector, the cost of feed represents over 70–80% of the total husbandry costs [25]. In addition, soy usually participates, with high percentages in the implemented diets due to its high protein content. However, soy cultivation and further feed production have a high environmental impact in terms of the great quantities of water, which are used for irrigation, deforestation, and also due to the transportation of this feed to the targeted countries [26]. Among the examined mitigation scenarios, diet changes showed the greatest potential for eliminating the total GHG emissions. Reducing the use of soybeans and replacing them with other protein-rich foods or other byproducts of feed cultivation revealed a high potential for reducing GHG emissions compared to the other examined scenarios. Therefore, replacing a part of soy with other protein feeds is, apart from eliminating GHG emissions, an alternative for cost reduction. This is also encouraging, since soy is not among the main cultivated crops of Greece, so its partial replacement could offer an economic benefit.
The changes related to manure management that were explored in the present study showed a moderate capacity of reducing GHG emissions. Except broilers, in the rest of the examined cases (layers and backyards), changes in the manure handling showed a decrease of GHGs ranging from 1 to 14%. A higher potential was noted for backyard systems and in layers when solid storage or dry lot were used in the tested scenarios, respectively. The observed changes to emissions were according to our expectations, as manure management strategies have been clearly indicated to have a medium to high mitigation potential [3].
Mitigating GHG emissions from the livestock sector is of the utmost importance among countries. According to the explored scenarios, there are strategies that could be followed by the stakeholders to improve the environmental impact of the sector at the national level. If the main target of a policy is to achieve self-efficiency in poultry products by increasing the respective reared population, then it would be advisable to implement further measures for mitigating GHG emissions, as such an animal population increase leads to an increase in emissions. It should be noted that the examined scenarios are ad hoc hypothetical cases following trends that could be potentially implemented in the studied sector according to the priorities of farmers or state. In any case, they could serve as pilot examples for future scenarios that each stakeholder or policy maker could further examine. Accordingly, many countries have already tried to improve the environmental impact of the poultry sector. A typical example of such an approach is that of United States. Specifically, producing, nowadays, the same amount of chicken as in 1965, it has 50% less impact on the environment. Many factors contributed to the reduced environmental impact, including fewer resources required in poultry production at the territory level, a decrease in farmland used in poultry production, and a decrease in water used in poultry production, which all led to a reduced impact of GHG emissions [27]. Therefore, such approaches, together with changes in basic husbandry practices (manure management, feed improvements, and improvement of zootechnical indexes), could serve as pilot examples to eliminate, at the national level, GHG emissions.
5. Conclusions
GHGs from the poultry sector (layers, broilers, and backyards) in Greece showed an increased trend over time. This increase is alarming, and, therefore, appropriate mitigation measures need to be taken. If such measures will not be considered, then GHG emissions are expected to increase due to the projected increase in population growth that will lead to an increase in the demand for animal protein. Different scenarios explored in the present study showed a moderate to high mitigating potential, depending on the parameters that were changed. Changes in parameters, such as manure management or diet, were revealed to have a moderate or higher potential to reduce GHG emissions. Changes in population numbers showed a different mitigating potential according to the implemented change. However, if mortality could be improved, then it could be an indirect increase in product quantities with a very low increase in emissions. In addition, there are mitigation potentials that could also target welfare aspects in addition to eliminating GHGs. The presented scenarios could serve as a pilot for future mitigation scenarios by the stakeholders of the sector or the state. Therefore, depending on national priorities and the respective legislation, the sector could improve its environmental impact targeting aspects related to husbandry/management practices.
Supplementary Materials
The following supporting information can be downloaded at: https://www.mdpi.com/article/10.3390/gases3010003/s1, Table S1: Chicken population (heads) in Greece (broilers, layers, backyards) from 1961 to 2020. Table S2: Herd, feed and manure management parameters used in the examined scenarios for mitigating GHG emissions.
Author Contributions
Conceptualization, G.P.L.; methodology, G.P.L. and I.B.; software, K.A. and G.P.L.; validation, G.P.L. and K.A.; formal analysis, K.A.; investigation, K.A.; resources, G.P.L.; data curation, K.A.; writing—original draft preparation, K.A.; writing—review and editing, G.P.L. and I.B.; visualization, K.A. and G.P.L.; supervision, G.P.L.; project administration, G.P.L. and I.B. All authors have read and agreed to the published version of the manuscript.
Funding
This research received no external funding.
Institutional Review Board Statement
Not applicable.
Informed Consent Statement
Not applicable.
Data Availability Statement
The used data are publicly available. Sources are mentioned in the reference list. Data are available from the corresponding author upon reasonable request.
Conflicts of Interest
The authors declare no conflict of interest.
References
- United Nations, Department of Economic and Social Affairs, Population Division. World Population Prospects 2019: Highlights (ST/ESA/SER.A/423); United Nations: New York, NY, USA, 2019.
- Alexandratos, N.; Bruinsma, J. World agriculture towards 2030/2050: The 2012 revision. In ESA Working Paper 2012; No. 12–03; FAO: Rome, Italy, 2012. [Google Scholar]
- Gerber, P.J.; Steinfeld, H.; Henderson, B.; Mottet, A.; Opio, C.; Dijkman, J.; Falcucci, A.; Tempio, G. Tackling Climate Change Through Livestock—A Global Assessment of Emissions and Mitigation Opportunities; Food and Agriculture Organization of the United Nations (FAO): Rome, Italy, 2013; ISBN 978-92-5-107920-1. [Google Scholar]
- Rojas-Downing, M.M.; Nejadhashemi, A.P.; Harrigan, T.; Woznicki, S.A. Climate change and livestock: Impacts, adaptation, and mitigation. Clim. Risk Manag. 2017, 16, 145–163. [Google Scholar] [CrossRef]
- Font-i-Furnols, M.; Guerrero, L. Consumer preference, behavior and perception about meat and meat products: An overview. Meat Sci. 2014, 98, 361–371. [Google Scholar] [CrossRef] [PubMed]
- Boontiam, W.; Shin, Y.; Choi, H.L.; Kumari, P. Assessment of the Contribution of Poultry and Pig Production to Greenhouse Gas Emissions in South Korea Over the Last 10 Years (2005 through 2014). Asian Australas. J. Anim. Sci. 2016, 29, 1805–1811. [Google Scholar] [CrossRef] [PubMed] [Green Version]
- Wang, L.-Z.; Xue, B.; Tianhai, Y. Greenhouse gas emissions from pig and poultry production sectors in China from 1960 to 2010. J. Integr. Agric. 2017, 16, 221–228. [Google Scholar] [CrossRef] [Green Version]
- Nielsen, N.I.; Jorgensen, M.; Bahrndorff, S. Greenhouse Gas Emission from Danish Organic Egg Production Estimated via LCA Methodology; Knowledge Centre for Agriculture, Poultry: Aarhus, Denmark, 2013; Available online: https://sp.landbrugsinfo.dk/fjerkrae/klima-og-energi/sider/Klima_UK_okoaeg.pdf (accessed on 25 November 2022).
- Nielsen, N.I.; Jorgensen, M.; Bahrndorff, S. Greenhouse Gas Emission from the Danish Broiler Production Estimated via LCA Methodology; Knowledge Centre for Agriculture, Poultry: Aarhus, Denmark, 2011; Available online: https://lca-net.com/wp-content/uploads/110628_vfc_engelsk_vfl_layout_web.pdf (accessed on 25 November 2022).
- IPCC. Guidelines for National Greenhouse Gas Inventories: Agriculture, Forestry and Other Land Use; Eggleston, H.S., Buendia, L., Miwa, K., Ngara, T., Tanabe, K., Eds.; IGES: Hayama, Japan, 2006; ISBN 4-88788-032-4. [Google Scholar]
- IPCC. Refinement to the 2006IPCC Guidelines for National Greenhouse Gas Inventories: Agriculture, Forestry and Other Land Use; Eggleston, H.S., Buendia, L., Miwa, K., Ngara, T., Tanabe, K., Eds.; IGES: Hayama, Japan, 2019; ISBN 978-4-88788-232-4. [Google Scholar]
- FAO. Global Livestock Environmental Assessment Model—Interactive (GLEAM-i); Guidelines, Version 1.9; Food and Agriculture Organization of the United Nations: Rome, Italy, 2021. [Google Scholar]
- Katajajuuri, J.M. Experiences and improvement possibilities—LCA Case Study of Broiler Chicken Production. In Proceedings of the 3rd International Conference on Life Cycle Management, Zurich, Switzerland, 27–29 August 2007. [Google Scholar]
- Leinonen, I.; Williams, A.G.; Wiseman, J.; Guy, J.; Kyriazakis, I. Predicting the environmental impacts of chicken systems in the United Kingdom through a life cycle assessment: Egg production systems. Poult. Sci. 2012, 91, 26–40. [Google Scholar] [CrossRef] [PubMed]
- Williams, A.G.; Audsley, E.; Sandars, D.L. A lifecycle approach to reducing the environmental impacts of poultry production. In Proceedings of the 17th European Symposium on Poultry Nutrition, Edinburg, UK, 23–27 August 2009; pp. 70–76. [Google Scholar]
- EUROSTAT. Eurostat Trade Statistics. Available online: https://ec.europa.eu/eurostat/web/main/data/database (accessed on 1 November 2022).
- Hellenic Statistical Authority. Available online: https://www.statistics.gr/en/statistics/-/publication/SPK13/ (accessed on 10 November 2022).
- FAOSTAT. Food and Agricultural Organization of the United Nations. Available online: https://www.fao.org/faostat/en/#data/QCL (accessed on 10 November 2022).
- MacLeod, M.J.; Vellinga, T.; Opio, C.; Falcucci, A.; Tempio, G.; Henderson, B.; Makkar, H.; Mottet, A.; Robinson, T.; Steinfeld, H.; et al. Invited review: A position on the Global Livestock Environmental Assessment Model (GLEAM). Animal 2018, 12, 383–397. [Google Scholar] [CrossRef] [PubMed] [Green Version]
- Amanuel, B.; Solomon, A.B.; Mulubrhan, B. Estimation of greenhouse gas emissions from three livestock production systems in Ethiopia. Int. J. Clim. Chang. Strateg. Manag. 2020, 12, 669–685. [Google Scholar]
- Leroy, F.; De Smet, S. Meat in the human diet: A biosocial perspective. In More than Beef, Pork and Chicken—The Production, Processing, and Quality Traits of Other Sources of Meat for Human Diet; Lorenzo, M., Munekata, P.E.S., Barba, F.J., Toldrá, F., Eds.; Springer Nature: Cham, Switzerland, 2019; pp. 1–19. [Google Scholar]
- Tan, S.M.; de Kock, H.L.; Dykes, G.A.; Coorey, R.; Buys, E.M. Enhancement of poultry meat: Trends, nutritional profile, legislation and challenges. South Afr. J. Anim. Sci. 2018, 48, 199–212. [Google Scholar] [CrossRef] [Green Version]
- Latvala, T.; Niva, M.; Mäkelä, J.; Pouta, E.; Heikkilä, J.; Kotro, J.; Forsman-Hugg, S. Diversifying meat consumption patterns: Consumers’ self-reported past behaviour and intentions for change. Meat Sci. 2012, 92, 71–77. [Google Scholar] [CrossRef] [PubMed]
- Meseret, S. A review of poultry welfare in conventional production system. Livest. Res. Rural. Dev. 2016, 28, 234. Available online: http://www.lrrd.org/lrrd28/12/mese28234.html (accessed on 10 December 2022).
- Mallick, P.; Muduli, K.; Biswal, J.N.; Pumwa, J. Broiler Poultry Feed Cost Optimization Using Linear Programming Technique. J. Oper. Strateg. Plan. 2020, 3, 31–57. [Google Scholar] [CrossRef]
- Da Silva, R.F.B.; Viña, A.; Moran, E.F.; Dou, Y.; Batistella, M.; Liu, J. Socioeconomic and environmental effects of soybean production in meta coupled systems. Sci. Rep. 2021, 11, 18662. [Google Scholar] [CrossRef] [PubMed]
- Putman, B.; Thoma, G.; Burek, J.; Matlock, M. A retrospective analysis of the United States poultry industry: 1965 compared with 2010. Agric. Syst. 2017, 157, 107–117. [Google Scholar] [CrossRef]
Figure 1.
Results of mitigation scenario-II (changes in diet) in total GHG emissions (×109 kg CO2-eq/year) at the national level.
Figure 1.
Results of mitigation scenario-II (changes in diet) in total GHG emissions (×109 kg CO2-eq/year) at the national level.


Table 1.
GHG emissions of the chicken population (layers, broilers, and backyards) reared at the national level (kg CO2-eq/year) and the differences observed between each sequential examined decade.
Table 1.
GHG emissions of the chicken population (layers, broilers, and backyards) reared at the national level (kg CO2-eq/year) and the differences observed between each sequential examined decade.
| Years | Industrialized | Backyard | Total | Difference (%) | |
|---|---|---|---|---|---|
| Broilers | Layers | ||||
| 1961–1970 | 10.7 × 10⁹ | 9.8 × 10⁹ | 0.17 × 10⁹ | 20.6 × 10⁹ | ---- |
| 1971–1980 | 15.3 × 10⁹ | 13.9 × 10⁹ | 0.24 × 10⁹ | 29.5 × 10⁹ | +43.2 |
| 1981–1990 | 15.2 × 10⁹ | 13.8 × 10⁹ | 0.24 × 10⁹ | 29.2 × 10⁹ | −1.0 |
| 1991–2000 | 14.8 × 10⁹ | 13.4 × 10⁹ | 0.23 × 10⁹ | 28.4 × 10⁹ | −2.7 |
| 2001–2010 | 15.8 × 10⁹ | 14.4 × 10⁹ | 0.25 × 10⁹ | 30.5 × 10⁹ | +7.4 |
| 2011–2020 | 17.9 × 10⁹ | 16.3 × 10⁹ | 0.28 × 10⁹ | 34.5 × 10⁹ | +13.1 |
Table 2.
Results of mitigation Scenario-I (changes in population/herd numbers) in the total GHG emissions (×109 kg CO2-eq/year) at the national level.
Table 2.
Results of mitigation Scenario-I (changes in population/herd numbers) in the total GHG emissions (×109 kg CO2-eq/year) at the national level.
| Scenario-I | Layers | Broilers | Backyards | Total | Difference (%) |
|---|---|---|---|---|---|
| Baseline (decade: 2011–2020) | 19.22 | 21.12 | 0.35 | 40.69 | --- |
| S-Ia (mortality improvement) | 19.67 | 21.25 | 0.35 | 41.27 | +1.4 |
| S-Ib (self-efficiency improvement) | 20.93 | 27.42 | 0.35 | 48.70 | +19.7 |
| S-Ic (decline of industrial population, increase in backyard) | 17.29 | 19.01 | 0.38 | 36.68 | −9.8 |
Table 3.
Results of mitigation scenario-III (changes in manure management system) in total GHG emissions (×109 kg CO2-eq/year) at the national level.
Table 3.
Results of mitigation scenario-III (changes in manure management system) in total GHG emissions (×109 kg CO2-eq/year) at the national level.
| Scenario-III | Layers | Broilers | Backyards | Difference (%) |
|---|---|---|---|---|
| Baseline (decade: 2011–2020) | 19.22 | 21.12 | 0.35 | - |
| S-III_La 1 (dry-lot) | 16.54 | N/A | N/A | −13.9 |
| S-III_Lb 1 (pit-storage, dry-lot, solid storage) | 18.99 | N/A | N/A | −1.2 |
| S-III_Br_aa 2 (solid storage) | N/A | 23.48 | N/A | +11.2 |
| S-III_Br_b 2 (solid storage, manure with litter) | N/A | 21.29 | N/A | +0.8 |
| S-III_Bk_a 3 (daily spread) | N/A | N/A | 0.20 | −42.9 |
| S-III_Bk_b 3 (daily spread, pasture spread, solid storage) | N/A | N/A | 0.30 | −14.3 |
Scenarios S-III represent changes related to manure management in: 1 Layers (S-III_La, S-III_Lb), 2 Broilers (S-III_Br_a, (S-III_Br_b), and 3 Backyard populations (S-III_Bk_a, S-III_Bk_b) with respect to the baseline scenario (see Section 2.4.3). N/A represents no applicable parameters for the respective scenarios.
Disclaimer/Publisher’s Note: The statements, opinions and data contained in all publications are solely those of the individual author(s) and contributor(s) and not of MDPI and/or the editor(s). MDPI and/or the editor(s) disclaim responsibility for any injury to people or property resulting from any ideas, methods, instructions or products referred to in the content. |
© 2023 by the authors. Licensee MDPI, Basel, Switzerland. This article is an open access article distributed under the terms and conditions of the Creative Commons Attribution (CC BY) license (https://creativecommons.org/licenses/by/4.0/).
Share and Cite
MDPI and ACS Style
Akamati, K.; Laliotis, G.P.; Bizelis, I. Greenhouse Gas Emissions of the Poultry Sector in Greece and Mitigation Potential Strategies. Gases 2023, 3, 47-56. https://doi.org/10.3390/gases3010003
AMA Style
Akamati K, Laliotis GP, Bizelis I. Greenhouse Gas Emissions of the Poultry Sector in Greece and Mitigation Potential Strategies. Gases. 2023; 3(1):47-56. https://doi.org/10.3390/gases3010003
Chicago/Turabian StyleAkamati, Konstantina, George P. Laliotis, and Iosif Bizelis. 2023. "Greenhouse Gas Emissions of the Poultry Sector in Greece and Mitigation Potential Strategies" Gases 3, no. 1: 47-56. https://doi.org/10.3390/gases3010003