
Evaluation of Heat Decarbonization Strategies and Their Impact on the Irish Gas Network


School of Chemical and Bioprocess Engineering, University College Dublin, 8Q4J+HJ Dublin, Ireland
*
Author to whom correspondence should be addressed.
Gases 2021, 1(4), 180-198; https://doi.org/10.3390/gases1040014
Submission received: 6 November 2021
/
Revised: 2 December 2021
/
Accepted: 8 December 2021
/
Published: 17 December 2021
Abstract
:Decarbonization of the heating sector is essential to meet the ambitious goals of the Paris Climate Agreement for 2050. However, poorly insulated buildings and industrial processes with high and intermittent heating demand will still require traditional boilers that burn fuel to avoid excessive burden on electrical networks. Therefore, it is important to assess the impact of residential, commercial, and industrial heat decarbonization strategies on the distribution and transmission gas networks. Using building energy models in EnergyPlus, the progressive decarbonization of gas-fueled heating was investigated by increasing insulation in buildings and increasing the efficiency of gas boilers. Industrial heat decarbonization was evaluated through a progressive move to lower-carbon fuel sources using MATLAB. The results indicated a maximum decrease of 19.9% in natural gas utilization due to the buildings’ thermal retrofits. This, coupled with a move toward the electrification of heat, will reduce volumes of gas being transported through the distribution gas network. However, the decarbonization of the industrial heat demand with hydrogen could result in up to a 380% increase in volumetric flow rate through the transmission network. A comparison between the decarbonization of domestic heating through gas and electrical heating is also carried out. The results indicated that gas networks can continue to play an essential role in the decarbonized energy systems of the future.
1. Introduction
The advent of industrialization and the urbanization of society has led humans to spend more time indoors. At present, humans spend about 90% of their time indoors, 70% of which is at home [1]. Physical comfort (warmth) is one of the basic needs outlined by Maslow’s hierarchy of needs, and hence, we spend a lot of time and resources ensuring our comfort. Building heating and cooling is one of the primary energy-consuming sectors, contributing 40% of the primary energy consumption in the United States (USA) and the European Union (EU) [2] and results in between 30% and 36% of energy-related global CO2 emissions [3]. Approximately 50–70% of the total heating demand in Western countries consists of heating, ventilation, air-conditioning, cooling systems (HVAC), and 30–50% is spent on water heating [4].
The energy sources for the heating in Europe primarily consist of fossil fuels (coal, oil, and natural gas). Approximately 70% of residential heat in the EU was from fossil fuels in 2015 [5], and even in developed countries, e.g., Ireland, many old buildings still have an open fireplace for heating that uses solid fuels to heat water [6]. The housing stock in Ireland has been identified as amongst the least energy-efficient in Northern Europe [7] and is characterized by large amounts of heat wasted due to the low energy-efficiency devices [4,8]. Therefore, there is the potential to reduce the carbon emissions of the Irish heating sector through the efficient use of natural gas. Residential heating and cooking consumed 13% of the overall gas consumption in Ireland in 2019, while 30% of gas demand was in the non-residential heating sector, and 58% was for power generation [9]. The Irish gas network primarily provides gas for power generation, and compared to the rest of the EU, it is extensive and modern, reaching all major urban areas [10]. It can be considered underutilized in efforts to decarbonize heating.
Total building heating and cooling energy demand can be split into residential, commercial, and industrial buildings, where residential buildings account for approximately 75% of the total European building floor area [11]. Since 79.6% of residential building energy demand is due to water and space heating [12,13], decarbonizing the residential heating sector, in particular, would significantly contribute to reducing carbon emissions from buildings [14]. The commercial/public service sector contributes to approximately 20% of the overall heat demand. In both the residential and commercial heating sectors, the electrification of heat by installing heat pumps improves energy efficiency and can achieve decarbonization goals. Heat pumps require high levels of insulation in buildings, as the efficiency of heat pumps is higher when the final heating temperatures are below 40–45 °C, making them an efficient choice for residential heating [15,16] where a constant temperature is maintained. For residential heating, the coefficient of performance of heat pumps is typically in the range of 3–5, and their use could save €500 a year in running costs compared to conventional electrical and fueled heating technologies [17,18]. The high upfront costs of residential heat pumps (€5000–€45,000) [18] coupled with the high insulation requirements make them a more suitable choice for high-end buyers or new developments. Therefore, additional policy measures and supports from governments are required to upgrade existing buildings and promote the use of heat pumps. The electrification of heat in low-heating demand sectors can be effective at reducing CO2 emissions [19,20]; however, gas boilers will still be required to meet peak and high heat demands [21].
While efforts toward decarbonizing the low heating demand sector focus on retrofits and the electrification of heat, the decarbonization of high heat demand would include replacing carbon-intensive fuels with low or zero-carbon substitutes, such as natural gas and hydrogen. The decarbonization pathways for residential and commercial buildings are as follows:
- Demand reduction;
- Renewable gas (Gasification/Biomethane/Hydrogen);
- Electrification of heat (Heat pumps);
- Increased efficiency of energy use (Integration of heat networks, Insulation).
The weighting of various decarbonization pathways against their decarbonization potential and cost is outlined in Table 1. This provides an overview categorizing the pathways based on their decarbonization potential and their relative cost. The prosumer method of decarbonization is when individual end-users use their own initiative to lower their carbon footprint through the installation of renewable energy generation and reduction of their energy demand. Given it requires individual initiative and financing, it is beyond the reach of many individuals. Reducing the energy consumption of home heating through insulation can achieve significant carbon reductions; however, retrofitting homes requires significant monetary (between €30,000 and €80,000) and time investments [22,23], meaning it is not attractive to all income groups and requires significant subsidies to encourage uptake. Although stated in the report by Ervia (2018) [24] as a low-cost pathway, when the cumulative cost of insulating all necessary buildings is taken into account, it results in a significant cost. Biomethane produced from the gasification of wood or crops such as wheat/maize and anaerobic degradation of plant and animal wastes can be used to decarbonize the gaseous feedstock [25,26]. Using biomass conversion to Synthetic Natural Gas (SNG) is a practical approach toward decarbonization, as it does not require any change to the gas pipeline infrastructure; however, it requires a large production of biomass for conversion to biomethane to meet the gas demand. SNG and biomethane are similar in composition to natural gas, and with infrastructure for natural gas already in place, it is a low-cost option for end-users, as no capital expenditure is required to upgrade equipment. Another method for the decarbonization of heat involves recovering waste industrial heat and supplying it to surrounding buildings. This requires an integrated heat network and therefore has limited opportunity in existing developments. In Ireland, the district heating infrastructure is less than 1% of the heat market compared to a European average of 10% [24,27,28].
The inclusion of hydrogen into gas networks, either alone or with natural gas, can contribute to its decarbonization. Hydrogen has a high potential for decarbonization because it emits only water as a by-product. Despite this strong potential, it has some major drawbacks. First, a 100% hydrogen system may require the entire piping system to be changed from steel to polymer/fiber-reinforced pipelines to prevent pipe embrittlement [29] and increased joint inspection for leaks [30]. Second, engines or burners need to be refitted to accommodate for hydrogen [31]. Third, additional safety measures to add color and smell to the gas are needed [32]. Hydrogen, for gas decarbonization, has a strong research consensus as a potential zero-carbon source for gas decarbonization, and many hydrogen cities are presently being developed in Rotterdam, Netherlands (HyWay 27) [33], Leeds UK (H21 Project) [34], and Tokyo, Japan (HARUMI FLAG) [35], to analyze the practical implications of moving to hydrogen. When looking at a city/community of buildings, a simple and practical investigative approach to analyze the system-level effects of increasing the energy use efficiency in the heating sector and understand the challenges that could be encountered in the gas network would be beneficial.
Ireland has resolved to undertake an ambitious mission to transform into a low-carbon economy by 2050. Transforming to an energy system dominated by renewable electricity requires significant investment in changing the technology in the end-use sectors. During this transition, end-use technologies that use fossil fuels are still economical, especially for intermittent high-energy demands, e.g., domestic and industrial heating. Natural gas as a low-carbon fuel will continue to be part of the energy mix until 2050. This beckons the research question for the study; i.e., how does the decarbonization of the heating sector impact the gas demands and the use of gas in Ireland?
A combination of EnergyPlus and MATLAB was used to analyze the effect of deep retrofits in buildings using natural gas for heating on Irish gas network demand as of 2016. EnergyPlus is a commonly used building energy simulation tool that generates building energy demand data. Combining EnergyPlus with Design Builder or other Graphical User Interface (GUI) simulation tools is commonly used by research engineers, architects, and researchers to obtain building energy consumption data. In addition, EnergyPlus has an extensive database of building codes developed by the United States Department of Energy (US DOE). EnergyPlus enables the user to create more detailed simulations of buildings rather than HVAC components as in other building simulation tools.
Research in building simulation has mainly focused on simulating a specific building and understanding the impact of increased energy efficiency measures on the total electricity and gas consumption. Pan et al. (2010) [36] used EnergyPlus alongside a GUI simulation tool Design Builder to visualize and change the specific geometry of the building, such as daylight dimming and occupant sensors and compared it with the energy demand data from an actual building. Mambo et al. 2013 presented a model to improve the energy efficiency and CO2 savings in a UK airport terminal building using actual data and real-time occupancy behavior [37]. Research studies on the effect of decarbonization of heat on the gas network are limited. Haghi et al. (2020) [38] focused on addressing a multistakeholder approach to optimizing total systems cost in an energy system. Their results indicated that at higher carbon prices, with constant renewable electricity penetration, natural gas boilers remain the primary heat source, contributing to 80% of the demand for heating, and that heat pumps are cost-effective for consumers only at carbon prices above £100 per ton of CO2. Other related studies include Bauermann et al. (2014), where they focused on increasing renewable electricity penetration and heat supply technologies to reduce the heating supply cost and CO2 emissions using General Algebraic Modeling System [39].
Thermal retrofits are still essential when transitioning toward electrical heating, as heat pumps are only effective in well-insulated homes. Gas heating could exploit this necessity, and buildings using gas heating could still garner significant cost benefits by retrofitting homes and reducing their energy consumption. Studies on cost and carbon savings obtained with thermal retrofits to the current Irish building stock identified a theoretical potential to reduce carbon emissions by 44% in new buildings [40].
In Ireland, the industrial sector primarily uses gas to provide high-temperature heat. Assessing the pathways for the decarbonization of industrial heat demand does not include a change to devices or process/efficiency improvement. It is beyond the scope of this study to delve into the specifics of each industrial user. Instead, an analysis of the effect of switching to low or zero-carbon fuels (natural gas and hydrogen) in combination with the decarbonization of buildings is carried out to add context to the decarbonization pathways set out for low and high heating demands. The combined effect of these changes in sectors connected to the Irish gas network is obtained.
This study examines the impact of heat decarbonization policies prioritized by the Irish government on the gas network and advances the study using a novel approach. It provides a more practical approach by using outputs from EnergyPlus, which provide a helpful framework for bridging the divide between building energy modelers and energy systems models. To understand the effects of increasing insulation in buildings and increasing gas boiler efficiency, an estimate of the effect of these measures on the gas network is obtained.
Each sector is considered separately, and the combined effect of decarbonization on the gas demand in the transmission network is discussed. This research aims to provide:
- A deeper understanding of the effect of decarbonization strategies on gas demand profiles, and
- Investigate the potential of the gas network in aiding a low-carbon energy system by exploiting the existing gas infrastructure.
This study does not consider potential scenarios such as converting oil/fuel-based heating in residential or commercial sectors to gas-based heating. Analysis of these scenarios requires additional details on the location of these homes and their access to the gas network. Other limitations of the study include overestimating the insulation required in commercial buildings, which means the building consumes more energy to maintain indoor comfort, as heat penetration during the warmer months is limited by the additional insulation. However, it does provide a modeling basis for these studies to be carried out in the future. Valuable information to gas network operators and energy systems researchers on the technical impact of decarbonizing the heating sector on gas demand is provided in this work.
2. Materials and Methods
A modeling approach was developed to evaluate the effect of heat decarbonization pathways on the overall gas demand and consumption profile in both the distribution and transmission natural gas networks in Ireland.
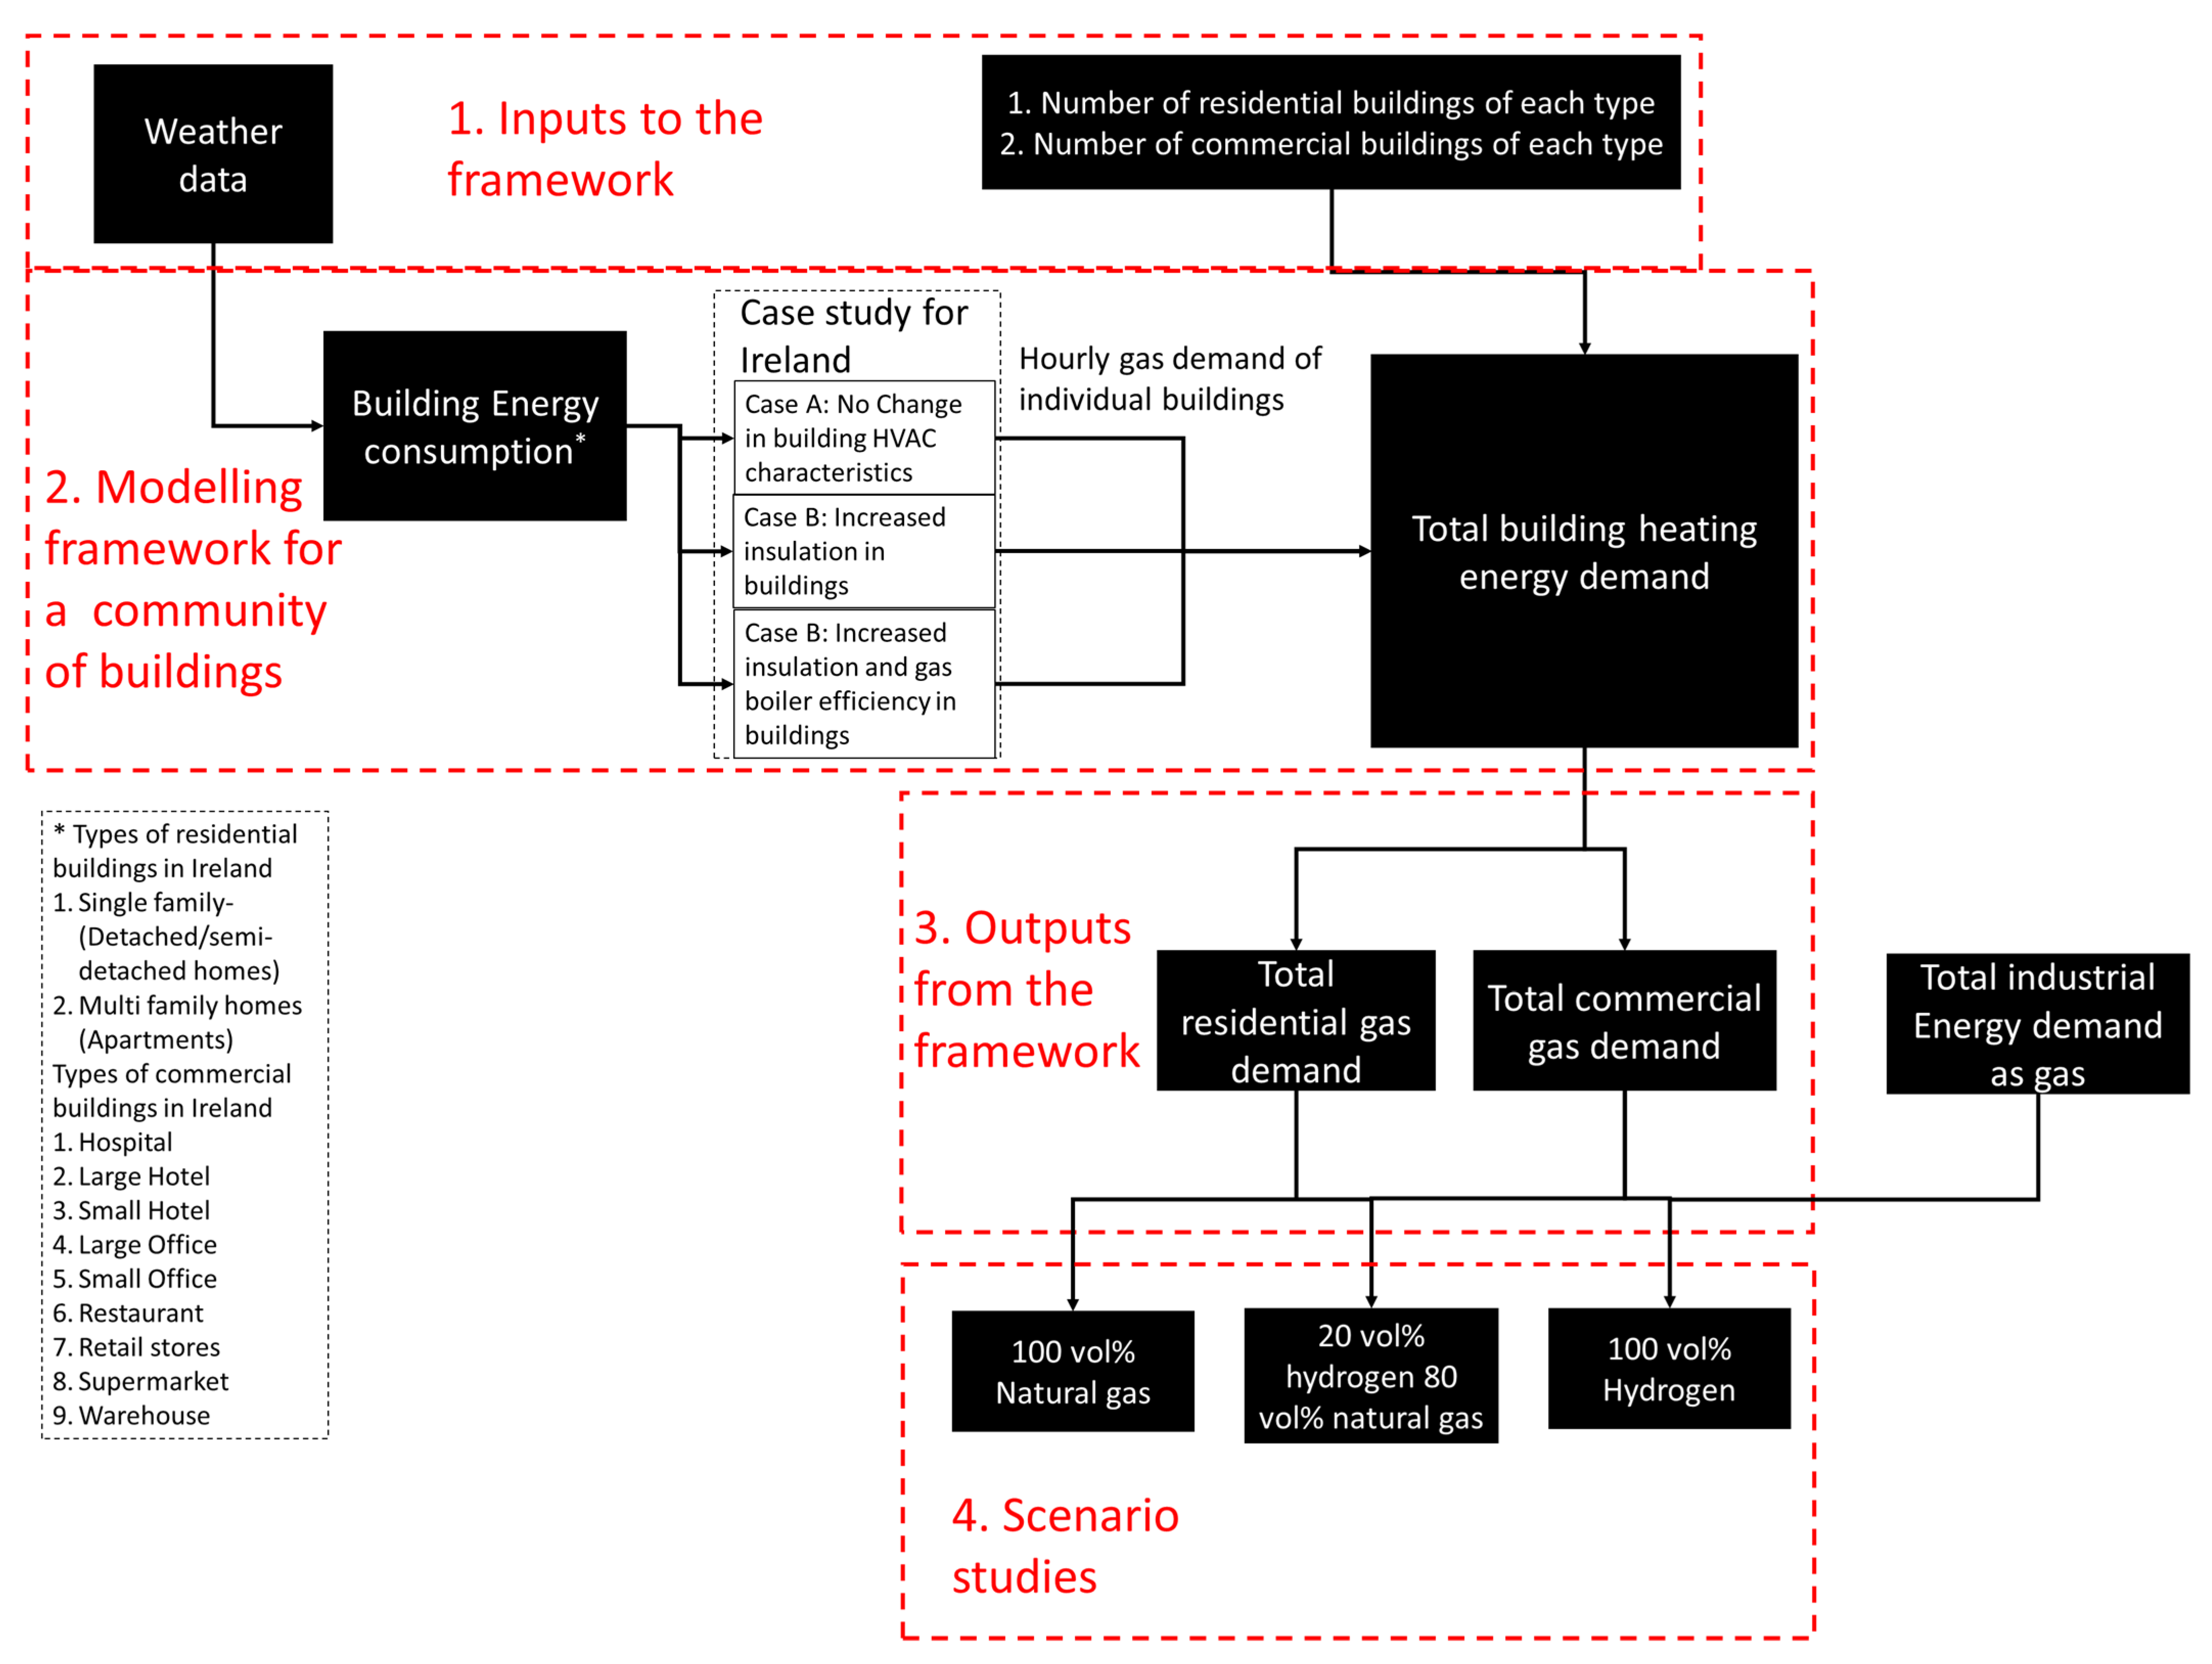
Individual building consumption profiles are evaluated to determine how building improvements impact gas demand in the distribution network. The gas heating demand for residential and commercial buildings in Ireland was calculated using a combination of two engineering software programs: EnergyPlus (version 9.4) and MATLAB (version 2018a). Figure 1 outlines the practical input-driven approach methodology for assessing the effect of building heat decarbonization.
Many standard residential and commercial building types exist within EnergyPlus, and their energy consumption is obtained using reference building models from the US DOE (www.energy.gov, accessed on 5 November 2021) website [41]. These reference building models are equated to an equivalent Irish building type, as provided by the Central Statistics Office (CSO) Ireland (Table 2).
For EnergyPlus to determine the energy consumption for each building, it must be provided with information regarding the type of heating system, including boiler efficiency, insulation properties including the thermal conductivity and thickness of the material, and weather conditions. Since EnergyPlus contains 17 sets of building codes from the USA; Salem, McNary, Oregon USA was selected in a temperate marine climate zone, which is similar to Irish climatic conditions. Hence, residential and commercial building codes representative of this region are used. Then, the weather data for Dublin, Ireland, obtained from the EnergyPlus website [42], were used as an input in the model to obtain the gas consumption of each building type. Then, the software is run for three cases as outlined in Table 3.
Case A consisted of raw data for buildings obtained from EnergyPlus. The U-values for the insulation layers were obtained from the building surface details in EnergyPlus files.
On average, commercial buildings are poorly insulated, except for wall insulation. The average area-weighted wall insulation (combination of internal and external insulation) in residential buildings was calculated to be 0.38 W/m2 K. For Case B, U-factors of 0.13 W/m2 K, 0.15 W/m2 K, 0.16 W/m2 K, 0.14 W/m2 K, and 0.84 W/m2 K [43,44,45] are considered for the attic insulation, external wall insulation, internal wall insulation, floor insulation, and window glazing, respectively. These values represent the ambitious levels of insulation that can be achieved for residential and commercial buildings in Ireland for an “A”-rated building. In addition to increased insulation, another commonly practiced demand reduction approach in residential and commercial buildings is to increase energy-use efficiency. For buildings with gas heating, the efficiency of gas boilers can be improved to 95% (E1) [46]. This represents Case C, where the gas boiler efficiency is improved in addition to thermal retrofits. EnergyPlus uses these inputs to calculate the overall gas demand of buildings. The outputs from the EnergyPlus simulation included the gas and electricity demand for individually modeled buildings. The building gas demand data are used as an input for the MATLAB model, which calculates the total gas demand for Ireland’s residential and commercial buildings. Then, the overall gas demand was calculated using Equation (1).
Total gas demand = ∑ (Ni · GDi)
N = number of buildings, GD = gas demand in kWh, and i = type of building. Equation (1) generates a matrix containing the quarter-hour gas demand for each day.
Then, MATLAB was used to collate the outputs from EnergyPlus and generate the heating gas demand of the entire Irish building stock. According to the Sustainable Energy Authority of Ireland, there are 1,697,665 residential buildings and 109,086 commercial buildings (SEAI) [47,48] as of 2016. Table 4a,b contain a breakdown of the types of buildings and their heating sources.
It was not possible to find a breakdown of the heating sources for commercial buildings in Ireland. Therefore, an estimate of the percentage of commercial buildings that consume gas was generated. Using the information on the number of residential and non-residential gas meters in Ireland in 2016 was obtained from the CSO website [47]. Approximately 6.76% of Ireland’s population (about 321,676 people as of 2016 [50]) do not have the possibility of a gas network connection owing to the location of gas network pipelines. Furthermore, not all regions have a gas pipeline, and even in those that do, the pipeline only serves major urban centers [51]. Therefore, from the data in Table 4b, only 21% of residential buildings use gas as their primary heating source, which is 356,510 residential buildings in total. This 21% was also taken as the number of commercial buildings that use gas, which is 22,894. The analysis of the results was carried out in two steps. First, the results of building energy consumption obtained from EnergyPlus were used as inputs in MATLAB. Second, a model with the number of residential and commercial buildings in Ireland was developed in MATLAB to calculate the overall gas demand. As a result, the amount of decarbonization that can be achieved using the two demand reduction approaches, namely (1) increasing the insulation in gas-heated buildings and (2) increasing the efficiency of natural gas boilers, is obtained. Additionally, the combined effects of residential and industrial fuel demands shifting to low-carbon fuels (i.e., natural gas and hydrogen) on the overall demand for gas were also obtained.
2.1. Building Model Validation
The residential and commercial building models were validated by comparing the overall electricity and gas demand obtained using EnergyPlus and the gas demand reported by SEAI for residential and commercial buildings (Table 5). In addition, a curve-fitting tool (lsqcurvefit), i.e., a non-linear least squares solver, was used in MATLAB to obtain the number of each residential and commercial building using gas for heating. The total gas consumption of residential and commercial buildings obtained from the curve fitting model was compared to the actual gas consumption in the heating sector as of 2016 [52]. This is used to reference the number of buildings included in the model and aids in understanding the system-level changes in the transmission network due to gas demand transformation resulting from heat decarbonization strategies.
The model was validated against the values obtained from the CSO and SEAI websites (Table 5). While there is a discrepancy in the number of buildings obtained by curve fitting and the actual number of residential and non-residential (commercial and public services) connected to the gas network, the difference is less than 1%. The slight difference may be due to differences in the building codes between the USA and Ireland. The model assumes that the gas consumption for all buildings in a given type is homogeneous, which is not an accurate reflection of the variation within a building type. Additionally, there are differences between apartment buildings that contain on average 6 dwellings per building in Ireland [49] and 20 dwellings in a multi-family home in Salem, Oregon, USA [53]. The multi-family building model from EnergyPlus consists of 18 living units per multi-family home [52]. The breakdown of the number of buildings used in the model was calculated using the curve-fitting tool, and the results were obtained (Table 5).
An additional analysis was carried out to compare the carbon intensity of a single-family home using gas heating and a single-family home using a heat pump. This analysis is intended to add context to the role of gas for heating during the transition to 100% renewable electricity. Since the carbon intensity of electricity in Ireland is currently higher than that of natural gas, residential and commercial buildings using gas for heating could potentially reduce carbon emissions with thermal retrofits.
2.2. The Combined Effect of Residential and Industrial Decarbonization
For the decarbonization of industrial heat demand, the stagewise conversion of all industrial processes to lower carbon fuels was considered.
- Scenario 1: Conversion of all industrial heat demands to natural gas.
- Scenario 2: Conversion of the natural gas network to a blended network with a mix of hydrogen (20 vol %) and natural gas (80 vol %).
- Scenario 3: Conversion of the natural gas network to a 100% hydrogen network.
Scenarios 1 and 2 do not require a significant change in the current gas infrastructure, whereas Scenario 3 may require upgrades of gas pipelines to accommodate 100% hydrogen [55]. The decarbonization potential of the primary industrial sector was identified based on the energy consumption in the 8 major industrial sectors in Ireland (Appendix A). Decarbonization potential in sectors, i.e., replacing carbon-intensive fuels with gas, is obtained, and the reduction in CO2 emissions in Scenarios 1, 2, and 3 is calculated. The residential, commercial, and industrial sector results were combined, and the overall change in volumetric gas consumption and CO2 emissions was calculated to identify the decarbonization achievable using gas-based vectors in the heating sector.
Fraction decrease in CO2 emissions = ∑ ((ECi · CCi) − (ECi · CCNG))/(ECi · CCi)
EC is the energy consumed by a carbon-intensive fuel in MegaJoules, CC is the carbon content of the fuel in kgCO2/MJ, CCNG is the carbon content in natural gas, and i is the type of fuel.
The resulting increase in the flow of natural gas is calculated by Equation (3).
where HHVNG is the higher heating value of natural gas (MJ/m3). A higher heating value for natural gas and hydrogen was used to represent the maximum heat utilization from burning the fuels.
Increase in flow of natural gas = ECi/HHVNG
Using Equations (2) and (3), the decrease in carbon emissions and increase in gas flow when switching from carbon-intensive fuels to natural gas was calculated.
The total increase in flow rates in Scenarios 1, 2, and 3 was calculated using Equations (4) and (5).
Total increase in flow = Energy consumed/((VNG · HHVNG) + (VH2 · HHVH2))
Total decrease in CO2 emissions = (Total increase in flow · VNG · SCENG/HHVNG)
VNG is the volume fraction of natural gas, VH2 is the volume fraction of hydrogen, HHVH2 is the higher heating value of hydrogen, and SCENG is the specific carbon dioxide emissions of natural gas (kCO2/MJ).
3. Results and Discussions
3.1. Building Heating Requirements
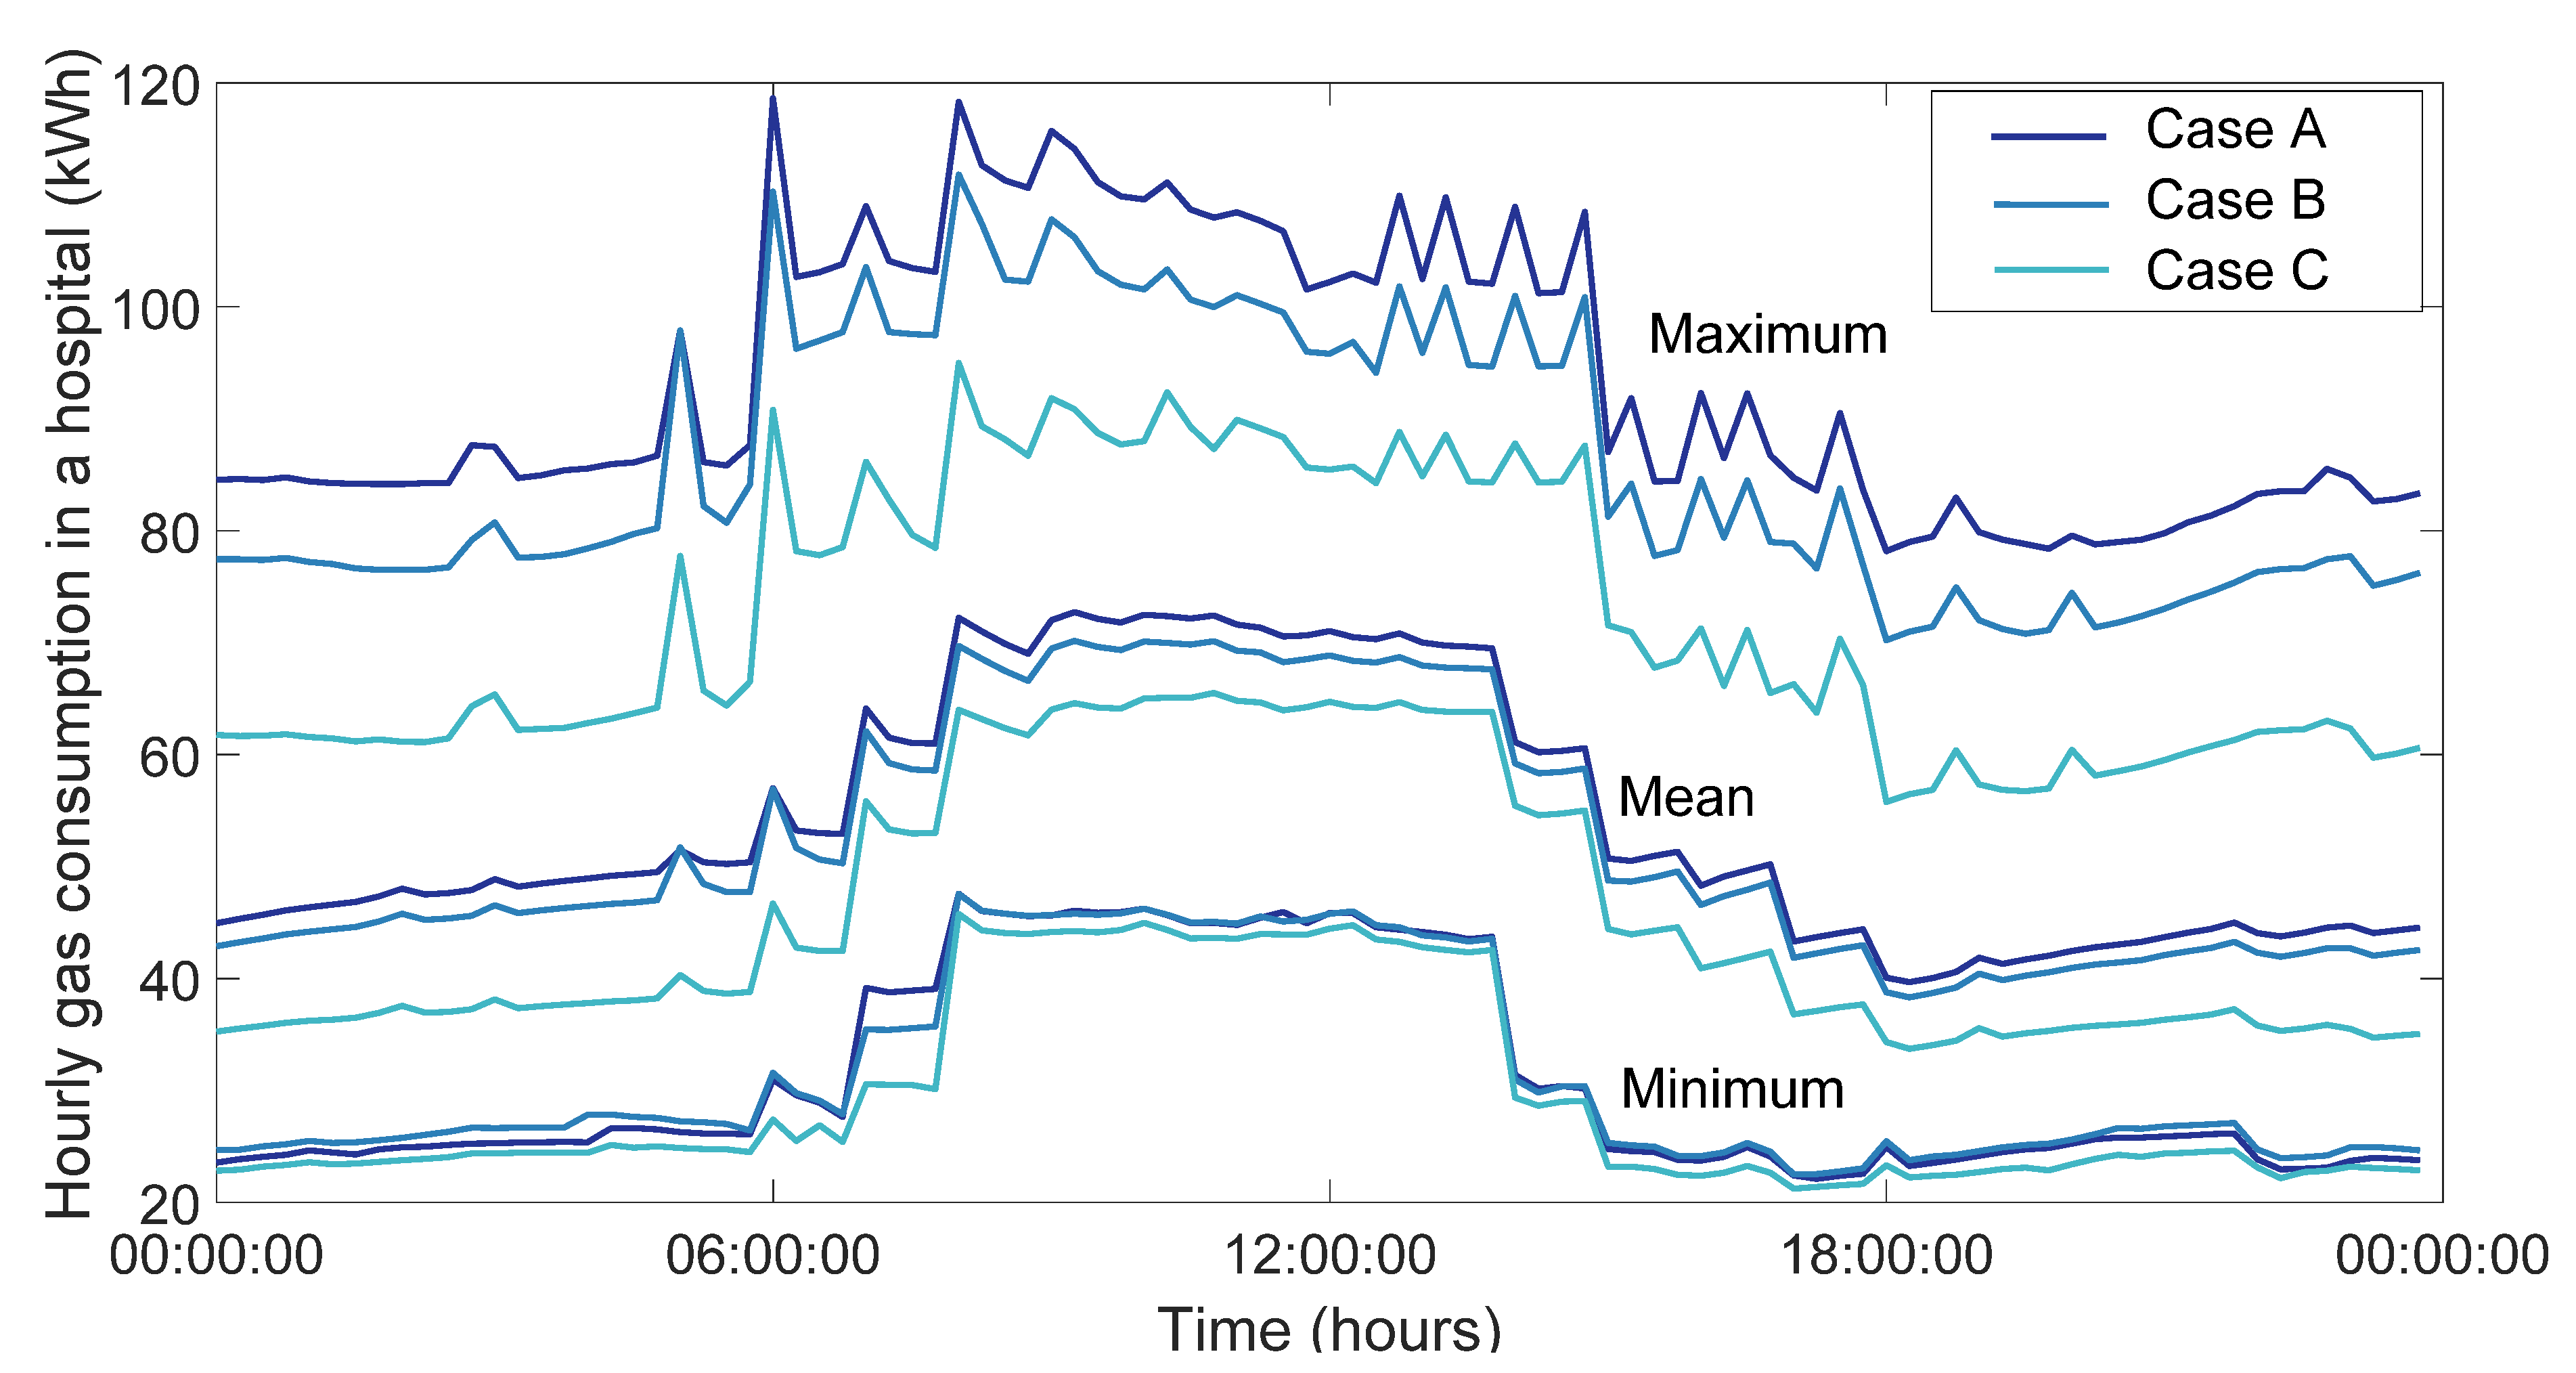
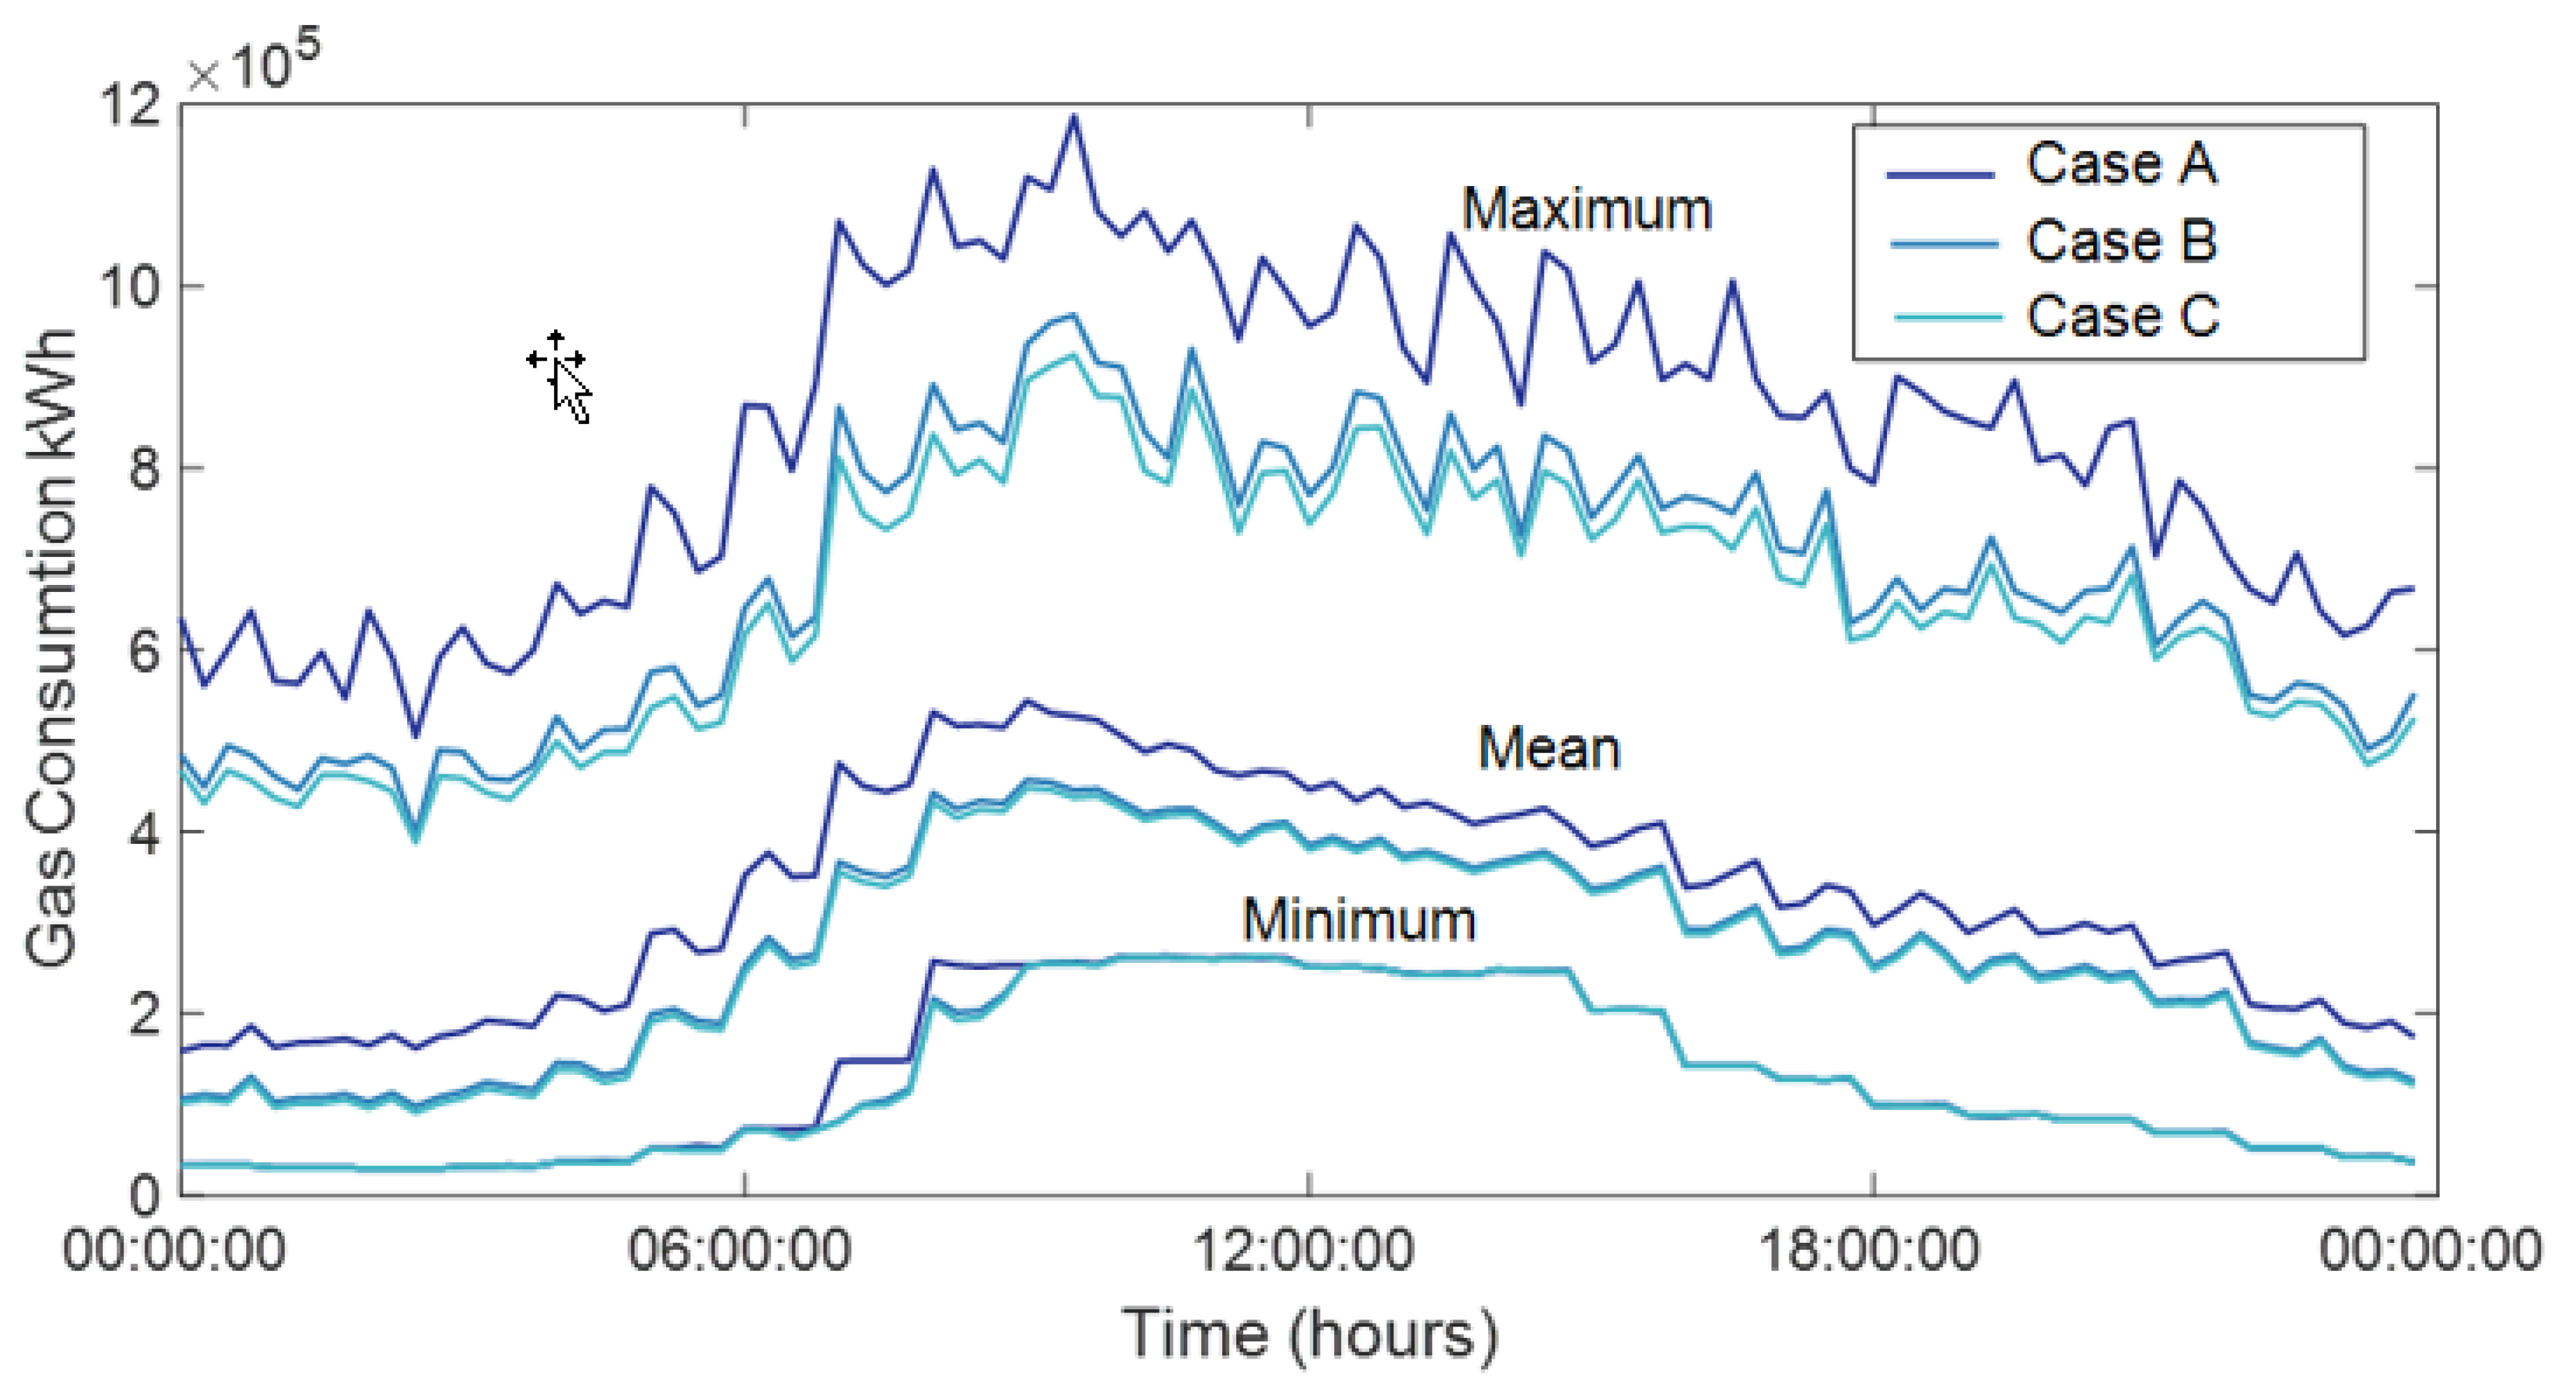
A daily gas consumption profile for each individual type of residential and commercial buildings is obtained from the EnergyPlus model. To illustrate the impact of the carbon-reducing measures, the maximum, mean, and minimum daily gas demand profiles for a hospital and a single-family home (Figure 2 and Figure 3) and the total gas consumption for the residential and commercial buildings (Figure 4) are graphically presented to show the change in the hourly gas consumption for buildings.
The natural gas demand for each building varies across the 24 h period, which is consistent with typical heating demands. Increased building insulation (Case B) makes a more significant reduction in gas consumption for a residential home than in a hospital due to it being an enclosed space. The increased insulation results in a more significant reduction in gas demand for a winter’s day which corresponds to the maximum daily usage in Figure 2, Figure 3 and Figure 4. Meanwhile, there is a significant increase in gas demand during working hours in the hospital throughout the year. The average gas consumption for a residential house in Ireland is 11,000 kWh [56], and for Case A, the individual home had an average gas consumption of 12,719 kWh, which reduced to 9903 kWh for Case B and 9668 kWh for Case C. The natural gas demand for the residential and commercial building sectors decreased by 18% and 19.9% in Cases B and C, respectively (Table 6). For the maximum gas demand profile, slight changes were observed in the commercial sector and more significant changes in the shape of the profiles were observed for the residential sector (Figure 3). It must be noted that the minimum hourly profile for a hospital shows that between 6 PM and 12 AM, Case B shows a slightly higher demand profile than Case A. This could be due to the over insulation of the buildings, where on a warm day, the additional insulation prevents heat entering the building from outside, thus requiring the heating to be turned on. Since ambitious targets of insulation are selected, this is a drawback to this approach.
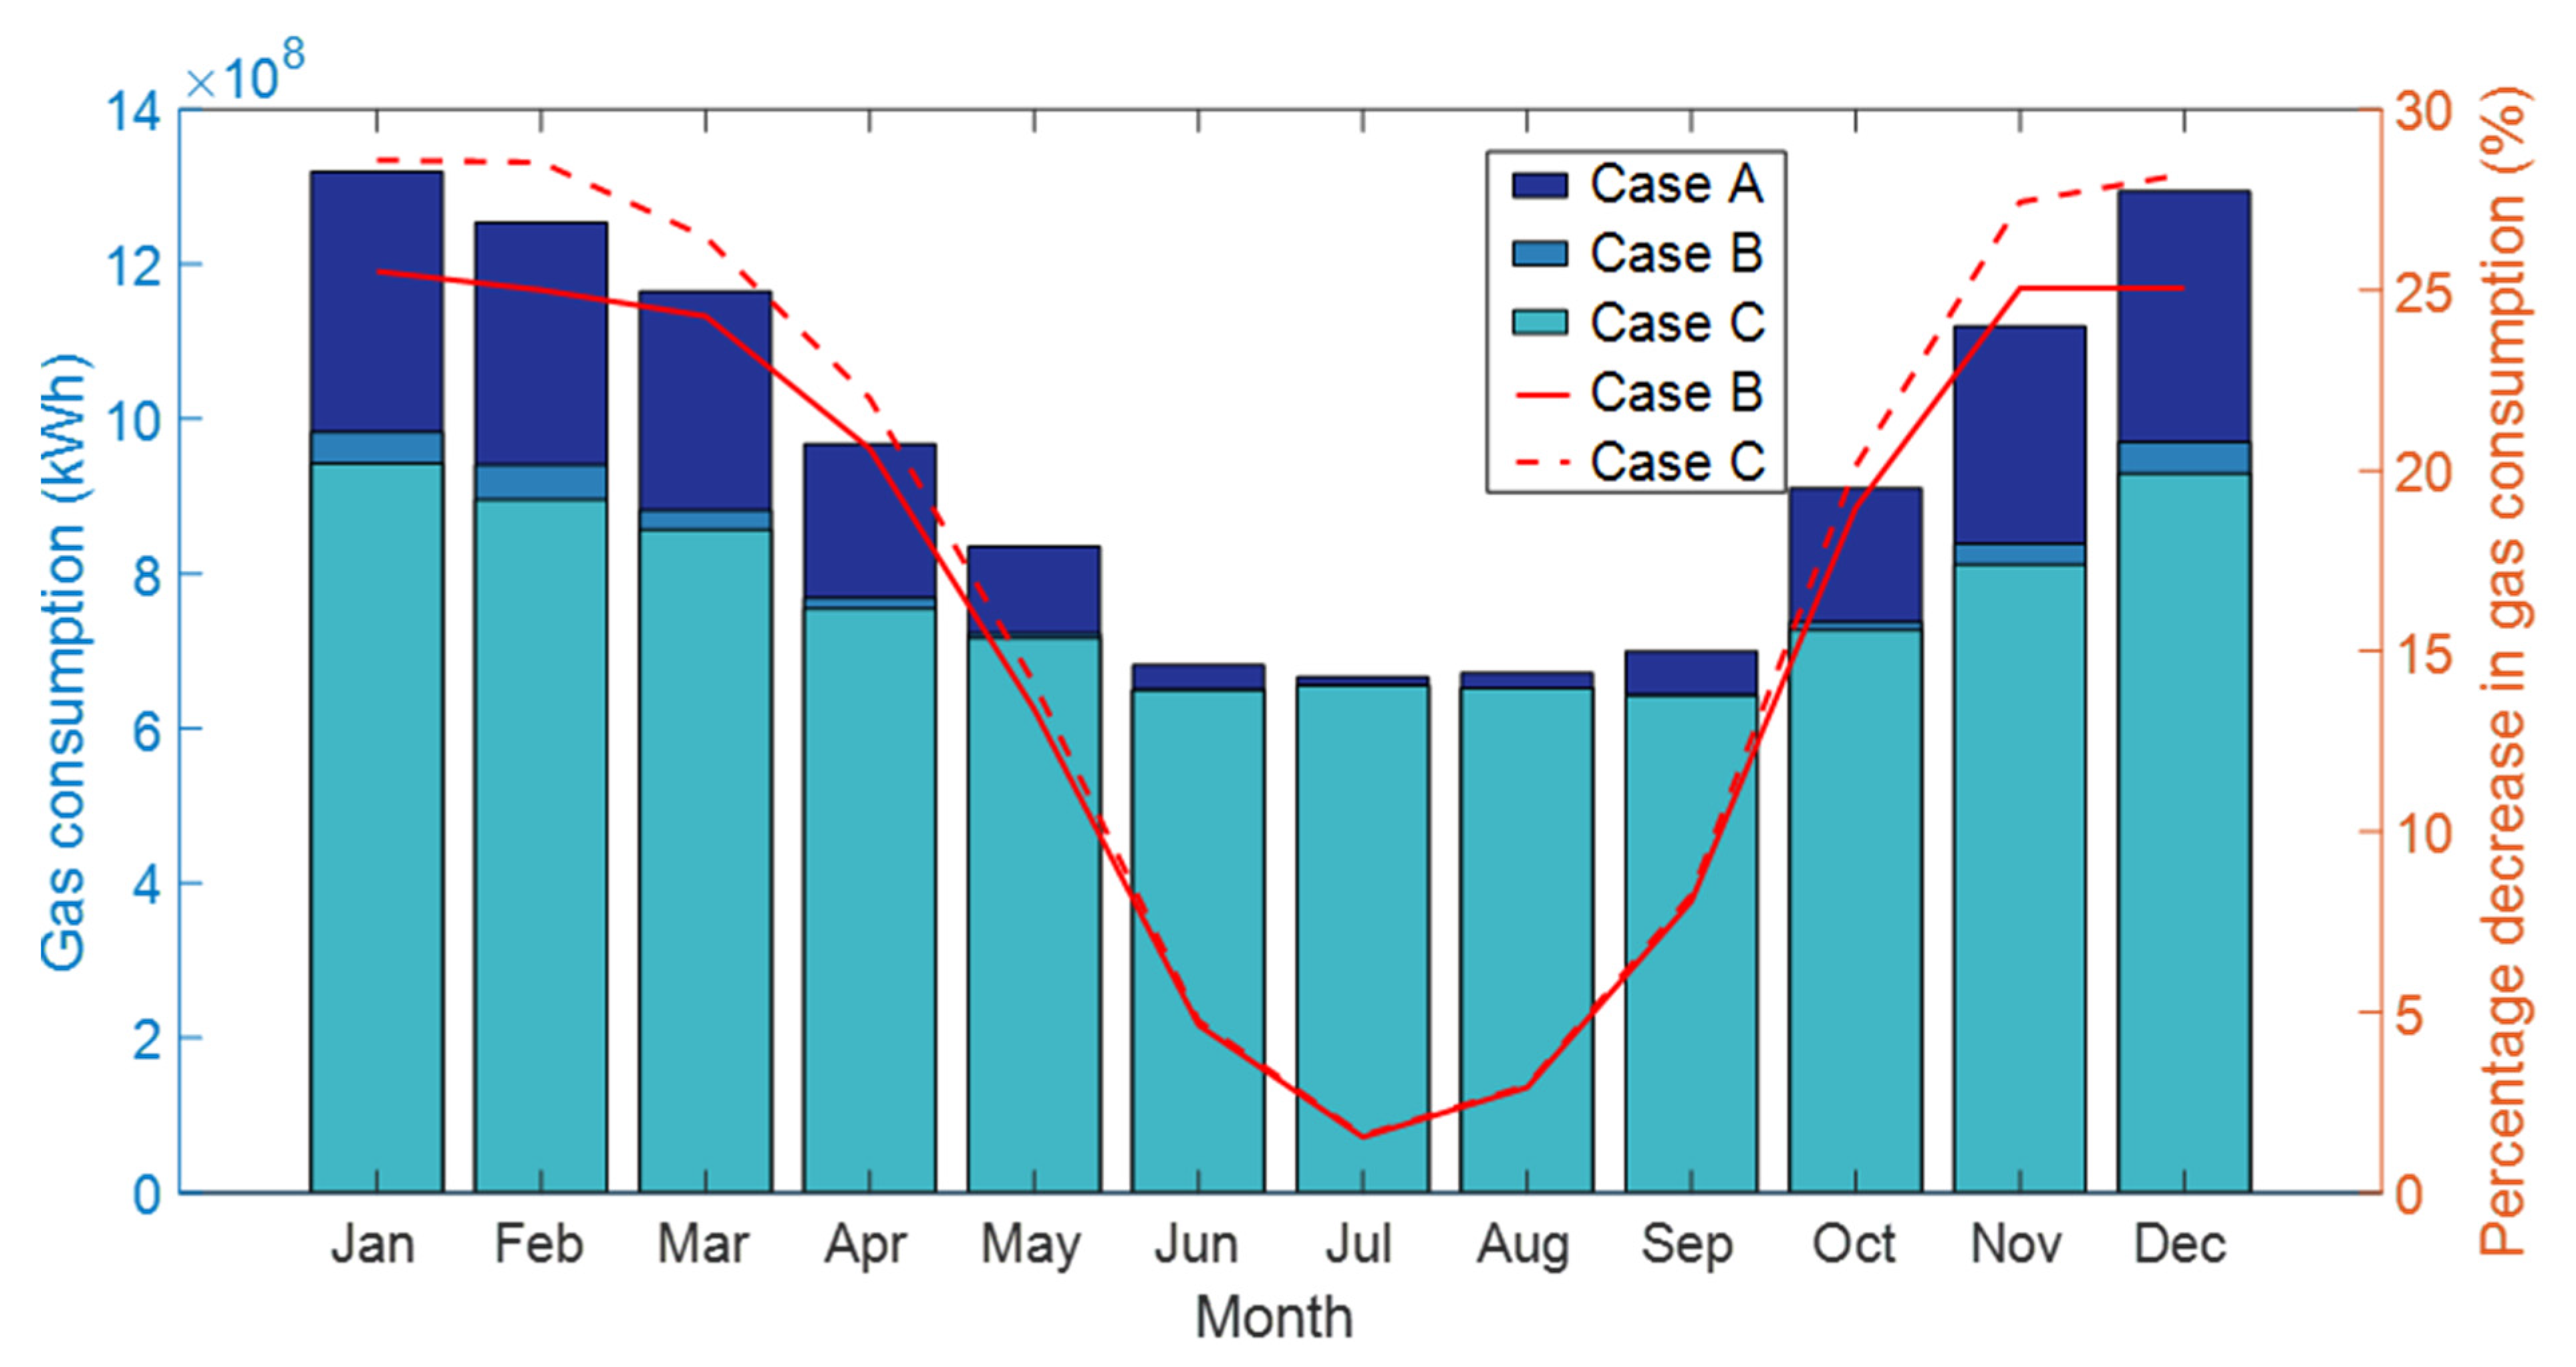
When the gas consumption for the residential and commercial buildings is aggregated on a monthly basis (Figure 5), it can be seen that there was a noticeably reduced impact of the energy-saving measures during the summer months. The primary demand for gas in the summer months is for cooking and water heating [57], not space heating, so additional levels of insulation have little or no impact. Up to a 25% reduction in gas demand for the heating of residential and commercial buildings can be observed during the winter months. The impact of the additional insulation is that the gas demand profile in the distribution network is more consistent throughout the year, with the difference between summer and winter gas demand reducing from approximately 90% in Case A to 40% in Case C. The results are in keeping with those by Wilson et al. [58], where for a similar climate, regardless of the future energy path, the energy demand in winter will continue to be greater than in summer. These increased efficiency measures additionally reduce the annual carbon dioxide emissions by 18% in Case B and 19.9% in Case C. While the results from this study are in agreement with those by Qadrdan et al. [59], and both show a decrease in gas demand for domestic heating, the causes are different, and in Qadrdan et al., the cause of the reduction in gas demand is due to increased heating from heat pumps.
The results show that thermal retrofits in buildings would significantly change the profile and volume of the gas consumption. To help gain insight into the effectiveness of the insulation in reducing gas demand, the individual measures were examined in detail. (Table 7). External and internal wall insulation and window glazing had the highest impact on gas consumption. Floor insulation leads to no decrease in gas demand. Similar studies on the Irish building stock showed that floor insulation does not impact the heat loss from residential buildings [60]. The cost of window glazing (from single glazing to double glazing) is the highest (245–299 €/m2), with an average payback period of 33 years [45,61]. Heat loss from windows accounts for only 10% of the heat loss in residential buildings. Heat loss from the walls and attic/roof accounts for 35% and 25% [6] of the heat loss, respectively. As a result of economies of scale, as roof/attic and walls account for a larger surface area of the buildings, the insulation costs are significantly low (approximately 100 €/m2 for wall insulation and 15 €/m2 for attic/roof insulation) [40] with an average payback period of 2–7 years, depending on the material used [60]. These factors need to be considered by individuals and companies when considering thermal retrofits in buildings.
3.2. Comparison with Electric Heating
Increased insulation in buildings is a requirement for the use of heat pumps. Depending on the level of insulation, this could cost between €400 and €600 (for attic insulation, up to €110,510 for a deep retrofit [61] (estimated at €778/m2 for a 142 m2 home), which could be cut down to €80,000 for privately owned homes based on SEAI grants in Ireland [61]. Along with the insulation costs, there is the additional capital cost of heat pumps, which could mean that the overall retrofit cost is beyond many homeowners. A comparison of the effect of thermal insulation on the total carbon emissions in a single family is made for gas heating and a heat pump supplied with electricity with different carbon intensities (Figure 6). The highest level of insulation in the buildings is representative of a passive home [62] (R = 6.5). Compared to a passive home with a heat pump, gas-heated homes have the potential to emit less CO2 emissions when the electrical networks carbon intensity is above 300 gCO2/kWh. In Ireland, the CO2 equivalent carbon emissions of electricity for 2016 was 424.9 gCO2/kWh [63], and while it is constantly reducing (375 gCO2/kWh in 2018), it is still higher than many other European countries (EU average 296 gCO2/kWh), so natural gas heated homes can have lower CO2 emissions. It is to be noted here that in the EnergyPlus building model, a heat pump with a Coefficient Of Performance (COP) of 2.5 was used. The COP is a crucial factor when evaluating the CO2 emissions of a heat pump; at higher COP values, heat pumps are more energy efficient, and this would change the trend lines in Figure 6. Countries such as Sweden (13.3 g/kWh), Denmark (166.1 g/kWh), and the UK (281.1 g/kWh), with lower electrical carbon intensities, will also have lower total CO2 emissions. While in Sweden, where electricity prices are 17 cents/kWh [64], and the price of natural gas is 11 cents/kWh [65], homes will have lower carbon emissions and lower heating cost utilizing a heat-pump. However, in countries such as Poland, which has the highest electrical CO2 emission intensity in Europe (773.3 g/kWh), thermal retrofits to buildings and gas heating could significantly reduce carbon emissions compared to heat pumps. Regardless of the energy source for heating, financial savings and carbon emission reductions can be achieved with increased building insulation. As the electricity network continues to decarbonize, and the associated carbon emissions decrease, the benefits of switching to heat pump will increase; however, the best solution will inevitably be determined on a case-by-case basis.
3.3. Gas for Industrial Heating
Incorporating zero-carbon fuels into the transmission and distribution gas network is an option that would benefit all natural gas end users. The potential for reducing carbon emissions in each industrial sector was calculated using Equations (4) and (5), and the combined change in gas demand (volume and CO2 emissions) of the invested measures on the industrial and heating sectors is presented in Table 8.
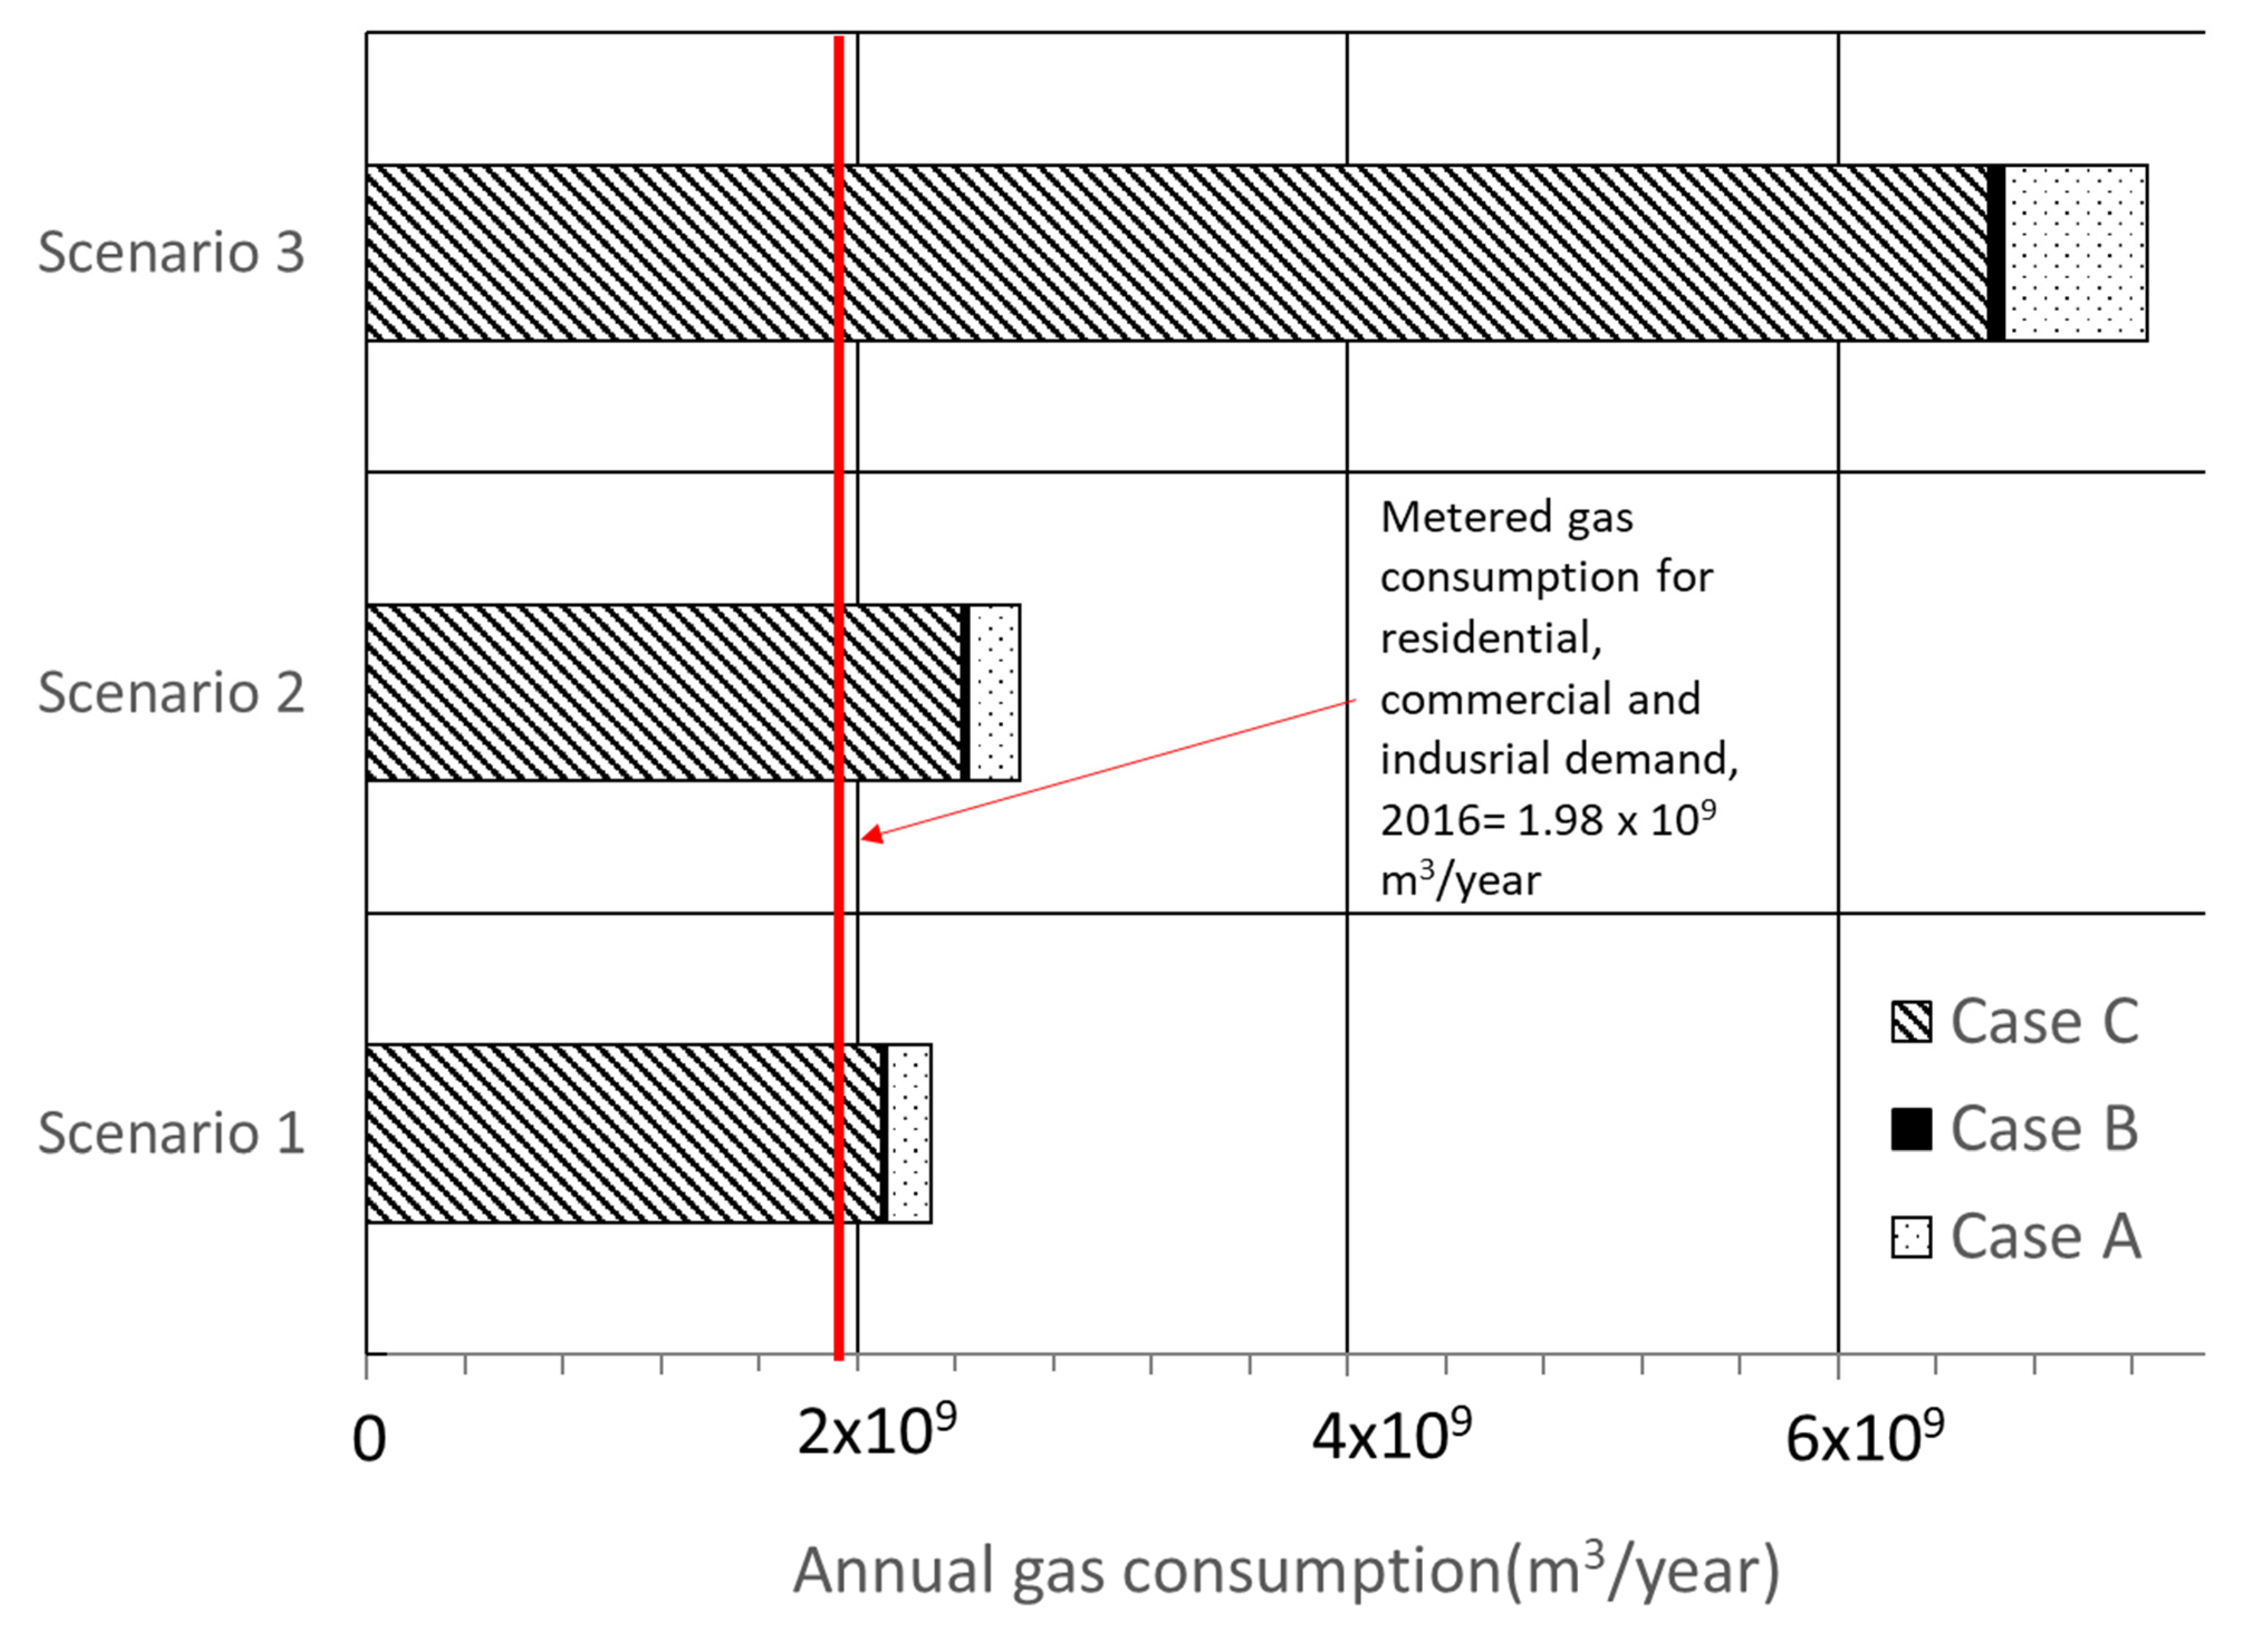
Natural gas demand increases when carbon-intensive fuels (coal, peat, and gasoline) are replaced by natural gas for industrial heating, as seen in Scenario 1 (Figure 7). The inclusion of hydrogen to further the transition toward a low-carbon economy in the residential, commercial, and industrial sectors would increase the flow in the gas network, (Scenarios 2 and 3). In addition, the decarbonization potential of the combination of the scenarios (Table 9) can vary between 4.36% and 100%. However, this comes with a penalty of increased flows of gas through the gas transmission and distribution network. In addition, the cost for green hydrogen production is projected to be $4 per kg H2 (120 €/MWh) [66], which is almost double the selling price of natural gas and is presently not cost-competitive with natural gas (approximately 50–78 €/MWh) [67]. Therefore, shifting to a hydrogen-based energy system can significantly reduce the carbon footprint; however, this will come with additional costs for both the network and the end user to upgrade the pipelines and the end-use devices.
A reduction of carbon emission by 33.79% from natural gas usage for heat in industry and buildings can be achieved using the current gas infrastructure (Scenario 2 and Case C). This aligns with the 40% decarbonization target for 2030 and sets Ireland on a path toward meeting the 2050 decarbonization goals. However, another factor to consider is the penalty of an increase in gas flow rate due to the inclusion of hydrogen, which is not proportional to the reduction in the CO2 emissions obtained. This needs to be considered in future scenarios that include more volume fractions of hydrogen in the gas network. In addition, the increase in the line pack efficiency leads to an increase in the energy price paid for an increased flow rate; i.e., hydrogen compression needs to be considered against the carbon savings obtained with higher volume hydrogen fractions.
4. Conclusions
An analysis of the increased energy efficiency measures in buildings shows that the gas consumption in the distribution network decreases, as well as with a significant reduction to variation in gas demand throughout the year. The reduction in gas consumption due to thermal retrofits, even when combined with the carbon emissions of natural gas, shows that well-insulated homes with gas heating can significantly reduce carbon emissions to levels comparable to homes with heat pumps. The reduction in energy demand and variation throughout the year provides the capacity requirements for the additional flowrates required when hydrogen is incorporated into the distribution gas network. For the high heating demands, such as the industrial sector, shifting from carbon-intensive fuels to natural gas/hydrogen reduces carbon emissions; however, the shift toward hydrogen comes with additional cost for both network operator and end user. Since the present policies and subsidies of the Irish government for reducing building heating emissions are directed toward improving building insulation and the installation of heat pumps, about a 17% reduction in carbon emissions from the gas network for heating can be achieved (Case B, in Scenario 1). The high percentage of privately owned homes (67.9% in 2016) combined with low demand for district heating in Ireland is a further incentive to improve insulation in homes.
The investigative approach used in this study is novel and has not been used previously to investigate the impact of heat decarbonization pathways on the gas network.
This study provides a well-scoped and keen insight into the decarbonization potential of the changing nature of gas used for heating in Ireland. Energy systems researchers and potential investors in natural gas and hydrogen technologies could use this study to assess gas pipelines’ potential use and capacity in a decarbonized future.
Author Contributions
Conceptualization, E.S.; methodology, E.S. and A.C.; modeling, A.C.; validation, E.S. and A.C.; formal analysis, E.S. and A.C.; investigation, E.S. and A.C.; writing—original draft preparation, A.C.; writing—review and editing, E.S.; supervision, E.S.; project administration, E.S.; funding acquisition, E.S. All authors have read and agreed to the published version of the manuscript.
Funding
This publication has emanated from research supported (in part) by Science Foundation Ireland (SFI) under the SFI Strategic Partnership Programme Grant Number SFI/15/SPP/ E3125. The opinions, findings, and conclusions or recommendations expressed in this material are those of the author(s) and do not necessarily reflect the views of the Science Foundation Ireland.
Institutional Review Board Statement
Not applicable.
Informed Consent Statement
Not applicable.
Data Availability Statement
Not applicable.
Acknowledgments
We would like to thank the Science Foundation Ireland and all the funders of the Energy Systems Integration Partnership Programme for making this possible.
Conflicts of Interest
The authors declare no conflict of interest.
Appendix A. Energy Consumption in the Industrial Sector in Ireland as of 2016
The values for gas consumption in the industrial sector were obtained from SEAI data. The top eight industrial sectors with an annual energy consumption of >50 KTOE were obtained (Table A1). These data can be used to verify the increase in gas consumption obtained when switching from carbon-intensive fuel to natural gas and hydrogen.

Table A1.
Fuel consumption in KTOE in the food, beverages, and tobacco industry in 2016.
| Industry—Food, Beverages, and Tobacco | Industry—Wood and Wood Products | Industry—Chemicals and Man-Made Fibers | Industry—Non-Metallic Mineral Products | Industry—Basic Metals and Fabricated Metal Products | Industry—Electrical and Optical Equipment | Industry—Other Manufacturing | Industry—Construction | |
|---|---|---|---|---|---|---|---|---|
| Bituminous coal | 21 | 0 | 0 | 86 | 0 | 0 | 0 | 0 |
| Milled peat | 1 | 0 | 0 | 0 | 0 | 0 | 0 | 0 |
| Sum of all petroleum products | 65 | 4 | 22 | 163 | 6 | 4 | 13 | 39 |
| Kerosene | 2 | 0 | 1 | 1 | 0 | 1 | 1 | 1 |
| Fuel oil | 20 | 0 | 5 | 3 | 1 | 0 | 4 | 0 |
| LPG | 26 | 0 | 2 | 2 | 2 | 2 | 5 | 0 |
| Gasoil/diesel/DERV | 17 | 2 | 4 | 33 | 3 | 1 | 3 | 38 |
| Petroleum coke | 0 | 0 | 10 | 124 | 0 | 0 | 0 | 0 |
| Natural gas | 241 | 2 | 115 | 17 | 368 | 15 | 32 | 17 |
| Sum of all renewable energies | 22 | 113 | 0 | 39 | 0 | 0 | 0 | 0 |
| Renewable waste | 0 | 0 | 0 | 38 | 0 | 0 | 0 | 0 |
| Biomass | 19 | 113 | 0 | 1 | 0 | 0 | 0 | 0 |
| Biogas | 2 | 0 | 0 | 0 | 0 | 0 | 0 | 0 |
| Electricity | 133 | 20 | 97 | 50 | 43 | 76 | 62 | 20 |
| Non-renewable waste | 0 | 0 | 0 | 42 | 0 | 0 | 0 | 0 |
| Total | 482 | 138 | 234 | 396 | 413 | 95 | 107 | 76 |
References
- Gray, W.A.; Timm, S. Approximately 90% of Our Time is Now Spent Indoors. Here’s How to Make Your Home a Healthier Place to Be. Delos, Innovate Well. Available online: https://delos.com.au/approximately-90-of-our-time-is-now-spent-indoors-heres-how-to-make-your-home-a-healthier-place-to-be/ (accessed on 3 February 2021).
- Cao, X.; Dai, X.; Liu, J. Building energy-consumption status worldwide and the state-of-the-art technologies for zero-energy buildings during the past decade. Energy Build. 2016, 128, 198–213. [Google Scholar] [CrossRef]
- Larsen, M.A.D.; Petrović, S.; Radoszynski, A.M.; McKenna, R.; Balyk, O. Climate change impacts on trends and extremes in future heating and cooling demands over Europe. Energy Build. 2020, 226, 110397. [Google Scholar] [CrossRef]
- Dirks, J.A.; Gorrissen, W.J.; Hathaway, J.H.; Skorski, D.C.; Scott, M.J.; Pulsipher, T.C.; Huang, M.; Liu, Y.; Rice, J.S. Impacts of climate change on energy consumption and peak demand in buildings: A detailed regional approach. Energy 2015, 79, 20–32. [Google Scholar] [CrossRef] [Green Version]
- Bertelsen, N.; Vad Mathiesen, B. EU-28 Residential Heat Supply and Consumption: Historical Development and Status. Energies 2020, 13, 1894. [Google Scholar] [CrossRef]
- Donnelly, J. (Ed.) Energy Efficiency in Traditional Buildings; Government of Irleand: Dublin, Ireland, 2010; p. 74.
- Ahern, C.; Norton, B. Thermal energy refurbishment status of the Irish housing stock. Energy Build. 2019, 202, 109348. [Google Scholar] [CrossRef]
- European Commission. Communication from the Commission to the European Parliament, the Council, the European Economic and Social Committee and the Committee of the Regions on an EU Strategy for Heating and Cooling; Commission Staff Working Document; European Commission: Brussels, Belgium, 2016; p. 101. Available online: https://ec.europa.eu/energy/topics/energy-efficiency/heating-and-cooling_en (accessed on 5 November 2021).
- CSO. Table 2A Networked Gas Consumption by Quarter 2011–2019. Available online: https://www.cso.ie/en/releasesandpublications/er/ngc/networkedgasconsumption2019/ (accessed on 5 November 2021).
- GNI. Vision 2050: A Net Zero Carbon Gas Network for Ireland; Report; Gas Networks Ireland, Ervia: Dublin, Ireland, 2019; p. 72. Available online: https://www.gasnetworks.ie/vision-2050/future-of-gas/GNI_Vision_2050_Report_Final.pdf (accessed on 5 November 2021).
- (BPIE), HotMaps Building Stock Analysis. 2020. Available online: https://bpie.eu/wp-content/uploads/2017/10/State-of-the-building-stock-briefing_26Ott_v1.pdf (accessed on 5 November 2021).
- Residential. Sustainable ENergy Authority of Ireland. Available online: https://www.seai.ie/data-and-insights/seai-statistics/key-statistics/residential/ (accessed on 5 November 2021).
- Clancy, M. Renewable Heat in Ireland to 2020, Achieving Ireland’s 2020 Renewable Heat Target: Analysis of Policy Options; Report; Sustainable Energy Authority of Ireland: Dublin, Ireland, 2015; p. 109. Available online: https://www.teagasc.ie/media/website/crops/crops/Renewable_Heat_in_Ireland_to_2020.pdf (accessed on 5 November 2021).
- Ürge-Vorsatz, D.; Cabeza, L.F.; Serrano, S.; Barreneche, C.; Petrichenko, K. Heating and Cooling Energy Trends and Drivers in Buildings. Renew. Sustain. Energy Rev. 2015, 41, 85–98. [Google Scholar] [CrossRef] [Green Version]
- Hirvonen, J.; Jokisalo, J.; Knuuti, A.; Kosonen, R.; Niemelä, T.; Paiho, S.; Pulakka, S. Heat Pumps in Energy and Cost Efficient Nearly Zero Energy Buildings in Finland. In VTT Technology; Häkämies, S., Ed.; VTT: Espoo, Finland, 2015; p. 109. Available online: https://www.teagasc.ie/media/website/crops/crops/Renewable_Heat_in_Ireland_to_2020.pdf (accessed on 5 November 2021).
- Heating and Cooling with a Heat Pump. Available online: https://www.nrcan.gc.ca/energy-efficiency/energy-star-canada/about/energy-star-announcements/publications/heating-and-cooling-heat-pump/6817 (accessed on 19 September 2021).
- Valancius, R.; Singh, R.M.; Jurelionis, A.; Vaiciunas, J. A Review of Heat Pump Systems and Applications in Cold Climates: Evidence from Lithuania. Energies 2019, 12, 4331. [Google Scholar] [CrossRef] [Green Version]
- Vekony, A.T. Heat Pumps: 7 Advantages and Disadvantages. Available online: https://www.greenmatch.co.uk/blog/2014/08/heat-pumps-7-advantages-and-disadvantages (accessed on 3 February 2021).
- Steinbach, J.; Popovski, E.; Fleiter, T.; Hummel, M.; Chassein, E.; Bedoya, I.; Rex, M. Policy Recommendations to Decarbonise European Heating and Cooling Systems; ProgRESs Heat: Wien, Austria, 2017; p. 52. [Google Scholar]
- Scheer, J. Decarbonising Ireland’s Home and Business Heating; Sustainable Energy Authority of Ireland (SEAI): Dublin, Ireland, 2020; Volume 2021. [Google Scholar]
- Chaudry, M.; Abeysekera, M.; Hosseini, S.; Jenkins, N.; Wu, J. Uncertainties in decarbonising heat in the UK. Energy Policy 2015, 87, 623–640. [Google Scholar] [CrossRef] [Green Version]
- Superhomes. What is Deep Retrofit? Up to 35% Funding for Home Retrofit in 2021. In SuperHomes 2030; Electric Ireland: Tipperary, Ireland, 2019. [Google Scholar]
- O’Sullivan, K. Prohibitive Costs Stalling Widespread Retrofitting of Homes, Energy Firm Finds. The Irish Times, 14 June 2020. [Google Scholar]
- Ervia. Decarbonising domestic heating in Ireland. KPMG 2018, 47. Available online: http://www.ervia.ie/decarbonising-domestic-he/KPMG-Irish-Gas-Pathways-Report.pdf (accessed on 5 November 2021).
- Pääkkönen, A.; Aro, K.; Aalto, P.; Konttinen, J.; Kojo, M. The Potential of Biomethane in Replacing Fossil Fuels in Heavy Transport—A Case Study on Finland. Sustainability 2019, 11, 4750. [Google Scholar] [CrossRef] [Green Version]
- Ajayi-Oyakhire, O.; Mohammed, M. Biofuels, Analysis of the Various Biofuel Types Including Biomass, Bioliquids, Biogas, and Bio-SNG; Institute of Gas Engineers and Managers: Kegworth, UK, 7 June 2012; p. 48. [Google Scholar]
- Gartland, D.; Bruton, T. A Guide to District Heating in Ireland, National Development Plan. October 2016. Available online: https://www.seai.ie/publications/2016_RDD_79._Guide_District_Heating_Irl_-_CODEMA.pdf (accessed on 5 November 2021).
- Ireland, E. Developing District Heating in Ireland. Available online: http://www.energyireland.ie/developing-district-heating-in-ireland/ (accessed on 16 May 2021).
- Office of Energy Efficiency & Renewable Energy. Hydrogen Pipelines; U.S. Department of Energy, Ed.; Hydrogen and Fuel Cell Technologies Office: Washington, DC, USA, 2021.
- Jensen, J. Field test of Hydrogen in the natural gas grid. In Proceedings of the 23rd World Gas Conference, Amsterdam, The Netherlands, 5–9 June 2006. [Google Scholar]
- Schiro, F.; Stoppato, A.; Benato, A. Modelling and analyzing the impact of hydrogen enriched natural gas on domestic gas boilers in a decarbonization perspective. Carbon Resour. Convers. 2020, 3, 122–129. [Google Scholar] [CrossRef]
- Mouli-Castillo, J.; Bartlett, S.; Murugan, A.; Badham, P.; Wrynne, A.; Haszeldine, S.; Wheeldon, M.; McIntosh, A. Olfactory appraisal of odorants for 100% hydrogen networks. Int. J. Hydrog. Energy 2020, 45, 11875–11884. [Google Scholar] [CrossRef]
- HyWay 27. Available online: https://www.hyway27.nl/en (accessed on 21 April 2021).
- H21. H21 Leeds, UK. Available online: https://www.h21.green/about/ (accessed on 21 April 2021).
- FuelCellsWorks. Harumi Flag: A City with the First Full-Scale Hydrogen Infrastructure Japan as Ever Seen; FuelCellsWorks: Harumi, Japan, 18 October 2019. [Google Scholar]
- Pan, Y.; Zuo, M.; Wu, G. Whole building energy simulation and energy saving potential analysis of a large public building. J. Build. Perform. Simul. 2011, 4, 37–47. [Google Scholar] [CrossRef] [Green Version]
- Mambo, D.A.; Efthekhari, M.; Steffen, T. Occupancy-Driven Supervisory Control Strategies to Minimise Energy Consumption of Airport Terminal Building. In Sustainability in Energy and Buildings; Springer: Berlin/Heidelberg, Germany, 2013; pp. 479–489. [Google Scholar] [CrossRef]
- Haghi, E.; Qadrdan, M.; Wu, J.; Jenkins, N.; Fowler, M.; Raahemifar, K. An iterative approach for optimal decarbonization of electricity and heat supply systems in the Great Britain. Energy 2020, 201, 117611. [Google Scholar] [CrossRef]
- Bauermann, K.; Spiecker, S.; Weber, C. Individual decisions and system development—Integrating modelling approaches for the heating market. Appl. Energy 2014, 116, 149–158. [Google Scholar] [CrossRef]
- Ahern, C.; Griffiths, P.; O’Flaherty, M. State of the Irish housing stock—Modelling the heat losses of Ireland’s existing detached rural housing stock & estimating the benefit of thermal retrofit measures on this stock. Energy Policy 2013, 55, 139–151. [Google Scholar] [CrossRef] [Green Version]
- Clemente, J. Natural Gas Is the Flexibility Needed for More Wind and Solar. Forbes. 2017. Available online: https://www.forbes.com/sites/judeclemente/2017/12/31/natural-gas-is-the-flexibility-needed-for-more-wind-and-solar/?sh=1e6c560a5777 (accessed on 5 November 2021).
- EnergyPlus. MapData. Google Maps. Available online: https://www.google.com/maps/d/viewer?msa=0&dg=feature&mid=1BhMLmWuS8BVuqdkGCYsAsilqFy4&ll=-1.078186181371995%2C54.22792109519236&z=2 (accessed on 5 November 2021).
- The A-Rated Energy Efficient Concrete Home. 2009. Available online: https://www.irishconcrete.ie/wp-content/uploads/2017/04/2009-A-rated-Homes.pdf (accessed on 5 November 2021).
- Window Energy Performance (WEP). Available online: https://www.nsai.ie/images/uploads/certification-agrement/W008_009-SDoyle-Sons-uPVC-Energy-Rating-Chart_A1-2016.pdf (accessed on 5 November 2021).
- House, P. U-Value. 2020. Available online: https://passivehouseplus.ie/u-value (accessed on 5 November 2021).
- Alsop, J. Boiler Efficiency Calculator|Most Efficient Boilers|Energy Saving Tips. Available online: https://www.theheatinghub.co.uk/boiler-efficiency-guide-and-energy-saving-tips (accessed on 21 April 2021).
- Office, C.S. Housing and Households. Available online: https://www.cso.ie/en/statistics/housingandhouseholds/ (accessed on 5 November 2021).
- Scheer, J. Extensive survey of the commercial buildings stock in the Republic of Ireland. Sustain. Energy Auth. Irel. 2015, 56. Available online: https://www.seai.ie/publications/Extensive-Survey-of-Commercial-Buildings-Stock-in-the-Republic-of-Ireland.pdf (accessed on 5 November 2021).
- Census of Population 2016—Profile 1 Housing in Ireland; Central Statistics Office (CSO): Cork, Ireland, 2016; Available online: https://www.cso.ie/en/releasesandpublications/ep/p-cp1hii/cp1hii/od/ (accessed on 5 November 2021).
- Population 1891 to 2016. 6 July 2020. Available online: https://data.cso.ie/ (accessed on 5 November 2021).
- Networked Gas Consumption. Available online: https://www.cso.ie/en/releasesandpublications/er/ngc/networkedgasconsumption2019/ (accessed on 5 November 2021).
- Taylor, Z.; Mendon, V.; Fernandez, N. Methodology for evaluating cost-effectiveness of residential energy code changes. In Energy Efficiency & Renewable Energy; Report; U.S. Department of Energy: Washington, DC, USA, August 2015; p. 44. [Google Scholar]
- Im-orb, K.; Visitdumrongkul, N.; Saebea, D.; Patcharavorachot, Y.; Arpornwichanop, A. Flowsheet-based model and exergy analysis of solid oxide electrolysis cells for clean hydrogen production. J. Clean. Prod. 2018, 170, 1–13. [Google Scholar] [CrossRef]
- Fuel Consumption (KTOE). Available online: https://data.cso.ie/table/SEI06 (accessed on 5 November 2021).
- John, J.S. Green Hydrogen in Natural Gas Pipelines: Decarbonization Solution or Pipe Dream? 2020. Available online: https://www.greentechmedia.com/articles/read/green-hydrogen-in-natural-gas-pipelines-decarbonization-solution-or-pipe-dream (accessed on 5 November 2021).
- Review of Typical Domestic Consumption Values for Electricity and Gas Customers. In Regualating Water, Energy and Energy Safety in the Public Interest; Commission for Energy Regulation (CER): Dublin, Ireland, 2017; p. 22. Available online: https://www.cru.ie/wp-content/uploads/2017/07/CER17042-Review-of-Typical-Consumption-Figures-Decision-Paper-1.pdf (accessed on 5 November 2021).
- SEAI|Key Statistics|Residential. Available online: https://www.seai.ie/data-and-insights/seai-statistics/key-statistics/residential/ (accessed on 5 November 2021).
- Wilson, I.G.; Rennie, A.J.; Ding, Y.; Eames, P.C.; Hall, P.J.; Kelly, N.J. Historical daily gas and electrical energy flows through Great Britain’s transmission networks and the decarbonisation of domestic heat. Energy Policy 2013, 61, 301–305. [Google Scholar] [CrossRef] [Green Version]
- Qadrdan, M.; Fazeli, R.; Jenkins, N.; Strbac, G.; Sansom, R. Gas and electricity supply implications of decarbonising heat sector in GB. Energy 2019, 169, 50–60. [Google Scholar] [CrossRef]
- Coyle, D. A Life Cycle Cost Analysis of an Irish Dwelling Retrofifitted to Passive House Standard: Can Passive House Become a Cost-Optimal Low-Energy Retrofifit Standard? Master’s Thesis, Dublin school of Architecture, Dublin, Ireland, 2015. Available online: https://arrow.tudublin.ie/cgi/viewcontent.cgi?article=1022&context=builtmas (accessed on 5 November 2021).
- Renwable Energy; Centre for Climate and Energy Solutions: Arlington, VA, USA; Available online: https://www.c2es.org/content/renewable-energy/ (accessed on 5 November 2021).
- SEAI. National Home Retrofit Scheme. Available online: https://www.seai.ie/grants/national-home-retrofit/ (accessed on 19 September 2021).
- European Environmental Agency. Greenhouse Gas Emission Intensity of Electricity Generation. Available online: https://www.eea.europa.eu/data-and-maps/daviz/co2-emission-intensity-5#tab-googlechartid_chart_11_filters=%7B%22rowFilters%22%3A%7B%7D%3B%22columnFilters%22%3A%7B%22pre_config_ugeo%22%3A%5B%22European%20Union%20(current%20composition)%22%5D%7D%7D (accessed on 6 August 2021).
- Eurostat. Electricity Price Statistics. Available online: https://ec.europa.eu/eurostat/statistics-explained/index.php?title=Electricity_price_statistics (accessed on 9 August 2021).
- Eurostat. Natural Gas Price Statistics. Available online:https://ec.europa.eu/eurostat/statistics-explained/index.php?title=Natural_gas_price_statistics#:~:text=The%20price%20of%20natural%20gas,(EUR%200.0280%20per%20kWh).&text=The%20average%20price%20in%20the,was%20EUR%200.0698%20per%20kWh (accessed on 9 August 2021).
- IEA. Global Hydrogen Review 2021; IEA: Paris, France, 2021; Available online: https://www.iea.org/reports/global-hydrogen-review-2021 (accessed on 5 November 2021).
- SEAI. Understanding the Factors That Affect Energy Prices is Important for Ireland. It Helps Businesses, Householders and Policymakers to Respond Appropriately. In Prices; Sustainable Energy Authority of Ireland: Dublin, Ireland, 2021. [Google Scholar]
Figure 1.
Modeling methodology used to investigate the effect of heat decarbonization strategies in residential and commercial buildings on the distribution gas network, along with the combination of total industrial energy demand supplied as gas.
Figure 1.
Modeling methodology used to investigate the effect of heat decarbonization strategies in residential and commercial buildings on the distribution gas network, along with the combination of total industrial energy demand supplied as gas.

Figure 2.
The 24 h gas consumption profile for a hospital, for the maximum, mean, and minimum day, for Cases A, B, and C.
Figure 2.
The 24 h gas consumption profile for a hospital, for the maximum, mean, and minimum day, for Cases A, B, and C.

Figure 3.
The 24 h gas consumption profile for a single-family home for the maximum, mean, and minimum day, for Cases A, B, and C.
Figure 3.
The 24 h gas consumption profile for a single-family home for the maximum, mean, and minimum day, for Cases A, B, and C.

Figure 4.
The 24 h gas consumption profile for the maximum, mean, and minimum day in residential and commercial buildings for Cases A, B, and C.
Figure 4.
The 24 h gas consumption profile for the maximum, mean, and minimum day in residential and commercial buildings for Cases A, B, and C.

Figure 5.
The total gas demand for residential and commercial buildings in Ireland and the percentage change in gas consumption for each month in Case A, Case B, and Case C.
Figure 5.
The total gas demand for residential and commercial buildings in Ireland and the percentage change in gas consumption for each month in Case A, Case B, and Case C.

Figure 6.
Comparison of the total carbon emissions from a single-family home with gas heating from EnergyPlus (●) and a single-family home with a heat pump (COP = 2.5) utilizing electricity of different carbon intensities (―: 425 gCO2/kWh, ……: 296 gCO2/kWh, and ----: 15 gCO2/kWh), for values of increasing insulation R (1/U), where R = 6.5 is a passive home.

Figure 7.
The combined effect of replacing carbon-intensive fuels in the industrial sector with gas-based fuels and adopting a demand reduction approach to reducing gas consumption in the residential and commercial heating sectors on the overall volume of gas transported for heating.
Figure 7.
The combined effect of replacing carbon-intensive fuels in the industrial sector with gas-based fuels and adopting a demand reduction approach to reducing gas consumption in the residential and commercial heating sectors on the overall volume of gas transported for heating.

Table 1.
A summary of the pathways toward the decarbonization of heat [20].
Table 1.
A summary of the pathways toward the decarbonization of heat [20].
| Decarbonization Pathway | Decarbonization Potential | Cost |
|---|---|---|
| Prosumer | Low | Low |
| Biomass | Low | Low |
| Insulation | High | Low |
| Biomethane | High | Low |
| Hydrogen | High | High |
| Heat networks | High | High |
| Heat pumps | High | High |
Table 2.
Equivalent Irish and equivalent US DOE building types.
| Irish Residential and Commercial Buildings Available in 2016 (www.data.cso.ie, Accessed on 5 November 2021) | Equivalent EnergyPlus Building Model Name | |
|---|---|---|
| Hospital | Hospital | |
| Large hotel | Large Hotel | |
| Small hotel | Small Hotel | |
| Large office | Large office | |
| Restaurant | Restaurant | |
| Retail store | Stand-alone retail | |
| Small office | Small office | |
| Supermarket | Supermarket | |
| Warehouse | Warehouse | |
| Apartment | Electrical | Multi-family home slab basement, electric heating |
| Gas | Multi-family home slab basement, gas heating | |
| Heat pumps | Multi-family home slab basement, heat pumps | |
| Oil furnace | Multi-family home slab basement, oil heating | |
| Detached homes | Electrical | Single-family home slab basement, electric heating |
| Gas heating | Single-family home slab basement, gas heating | |
| Heat pumps | Single-family home slab basement, heat pumps | |
| Oil furnace | Single-family home slab basement, oil heating | |
Table 3.
Parameters of U-Factor and gas efficiencies considered for the three scenarios.
| Parameter | Level of Insulation | Case A (Base Case) (Obtained from Energy Plus Files) | Case B (Improved Insulation) | Case C (Improved Insulation and Increased Gas Efficiency) | ||
|---|---|---|---|---|---|---|
| Residential | Commercial | |||||
| U-Factor (Watts/m2K) [43,44,45] | Window | 1.7 | 2.04 | 0.84 (U1,window) | 0.84 (U1,window) | |
| External wall | 7.4 | 0.39 | 0.61–0.73 | 0.15 (U1,External wall) | 0.15 (U1,External wall) | |
| Internal wall | 0.41 | N/A | 0.16 (U1,internal wall) | 0.16 (U1,internal wall) | ||
| Attic | 0.15 | 0.19–33.4 | 0.13 (U1,attic) | 0.13 (U1,attic) | ||
| Floor | 0.22 | 33.4 | 0.14 (U1,floor) | 0.14 (U1,floor) | ||
| Gas Boiler Efficiency (%) [46] | 80 (E0) | 80 (E0) | 95 (E1) | |||
Table 4.
(a) Type and number of commercial buildings in Ireland in 2016 [48]. (b) Type of building, heating, and number of occupied residential buildings in Ireland in 2016 [47,49].
| (a) Commercial Buildings | (b) Residential Buildings | |||
|---|---|---|---|---|
| Type of Building | Number | Type of Building | Type of Heating | Number |
| Hospital | 86 | Apartment | Electrical | 50,782 |
| Large hotel | 1000 | Gas | 42,657 | |
| Small hotel | 3000 | Heat pumps | 6094 | |
| Large office | 2000 | Oil furnace | 104,612 | |
| Restaurant | 16,000 | Detached homes | Electrical | 373,380 |
| Retail store | 37,000 | Gas heating | 313,639 | |
| Small office | 40,000 | Heat pumps | 44,806 | |
| Supermarket | 3000 | Oil furnace | 761,695 | |
| Warehouse | 7000 | Total | 1,697,665 | |
| Total | 109,086 | |||
Table 5.
Validating the model of residential and commercial heating demands using data from SEAI.
| Gas Heating Demand | Actual Gas Heating Demand [51,54] | EnergyPlus Model | |||
|---|---|---|---|---|---|
| Type of Building | Number of Gas Meters (CSO) | Total Energy Consumption (KTOE) | Number of Living Units | Total Energy Consumption (KTOE) | |
| Residential | Apartment | 659,722 | 616 | 583,470 | 466.4 |
| Detached homes | 89,052 | 157.2 | |||
| Total (Residential) | 672,522 | 623.6 | |||
| Commercial | Hospital | 28,551 | 394 | 22 | 3.6 |
| Large Hotel | 250 | 27.3 | |||
| Large Office | 750 | 38.9 | |||
| Restaurant | 500 | 13.1 | |||
| Retail | 4000 | 44 | |||
| Small Hotel | 9250 | 237.6 | |||
| Small Office | 10,000 | 0.2 | |||
| Supermarket | 750 | 7.8 | |||
| Total (Commercial) | 16,272 | 372.4 | |||
| Total | 688,273 | 1010 | 688,794 | 996 | |
Table 6.
The total decrease in gas consumption for the residential and commercial buildings (m3/year) for the three cases.
Table 6.
The total decrease in gas consumption for the residential and commercial buildings (m3/year) for the three cases.
| Case | Detached Home (kWh/annum) | Apartment Building (kWh/annum) | Commercial Building (kWh/annum) | Annual Gas Consumption (kWh/annum) |
|---|---|---|---|---|
| Case A (Base case) | 1.83 × 10⁹ | 5.42 × 10⁹ | 4.33 ×10⁹ | 11.58 × 10⁹ |
| Case B (Buildings with improved insulation) | 1.23 × 10⁹ | 4.41 × 10⁹ | 3.80 × 10⁹ | 9.44 × 10⁹ |
| Case C (Buildings with improved insulation and gas boiler efficiency) | 1.16 × 10⁹ | 4.35 × 10⁹ | 3.72 × 10⁹ | 9.23 × 10⁹ |
Table 7.
The total decrease in gas consumption in residential and commercial buildings with different layers of insulation.
Table 7.
The total decrease in gas consumption in residential and commercial buildings with different layers of insulation.
| Insulation Level | Gas Consumption (TWh) | % Decrease in Gas Consumption |
|---|---|---|
| Commercial sector | ||
| No improvement in insulation | 4.33 | |
| External wall insulation | 4.09 | 5.54% |
| Floor insulation | 4.33 | 0% 1 |
| Attic insulation | 4.28 | 1.16% |
| Internal wall insulation | 4.29 | 0.92% |
| Window glazing | 4.12 | 4.79% |
| Residential sector | ||
| No improvement in insulation | 6.78 | |
| External wall insulation | 5.87 | 13.30% |
| Floor insulation | 6.764 | 0.16% |
| Attic insulation | 6.757 | 0.25% |
| Internal wall insulation | 6.67 | 1.6% |
| Window glazing | 6.21 | 8.39% |
1 The results from the floor insulation show no change in gas consumption except in a large hotel where there is a 0.002% increase in gas consumption. This could be due to the over insulation of the buildings.
Table 8.
Total decarbonization achievable in the industrial sector.
| Scenario 1 (All Natural Gas) | Scenario 2 (20 vol % H2 and 80 vol % Natural Gas) | Scenario 3 (All H2) | ||
|---|---|---|---|---|
| Increase in the volume of gas consumed | (m3/year) | 4.38 × 10⁸ | 6.39 × 10⁸ | 3.18 × 10⁹ |
| % | 52.29% | 76.38% | 380.33% | |
| Percentage decrease in carbon emissions | 15% | 22% | 100% |
Table 9.
Carbon emissions in the combination of the residential, commercial, and industrial heat demand cases and scenarios.
Table 9.
Carbon emissions in the combination of the residential, commercial, and industrial heat demand cases and scenarios.
| Scenario 1 | Scenario 2 | Scenario 3 | ||||
|---|---|---|---|---|---|---|
| Annual CO2 Emissions (Million Tonnes/Annum) | % of Prior CO2 Emission | Annual CO2 Emissions (Million Tonnes/Annum) | % of Prior CO2 Emission | Annual CO2 Emissions (Million Tonnes/Annum) | % of Prior CO2 Emission | |
| Case A | 4.64 | 95.64% | 3.71 | 77.2 % | 0 | 0% |
| Case B | 4.27 | 83.16% | 3.42 | 67.17% | 0 | 0% |
| Case C | 4.23 | 81.94% | 3.38 | 66.21% | 0 | 0% |
Publisher’s Note: MDPI stays neutral with regard to jurisdictional claims in published maps and institutional affiliations. |
© 2021 by the authors. Licensee MDPI, Basel, Switzerland. This article is an open access article distributed under the terms and conditions of the Creative Commons Attribution (CC BY) license (https://creativecommons.org/licenses/by/4.0/).
Share and Cite
MDPI and ACS Style
Chandrasekar, A.; Syron, E. Evaluation of Heat Decarbonization Strategies and Their Impact on the Irish Gas Network. Gases 2021, 1, 180-198. https://doi.org/10.3390/gases1040014
AMA Style
Chandrasekar A, Syron E. Evaluation of Heat Decarbonization Strategies and Their Impact on the Irish Gas Network. Gases. 2021; 1(4):180-198. https://doi.org/10.3390/gases1040014
Chicago/Turabian StyleChandrasekar, Aruna, and Eoin Syron. 2021. "Evaluation of Heat Decarbonization Strategies and Their Impact on the Irish Gas Network" Gases 1, no. 4: 180-198. https://doi.org/10.3390/gases1040014