Review

Current Knowledge and Challenges of Particle Size Measurements of Mainstream E-Cigarette Aerosols and Their Implication on Respiratory Dosimetry

Scientific Horizons Consulting, Irvine, CA 92617, USA
*
Authors to whom correspondence should be addressed.
J. Respir. 2023, 3(1), 7-28; https://doi.org/10.3390/jor3010003
Submission received: 3 January 2023 / Revised: 11 February 2023 / Accepted: 15 February 2023 / Published: 24 February 2023

Abstract

:
The E-cigarette has been promoted as an alternative nicotine delivery device with potentially fewer toxicant emissions. The objective of this review is to summarize the current knowledge on the particle size distribution (PSD) of e-cigarette emissions and to analyze the knowledge gaps between existing particle size measurements and the vision toward harm reduction from e-cigarette use. Here, we focus on firstly describing the physical parameters used to characterize PSD, followed by comparing particle size measurement approaches, investigating the factors that impact the PSD of e-cigarette mainstream aerosols, and conclude by linking size distribution to the respiratory dosimetry by demonstrating the modeling results of particle deposition in the respiratory tract. This review calls for a harmonized testing protocol to conduct inter-comparisons and further understand e-cigarette particle sizes. Among the influencing factors investigated, puff topography, operation power, flavorings, PG/VG ratio, and nicotine strength impose a substantial impact on the PSD, but the underlying mechanisms have not yet been fully investigated. The effects brought by the type of device refill and nicotine are yet inconclusive due to lack of evidence. Coil aging has no significant impact on the PSD of e-cigarette aerosols within the coil lifetime. Lastly, while computational models of particle deposition have been adopted to profile the deposition of e-cigarette mainstream emissions, existing models have limited applicability and generality when dealing with e-cigarette aerosols that have high volatility and hygroscopicity, which can dynamically evaporate or grow during the transport process. Additionally, the size-dependent chemical composition (e.g., nicotine and harmful and potentially harmful constituents) of e-cigarette aerosols is unknown, impeding the understanding of the health effects of e-cigarette use. Therefore, it is essential for future studies to bridge these knowledge gaps and unveil the mechanisms determining PSD and respiratory deposition.

1. Introduction

Since their introduction in 2003, e-cigarettes have gained worldwide popularity. E-cigarettes, also known as the electronic nicotine delivery system (ENDS), basically contains a battery, a heating element, and a reservoir to store e-liquid. The heating element is powered to aerosolize the e-liquid and generate smoke-free aerosols. Depending on the design, it can be a 1-piece, 2-piece, or 3-piece device. The e-cigarette products continue to evolve with respect to the device and e-liquid formula [1,2,3,4]. E-cigarettes have been developed to a fourth generation with the improvement of the battery, atomizer, and reservoir design. The main constituents of e-liquids are humectants (e.g., propylene glycol or PG, vegetable glycerin or VG), nicotine, flavorants, and other additives. The wide range of flavors has increased the attractiveness of e-cigarettes among many types of users, including current smokers, non-smokers, former smokers, and even youth and young adults. The increased concern of e-cigarette or vaping product use-associated lung injury (EVALI) and the epidemic levels of youth use of e-cigarettes has urged the FDA to take action on e-cigarette regulations. The FDA banned the sales of sweet and fruity e-cigarette pods in 2020. Since then, only menthol and tobacco-flavored e-liquids have been available, except disposable e-cigarettes, which still contain various flavors.
E-cigarettes have been touted as an alternative to deliver nicotine with much less exposure to harmful and potentially harmful constituents (HPHCs) compared to conventional cigarettes. Thus, the key to assessing the individual health impact of an e-cigarette product as an alternative option to switch current smokers is its efficiency in delivering nicotine and the degree of HPHC exposure, which are determined by the concentrations of aerosolized ingredients as well as particle size distribution (PSD) of the emitted aerosols. Therefore, the information on PSD and chemical concentrations in e-cigarette aerosols can bridge the gap between e-cigarette emissions and abuse liability/potential health effects. There have been many studies on the measurements of PSD on e-cigarette emissions and the risks of e-cigarette exposure. However, the linkage between them has not been fully discussed.
Here, we thoroughly pictured the PSD of e-cigarette aerosols, compared it with other tobacco products (i.e., heat-not-burn or HnB products and conventional cigarettes), reviewed the factors that are likely to impact the PSD of e-cigarette aerosols, highlighted the challenges of measurements, and outlined the research needs on further particle deposition modeling to close the gap between PSD and health effects by e-cigarette use.

2. Particle Size Characterization

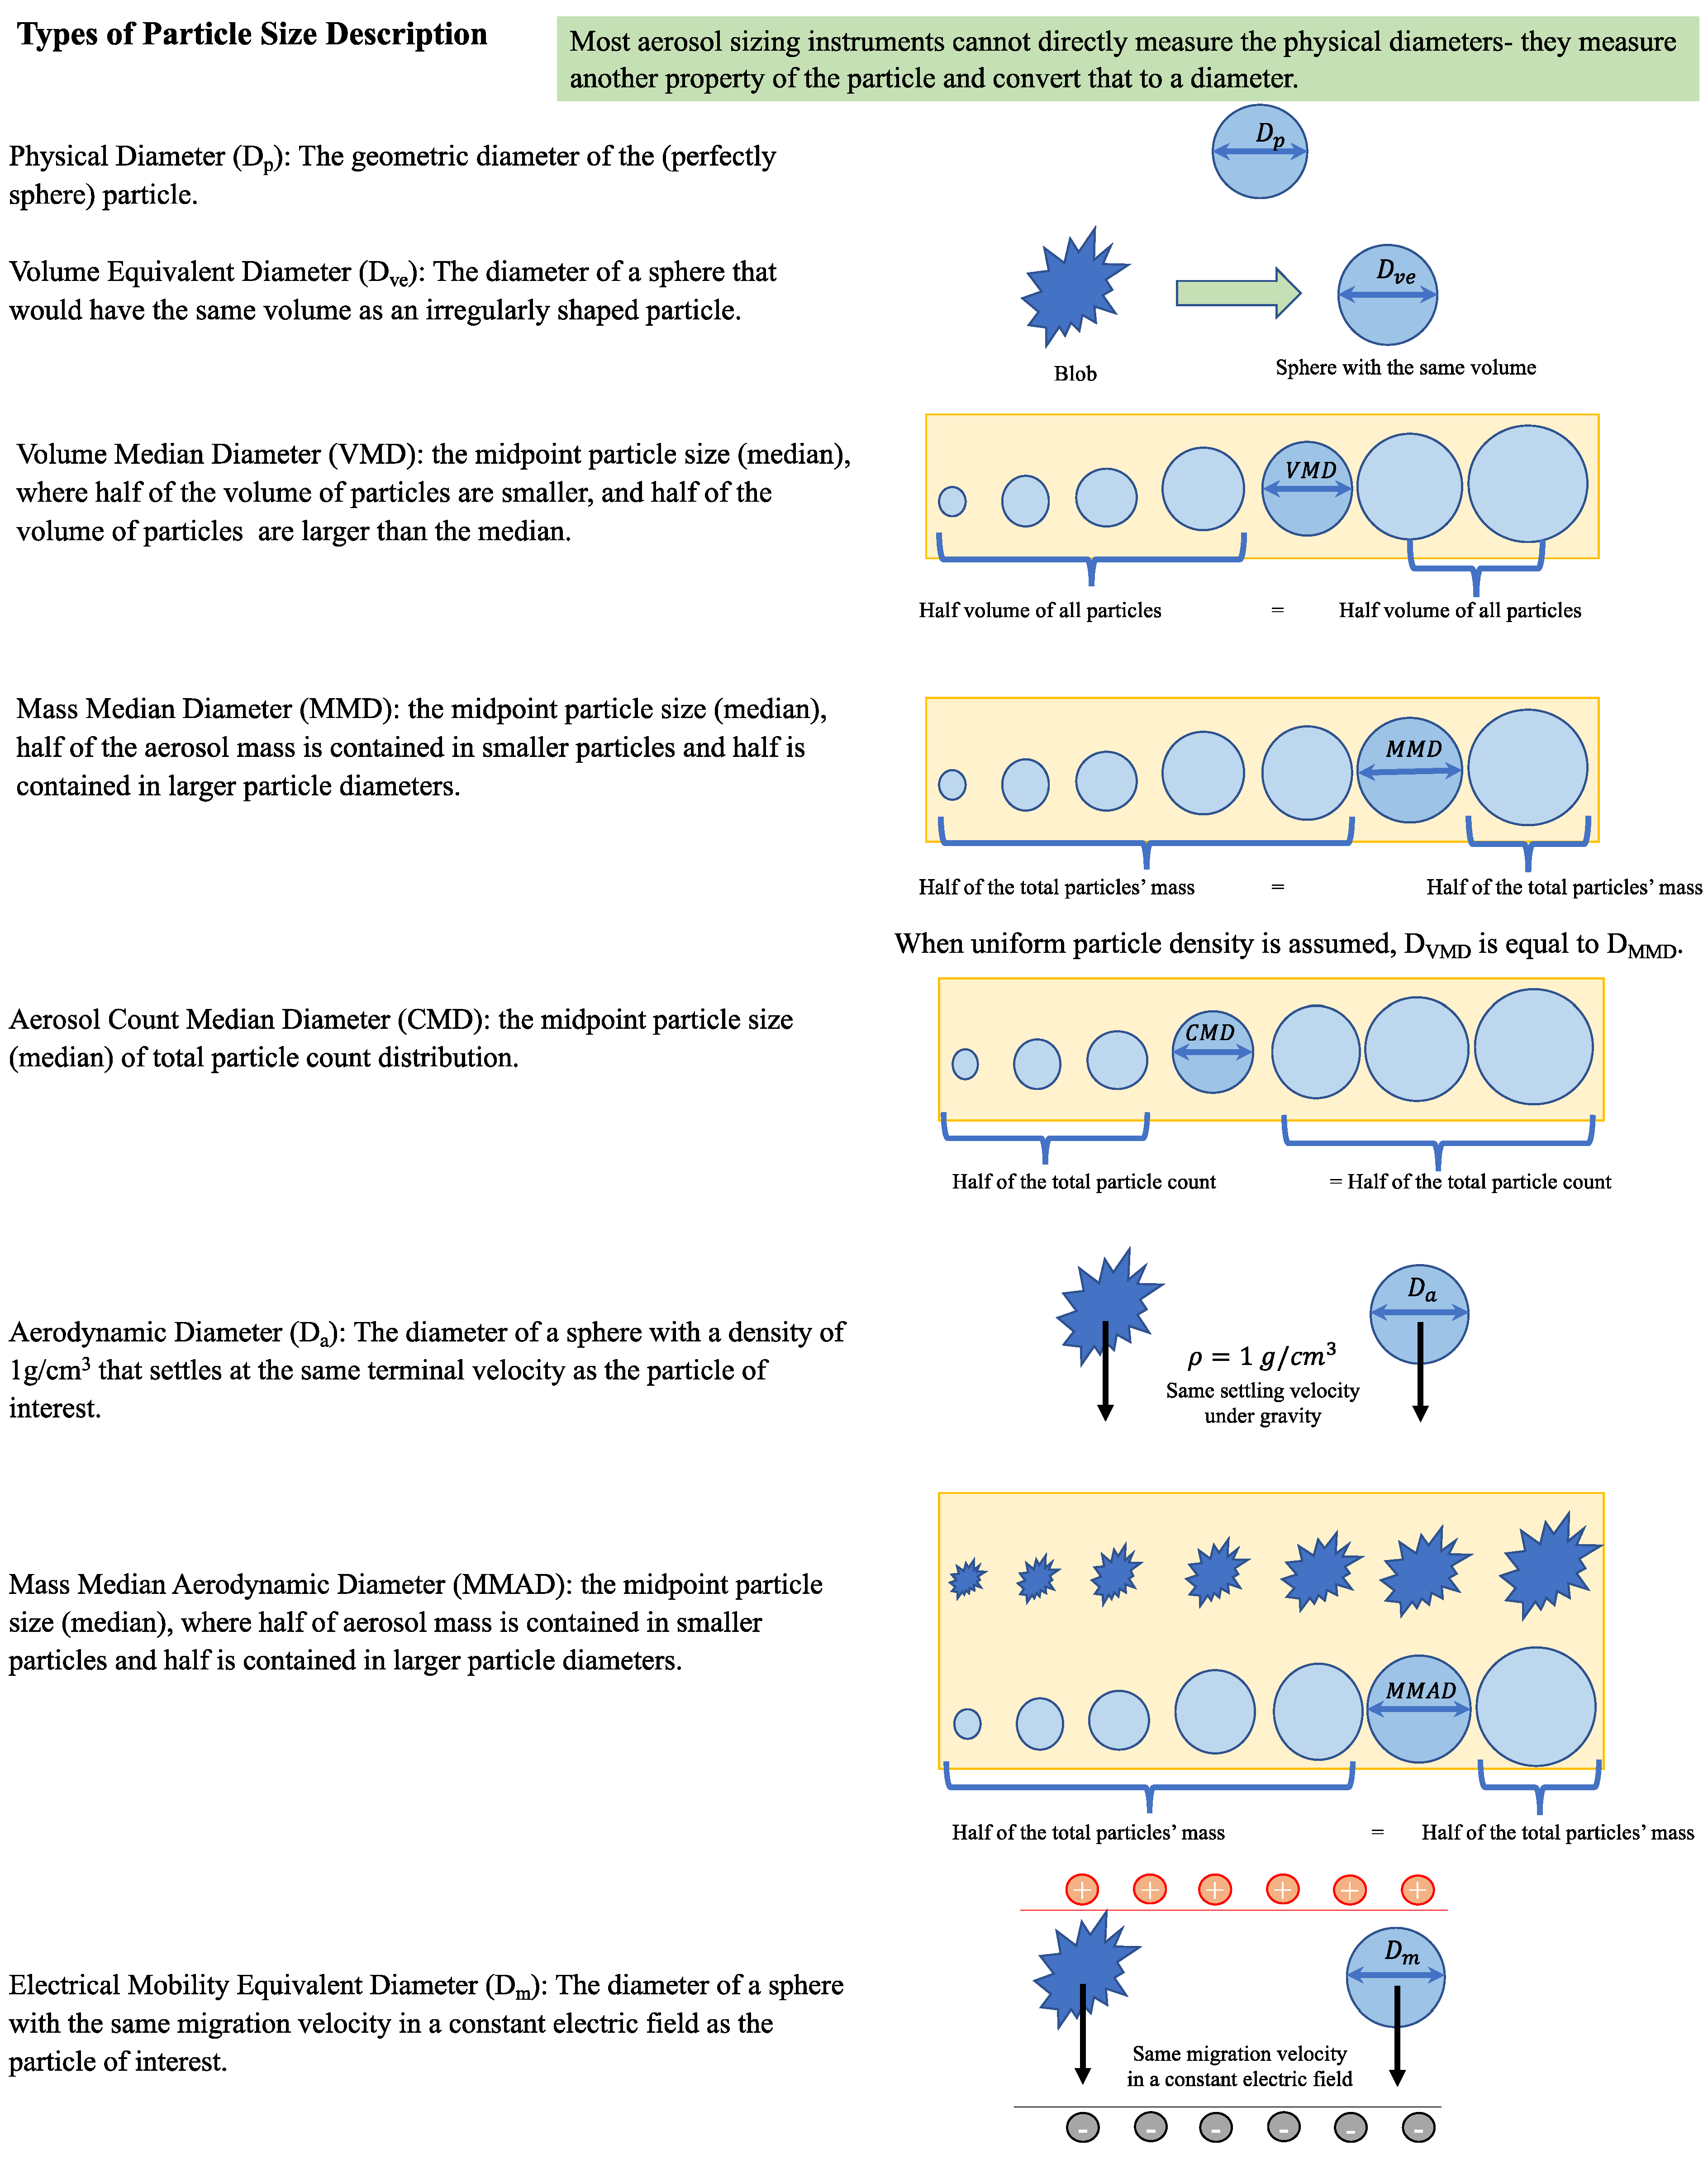
2.1. Particle Size Parameters

There are several parameters that can be used to describe the particle size and size distribution of aerosols, including the aerosol particle geometric mean diameter (GMD), aerosol count median diameter (CMD), volume median diameter (VMD), mass median diameter (MMD), mass median aerodynamic diameter (MMAD), electrical mobility equivalent diameter (dm), and geometric standard deviation (GSD). These parameters can all be derived from PSD. Note that PSD is sometimes used interchangeably with count number distribution, but PSD is a general term that can represent the distribution of count, mass, or volume. The definitions of these parameters are clarified below and illustrated in Figure 1.
The count distribution n(d) is defined as,
Equation (1):
n ( d ) = N f ( d )
where N is the total number of particles in the aerosol and f(d) is the frequency of particles within the range of [d, dd]. Integrating n(d) over a range of diameters gives the number of particles in that range. CMD is the median of the count number distribution below, of which the total number count fraction is 50%.
Mass distribution is another useful indicator to quantify particle exposure. Let m(d) be the mass of aerosols within the range of [d, dd], then:
Equation (2):
m ( d ) = n ( d ) v ( d ) ρ ( d ) = n ( d ) × 4 3 π ( d 2 ) 3 × ρ ( d )
where v(d) is the volume of aerosols within the range of [d, dd], and the density ρ(d) is typically assumed to be uniform for any size of particles.
The cumulative volume distribution of [0, d] can be calculated by:
V ( d ) = 0 d v ( x ) d x
Then, VMD is the particle diameter below which half of the aerosol cumulative volume is contained.
The cumulative mass distribution of [0, d] can be calculated by:
Equation (3):
M ( d ) = 0 d m ( x ) d x
MMD is the particle diameter below from which half of the aerosol mass is contained. If d is measured as the aerodynamic diameter, then MMAD can be obtained. Note that MMAD is determined by assuming that the particle is spherical, though e-cigarette particles can be in irregular shapes [5]. When a uniform density is assumed, VMD is equal to MMD.
The size distributions of e-cigarette-generated particles are typically log-normally distributed. The mass distribution can be estimated by:
Equation (4):
m ( d ) = 1 d 2 π e x p [ ( ln d ln MMD ) 2 2 ( ln GSD ) 2 ]
GSD is defined as the standard deviation of the logarithm of the particle diameter, representing how 68% of the aerosol mass is contained within the range of [ MMD × GSD ,   MMD / GSD ] . Thus, GSD can be calculated with:
Equation (5):
GSD = d 84 d 16
where d84 and d16 are mass-weighted percentiles. For example, the d84 is the maximum particle diameter below which 84% of the sample mass exists. Similarly, the volume weight percentile can be defined.
When estimating the mass concentration (mass per unit volume of air) for log-normal distributed particles, M:
Equation (6):
M = ρ N 6 ( MMD ) 3 e x p [ 9 2 ( ln GSD ) 2 ]
where N is the number concentration per unit volume of air. From Equation (6), the mass largely depends on large particles given the third power of the diameter.
Additionally, MMD and GSD can be correlated using the HatchChoate equation, as shown in Equation (7),
Equation (7):
MMD = CMD × e x p [ 3 ( ln GSD ) 2 ]

2.2. Instruments to Measure the Particle Size and Size Distribution

Instruments to measure the particle size and PSD include impactors, electrical mobility sizers, and optical sensors. The most used approaches for measuring e-cigarette aerosols are listed in Table 1.
Impactors such as the micro-orifice uniform deposit impactor (MOUDI) have been widely used to collect particles due to their low cost and easy operation. The general working principle for impactors is that particle-laden air is directed toward the impaction plate, and the cut-off size (the diameter corresponding to a 50% collection efficiency) of each stage is determined by the nozzle size. A conventional cascade impactor is an offline measurement. Real-time cascade impactors have been developed, such as the electrical low-pressure impactor (ELPI) and quartz crystal microbalance (QCM) MOUDI impactor. The conventional cascade impactor and QCM MOUDI impactor are generally considered to have a low size resolution due to the limited number of stages. However, an advanced ELPI version allows a high resolution with 500-size bins based on the data inversion algorithm (https://www.dekati.com/products/elpi/ (accessed on 20 August 2022)).
The electrical mobility sizers can measure the particle size in real time based on the electrical mobility. The commonly used electrical mobility sizers include the scanning mobility particle sizer (SPMS), fast mobility particle sizer (FMPS), engine exhaust particle sizer (EEPS), and differential mobility spectrometer (DMS). Taking SMPS, for example, it contains two components: the differential mobility analyzer (DMA) and condensation particle counter (CPC). The DMA screens out charged particles according to their electrical mobility (i.e., the particle velocity produced by a unit external force). The classified particles are then counted by the CPC. The electrical mobility equivalent diameter or dm can be converted to the electrical aerodynamic diameter da by
Equation (8):
d a = d m χ C s d m ρ p / C s d a ρ 0
where χ is the shape factor, Cs is the Cunningham slip correction factor, ρp is the density of the particles, and ρ0 is the reference density. The effective density of the cigarette smoke particles is 1.18 g/cm3. The reference density of e-cigarette particles is unknown, but 1.18 g/cm3 is used considering that the diluent of e-liquid is mainly a mixture of PG (1.03 g/cm3) and VG (1.26 g/cm3). Then:
Equation (9):
d a = 1.09 × d m
Electrical mobility sizers typically have a high size resolution and fast response. Dilution is typically needed when operating an electrical mobility sizer to avoid saturation. The dilution ratio depends on the sample concentration but can reach up to 3000 times for e-cigarette characterization. The dilution process can significantly accelerate the evaporation of volatile compounds from particles such as PG, VG, and other volatile chemicals, which is further illustrated in Section 2.3.
Optical sensors utilize light properties (i.e., light scattering) to detect the particles. The most used optical sensors are optical particle counter (OPC), condensation particle counter (CPC), and laser aerosol spectrometer (LAS). These instruments quantify the magnitude of the intensity of scattering light from particles to count the number of particles per size. These instruments can work in real-time with a high-size resolution and fast response. However, the measurement range of an OPC is several hundreds of nanometers to micrometers and cannot detect nanoparticles. Furthermore, CPC cannot provide the PSD, but the total number concentration though, as mentioned earlier, CPC can be combined with DMA to measure the PSD.
Since no instrument can measure the particle mass and number distribution precisely at the same time, the combination of multiple instruments is the typical strategy taken by researchers in e-cigarette studies. Taking advantage of no dilution, the impactors can be used to measure the MMAD and particle mass concentration. Real-time techniques such as electromobility sizers and laser diffraction approaches can be used to obtain the particle number concentration and CMD since they typically have a fast response time and high size resolution.

2.3. The Impact of Experimental Conditions on Measurements of PSD

A high PNC is generated for each puff and may exceed the limit of the instrument listed in Table 1. Thus, the emissions need to be diluted before being sampled by the instrument [6]. The dilution can decrease the particle size due to the evaporation of volatile compounds from the particles, leading to an underestimation of particle sizes [6,7,8]. This can be significant for e-cigarette aerosols considering their high volatility. For example, in the study by Ingebrethsen et al., the count median diameter (CMD) of vaping emissions ranged from 296 to 458 nm without dilution; however, the CMD was only 14–18 nm when measured with dilution [6]. Furthermore, the length of the sampling line, temperature, and humidity during sampling could also lead to measurement bias since the humectants in e-liquids are hygroscopic and easily absorb water in the air during transport and measurement procedures [9], which might lead to the overestimation of particle size and mass. Thus, we call for a standardized testing protocol for PSD measurements to conduct intra-and inter-comparisons.

3. Comparison among E-Cigarettes, HnB, and Combustible Cigarettes

The comparison of PSD and aerosol concentration among e-cigarettes, HnB products, and combustible cigarettes is tricky, considering the wide variety of e-cigarette devices. The results from previous studies were summarized, but we do not suggest that the results be generalized.

3.1. Particle Number Concentration

The comparison of PNC between e-cigarettes and cigarette aerosols is inconclusive, depending on the testing method, measurement instrument, and product design variations. Marini et al. reported that the PNC of a tank system e-cigarette had a nicotine-free liquid of 3.5 ± 0.4 × 10⁹ particles/cm3 and a nicotine-containing liquid of 5.1 ± 0.1 × 10⁹ particles/cm3 [10]. In another study on three different types of e-cigarettes (i.e., tank system, atomizer system, and cartomizer system), the average total PNC of these e-cigarettes was (4.39 ± 0.42 × 10⁹ particles/cm3) [11]. These values were comparable to that of the Marlboro cigarette (3.1 ± 0.6 × 10⁹ particles/cm3) [11]. Similar results were reported by Ingebrethsen et al. and Zhang et al., showing no significant difference in PNC between e-cigarettes and 3R4F cigarettes [6,12]. However, Belka et al. showed that the PNC of a refillable Joyetech e-cigarette was two times higher than that of a Marlboro cigarette [13]. Scungio et al. also showed that the PNC of e-cigarettes (rechargeable with mint-flavored liquid with nicotine levels of 0 and 12 mg/mL) mainstream aerosols (2.23–2.34 × 10⁸ part/cm3) are higher than that of traditional cigarettes, though the surface area concentration of e-cigarette aerosols (2.48–3.35 × 10¹⁰ nm2/cm3 at 300 °C) is lower. The conflicting results from different studies can be attributed to the equilibrium processes of emitted particles. Lampos et al. pointed out that the high content of PG and VG led to the high volatility of e-cigarette-emitted aerosols and a much shorter lifetime (10–20 s) compared to combustible cigarettes (1.4 h) [14]. They observed that e-cigarettes emitted a higher particle mass and number concentrations than combustible cigarettes in the initial stage, but overall combustible cigarettes emitted a much higher particle number, mass, and volume concentration [14].

3.2. Particle Mass Concentration

The total particle mass concentration of e-cigarette emissions can be lower or higher than combustible cigarettes. For example, Pellegrino et al. reported PM1 = 14 μg/m3 for e-cigarette emissions vs. 80 μg/m3 for combustible cigarette emissions and PM10 = 52 μg/m3 for e-cigarette emissions vs. 922 μg/m3 for combustible cigarette emissions [15]. By contrast, Ingebrethsen et al. reported the max mass concentration of 3R4F reached up to 0.04 mg/cm3, which is lower than that of the tested e-cigarette of 0.05–0.10 mg/cm3 at a 55 mL puff volume for a 2 s puff duration [6].

3.3. Particle Sizes

Due to the variability in device characteristics and the range of measurement techniques, the MMAD values of e-cigarettes had a wide range of 0.3–3 μm with impactor measurements [16,17,18,19,20,21,22,23,24]. In contrast, The MMAD of conventional cigarette smoke was measured by impaction range from 0.4 to 0.9 μm [22,25,26]. The MMAD of IQOS measured by a cascade impactor was claimed to range from 0.54 μm to 0.75 μm [25,27]. The CMD of e-cigarettes also had a wide range (30–450 nm) [6,12,16,28,29], smaller than MMAD values. The GSD values were in the range of 1–3.
The particle formation process in combustible cigarettes and e-cigarettes is a combination of nucleation, condensation, and coagulation involving gas-to-particle partitioning. The particle formation depends largely on the internal temperature, which determines the evaporation and cooling effect. The temperature of the combustion zone of conventional cigarettes can reach up to 700–950 °C [30,31]. Due to its high combustion temperature, combustible cigarette smoke can easily produce a high boiling point or low volatility organics, which can readily form large particles. HTP with a heating element temperature of 250–350 °C tends to produce more volatile and semi-volatile organics, which lead to relatively small particles [32]. The coil temperature of e-cigarettes is even lower, in the range of 200–300 °C [33]. Therefore, volatile and semi-volatile constituents in e-liquids are released from e-cigarettes, which form smaller particles than combustible cigarettes or HTP, as confirmed by previous studies [13,34,35,36,37].

3.4. Modes of PSD

The PSD of e-cigarettes can be monomodal, bimodal, or even multimodal. Most studies only report one mode due to the limit in the measurement range of their instrument. Overall, there can be one or two modes within the range from 1 nm to 1000 nm and one more mode above 1000 nm for e-cigarettes and conventional cigarettes. For example, in the study of Devalal et al., a bimodal PSD was observed for a second-generation Hemag Nova AG and a fourth-generation Joytech e-cigarette device, but combustible cigarettes (i.e., 3R4F) showed a unimodal distribution in the range of 10–600 nm [38]. Papaefstathiou et al. observed three modes for the particle number distribution of e-cigarettes and two modes for the conventional cigarette in the range of 0.03–2.5 μm [39]. Li et al. reported only one mode within the range of 1–1000 nm for the e-cigarette, HnB, and conventional cigarette products in their study [34].

4. Factors Affecting PSD of E-Cigarette Emissions

To further assess e-cigarette toxicity, the aerosol delivery and deposition efficiency of e-cigarette aerosols along the human respiratory tract need to be quantified, and these are highly dependent on the aerosol PSD and aerosol flow rate. However, the PSD of the e-cigarette aerosol is difficult to accurately measure given the presence of relatively high volatility and hygroscopicity of the main constituents of e-liquid (i.e., PG and VG) and the distortion introduced during the measurement instrument, such as the dilution of sampling air and aerosol aging. E-cigarette aerosols may quickly evaporate if strongly diluted; they may absorb water in a humid environment, grow, and coagulate under the condition of a relatively low flow rate, high pressure, or longer residence time. There are several main factors that can affect the PSD of e-cigarette aerosols. These factors can be further categorized into three key categories: (1) puff topography; (2) device; (3) E-liquid.

4.1. Puff Behavior

There are two major vaping habits: MTL (mouth-to-lung) and DTL (direct-to-lung). MTL vaping is a style of vaping in which e-cigarette users first pull the vapor into their mouth and then into their lungs, while DTL vaping refers to the style in which e-cigarette users pull vapor directly into their lungs. The main differences between these two vaping habits are the inhalation volume (consequently, airflow rate). For MTL, the puff volume is typically between 50–100 mL [40]. To replicate the inhaling cigarette experience and obtain a high nicotine delivery, the user holds the vapor in the mouth and then inhales air to dilute the vapor in the lung, which does not exhale a huge cloud. Most pod systems are designed for MTL vaping. In DTL inhalation (intense vaping regimen), to deliver more flavor and more cloud, the user inhales the vapor straightly into the lung, and the puff volume of DTL is closer to the human tidal volume of 500 mL [40]. The user’s lungs will be filled with more vapor, and thus, they breathed out a bigger cloud. A tank system with high power is typically designed for DTL vaping. The DTL inhaling allowed a broader power range and higher e-cigarette energy efficiency (the ratio between the energy used for moisture evaporation and the supplied energy) [40]. For the same puff duration of 3 s, the puff flow rate of MTL 55 mL (International Organization for Standardization 20,768 standard) is 18.3 mL/s, and that of DTL 500 mL is about 166.7 mL/s. This difference in flow rate can make a substantial difference in the particle emissions from e-cigarettes. However, the research on the PSD of DTL vaping is limited. Given the popularity of DTL among vapers, future studies are needed to further an understanding of DTL-style vaping and its health impacts.
The most important characteristics of puffing topography are (1) puff duration (s) and (2) puff flow rate (mL/s or L/min) or puff volume (mL or L). Both puff duration and puff flow rate have a strong effect on the PSD of mainstream e-cigarette aerosols, which is a crucial parameter in determining particle deposition in various parts of the human respiratory system.
Behar et al. found that the average puff duration for experienced smokers was 2.65 ± 0.98 s, with an average flow rate of 1.2 ± 0.36 L/min (peak flow of 1.62 L/min) [41]. Farsalinos et al. studied the puff topography of two groups: experienced e-cigarette smokers and tobacco smokers who switched to using e-cigarettes [42]. For e-cigarette users, their average puff duration was 4.2 ± 0.7 s, while for tobacco smokers who switched to e-cigarettes, it was 2.4 ± 0.5 s. Regarding the puff flow rate, one study indicated that 0.42 L/min is the minimum puff flow rate of most tested brands [29]. An increase in puff duration can increase the coil temperature at a rate of 20–50 °C/s [43], which can consequently lead to higher PNC [11].
The increase in the puffing flow rate, on the one hand, can result in an increase in the e-liquid transported to the wick, which facilitates particle formation and increases PNC [44]. On the other hand, a higher puffing flow rate can also decrease the aerosol residence time and bring a cooling effect on the heated coil, which can restrict the nucleation or coagulation of particles and leads to a decrease in particle size [22,43,44,45]. These two competing processes may lead to conflicting results from different studies. For example, Son et al. conducted a comprehensive investigation on the puffing topography impact on the PSD of e-cigarettes [45]. The puff volume was set to 35 mL, 90 mL, or 170 mL, and the puff duration was set to 2 s or 3.8 s. With a 3.8 s puff duration, the increase in puff volume could significantly increase PNC but reduce CMD and MMD. However, Ranpara et al. reported no significant change in PSD when comparing the puff volumes of 55 mL, 65 mL, and 75 mL [46]. For some devices, a longer puff allows more electrical energy to be converted to heat, resulting in a higher coil temperature and, consequently, more particle formation [47]. However, Talih et al. concluded that there was no influence of puff flow rate on the nicotine emitted per puff second when compared to the five distinct puff profiles representing (1) a tobacco cigarette smoker (2-s puff duration, 33–mL/s puff flow rate), (2) a slow average vaper (4 s, 17 mL/s), (3) a fast average vaper (4 s, 33 mL/s), (4) a slow extreme vaper (8 s, 17 mL/s), and (5) a fast extreme user (8 s, 33 mL/s) [48].
Lastly, it should be noted that the puffing topography for the smoking machine can be different from the realistic scenario [2]. Thus, caution is needed to apply the above results to human vaping.

4.2. Device Features

The device design varies with the manufacturer and the device generation. The heating process of the e-liquid is influenced by the device design, such as the device type, power output, and coil resistance. Thus, all these parameters can impact the PSD of e-cigarette emissions.

4.2.1. Device Generation

E-cigarette devices have been continuously evolving since their introduction in the early 21st century. Till now, there have been four generations of e-cigarettes: the cig-a-like (first generation), clearomizer (second generation), mod (third generation), and pod (fourth generation). The definitions and corresponding characteristics have been summarized in a previous review and the report by the National Academy of Science, Engineering, and Medicine [1,4]. Only a few studies are concerned with the impact of device generation on PSD. Protano et al. measured particle emissions from four different generations of e-cigarettes and observed a progressive increase in PM emissions from the first to the fourth generation [2]. Delaval et al. found that a fourth-generation device emitted a higher particle mass concentration than a second-generation device but a lower number concentration [38]. More studies are needed when newer generations of e-cigarettes are introduced into the market.

4.2.2. Device Refill Type

Overall, the comparison results among different refill types (refillable/disposable/prefilled) are inconclusive due to a wide range of device characteristics. Zhao et al. assessed the aerosol emissions of these three different tank types and found that disposable e-cigarettes generated the highest PNC (7.1 × 10⁶ particles/cm3), followed by pre-filled types (4.6 × 10⁶ particles/cm3) and refillable types (2.7 × 10⁶ particles/cm3) [47]. Bi-modal size distribution was observed for aerosols generated by all three types of ENDS [47]. They also reported that the CMD of disposable e-cigarettes was the smallest (108 nm and 1.04 µm) compared to those of pre-filled e-cigs (201 nm and 1.25 µm) and refillable e-cigs (206 nm and 1.04 µm), though no significant differences in PM mass concentration were observed among these devices.
The disposable device does not always produce the smallest particle sizes. Alderman et al. reported the mass median average diameter of two rechargeable devices (with “cartomizer” cartridge) and one disposable device as 631 nm, 487 nm, and 534 nm, respectively [16]. Additionally, Fuoco et al. studied the particle number concentrations of three different types of devices: (1) the tank system, (2) the atomizer system, and (3) the cartomizer system, but found no statistical differences between the devices tested [11]. Sousan et al. compared the PSD of one refillable (VooPoo Drag 2), two disposables (NJOY Daily and Hyde), and two prefilled (NJOY Ace and JUUL) e-cigarettes and reported that the refillable device generated the highest PM concentrations in all sizes and one prefilled cigarette (JUUL) generated the lowest concentration [49].

4.2.3. Operation Power

For a given device, the power output has a large impact on particle emissions. The power output of the e-cigarette is determined by the source voltage and coil resistance. Devices with a coil resistance of less than 1 ohm are so-called “sub-ohm” devices. Sub-ohms devices produce more vapor and clouds due to their high-power output.
The increase in power can significantly increase the temperature and allow more e-liquids to be heated and evaporated, along with an increase in particle number concentration [45,46,49,50,51] and an enhanced formation of bigger particles through condensation during which big particles serve as the sink for small particles [46,49]. This can finally lead to an increase in nicotine flux [48]. A sharp increase in temperature may happen with a long puff duration or insufficient supply of e-liquid, leading to the overheating of the coil along with the elevated emissions of aldehydes and an unpleasant taste, which is the so-called “dry burn” or “dry hit” [52]. Devices with a wide range of power operations often lead to “dry hit”. Recent developed ENDS devices (e.g., Joytech Exceed Grip Kit, VAPORESSOR Renova Zero Pod, VooPoo Vinci Pod Mod Kit, VAPORESSO DEGREE, and IPHA Zing Pod Kit) have been equipped with temperature control systems (“dry burn protection”) to prevent the dry hits. This feature measures the coil temperature by monitoring the temperature coefficient of resistance and shuts down the battery when the coil temperature exceeds the preset maximum temperature value. Studies are needed to evaluate the effectiveness of “dry burn protection” on temperature control and the particle emissions from these devices.
With respect to the impact of power on particle formation, Son et al. observed a 4-time increase in particle number concentration when the power increased from 6.4 W to 31.3 W [45]. Gillman et al. reported a large increase in aerosol mass per puff by testing five different devices, with an increase from 7.5 mg/puff to 28 mg/puff when increasing the power from 10 W to 25 W for one device [53]. However, the particle number concentration was not necessarily positively correlated with the power output but could show a decreasing trend when the voltage output exceeded a limit [47]. The study by Bertrand et al. tested a device (iStick 30 W with an atomizer of GS Air, Eleaf) and found a linear increase in MMAD when the power increased from 7 W to 13 W [54]. Similar results have also been found in other studies [5,46,49,55,56,57,58]. Floyd et al. reported that an increase in the power output led to a decrease in nanosized particles but an increase in micro-sized (~1000 nm) particles [59]. This confirms that small particles can sink into big particles during the condensation process.
Since the coil resistance increases when increasing the temperature, which complicates the change in the power output, the impact of coil resistance or voltage alone on the PSD is not always observable depending on the experimental conditions applied. For example, Mulder et al. reported that battery output (V) and resistance (Ω) were found to have no significant impact on PSD [24].

4.2.4. Coil Aging

With excessive usage, dry burn, or increased puff number, the heating coil ages, eventually leading to the melting and breakage of the coil. Thus, coil aging (number of puffs) has also been investigated as a potential factor influencing PSD. It has been found that the PSD (e.g., MMAD, GSD, CMD, and particle number concentration) of e-cigarettes did not significantly change with the increase in puff number, while the particle number concentration of conventional cigarettes and HnB increases with the puff number [23,34].

4.3. E-Liquid

In addition to the puff topography and device design, the e-liquid applied can also affect the PSD.

4.3.1. PG/VG Ratio

The PG/VG ratio is considered a strong determinant of PSD due to the different physical properties of PG and VG. Researchers agree that the total number concentration is lower and particle sizes (e.g., CMD and MMAD) are smaller when the PG/VG ratio is high [18,45,54,60]. When the PG/VG ratio increased from 0 to 100, the CMD decreased from 97 nm to 44 nm [45]. Bertrand et al. found that a higher PG level led to smaller MMAD [54], consistent with the findings by Larcombe [60]. VG has a much lower vapor pressure (0.01 Pa at room temperature) than PG (20 Pa at room temperature) and, therefore, is more prone to condense on the particle phase than PG, leading to higher particle number concentrations and larger particle sizes [45]. However, Prévôt et al. reported that there was no statically significant difference between the MMAD of e-liquids with a 20PG/80VG (0.76 ± 0.03 μm) and 80PG/20VG (0.79 ± 0.01 μm) formulation [61].

4.3.2. Flavoring

Various flavoring compounds are available in e-liquids. Most flavorants are found to decrease particle sizes. However, the impact of flavoring on e-cigarette emitted particles showed conflicting results due to the fact that (1) the concentration of flavorings in various e-liquids can be different; (2) most flavoring ingredients contain PG; thus, PG/VG ratios of e-liquids can be changed when adding flavorings [62,63]. The underlying mechanisms are as yet unclear. Son et al. concluded that except for strawberry and dragon fruit, flavored e-liquids (i.e., menthol, cinnamon, bubble gum, Bavarian, sweet cream, and graham) significantly decreased particle number concentrations compared to non-flavored e-liquids [45]. Ranpara et al. also observed a lower MMAD (5% nicotine, 0.92 μm; 3% nicotine, 1.11 μm) for a menthol-containing JUUL pod compared with the other studied JUUL pods (i.e., Virginia Tobacco, Classic Tobacco, Crème Brulee, Fruit Medley, Mango, and Classic Menthol) [46]. Stefaniak et al. added a mixture of flavoring (0.3% w/w. of each of vanillin, 3-methyl-1-butanol, 2-methylbutyric acid, 2,3-butanedione, 2,3-pentanedione, and 2,3-hexanedione) and observed a relatively lower MMAD of flavored e-liquids compared with humectants only [8]. Different from the results of Stefaniak et al. concerning vanillin [8], Lechasseur et al. observed an increase in particle size when adding 1% vanillin into the e-liquid [63]. Stefaniak et al. attributed this inconsistency to the different concentrations of vanillin. Furthermore, Lechasseur et al. found that the presence of menthol or maltol did not change the PSD compared to humectants only [63]. Some other studies also reported that there was no significant difference in PSD between different flavored e-liquids [11,18,45,64].

4.3.3. Nicotine Strength

Another factor that may affect PSD is the nicotine strength of e-liquids. Most recent studies agreed that the addition of nicotine to the PG/VG mixture could reduce the particle size and increase the particle number concentration (PNC) and particle mass concentration compared to nicotine-free e-liquids [8,11,60,64,65,66]; however, the effect is insignificant when further increasing the nicotine concentration [64]. Stefanik et al. also reported an increase in particle mass concentration when comparing 2.4% nicotine-containing e-liquids with nicotine-free e-liquids with either 30PG/70VG or 70PG/30VG [8]. The upper limit of nicotine strength to sustain this trend may vary depending on the e-liquids applied. For example, Luo et al. reported a decrease in MMAD and an increase in PNC when adding 1.2% nicotine to their homemade PG/VG mixtures, but no further change was observed when nicotine strength reached 2.4% [64]. In another study by Ranpara et al. using JUUL devices, the positive relationship between nicotine strength and MMAD was sustained until nicotine strength reached up to 5% for all flavors except the mint flavor [46].
Due to the variation in the experimental setup, device, and e-liquid characteristics, completely different results have been reported. Some studies indicated an increase in particle size in the presence of nicotine [24,60,63], while some studies reported no dependence of particle sizes on the nicotine content [11,13,24,67,68,69,70], and some even showed a decrease in particle size along with a reduction in submicron and microparticles in the presence of nicotine [8,71,72]. Though the underlying mechanisms are not fully determined yet, the influence of nicotine on e-cigarette aerosols can be related to the modification of physicochemical properties (i.e., hygroscopic property and volatility) of e-cigarette aerosols with the addition of nicotine compared to the nicotine-free PG/VG mixture. First, the vapor pressure of nicotine (5 Pa) is between those of PG (0.01 Pa) and VG (20 Pa). When the PG/VG ratio is small, the volatility of e-liquid is determined by the contribution of VG, and the addition of nicotine has a limited impact on the volatility of the e-liquid. However, when the PG/VG ratio is large enough (e.g., larger than 30/70), the e-liquid is relatively volatile, and the addition of nicotine can significantly reduce the volatility of e-cigarette aerosols [72]. Second, Kaiser et al. attributed the decrease in submicron and microparticles to the lower affinity of nicotine (Log Know = 1.17) compared to those of PG (Log Kow= −0.92) and VG (Log Kow = −1.76), which have a higher affinity and are more soluble in water (the smaller Log Kow means the higher solubility in water) [71]. Third, Ma et al. found that the addition of nicotine could stabilize the e-cigarette aerosols in the aqueous phase, though they did not explicitly link this to particle sizes [73]. Altogether, the fundamental mechanism behind the linkage of nicotine strength and particle size is still unveiled and needs further investigation.

4.3.4. Nicotine Form

Nicotine has two basic nitrogen groups with pKa values of pKa,1 = 3.12, and pKa,2 = 8.02. Thus, aqueous phase nicotine can come in three forms, namely freebase (Nic), monoprotonated (NicH+), and biprotonated (NicH22+) [74]. Under the basic condition (pH > pKa,2), nicotine is mostly in neutral form and volatile, and thus, can evaporate completely from e-cigarette aerosols within a few ten seconds [75]. While under slightly acidic conditions (pKa,2 < pH < pKa,2), nicotine is in a charged state (singly or doubly protonated) and non-volatile, and thus, tends to stay in the aerosol phase. Surprisingly, Li et al. claimed that nicotine could only be found in the particle phase regardless of whether free-base or nicotine salts were used [76]. In contrast, Aszyk et al. reported a high concentration of gas-phase nicotine (4.5–33.4 mg nicotine per gram of consumed e-liquid) for tobacco-flavored e-liquid (17.9 ± 0.9 mg nicotine per gram of consumed e-liquid) [77].
Seeman [78] reported that unprotonated and protonated nicotine had comparable nicotine yield and efficiencies during the smoking process. With the modeling approach, Pichelstorfer et al. predicted that nicotine deposits preferentially in the condensed phase for nicotine salt e-liquid and in the vapor phase for freebase e-liquid [79]. The review by Gholap et al. demonstrated that there were contradictory results about the absorption profiles of nicotine forms [80]. Based on our knowledge, currently, there has not been any research to study the influence of the nicotine form on PSD in a controlled manner. The nicotine form can determine the bioavailability of nicotine, thereby affecting the abuse liability of vapers. Further studies are warranted to study the linkage between nicotine form, PSD, and further nicotine delivery.

5. Particle Formation, Dynamics, and Deposition Modeling

The uptake and clearance of inhaled particles largely depend on the size of these particles [81] and, thus, are directly linked to possible health outcomes and nicotine delivery in the respiratory tract. The size of the particles dynamically evolves throughout the inhalation process.
The particle formation from e-cigarettes in the initial stage includes two major processes: (1) nanoparticles are formed by nucleation from supersaturated vapor through condensation [59]; (2) bigger particles are formed by nanoparticle coagulation due to the high concentration of particles when emitted freshly from the heating coil [82]. E-cigarette aerosols evolve dynamically throughout the vaping and deposition process. It has been reported that the composition of a single e-cigarette aerosol can change exponentially on a time scale of seconds [75]. During vaping, the particles undergo three deposition phases: (1) puff withdrawal: the introduction of particles to the mouth, which is characterized by particle impaction and sedimentation; (2) mouth-hold: the vapor is held in the mouth for a few seconds which is characterized by particle diffusion and sedimentation; (3) aerosol transfer to the lower airways: the vapor is inhaled to the lungs which are mostly characterized by particle impaction [83]. Large aerosol particles (>10 μm) tend to deposit mainly via impaction in the oropharyngeal region, whilst medium and small-size aerosols (1–5 μm) deposit mainly via sedimentation and diffusion in the deep lungs [84]. Smaller particles (<1 μm) are mostly exhaled [84,85]. For example, the deposition fractions of particles with sizes of 0.04 μm and 0.10–0.4 μm are 40–70 % and 20–40%, respectively [85,86]. Due to the cloud effect, which allows a single particle to move with the particle cloud with the same settling velocity, smaller particles can also deposit in upper lung airways [45]. In addition to deposition, given the high volatility of e-cigarette aerosols and high humidity throughout the respiratory tract, e-cigarette vapor (gas and particles) also dynamically evolves through these processes: (1) coagulation of smaller particles to bigger particles; (2) particle growth through condensation; (3) particle size reduction through evaporation; (4) vapor absorption through the walls of the respiratory tract.
The calculation of particle exposure dosimetry is useful to predict possible health consequences and estimate nicotine and HPHC delivery when evaluating the short-term and long-term health impact of e-cigarette use. There have been six different types of models that have been developed to predict particle deposition in the respiratory tract: (1) the semi-empirical regional compartment model, (2) one-dimensional cross-section or “trumpet” models, (3) deterministic symmetric generation or ‘‘single-path’’ mode, (4) deterministic asymmetric generation or ‘‘multiple-path’’, (5) stochastic multiple-path model, and the (6) single-path computational fluid and particle dynamics (CFPD) model. Table 2 is intended to briefly summarize the characteristics of these models and provide a guide for researchers in the e-cigarette field to select a model for their own purpose. The details of these models have been discussed in previous reviews and book chapters [87,88,89,90].
The first three models are greatly simplified and have limited applications. Briefly, in a semi-empirical regional compartment model, represented by the international commission on radiology protection (ICRP) model, the lung is modeled using only three regions (i.e., extrathoracic region, tracheobronchial region, and alveolar region). Lechasseur et al. used the ICRP model to predict the particle deposition of emissions from a mod-style e-cigarette (Joytech eVIC-VTC Mini) [63]. For the one-dimensional cross-section, or “trumpet” models, the human airway system is represented by a one-dimensional cross-section channel, the cross-sectional area of which increases with the distance from the trachea, similar to a trumpet shape. This model is also greatly simplified. The transport and deposition of particles can be calculated by solving the time-dependent differential equation of particle number concentration. In the deterministic symmetric generation or “single-path” model, all airways in a given airway generation are assumed to have identical linear dimensions [63,88]. Thus, all particle pathways can be represented by a single path. Based on our best knowledge, the “Trumpet” model and the deterministic “single path” model have not been applied to predict the particle deposition of e-cigarette aerosols.
The next three models have relatively wider applications. The deterministic asymmetric generation or “multiple path” model adopts a more realistic lung model based on actual measurements of single airways and their branching structure, thus reflecting the asymmetry of airways and corresponding flow rates [87,88]. At an airway bifurcation, the airflow in each daughter airway is assumed to be proportional to its distal volume. The multi-path particle deposition (MPPD) model has been mostly used by current researchers to study particle deposition in the e-cigarette scenario, considering its free access and user-friendly interface. However, the major disadvantage of this model is that it does not consider the volatility and hygroscopicity of aerosols, thus omitting the evaporation/coagulation/condensation of aerosols or absorption of water during transportation.
To extend the model variability, a stochastic multiple-path model, namely, IDEAL (inhalation, deposition and exhalation of aerosols in the lungs) model, was developed. This model has been continuously developed since the 1990s and has been coupled with supplemental modules to serve different purposes. This model randomly splits the parent airway into two branching daughter airways based on probability density functions and related correlations [91]. The actual path of the particle from each bifurcation is randomly selected from the airflow-splitting distribution based on distal lung volumes [92]. To include the dynamic changes in inhaled particles during the transport (puffing, mouth-hold, and within the lungs during inspiration, and expiration), the aerosol dynamic model (ADiC, aerosol dynamics in containments) is developed and coupled with the IDEAL code [93]. This combination was firstly applied by Pichelstorfer et al. to the e-cigarette field by the development of a single path version of the IDEAL code [94]. They later fully coupled IDEAL and ADiC (IDEAL/ADiC_v1.0) and applied the multi-path version of the IDEAL code [79]. Despite its stochastic feature, this model has limited anatomical and physiological variability because the stochastic lung geometry is derived from measurements of two lungs. Actually, this is the limitation for all the morphometric models discussed here.
Different from the models above that utilize only analytical equations to track the flow of particles, the single-path CFPD model allows for a numerical solution to the airflow, which reduces the computational cost [95]. CFPD has substantially improved over the recent decade. The detailed theory, modeling procedures, and application of CFPD can be found in the previous review and book chapter [95,96]. The CFPD model initially could only be used to predict the particle deposition on a local scale, but there are strategies that can be employed to apply it to the whole-lung region [96]. The CFPD model also includes the effects of condensation or evaporation by adding an additional term to the differential equation of the mass fraction [96]. Haghnegahdar et al. is the first study that applied the CFPD model to predict the translocation of e-cigarette particles [97]. Combined with a physiological-based toxicokinetic (PBTK) model, they were capable of dosimetry data of multicomponent e-cigarette aerosols in the respiratory tract through the monodispersed particle diameter was assumed. Thus, there is still room for improvement.
Depending on the purpose and modifications of each study, the input and output parameters for the MPPD model, IDEAL model, and CFPD model can vary. Overall, they require all or partial information on PSD (e.g., CMD, MMAD, GSD, particle number concentration, and particle mass concentration), tidal volume, puff topography (e.g., puff volume, puff duration, and puff interval), and aerosol density. The outputs include the particle/vapor deposition fractions in each airway generation after each puff and time profiles of accumulated particle/vapor deposition fractions. The modeling research on e-cigarette particle dosimetry deserves a separate review. Here, we briefly summarize the results of studies after 2010 in Table 3.

6. Knowledge Gap Analysis

The current studies have explored the PSD of e-cigarettes and attempted to link it to the health impacts of e-cigarette use. However, there is still a large gap between what is known and unknown.
First, the experimental setups can influence the results significantly, adding to the difficulty of conducting inter-comparisons. Thus, researchers in the e-cigarette field are calling for a standardized experimental protocol to provide guidance on dilution ratio, measurement equipment, reference device, reference e-liquid (PG/VG ratio, nicotine strength, flavorant, nicotine form), operation power, coil resistance, and puffing topography (puff duration, puff interval, puff flow rate). Another challenge is the continuous development and evolution of e-cigarettes, adding another dimension to profile e-cigarette aerosols. Some devices, such as Suorin Air Plus (Suorin, Brea, CA, USA) and Vinci (Voopoo Inc., Jilin, China), have poor consistency [102]. This problem needs to be solved in newer generations of e-cigarettes. Third, the impact of device refill type and nicotine form on particle formation has not been fully studied yet. Fourth, given the high volatility of e-liquid and low coil temperature, the particle dynamics of e-cigarette emissions can be different than the case of conventional cigarette and HnB products. To obtain an accurate prediction of particle deposition in the respiratory system, model modifications are needed to consider the unique puff topography, volatility, chemical composition, and density of e-cigarette aerosols. Last but not least, to minimize the deposition of HPHC and optimize nicotine delivery, the information on size-dependent nicotine and HPHC delivery are essential to promote the application of e-cigarettes as an alternative to the nicotine delivery approach. Su et al. pointed out that as particle size decreased, the mass fraction of chemicals with high boiling points (low vapor pressure) in the particles increased, while that of chemicals with low boiling points (high vapor pressure) in the particles decreased [103]. More studies are warranted to obtain the size-dependent chemical compositions of e-cigarette aerosols.

7. Conclusions

In this review, we presented the basic concepts of particles/aerosols and the descriptive parameters of PSD. We discussed the advantages and disadvantages of measurement approaches to provide a guide for future studies. Most importantly, the impact of puffing topography, device characteristics, and e-liquid on PSD and particle formation from e-cigarettes have been summarized systematically. It is apparent that there is still a large gap between the PSD and influencing factors, which warrants future study. The particle deposition models that have been applied in the e-cigarette field are also listed here, but these models need to be adapted to consider the uniqueness of e-cigarette aerosols.

Author Contributions

Conceptualization, H.J.; literature review and investigation, H.J., X.G., Y.G. and Y.L.; writing—original draft, H.J.; writing—review and editing, H.J., X.G., Y.G. and Y.L.; visualization, H.J. and Y.L. All authors have read and agreed to the published version of the manuscript.

Funding

This research received no external funding.

Institutional Review Board Statement

Not applicable.

Informed Consent Statement

Not applicable.

Data Availability Statement

No new data were created or analyzed in this study. Data sharing is not applicable to this article.

Acknowledgments

This publication was made possible in part through access to University Lab Partners (ULP): a nonprofit, wet lab incubator located in UCI Research Park and a project of the Beall Family Foundation.

Conflicts of Interest

The authors have no conflict of interest to declare that are relevant to the content of this article. All the authors were employed by Scientific Horizons Consulting LLC. The authors declare that this review was conducted in the absence of any commercial or financial relationships that could be construed as a potential conflict of interest.

References

  1. Williams, M.; Talbot, P. Design Features in Multiple Generations of Electronic Cigarette Atomizers. Int. J. Environ. Res. Public Health 2019, 16, 2904. [Google Scholar] [CrossRef] [Green Version]
  2. Protano, C.; Avino, P.; Manigrasso, M.; Vivaldi, V.; Perna, F.; Valeriani, F.; Vitali, M. Environmental Electronic Vape Exposure from Four Different Generations of Electronic Cigarettes: Airborne Particulate Matter Levels. Int. J. Environ. Res. Public Health 2018, 15, 2172. [Google Scholar] [CrossRef] [Green Version]
  3. Krüsemann, E.J.Z.; Havermans, A.; Pennings, J.L.A.; de Graaf, K.; Boesveldt, S.; Talhout, R. Comprehensive overview of common e-liquid ingredients and how they can be used to predict an e-liquid’s flavour category. Tob. Control 2021, 30, 185. [Google Scholar] [CrossRef] [PubMed] [Green Version]
  4. National Academies of Sciences, Engineering, and Medicine; Health and Medicine Division; Board on Population Health and Public Health Practice; Committee on the Review of the Health Effects of Electronic Nicotine Delivery Systems. Public Health Consequences of E-Cigarettes; Eaton, D.L., Kwan, L.Y., Stratton, K., Eds.; National Academies Press: Washington, DC, USA, 2018. [Google Scholar]
  5. Wilson, M.D.; Prasad, K.A.; Kim, J.S.; Park, J.H. Characteristics of metallic nanoparticles emitted from heated Kanthal e-cigarette coils. J. Nanopart. Res. 2019, 21, 156. [Google Scholar] [CrossRef] [Green Version]
  6. Ingebrethsen, B.J.; Cole, S.K.; Alderman, S.L. Electronic cigarette aerosol particle size distribution measurements. Inhal. Toxicol. 2012, 24, 976–984. [Google Scholar] [CrossRef]
  7. Cheng, T. Chemical evaluation of electronic cigarettes. Tob. Control 2014, 23, ii11. [Google Scholar] [CrossRef] [PubMed]
  8. Stefaniak, A.B.; Ranpara, A.C.; Virji, M.A.; LeBouf, R.F. Influence of E-Liquid Humectants, Nicotine, and Flavorings on Aerosol Particle Size Distribution and Implications for Modeling Respiratory Deposition. Front. Public Health 2022, 10, 782068. [Google Scholar] [CrossRef] [PubMed]
  9. Harvanko, A.M.; Havel, C.M.; Jacob, P.; Benowitz, N.L. Characterization of Nicotine Salts in 23 Electronic Cigarette Refill Liquids. Nicotine Tob. Res. 2020, 22, 1239–1243. [Google Scholar] [CrossRef]
  10. Marini, S.; Buonanno, G.; Stabile, L.; Ficco, G. Short-term effects of electronic and tobacco cigarettes on exhaled nitric oxide. Toxicol. Appl. Pharmacol. 2014, 278, 9–15. [Google Scholar] [CrossRef] [PubMed]
  11. Fuoco, F.C.; Buonanno, G.; Stabile, L.; Vigo, P. Influential parameters on particle concentration and size distribution in the mainstream of e-cigarettes. Environ. Pollut. 2014, 184, 523–529. [Google Scholar] [CrossRef]
  12. Zhang, Y.; Sumner, W.; Chen, D.-R. In vitro particle size distributions in electronic and conventional cigarette aerosols suggest comparable deposition patterns. Nicotine Tob. Res. 2013, 15, 501–508. [Google Scholar] [CrossRef]
  13. Belka, M.; Lizal, F.; Jedelsky, J.; Jicha, M.; Pospisil, J. Measurement of an electronic cigarette aerosol size distribution during a puff. EPJ Web Conf. 2017, 143, 02006. [Google Scholar] [CrossRef] [Green Version]
  14. Lampos, S.; Kostenidou, E.; Farsalinos, K.; Zagoriti, Z.; Ntoukas, A.; Dalamarinis, K.; Savranakis, P.; Lagoumintzis, G.; Poulas, K. Real-Time Assessment of E-Cigarettes and Conventional Cigarettes Emissions: Aerosol Size Distributions, Mass and Number Concentrations. Toxics 2019, 7, 45. [Google Scholar] [CrossRef] [Green Version]
  15. Pellegrino, R.M.; Tinghino, B.; Mangiaracina, G.; Marani, A.; Vitali, M.; Protano, C.; Osborn, J.F.; Cattaruzza, M.S. Electronic cigarettes: An evaluation of exposure to chemicals and fine particulate matter (PM). Ann. Ig. 2012, 24, 279–288. [Google Scholar]
  16. Alderman, S.L.; Song, C.; Moldoveanu, S.C.; Cole, S.K. Particle Size Distribution of E-Cigarette Aerosols and the Relationship to Cambridge Filter Pad Collection Efficiency. Contrib. Tob. Nicotine Res. 2015, 26, 183–190. [Google Scholar] [CrossRef] [Green Version]
  17. Lerner, C.A.; Sundar, I.K.; Watson, R.M.; Elder, A.; Jones, R.; Done, D.; Kurtzman, R.; Ossip, D.J.; Robinson, R.; McIntosh, S. Environmental health hazards of e-cigarettes and their components: Oxidants and copper in e-cigarette aerosols. Environ. Pollut. 2015, 198, 100–107. [Google Scholar] [CrossRef] [Green Version]
  18. Baassiri, M.; Talih, S.; Salman, R.; Karaoghlanian, N.; Saleh, R.; El Hage, R.; Saliba, N.; Shihadeh, A. Clouds and “throat hit”: Effects of liquid composition on nicotine emissions and physical characteristics of electronic cigarette aerosols. Aerosol Sci. Technol. 2017, 51, 1231–1239. [Google Scholar] [CrossRef] [PubMed] [Green Version]
  19. Sundahl, M.; Berg, E.; Svensson, M. Aerodynamic particle size distribution and dynamic properties in aerosols from electronic cigarettes. J. Aerosol Sci. 2017, 103, 141–150. [Google Scholar] [CrossRef]
  20. Holbrook, L.T.; Zeman, K.L.; Burke, A.; Jaspers, I.; Bennett, W.D. Radiolabeling an Electronic Cigarette Aerosol Using Technetium Carbon Ultrafine Particles. J. Aerosol Med. Pulm. Drug Deliv. 2018, 32, 47–53. [Google Scholar] [CrossRef]
  21. Montigaud, Y.; Manzotti, B.; Chevrel, S.; Leclerc, L.; Sarry, G.; Clotagatide, A.; Pourchez, J.; Prévôt, N. Aerosol regional deposition of electronic cigarette emissions using an original ex vivo respiratory model. J. Aerosol Sci. 2021, 151, 105633. [Google Scholar] [CrossRef]
  22. Kane, D.B.; Li, W. Particle size measurement of electronic cigarette aerosol with a cascade impactor. Aerosol Sci. Technol. 2021, 55, 205–214. [Google Scholar] [CrossRef]
  23. Oldham, M.J.; Zhang, J.; Rusyniak, M.J.; Kane, D.B.; Gardner, W.P. Particle size distribution of selected electronic nicotine delivery system products. Food Chem. Toxicol. 2018, 113, 236–240. [Google Scholar] [CrossRef]
  24. Mulder, H.A.; Patterson, J.L.; Halquist, M.S.; Kosmider, L.; Turner, J.B.M.; Poklis, J.L.; Poklis, A.; Peace, M.R. The Effect of Electronic Cigarette User Modifications and E-liquid Adulteration on the Particle Size Profile of an Aerosolized Product. Sci. Rep. 2019, 9, 10221. [Google Scholar] [CrossRef] [PubMed] [Green Version]
  25. Schaller, J.-P.; Keller, D.; Poget, L.; Pratte, P.; Kaelin, E.; McHugh, D.; Cudazzo, G.; Smart, D.; Tricker, A.R.; Gautier, L.; et al. Evaluation of the Tobacco Heating System 2.2. Part 2: Chemical composition, genotoxicity, cytotoxicity, and physical properties of the aerosol. Regul. Toxicol. Pharmacol. 2016, 81, S27–S47. [Google Scholar] [CrossRef] [Green Version]
  26. Dalrymple, A.; Ordoñez, P.; Thorne, D.; Walker, D.; Camacho, O.M.; Büttner, A.; Dillon, D.; Meredith, C. Cigarette smoke induced genotoxicity and respiratory tract pathology: Evidence to support reduced exposure time and animal numbers in tobacco product testing. Inhal. Toxicol. 2016, 28, 324–338. [Google Scholar] [CrossRef] [PubMed] [Green Version]
  27. St. Helen, G.; Jacob Iii, P.; Nardone, N.; Benowitz, N.L. IQOS: Examination of Philip Morris International’s claim of reduced exposure. Tob. Control 2018, 27, s30. [Google Scholar] [CrossRef]
  28. Pacitto, A.; Stabile, L.; Scungio, M.; Rizza, V.; Buonanno, G. Characterization of airborne particles emitted by an electrically heated tobacco smoking system. Environ. Pollut. 2018, 240, 248–254. [Google Scholar] [CrossRef]
  29. Williams, M.; Villarreal, A.; Bozhilov, K.; Lin, S.; Talbot, P. Metal and silicate particles including nanoparticles are present in electronic cigarette cartomizer fluid and aerosol. PloS ONE 2013, 8, e57987. [Google Scholar] [CrossRef] [PubMed] [Green Version]
  30. Murphy, J.; Liu, C.; McAdam, K.; Gaça, M.; Prasad, K.; Camacho, O.; McAughey, J.; Proctor, C. Assessment of tobacco heating product THP1.0. Part 9: The placement of a range of next-generation products on an emissions continuum relative to cigarettes via pre-clinical assessment studies. Regul. Toxicol. Pharmacol. 2018, 93, 92–104. [Google Scholar] [CrossRef]
  31. Rodgman, A.; Perfetti, T.A. The Chemical Components of Tobacco and Tobacco Smoke, 1st ed.; CRC Press: Boca Raton, FL, USA, 2008. [Google Scholar]
  32. Mallock, N.; Pieper, E.; Hutzler, C.; Henkler-Stephani, F.; Luch, A. Heated Tobacco Products: A Review of Current Knowledge and Initial Assessments. Front. Public Health 2019, 7, 287. [Google Scholar] [CrossRef] [Green Version]
  33. Son, Y.; Mishin, V.; Laskin, J.D.; Mainelis, G.; Wackowski, O.A.; Delnevo, C.; Schwander, S.; Khlystov, A.; Samburova, V.; Meng, Q. Hydroxyl Radicals in E-Cigarette Vapor and E-Vapor Oxidative Potentials under Different Vaping Patterns. Chem. Res. Toxicol. 2019, 32, 1087–1095. [Google Scholar] [CrossRef] [PubMed]
  34. Li, Y.; Cui, H.; Chen, L.; Fan, M.; Cai, J.; Guo, J.; Yurteri, C.U.; Si, X.; Liu, S.; Xie, F. Modeled respiratory tract deposition of smoke aerosol from conventional cigarettes, electronic cigarettes and heat-not-burn products. Aerosol Air Qual. Res. 2021, 21, 200241. [Google Scholar] [CrossRef]
  35. Nazmy, H.; Mostafa, M.; Zhukovsky, M. Particle size distribution of e-cigarette aerosols in indoor air. J. Radiat. Nucl. Appl. 2018, 3, 111–117. [Google Scholar] [CrossRef]
  36. Başaran, R.; Güven, N.M.; Eke, B.C. An Overview of iQOS(®) as a New Heat-Not-Burn Tobacco Product and Its Potential Effects on Human Health and the Environment. Turk. J. Pharm. Sci. 2019, 16, 371–374. [Google Scholar] [CrossRef] [PubMed]
  37. Farsalinos, K.E.; Yannovits, N.; Sarri, T.; Voudris, V.; Poulas, K. Nicotine Delivery to the Aerosol of a Heat-Not-Burn Tobacco Product: Comparison with a Tobacco Cigarette and E-Cigarettes. Nicotine Tob. Res. 2018, 20, 1004–1009. [Google Scholar] [CrossRef] [PubMed]
  38. Delaval, M.; Egli, D.; Schüpfer, P.; Benarafa, C.; Geiser, M.; Burtscher, H. Novel instrument to generate representative e-cigarette vapors for physicochemical particle characterization and in-vitro toxicity. J. Aerosol Sci. 2019, 129, 40–52. [Google Scholar] [CrossRef]
  39. Papaefstathiou, E.; Bezantakos, S.; Stylianou, M.; Biskos, G.; Agapiou, A. Comparison of particle size distributions and volatile organic compounds exhaled by e-cigarette and cigarette users. J. Aerosol Sci. 2020, 141, 105487. [Google Scholar] [CrossRef]
  40. Soulet, S.; Duquesne, M.; Toutain, J.; Pairaud, C.; Mercury, M. Impact of Vaping Regimens on Electronic Cigarette Efficiency. Int. J. Environ. Res. Public Health 2019, 16, 4753. [Google Scholar] [CrossRef] [Green Version]
  41. Behar, R.Z.; Hua, M.; Talbot, P. Puffing Topography and Nicotine Intake of Electronic Cigarette Users. PLoS ONE 2015, 10, e0117222. [Google Scholar] [CrossRef] [PubMed]
  42. Farsalinos, K.E.; Romagna, G.; Tsiapras, D.; Kyrzopoulos, S.; Voudris, V. Evaluation of Electronic Cigarette Use (Vaping) Topography and Estimation of Liquid Consumption: Implications for Research Protocol Standards Definition and for Public Health Authorities’ Regulation. Int. J. Environ. Res. Public Health 2013, 10, 2500. [Google Scholar] [CrossRef] [PubMed]
  43. Zhao, J.; Pyrgiotakis, G.; Demokritou, P. Development and characterization of electronic-cigarette exposure generation system (Ecig-EGS) for the physico-chemical and toxicological assessment of electronic cigarette emissions. Inhal. Toxicol. 2016, 28, 658–669. [Google Scholar] [CrossRef] [Green Version]
  44. Mikheev, V.B.; Ivanov, A.; Lucas, E.A.; South, P.L.; Colijn, H.O.; Clark, P.I. Aerosol size distribution measurement of electronic cigarette emissions using combined differential mobility and inertial impaction methods: Smoking machine and puff topography influence. Aerosol Sci. Technol. 2018, 52, 1233–1248. [Google Scholar] [CrossRef]
  45. Son, Y.; Mainelis, G.; Delnevo, C.; Wackowski, O.A.; Schwander, S.; Meng, Q. Investigating E-Cigarette Particle Emissions and Human Airway Depositions under Various E-Cigarette-Use Conditions. Chem. Res. Toxicol. 2020, 33, 343–352. [Google Scholar] [CrossRef]
  46. Ranpara, A.; Stefaniak, A.B.; Fernandez, E.; LeBouf, R.F. Effect of Puffing Behavior on Particle Size Distributions and Respiratory Depositions from Pod-Style Electronic Cigarette, or Vaping, Products. Front. Public Health 2021, 9, 1812. [Google Scholar] [CrossRef] [PubMed]
  47. Zhao, J.; Nelson, J.; Dada, O.; Pyrgiotakis, G.; Kavouras, I.G.; Demokritou, P. Assessing electronic cigarette emissions: Linking physico-chemical properties to product brand, e-liquid flavoring additives, operational voltage and user puffing patterns. Inhal. Toxicol. 2018, 30, 78–88. [Google Scholar] [CrossRef] [PubMed]
  48. Talih, S.; Balhas, Z.; Eissenberg, T.; Salman, R.; Karaoghlanian, N.; El Hellani, A.; Baalbaki, R.; Saliba, N.; Shihadeh, A. Effects of user puff topography, device voltage, and liquid nicotine concentration on electronic cigarette nicotine yield: Measurements and model predictions. Nicotine Tob. Res. 2015, 17, 150–157. [Google Scholar] [CrossRef]
  49. Sousan, S.; Pender, J.; Streuber, D.; Haley, M.; Shingleton, W.; Soule, E. Laboratory determination of gravimetric correction factors for real-time area measurements of electronic cigarette aerosols. Aerosol Sci. Technol. 2022, 56, 517–529. [Google Scholar] [CrossRef]
  50. Noël, A.; Verret, C.M.; Hasan, F.; Lomnicki, S.; Morse, J.; Robichaud, A.; Penn, A.L. Generation of Electronic Cigarette Aerosol by a Third-Generation Machine-Vaping Device: Application to Toxicological Studies. J. Vis. Exp. 2018, 138, 58095. [Google Scholar] [CrossRef] [Green Version]
  51. Dunkhorst, W.; Lipowicz, P.; Koch, W. Characterization of highly concentrated organic aerosols by optical extinction in the mid infrared regime: Application to e-cigarettes. J. Aerosol Sci. 2016, 94, 33–42. [Google Scholar] [CrossRef]
  52. Farsalinos, K.E.; Voudris, V.; Poulas, K. E-cigarettes generate high levels of aldehydes only in 'dry puff' conditions. Addiction 2015, 110, 1352–1356. [Google Scholar] [CrossRef] [PubMed]
  53. Gillman, I.G.; Kistler, K.A.; Stewart, E.W.; Paolantonio, A.R. Effect of variable power levels on the yield of total aerosol mass and formation of aldehydes in e-cigarette aerosols. Regul. Toxicol. Pharmacol. 2016, 75, 58–65. [Google Scholar] [CrossRef] [Green Version]
  54. Bertrand, P.; Bonnarme, V.; Piccirilli, A.; Ayrault, P.; Lemée, L.; Frapper, G.; Pourchez, J. Physical and chemical assessment of 1,3 Propanediol as a potential substitute of propylene glycol in refill liquid for electronic cigarettes. Sci. Rep. 2018, 8, 10702. [Google Scholar] [CrossRef] [PubMed] [Green Version]
  55. Lalo, H.; Leclerc, L.; Sorin, J.; Pourchez, J. Aerosol droplet-size distribution and airborne nicotine portioning in particle and gas phases emitted by electronic cigarettes. Sci. Rep. 2020, 10, 21707. [Google Scholar] [CrossRef] [PubMed]
  56. Pourchez, J.; de Oliveira, F.; Perinel-Ragey, S.; Basset, T.; Vergnon, J.-M.; Prévôt, N. Assessment of new-generation high-power electronic nicotine delivery system as thermal aerosol generation device for inhaled bronchodilators. Int. J. Pharm. 2017, 518, 264–269. [Google Scholar] [CrossRef] [PubMed]
  57. Pourchez, J.; Parisse, S.; Sarry, G.; Perinel-Ragey, S.; Vergnon, J.-M.; Clotagatide, A.; Prévot, N. Impact of power level and refill liquid composition on the aerosol output and particle size distribution generated by a new-generation e-cigarette device. Aerosol Sci. Technol. 2018, 52, 359–369. [Google Scholar] [CrossRef] [Green Version]
  58. Zhou, Y.; Irshad, H.; Dye, W.W.; Wu, G.; Tellez, C.S.; Belinsky, S.A. Voltage and e-liquid composition affect nicotine deposition within the oral cavity and carbonyl formation. Tob. Control 2021, 30, 485. [Google Scholar] [CrossRef]
  59. Floyd, E.L.; Queimado, L.; Wang, J.; Regens, J.L.; Johnson, D.L. Electronic cigarette power affects count concentration and particle size distribution of vaping aerosol. PLoS ONE 2018, 13, e0210147. [Google Scholar] [CrossRef] [Green Version]
  60. Larcombe, A.N.; Janka, M.A.; Mullins, B.J.; Berry, L.J.; Bredin, A.; Franklin, P.J. The effects of electronic cigarette aerosol exposure on inflammation and lung function in mice. Am. J. Physiol. Lung Cell. Mol. Physiol. 2017, 313, L67–L79. [Google Scholar] [CrossRef] [PubMed] [Green Version]
  61. Prévôt, N.; de Oliveira, F.; Perinel-Ragey, S.; Basset, T.; Vergnon, J.-M.; Pourchez, J. Nicotine delivery from the refill liquid to the aerosol via high-power e-cigarette device. Sci. Rep. 2017, 7, 2592. [Google Scholar] [CrossRef] [PubMed]
  62. Zervas, E.; Litsiou, E.; Konstantopoulos, K.; Poulopoulos, S.; Katsaounou, P. Physical characterization of the aerosol of an electronic cigarette: Impact of refill liquids. Inhal. Toxicol. 2018, 30, 218–223. [Google Scholar] [CrossRef]
  63. Lechasseur, A.; Altmejd, S.; Turgeon, N.; Buonanno, G.; Morawska, L.; Brunet, D.; Duchaine, C.; Morissette, M.C. Variations in coil temperature/power and e-liquid constituents change size and lung deposition of particles emitted by an electronic cigarette. Physiol. Rep. 2019, 7, e14093. [Google Scholar] [CrossRef]
  64. Luo, Y.; Wu, Y.; Li, L.; Guo, Y.; Cetintas, E.; Zhu, Y.; Ozcan, A. Dynamic imaging and characterization of volatile aerosols in E-cigarette emissions using deep learning-based holographic microscopy. ACS Sens. 2021, 6, 2403–2410. [Google Scholar] [CrossRef]
  65. Ji, E.H.; Sun, B.; Zhao, T.; Shu, S.; Chang, C.H.; Messadi, D.; Xia, T.; Zhu, Y.; Hu, S. Characterization of Electronic Cigarette Aerosol and Its Induction of Oxidative Stress Response in Oral Keratinocytes. PLoS ONE 2016, 11, e0154447. [Google Scholar] [CrossRef] [Green Version]
  66. Scungio, M.; Stabile, L.; Buonanno, G. Measurements of electronic cigarette-generated particles for the evaluation of lung cancer risk of active and passive users. J. Aerosol Sci. 2018, 115, 1–11. [Google Scholar] [CrossRef] [Green Version]
  67. Mikheev, V.B.; Brinkman, M.C.; Granville, C.A.; Gordon, S.M.; Clark, P.I. Real-Time Measurement of Electronic Cigarette Aerosol Size Distribution and Metals Content Analysis. Nicotine Tob. Res. 2016, 18, 1895–1902. [Google Scholar] [CrossRef] [Green Version]
  68. Laube, B.L.; Afshar-Mohajer, N.; Koehler, K.; Chen, G.; Lazarus, P.; Collaco, J.M.; McGrath-Morrow, S.A. Acute and chronic in vivo effects of exposure to nicotine and propylene glycol from an E-cigarette on mucociliary clearance in a murine model. Inhal. Toxicol. 2017, 29, 197–205. [Google Scholar] [CrossRef] [Green Version]
  69. Manigrasso, M.; Buonanno, G.; Fuoco, F.C.; Stabile, L.; Avino, P. Aerosol deposition doses in the human respiratory tree of electronic cigarette smokers. Environ. Pollut. 2015, 196, 257–267. [Google Scholar] [CrossRef]
  70. Manigrasso, M.; Buonanno, G.; Fuoco, F.C.; Stabile, L.; Avino, P. Electronic cigarettes: Age-specific generation-resolved pulmonary doses. Environ. Sci. Pollut. Res. Int. 2017, 24, 13068–13079. [Google Scholar] [CrossRef] [Green Version]
  71. Kaiser, A.J.; Salem, C.; Alvarenga, B.J.; Pagliaro, A.; Smith, K.P.; Valerio, L.G., Jr.; Benam, K.H. A robotic system for real-time analysis of inhaled submicron and microparticles. iScience 2021, 24, 103091. [Google Scholar] [CrossRef]
  72. Li, L.; Lee, E.S.; Nguyen, C.; Zhu, Y. Effects of propylene glycol, vegetable glycerin, and nicotine on emissions and dynamics of electronic cigarette aerosols. Aerosol Sci. Technol. 2020, 54, 1270–1281. [Google Scholar] [CrossRef]
  73. Ma, T.; Wang, X.; Li, L.; Sun, B.; Zhu, Y.; Xia, T. Electronic cigarette aerosols induce oxidative stress-dependent cell death and NF-κB mediated acute lung inflammation in mice. Arch. Toxicol. 2021, 95, 195–205. [Google Scholar] [CrossRef]
  74. El-Hellani, A.; El-Hage, R.; Baalbaki, R.; Salman, R.; Talih, S.; Shihadeh, A.; Saliba, N.A. Free-Base and Protonated Nicotine in Electronic Cigarette Liquids and Aerosols. Chem. Res. Toxicol. 2015, 28, 1532–1537. [Google Scholar] [CrossRef] [Green Version]
  75. David, G.; Parmentier, E.A.; Taurino, I.; Signorell, R. Tracing the composition of single e-cigarette aerosol droplets in situ by laser-trapping and Raman scattering. Sci. Rep. 2020, 10, 7929. [Google Scholar] [CrossRef]
  76. Li, Y.; Burns, A.E.; Tran, L.N.; Abellar, K.A.; Poindexter, M.; Li, X.; Madl, A.K.; Pinkerton, K.E.; Nguyen, T.B. Impact of e-liquid composition, coil temperature, and puff topography on the aerosol chemistry of electronic cigarettes. Chem. Res. Toxicol. 2021, 34, 1640–1654. [Google Scholar] [CrossRef]
  77. Aszyk, J.; Woźniak, M.K.; Kubica, P.; Kot-Wasik, A.; Wasik, A. Concentration levels of selected analytes in the gas phase of an e-cigarette aerosol. Microchem. J. 2019, 148, 717–724. [Google Scholar] [CrossRef]
  78. Seeman, J.I.; Fournier, J.A.; Paine, J.B.; Waymack, B.E. The Form of Nicotine in Tobacco. Thermal Transfer of Nicotine and Nicotine Acid Salts to Nicotine in the Gas Phase. J. Agric. Food Chem. 1999, 47, 5133–5145. [Google Scholar] [CrossRef]
  79. Pichelstorfer, L.; Winkler-Heil, R.; Boy, M.; Hofmann, W. Aerosol dynamics simulations of the anatomical variability of e-cigarette particle and vapor deposition in a stochastic lung. J. Aerosol Sci. 2021, 158, 105706. [Google Scholar] [CrossRef]
  80. Gholap, V.V.; Kosmider, L.; Golshahi, L.; Halquist, M.S. Nicotine forms: Why and how do they matter in nicotine delivery from electronic cigarettes? Expert Opin. Drug Deliv. 2020, 17, 1727–1736. [Google Scholar] [CrossRef]
  81. Brown, J.S.; Zeman, K.L.; Bennett, W.D. Ultrafine Particle Deposition and Clearance in the Healthy and Obstructed Lung. Am. J. Respir. Crit. Care Med. 2002, 166, 1240–1247. [Google Scholar] [CrossRef] [Green Version]
  82. Martuzevicius, D.; Prasauskas, T.; Setyan, A.; O'Connell, G.; Cahours, X.; Julien, R.; Colard, S. Characterization of the Spatial and Temporal Dispersion Differences Between Exhaled E-Cigarette Mist and Cigarette Smoke. Nicotine Tob. Res. 2019, 21, 1371–1377. [Google Scholar] [CrossRef]
  83. Sosnowski, T.R.; Odziomek, M. Particle Size Dynamics: Toward a Better Understanding of Electronic Cigarette Aerosol Interactions with the Respiratory System. Front. Physiol. 2018, 9, 853. [Google Scholar] [CrossRef]
  84. Carvalho, T.C.; Peters, J.I.; Williams, R.O. Influence of particle size on regional lung deposition—What evidence is there? Int. J. Pharm. 2011, 406, 1–10. [Google Scholar] [CrossRef]
  85. Rissler, J.; Gudmundsson, A.; Nicklasson, H.; Swietlicki, E.; Wollmer, P.; Löndahl, J. Deposition efficiency of inhaled particles (15–5000 nm) related to breathing pattern and lung function: An experimental study in healthy children and adults. Part. Fibre Toxicol. 2017, 14, 10. [Google Scholar] [CrossRef] [Green Version]
  86. Sturm, R. Total deposition of ultrafine particles in the lungs of healthy men and women: Experimental and theoretical results. Ann. Transl. Med. 2016, 4, 3. [Google Scholar] [CrossRef] [Green Version]
  87. Hofmann, W. Regional Deposition: Deposition Models. J. Aerosol Med. Pulm. Drug Deliv. 2020, 33, 239–248. [Google Scholar] [CrossRef]
  88. Hofmann, W. Modelling inhaled particle deposition in the human lung—A review. J. Aerosol Sci. 2011, 42, 693–724. [Google Scholar] [CrossRef]
  89. Wang, C.-S. (Ed.) Chapter 9 Deposition models. In Interface Science and Technology; Elsevier: Amsterdam, The Netherlands, 2005; Volume 5, pp. 127–148. [Google Scholar]
  90. Martonen, T.B.; Rosati, J.A.; Isaacs, K.K. Modeling Deposition of Inhaled Particles Chapter 8. In Aerosols Handbook: Measurement, Dosimetry, and Health Effects; Ruzer, L.S., Harley, N.H., Eds.; CRC Press LLC: Boca Raton, FL, USA, 2005; pp. 113–155. [Google Scholar]
  91. Hofmann, W.; Winkler-Heil, R.; Balásházy, I. The Effect of Morphological Variability on Surface Deposition Densities of Inhaled Particles in Human Bronchial and Acinar Airways. Inhal. Toxicol. 2006, 18, 809–819. [Google Scholar] [CrossRef]
  92. Pichelstorfer, L.; Winkler-Heil, R.; Hofmann, W. Lagrangian/Eulerian model of coagulation and deposition of inhaled particles in the human lung. J. Aerosol Sci. 2013, 64, 125–142. [Google Scholar] [CrossRef] [Green Version]
  93. Pichelstorfer, L.; Hofmann, W.; Winkler-Heil, R.; Yurteri, C.U.; McAughey, J. Simulation of aerosol dynamics and deposition of combustible and electronic cigarette aerosols in the human respiratory tract. J. Aerosol Sci. 2016, 99, 125–132. [Google Scholar] [CrossRef] [Green Version]
  94. Pichelstorfer, L.; Hofmann, W. Modeling aerosol dynamics of cigarette smoke in a denuder tube. J. Aerosol Sci. 2015, 88, 72–89. [Google Scholar] [CrossRef]
  95. Tillman, D.A.; Duong, D.N.B.; Harding, N.S. Chapter 7—Modeling and Fuel Blending. In Solid Fuel Blending; Tillman, D.A., Duong, D.N.B., Harding, N.S., Eds.; Butterworth-Heinemann: Boston, MA, USA, 2012; pp. 271–293. [Google Scholar]
  96. Feng, Y.; Zhao, J.; Hayati, H.; Sperry, T.; Yi, H. Tutorial: Understanding the transport, deposition, and translocation of particles in human respiratory systems using Computational Fluid-Particle Dynamics and Physiologically Based Toxicokinetic models. J. Aerosol Sci. 2021, 151, 105672. [Google Scholar] [CrossRef]
  97. Haghnegahdar, A.; Feng, Y.; Chen, X.; Lin, J. Computational Analysis of Deposition and Translocation of Inhaled Nicotine and Acrolein in the Human Body with E-cigarette Puffing Topographies. Aerosol Sci Technol 2018, 52, 483–493. [Google Scholar] [CrossRef] [Green Version]
  98. Manigrasso, M.; Buonanno, G.; Stabile, L.; Morawska, L.; Avino, P. Particle doses in the pulmonary lobes of electronic and conventional cigarette users. Environ. Pollut. 2015, 202, 24–31. [Google Scholar] [CrossRef] [Green Version]
  99. Sosnowski, T.R.; Kramek-Romanowska, K. Predicted Deposition of E-Cigarette Aerosol in the Human Lungs. J. Aerosol Med. Pulm. Drug Deliv. 2016, 29, 299–309. [Google Scholar] [CrossRef]
  100. Pourhashem, H.; Owen, M.P.; Castro, N.D.; Rostami, A.A. Eulerian modeling of aerosol transport and deposition in respiratory tract under thermodynamic equilibrium condition. J. Aerosol Sci. 2020, 141, 105501. [Google Scholar] [CrossRef]
  101. Ranpara, A.; Stefaniak, A.B.; Williams, K.; Fernandez, E.; LeBouf, R.F. Modeled Respiratory Tract Deposition of Aerosolized Oil Diluents Used in Delta(9)-THC-Based Electronic Cigarette Liquid Products. Front. Public Health 2021, 9, 744166. [Google Scholar] [CrossRef]
  102. Das, D.; Alam El Din, S.-M.; Pulczinski, J.; Mihalic, J.N.; Chen, R.; Bressler, J.; Rule, A.M.; Ramachandran, G. Assessing variability of aerosols generated from e-Cigarettes. Inhal. Toxicol. 2022, 34, 90–98. [Google Scholar] [CrossRef]
  103. Su, W.-C.; Lin, Y.-H.; Wong, S.-W.; Chen, J.Y.; Lee, J.; Buu, A. Estimation of the dose of electronic cigarette chemicals deposited in human airways through passive vaping. J. Expo. Sci. Environ. Epidemiol. 2021, 31, 1008–1016. [Google Scholar] [CrossRef]
Figure 1. Illustration of particle size descriptive parameters.
Jor 03 00003 g001
Table 1. Commonly used instruments to measure particle size and distribution of e-cigarette aerosols.
CategoryPrincipleTypical EquipmentRangeUpper LimitDilutionReal-Time/OfflineProsCons
ImpactorsImpactionMicroorifice
uniform deposit impactor (MOUDI)
0.056–18 µmNo needOfflineLow costLow size resolution
Quartz crystal microbalance (QCM) MOUDI impactornanogram to microgram per unit area130 µg for solid particles and 2 µg for liquid particlesSample dependentReal-time and Offline
  • Real-time.
  • Directly measure total mass of particles and hence mass concentration.
Require strong adhesion between particles and resonating sensor.
Need frequent cleanings of the crystal electrode.
Electrical low pressure
impactor (ELPI)
6 nm to 10 µmSample dependentReal-time and Offline
  • Real-time.
  • Sufficient time resolution(10 Hz).
  • High size resolution.
Low capacity for high concentration aerosol.
Electro mobility sizersA measurement-based on electrical mobilityScanning mobility particle sizer (SPMS)1 nm up to 1 µm107 particles/cm3Sample dependentReal-time
  • Sufficient time resolution (0.1–1 s).
  • High size resolution
Insufficient resolution time (~3 min)
Fast mobility particle sizer (FMPS)5.6 to 560 nmSize dependent, up to 107 dN/d(logdp)/cm3Sample dependentReal-timeLess size resolution than SMPS
Engine exhaust particle sizer (EEPS)5.6 to 560 nmSize dependent, up to 107 dN/d(logdp)/cm3Sample dependent, 10–500Real-timeLow size resolution
Differential mobility spectrometer (DMS)several nm to several μm≈ 1011 dN/d(logdp) /cm31–3000Real-timeLess size resolution than SMPS
Laser diffractionMie theory of light scattering Optical particle counter (OPC)hundreds nanometers to micrometers (0.3 to 20 μm)~106 particles/litreSample dependentReal-time
  • High mobility
  • Fast response time (0.1 s)
No information on nanoparticles
Condensation particle counter (CPC)0.01 to 1 μm105 particles/cm3Sample dependentReal-timeNo information on PSD
Laser aerosol spectrometer (LAS)0.09–7.50 µm~18,000 particles/ccSample dependentReal-timeNo information on nanoparticles
Table 2. The comparison of models to predict particle deposition in the human respiratory tract.
TypeSemi-Empirical Regional Compartment ModelOne-Dimensional Cross-section or “Trumpet’ ModelsDeterministic Symmetric Generation or ‘‘Single-Path’’ ModelDeterministic Asymmetric Generation or ‘‘Multiple-Path’’Stochastic Multiple-Path ModelSingle-Path Computational Fluid and Particle Dynamics Model
Representative modelICRP modelWeibel’s model ANCRP model, DEPOS modelMPPD modelIDEAL modelCFPD model
CharacteristicsEmpiricalAnalyticalDeterministic, AnalyticalDeterministic, AnalyticalStochastic, AnalyticalAnalytical/Numerical
PrincipleThe morphometric structure of the lung consists of four anatomical regions.The airway system is modeled as a one-dimensional, variable cross-section channel. The cross-sections are determined by the generation number.All airways in a given airway generation have identical linear dimensions. The particle deposition fractions are identical in each sequence of the airways, thus all pathways can be represented by a single path. It is based on realistic lung geometry, physiology, and deposition mechanisms. The multiple-path MPPD model considers the branching asymmetry of airways and related flow rates.The transport of each individual particle is simulated by randomly selecting a sequence of airways. The model prediction is based on computational fluid dynamics. The solutions derived from computational fluid dynamics are coupled with the solution of particle trajectory equations derived from Newton’s Second Law.
Major prosThe models are based on experimental data in human objects. The models are relatively simple and do not require sophisticated computer programming.The models are easily conducted and provide clean mathematical solutions to differential equations describing transport and deposition phenomena.The models are characterized by geometric simplicity. The models provide exact solutions to the mass balance equations in a realistic lung geometry.The models have a realistic airway geometry.The models allow realistic flow and particle transport conditions.
Major consThe morphometry is greatly simplified. The models do not consider the internal airway structure and cannot simulate the asymmetric effects of airway geometry and related flow rates. They cannot be applied to predict the realistic deposition patterns in asymmetric and variable lung structures. They do not include dynamics of particles during transport.They have limited anatomical and physiological variability. They are based on a simplified lung structure and are restricted to predict the deposition in the bronchial region.
Can include dynamic processYesYesNoNoYesYes
Take volatility into accountNoNoNoNoYesNo
Single airway depositionNoYesYesYesYesYes
Public accessYesYesYesYesNoYes
Table 3. The modeling results of studies published after 2010.
ReferenceModelMajor Findings
Manigrasso et al. (2015) [69]MPPDThe greatest contribution was due to particles in the range from 93 nm to 165 nm were deposited in the alveolar region at the 18th and 22nd airway generation for the 1st and the 60th size percentile of the stochastic human lungs.
Manigrasso et al. (2015) [98]MPPDThe total deposited e-cigarette particles are more than double the dose compared to conventional cigarettes. Twice as many particles deposited in the right upper lung lobe than in the left upper lobe. About 20% more in the right lower lobe than in the left lower lobe for both tracheobronchial and alveolar regions.
Pichelstorfer et al. (2016) [94]IDEALAbout 99% of the nicotine is deposited by the vapor phase for cigarette aerosols, while only a minute fraction is deposited by the particle phase.
Sosnowski et al. (2016) [99]MPPDPredicted total lung deposition of the mainstream aerosol was 15–45% depending on the breathing scheme. E-cigarettes are characterized by high inhalation resistance, so they require strong physical effort to transfer a cloud of droplets to the lungs, compared to a dry powder inhaler.
Manigrasso et al. (2017) [70]MPPDIndividuals 9 years of age received a total number of doses (Dtot) 20% more than the other ages. Dtot from e-cigarettes is about double those from conventional cigarettes, greatly contributed by the deposition at the 22nd and 23rd airway generation. Maximum deposition densities per airway generation and daily volume of e-cigarette liquid deposited per unit surface area are estimated upper in the respiratory tree, suggesting the higher susceptibility of lobar bronchi towards noxious agents.
Sundahl et al. (2017) [19]MPPD75–90% of the nicotine droplets were exhaled and 10–25% deposited in the respiratory system.
Haghnegahdar et al. (2018) [97]CFPDMost of the vaporized nicotine and acrolein are absorbed in the upper airway from the mouth to Generation 1. In contrast, e-cigarette aerosol particle deposition occurs in all regions from mouth to Generation 3. Both particulate and vapor forms of nicotine and acrolein contribute to the deposition and translocation in the human body. The puff volume and holding time can contribute to the variation in the nicotine and acrolein plasma concentration due to enhanced aerosol deposition in the lung.
Lechasseur et al. (2019) [63]ICRPE-cigarette particles mainly deposit in the alveoli region. Conditions generating larger particle sizes lead to a reduction in predicted lung deposition.
Pourhashem et al. (2020) [100]CFPDThe total deposition of aerosol constituents (e.g., glycerol, nicotine, and PG) is dominated by diffusive vapor transport. Glycerol with low vapor pressure and low vapor concentration has the lowest total deposition compared to nicotine and PG.
Son et al. (2020) [45] MPPDEstimated e-cigarette particle mass deposition fractions in the tracheobronchial and bronchoalveolar regions were 50.4–54.1% and 7.3–30.6%, respectively. Both e-cigarette and conventional cigarette particles tend to have a higher deposition fraction of the tracheobronchial region than the pulmonary region. The deposited mass of e-cigarette particles is an order of magnitude lower than that of cigarette particles.
Li et al. (2021) [34]MPPDE-cigarette particles mostly deposit in the pulmonary region, followed by the trachebronchil region and head airway. E-cigarettes have a higher deposition fraction in the respiratory tract than conventional cigarette and HnB products. The right lower lob has the highest number deposition fraction of other lung lobes. The highest deposition fraction occurred in the 20th and 23rd-generation airways. Small particles are more easily deposited in all regions of the respiratory tract.
Montigaud et al. (2021)MPPDOver 70% of the aerosol is exhaled. Particles are deposited throughout the respiratory tract, including the head, tracheobronchial and pulmonary region.
Pichelstorfer et al. (2021) [79]IDEALInhaled e-cigarette aerosols are significantly modified in the oral cavity prior to inhalation into the lungs. Total particle mass is preferentially deposited in the alveolar region of the lung during inhalation. Nicotine deposits prevail in the condensed phase for the “lower pH” case (nicotine salt), but vapor phase deposition dominates the “no acid” case (freebase).
Ranpara et al. (2021) [46]MPPD30–40% of the particles from a pod-style e-cigarette are estimated to deposit in the pulmonary region.
Ranpara et al. (2021) [101]MPPDIrrespective of the statistical differences between MMADs, dosimetry modeling resulted in the similar regional and lobular deposition of particles for all e-liquids in the respiratory tract. The highest (0.08 or more) fractional deposition was predicted in the pulmonary region, which is consistent as the site of injury among EVALI cases.
Stefaniak et al. (2022) [8]MPPDA portion of inhaled particles deposit throughout the respiratory tract. Statistical differences in aerosol MMADs do not translate into large differences in deposition estimates.
Disclaimer/Publisher’s Note: The statements, opinions and data contained in all publications are solely those of the individual author(s) and contributor(s) and not of MDPI and/or the editor(s). MDPI and/or the editor(s) disclaim responsibility for any injury to people or property resulting from any ideas, methods, instructions or products referred to in the content.

