
Pulmonary Oxygen Exchange in a Rhythmically Expanding–Contracting Alveolus–Capillary Model


Abstract
:1. Introduction
- (1)
- Develop a computational platform for O2 exchange in an expanding/contracting geometry that consists of an alveolus, a capillary network, and a membrane between them;
- (2)
- Determine the diffusivity of the air–blood interface (membrane) in comparison to empirical O2 exchange data;
- (3)
- Quantify the effects of capillary pressure drop and breathing depth on the temporal blood flow rate;
- (4)
- Study the membrane diffusivity and perfusion rate on the temporal–spatial distribution of O2 in the capillary network.
2. Materials and Methods
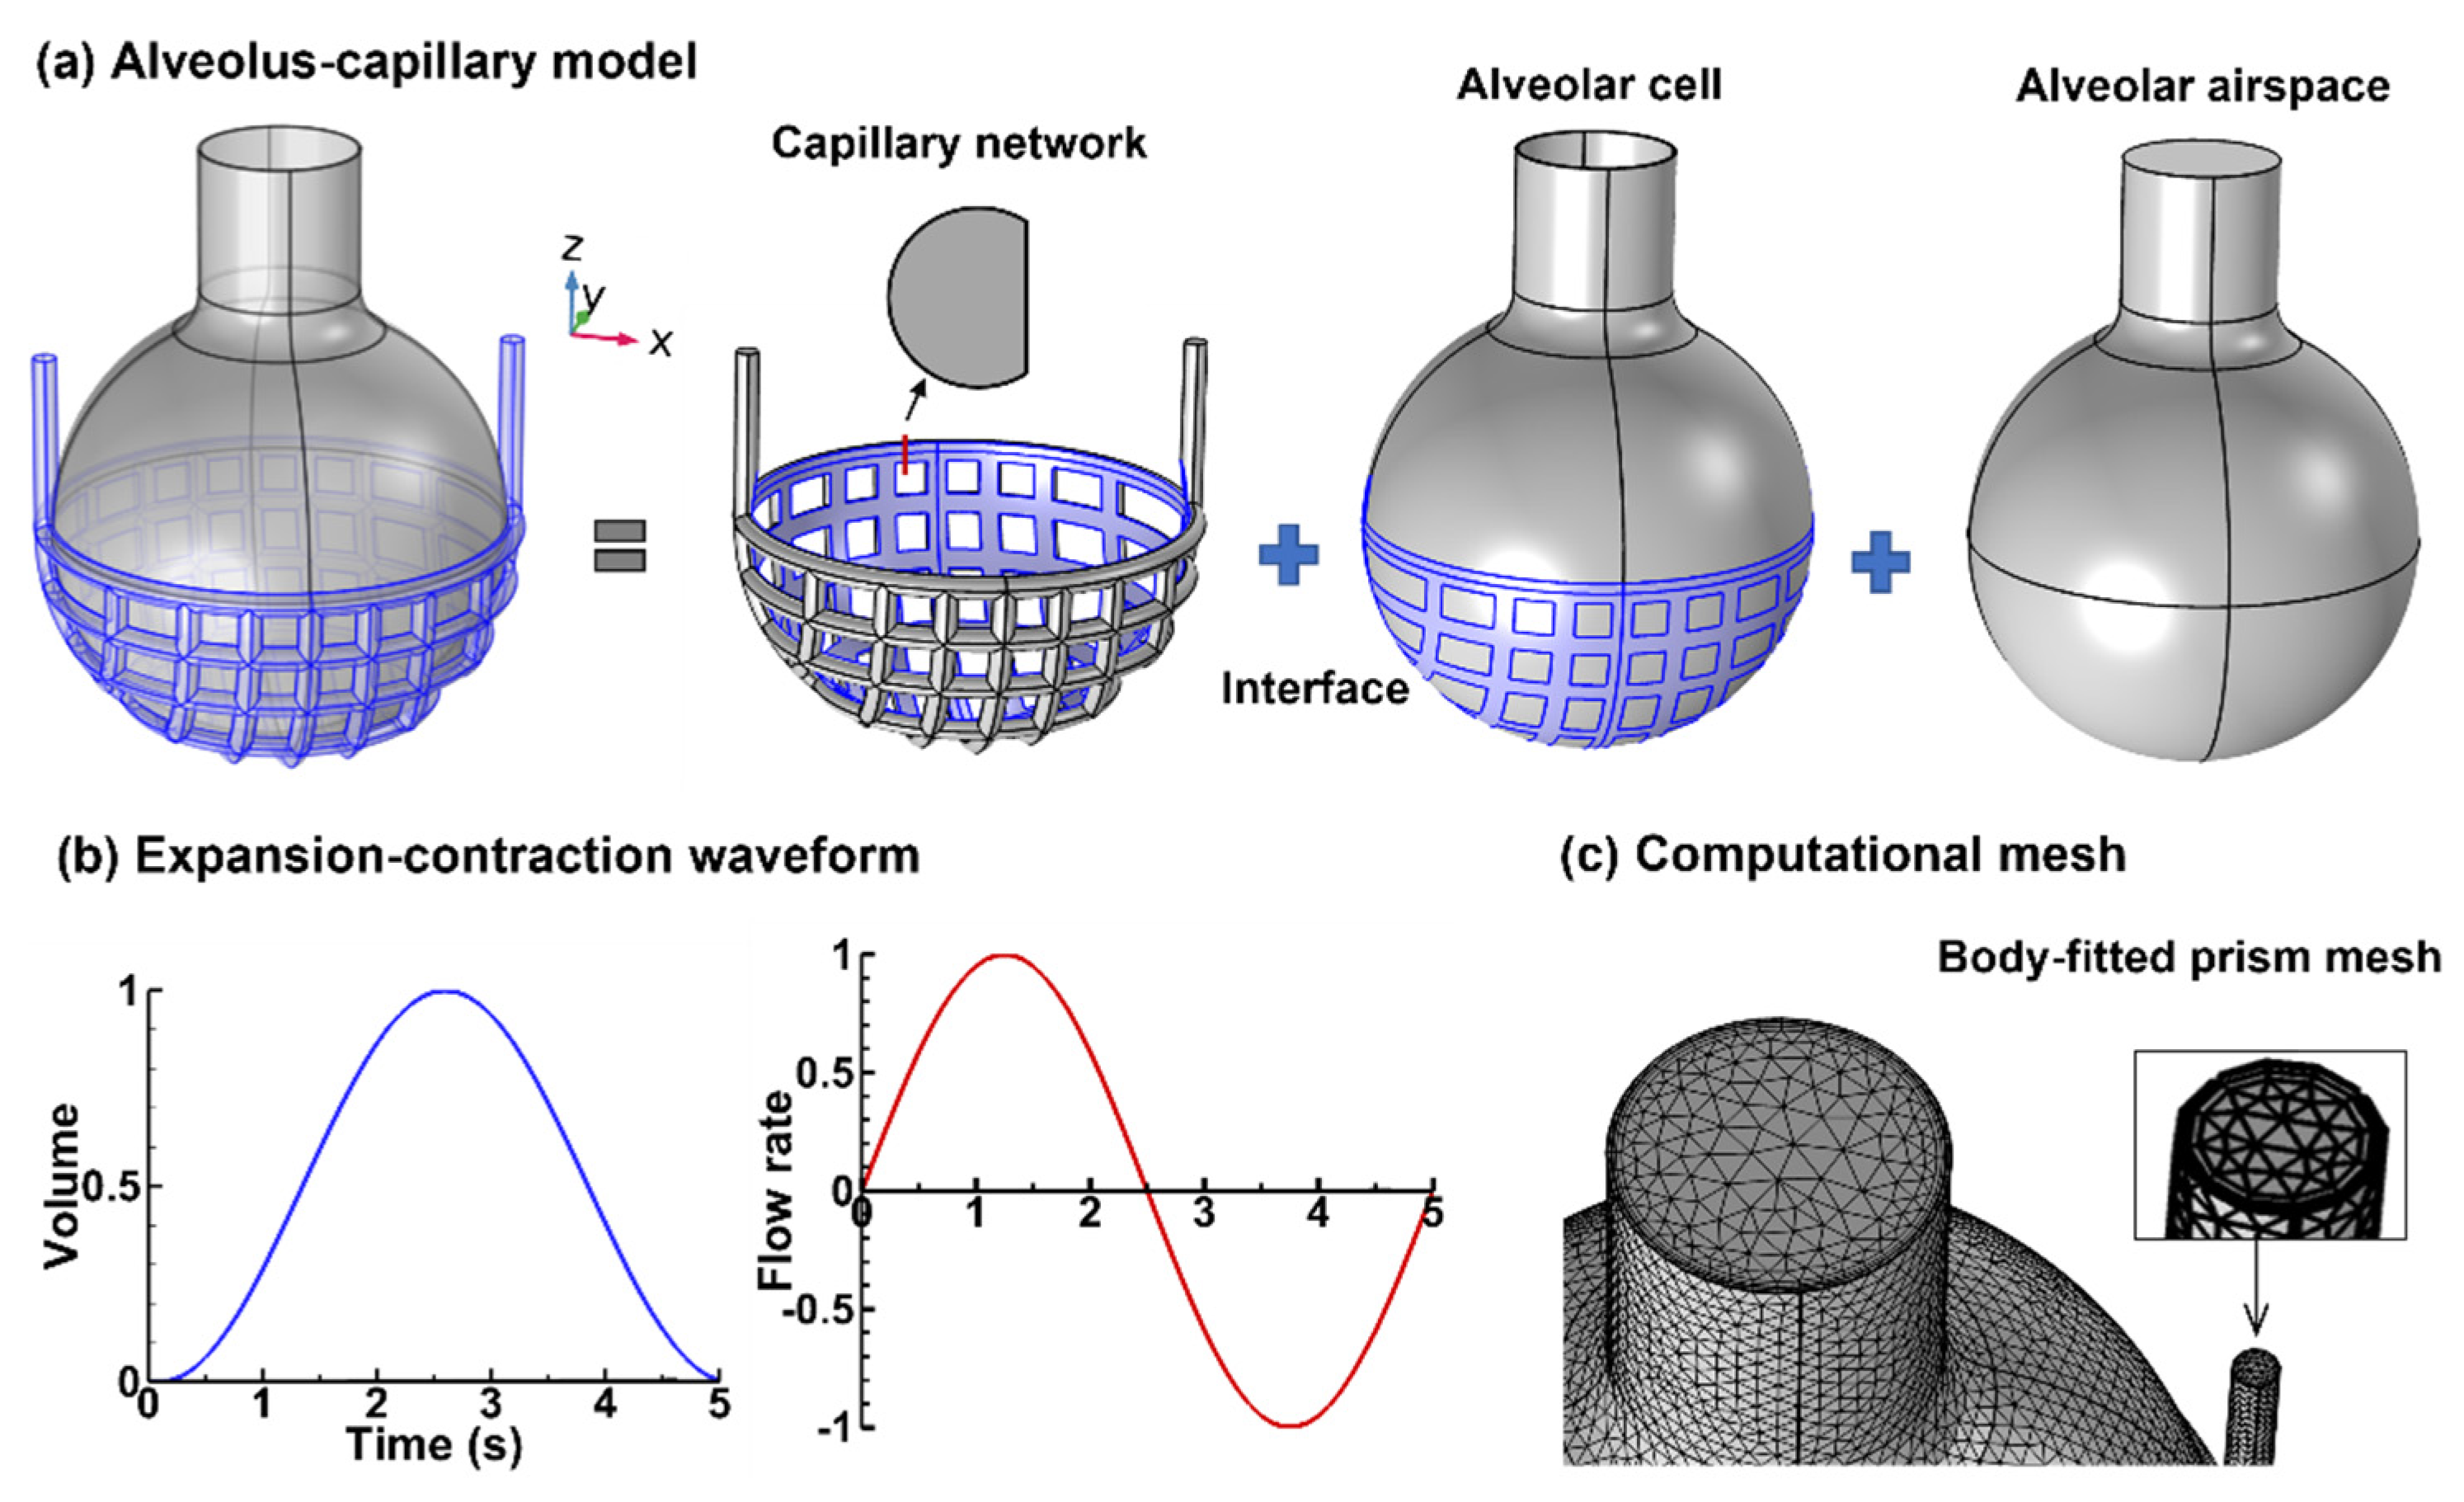
2.1. Alveolus–Capillary Model
2.2. Numerical Methods
3. Results
3.1. Flow Fields
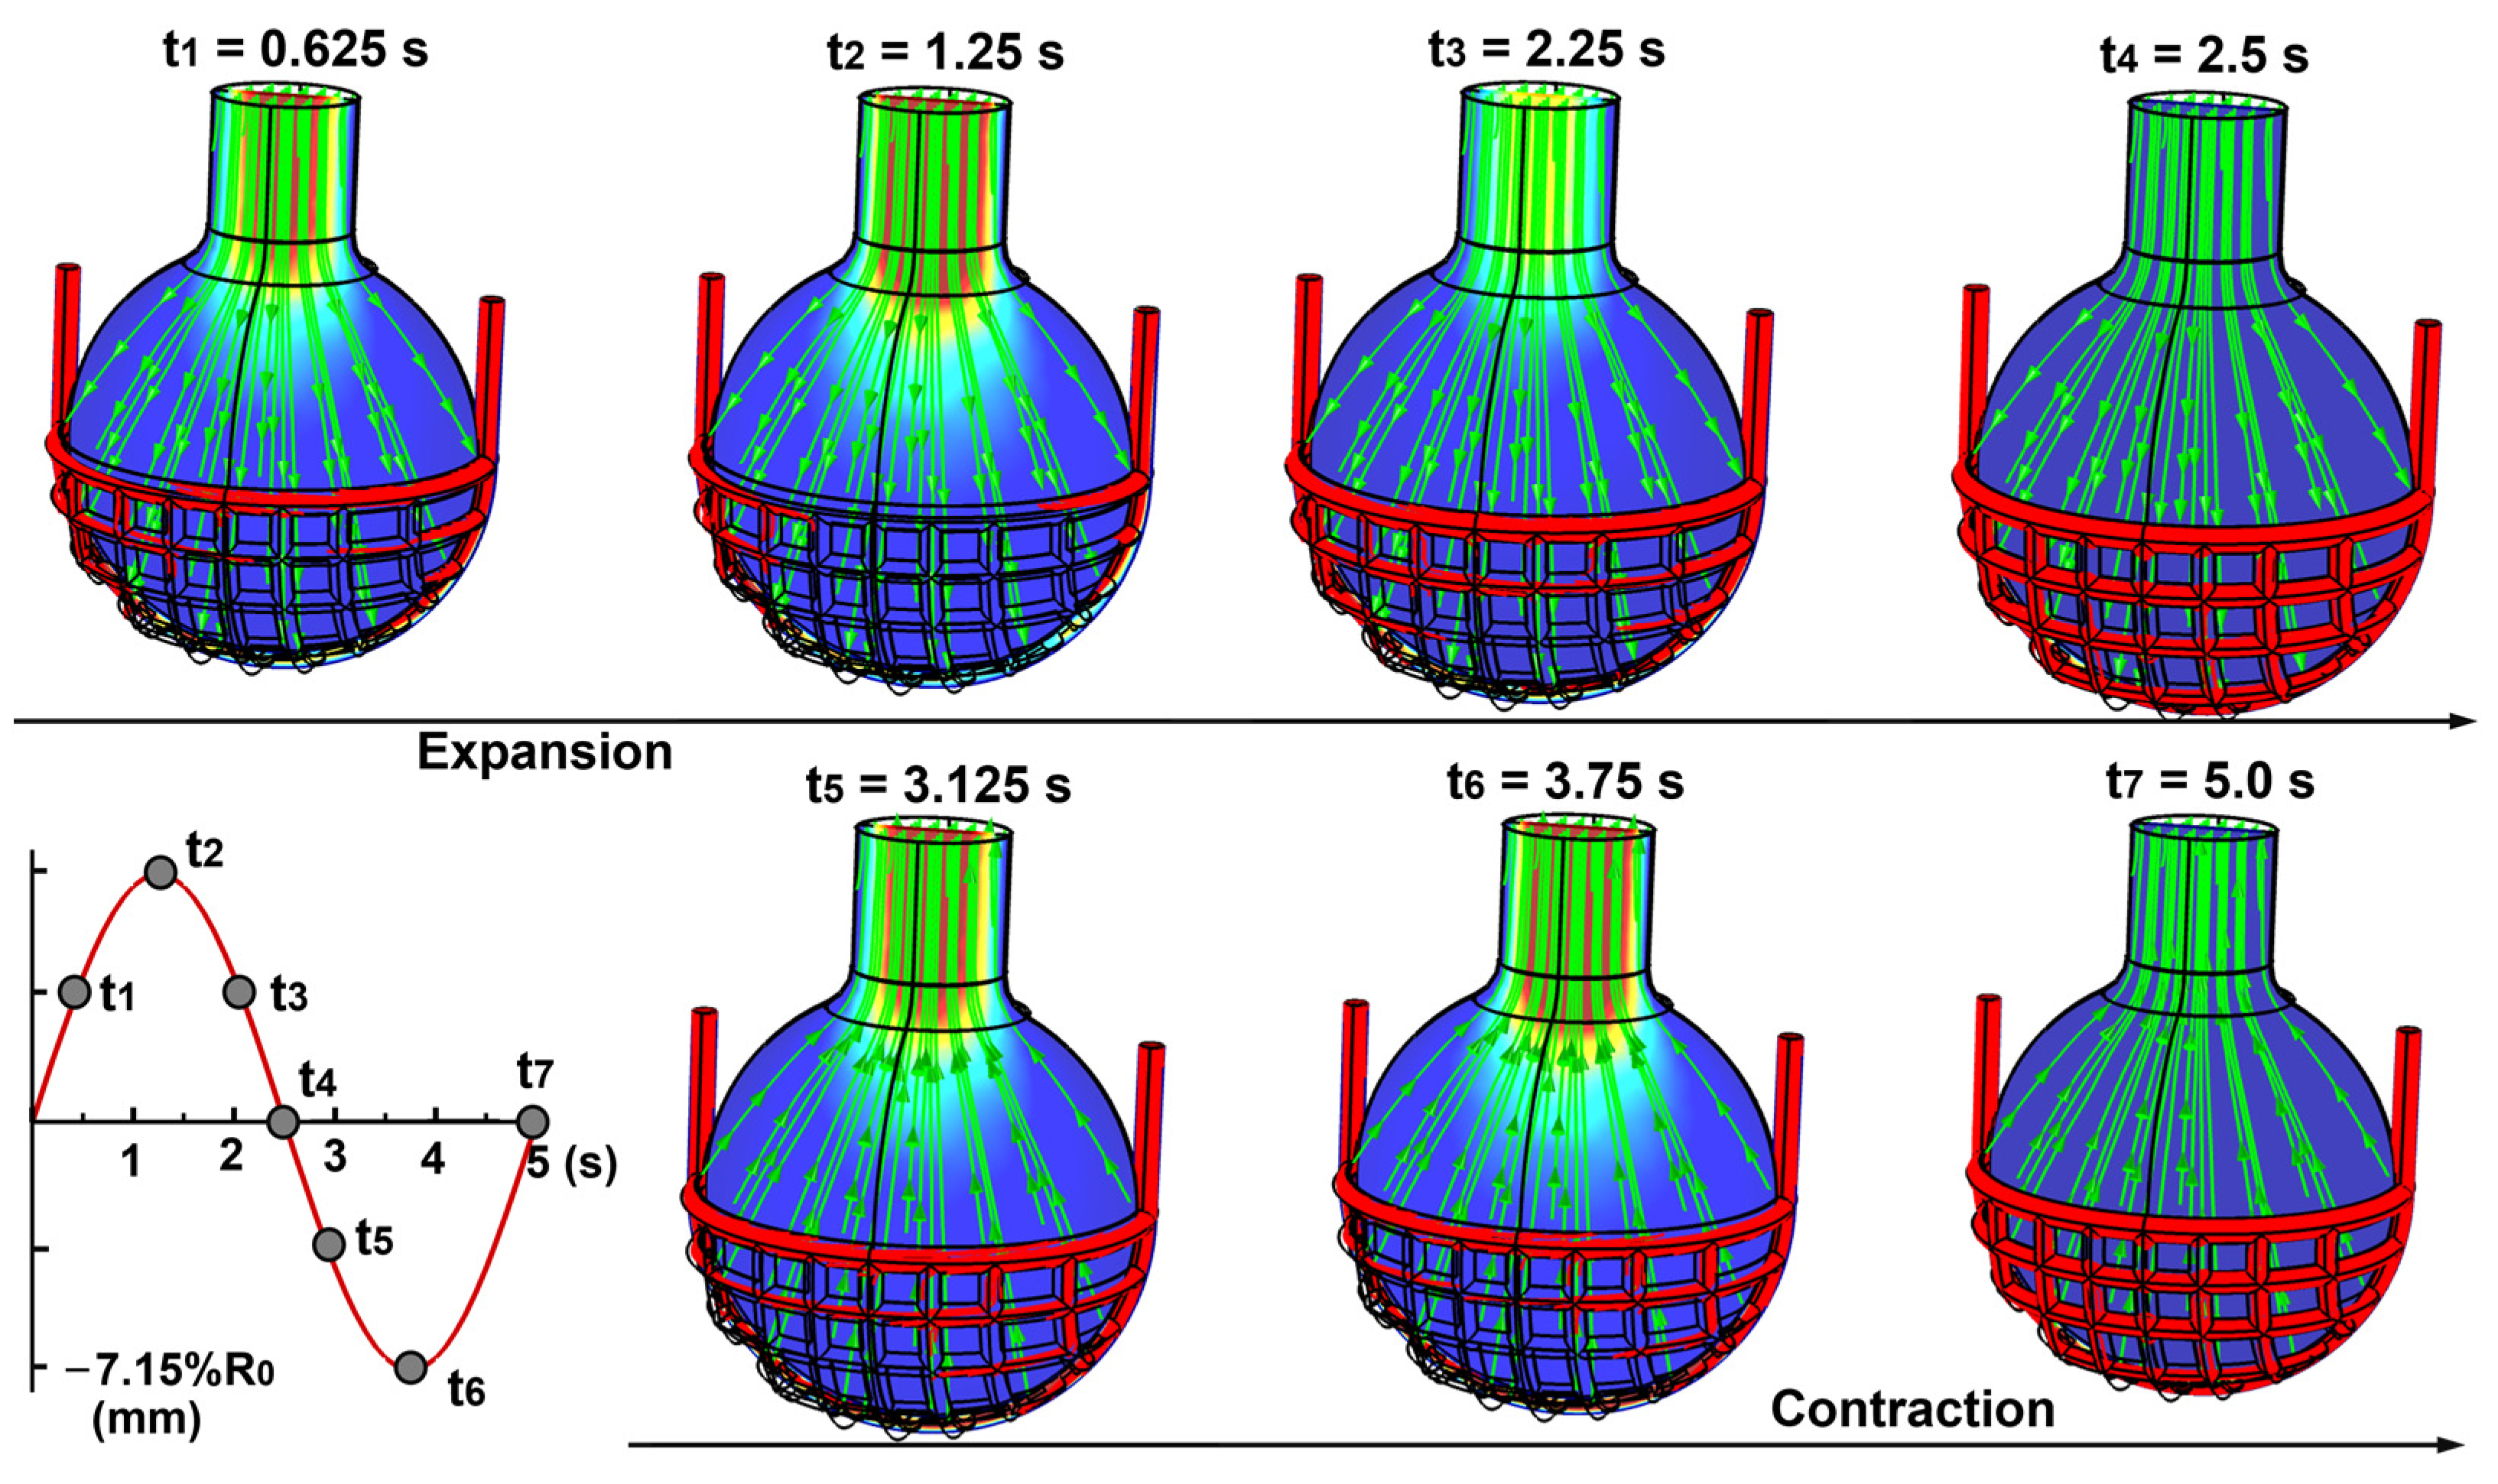
3.1.1. Airflow
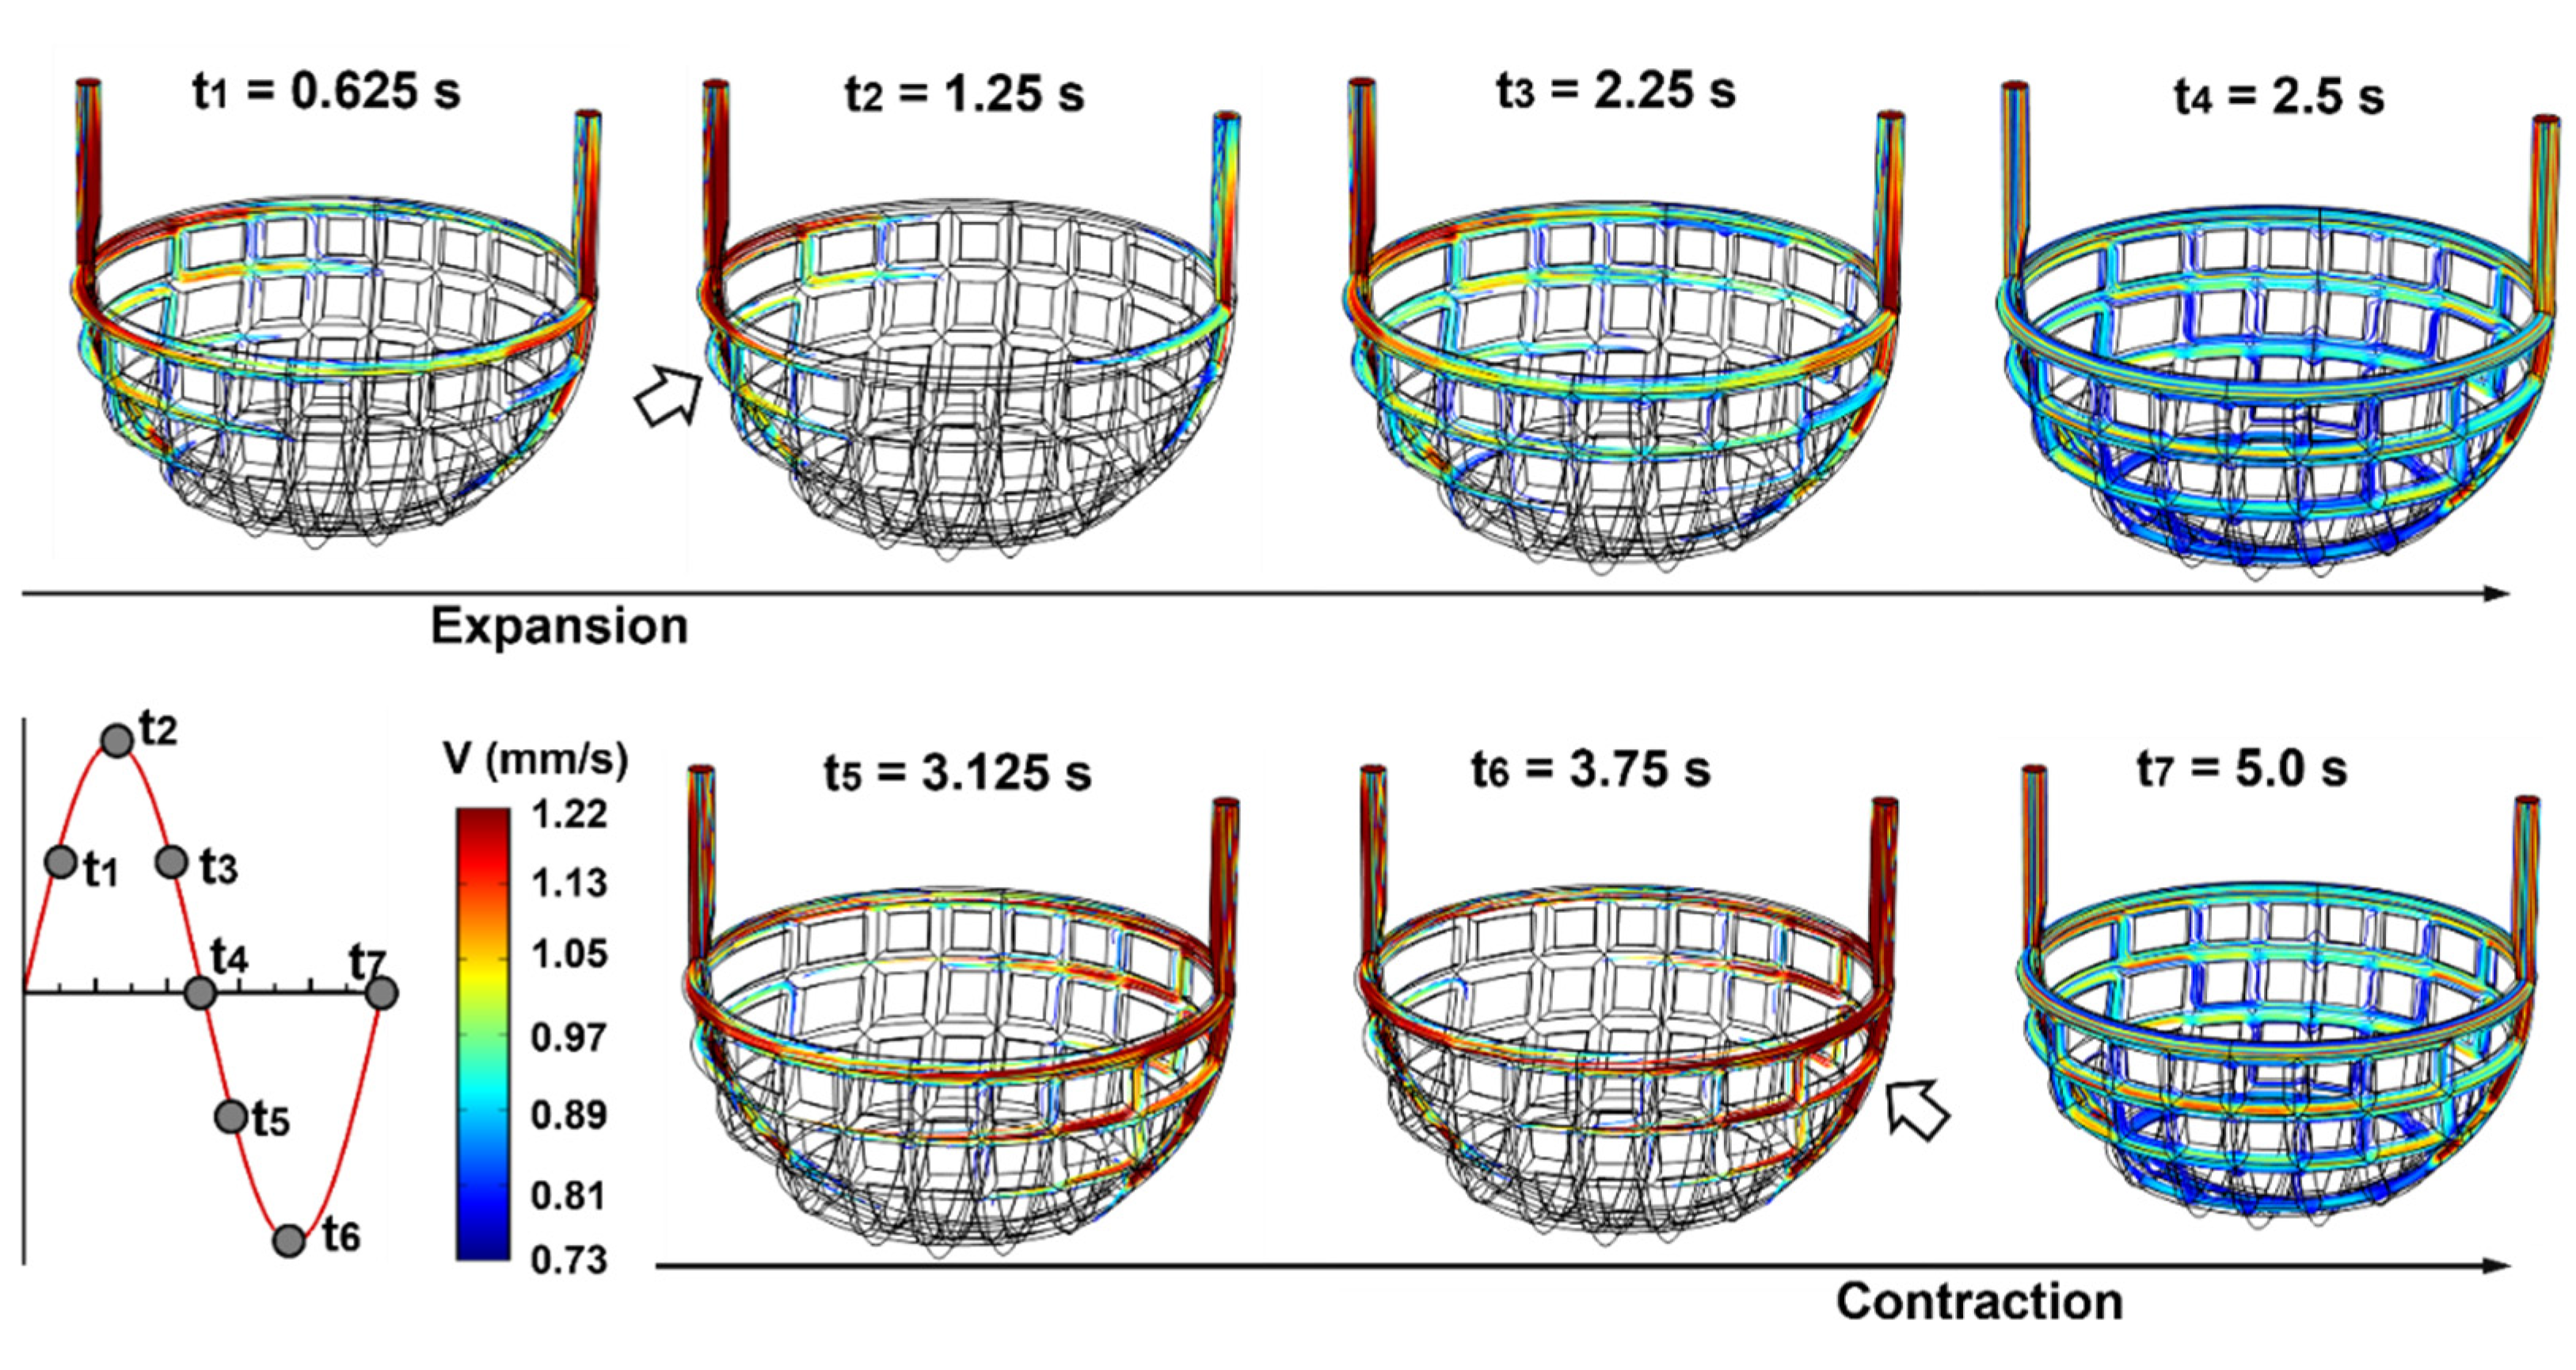
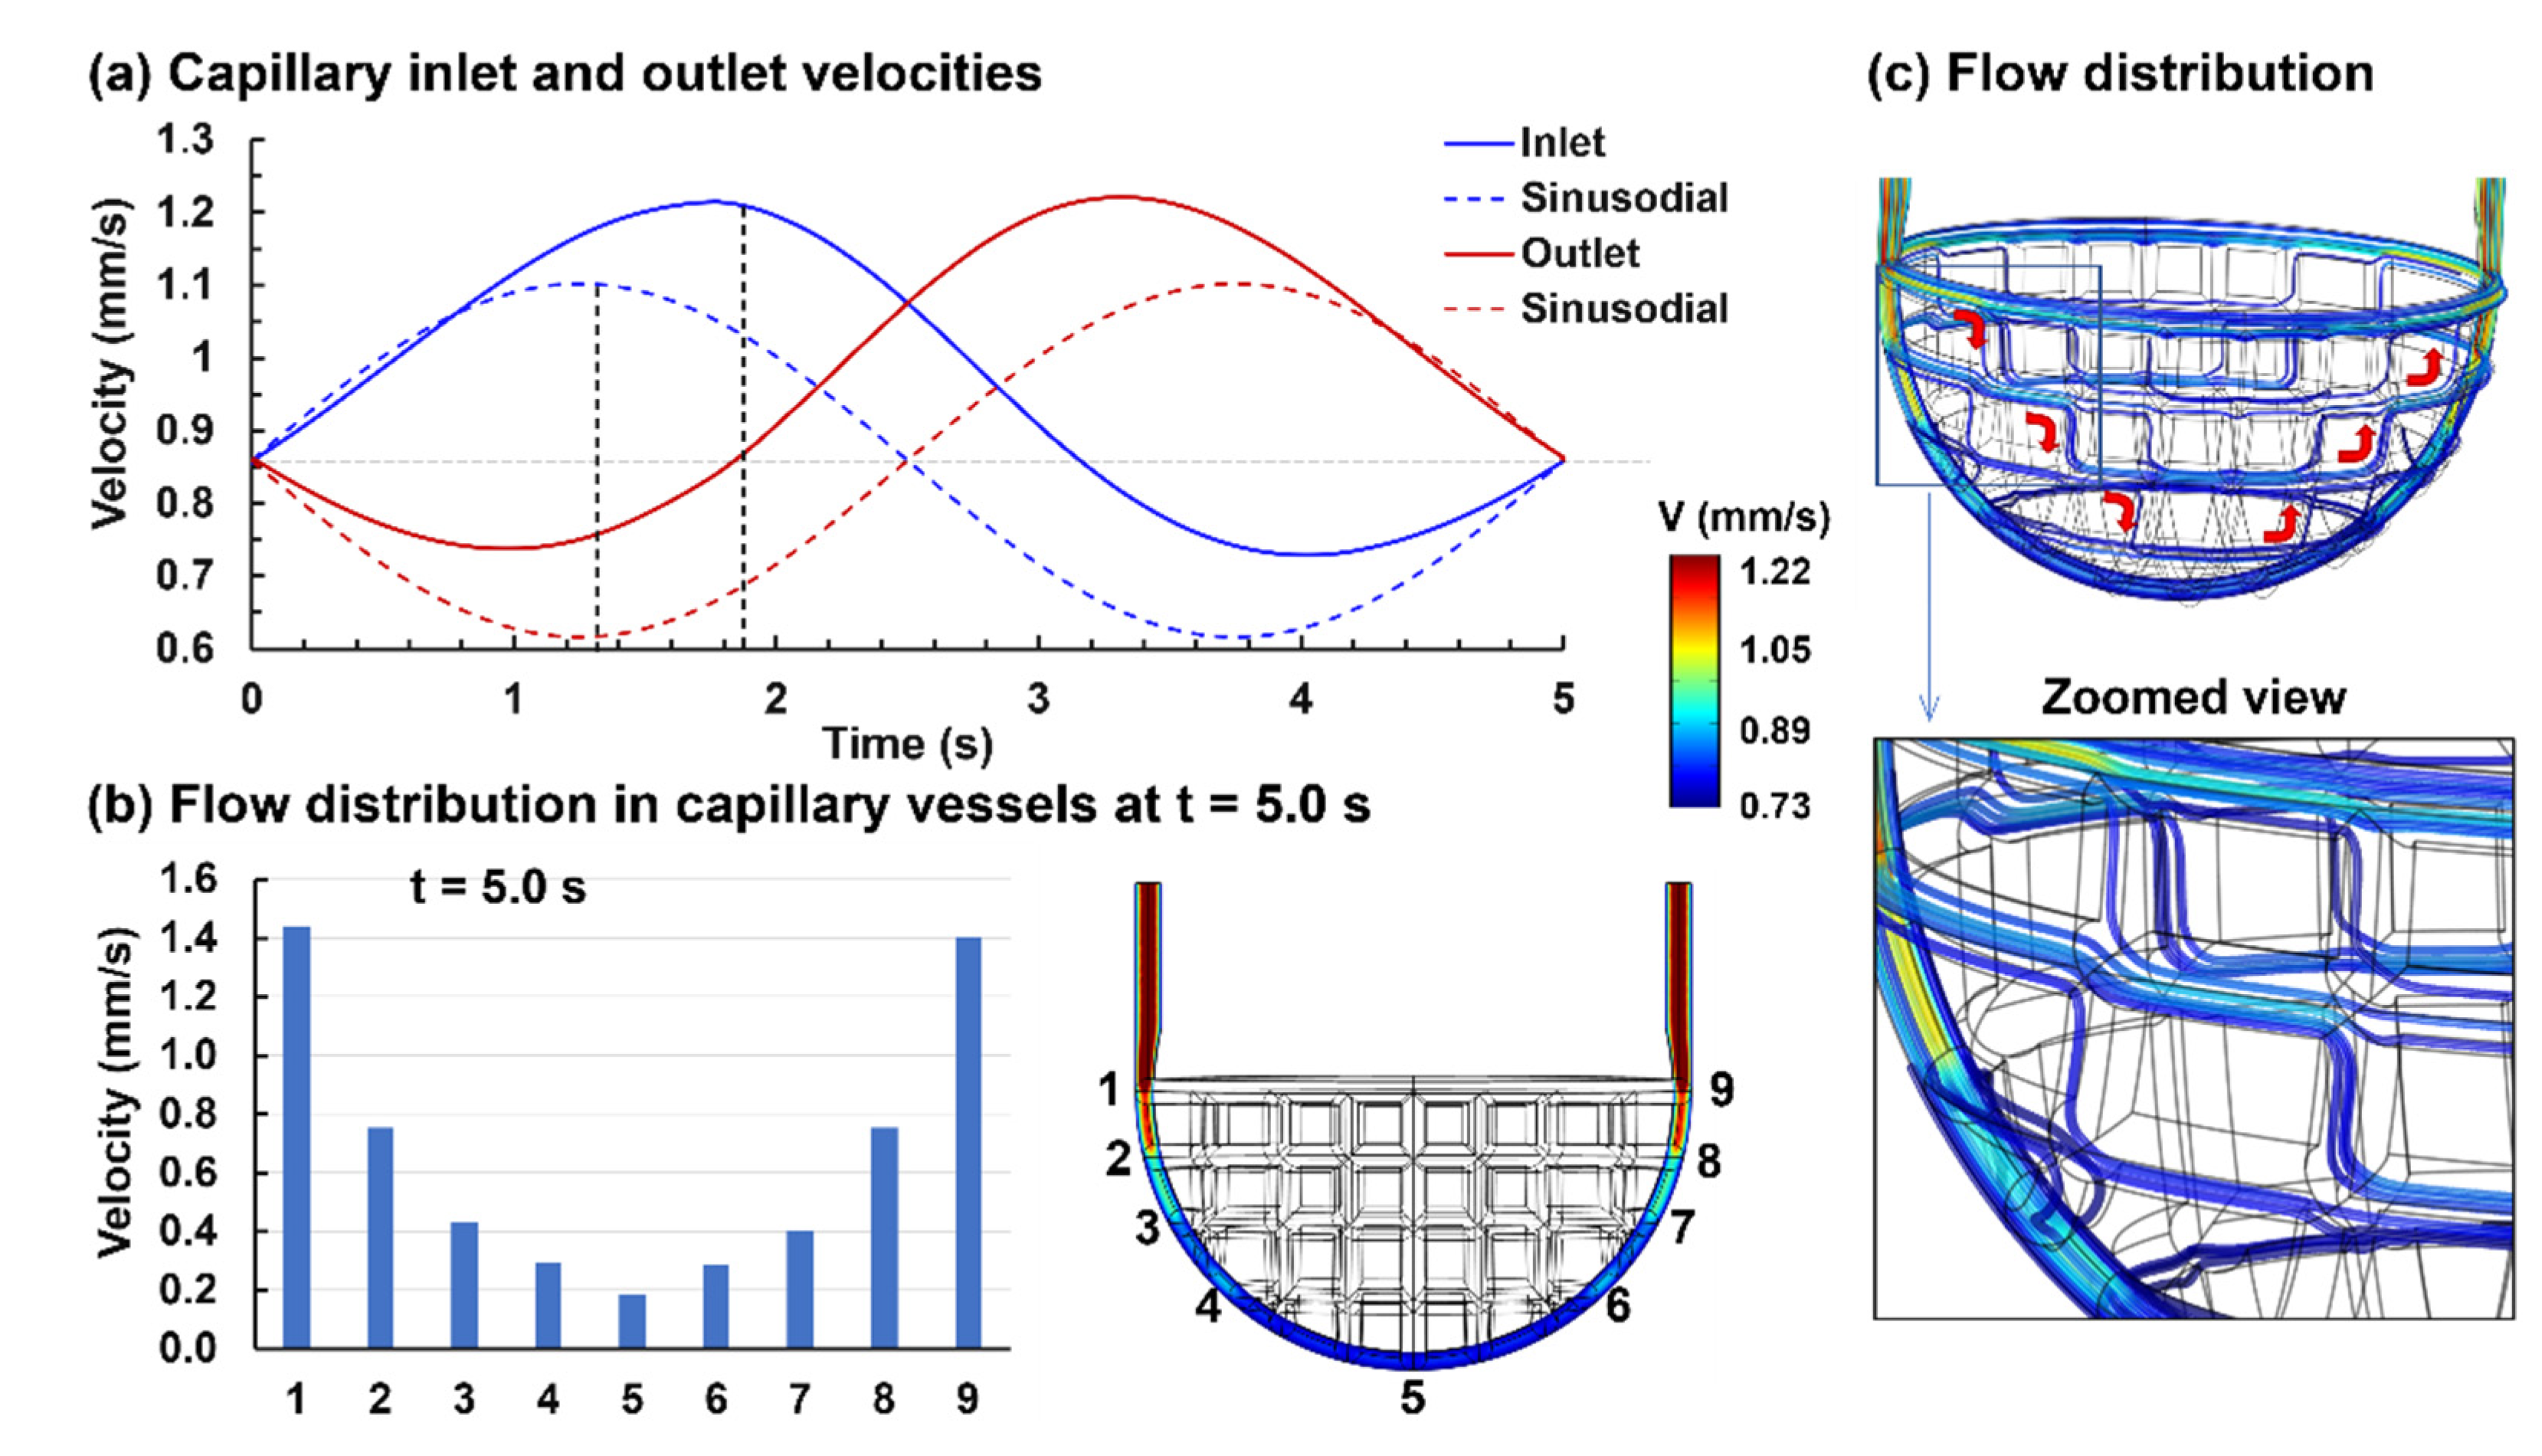
3.1.2. Capillary Blood Flow
3.2. Capillary Flow under Varying Pressures and Tidal Volumes
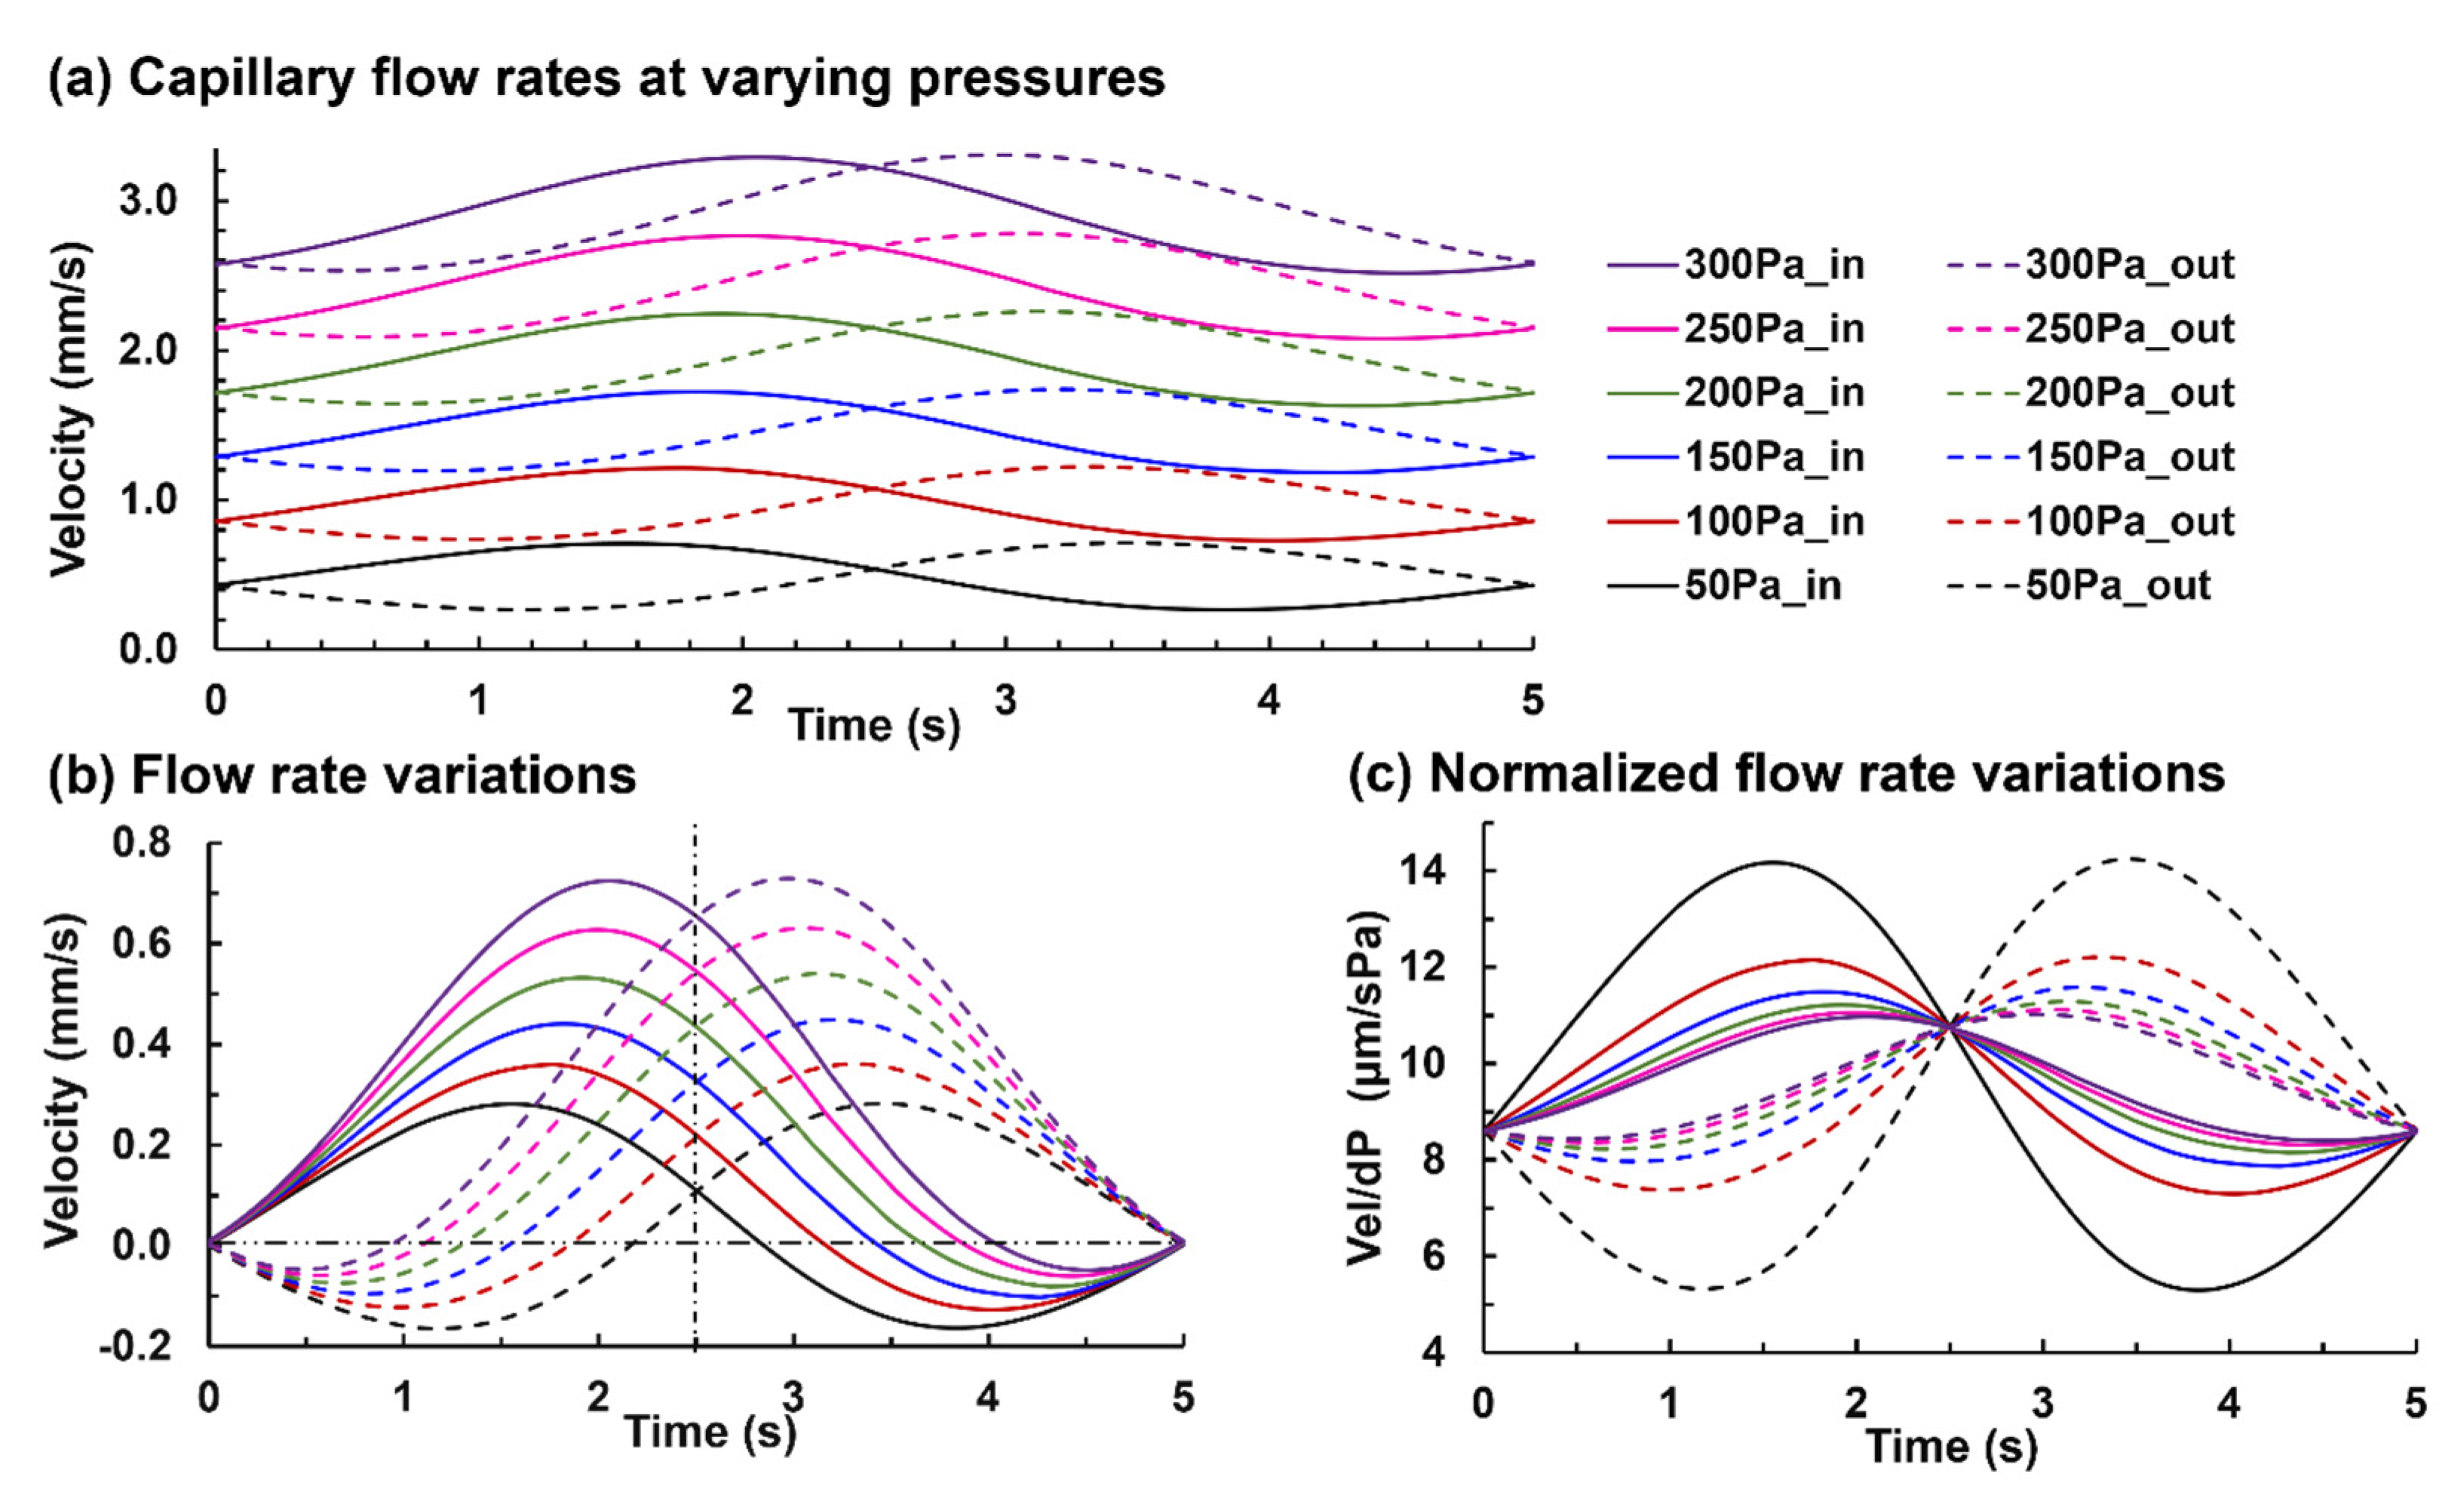
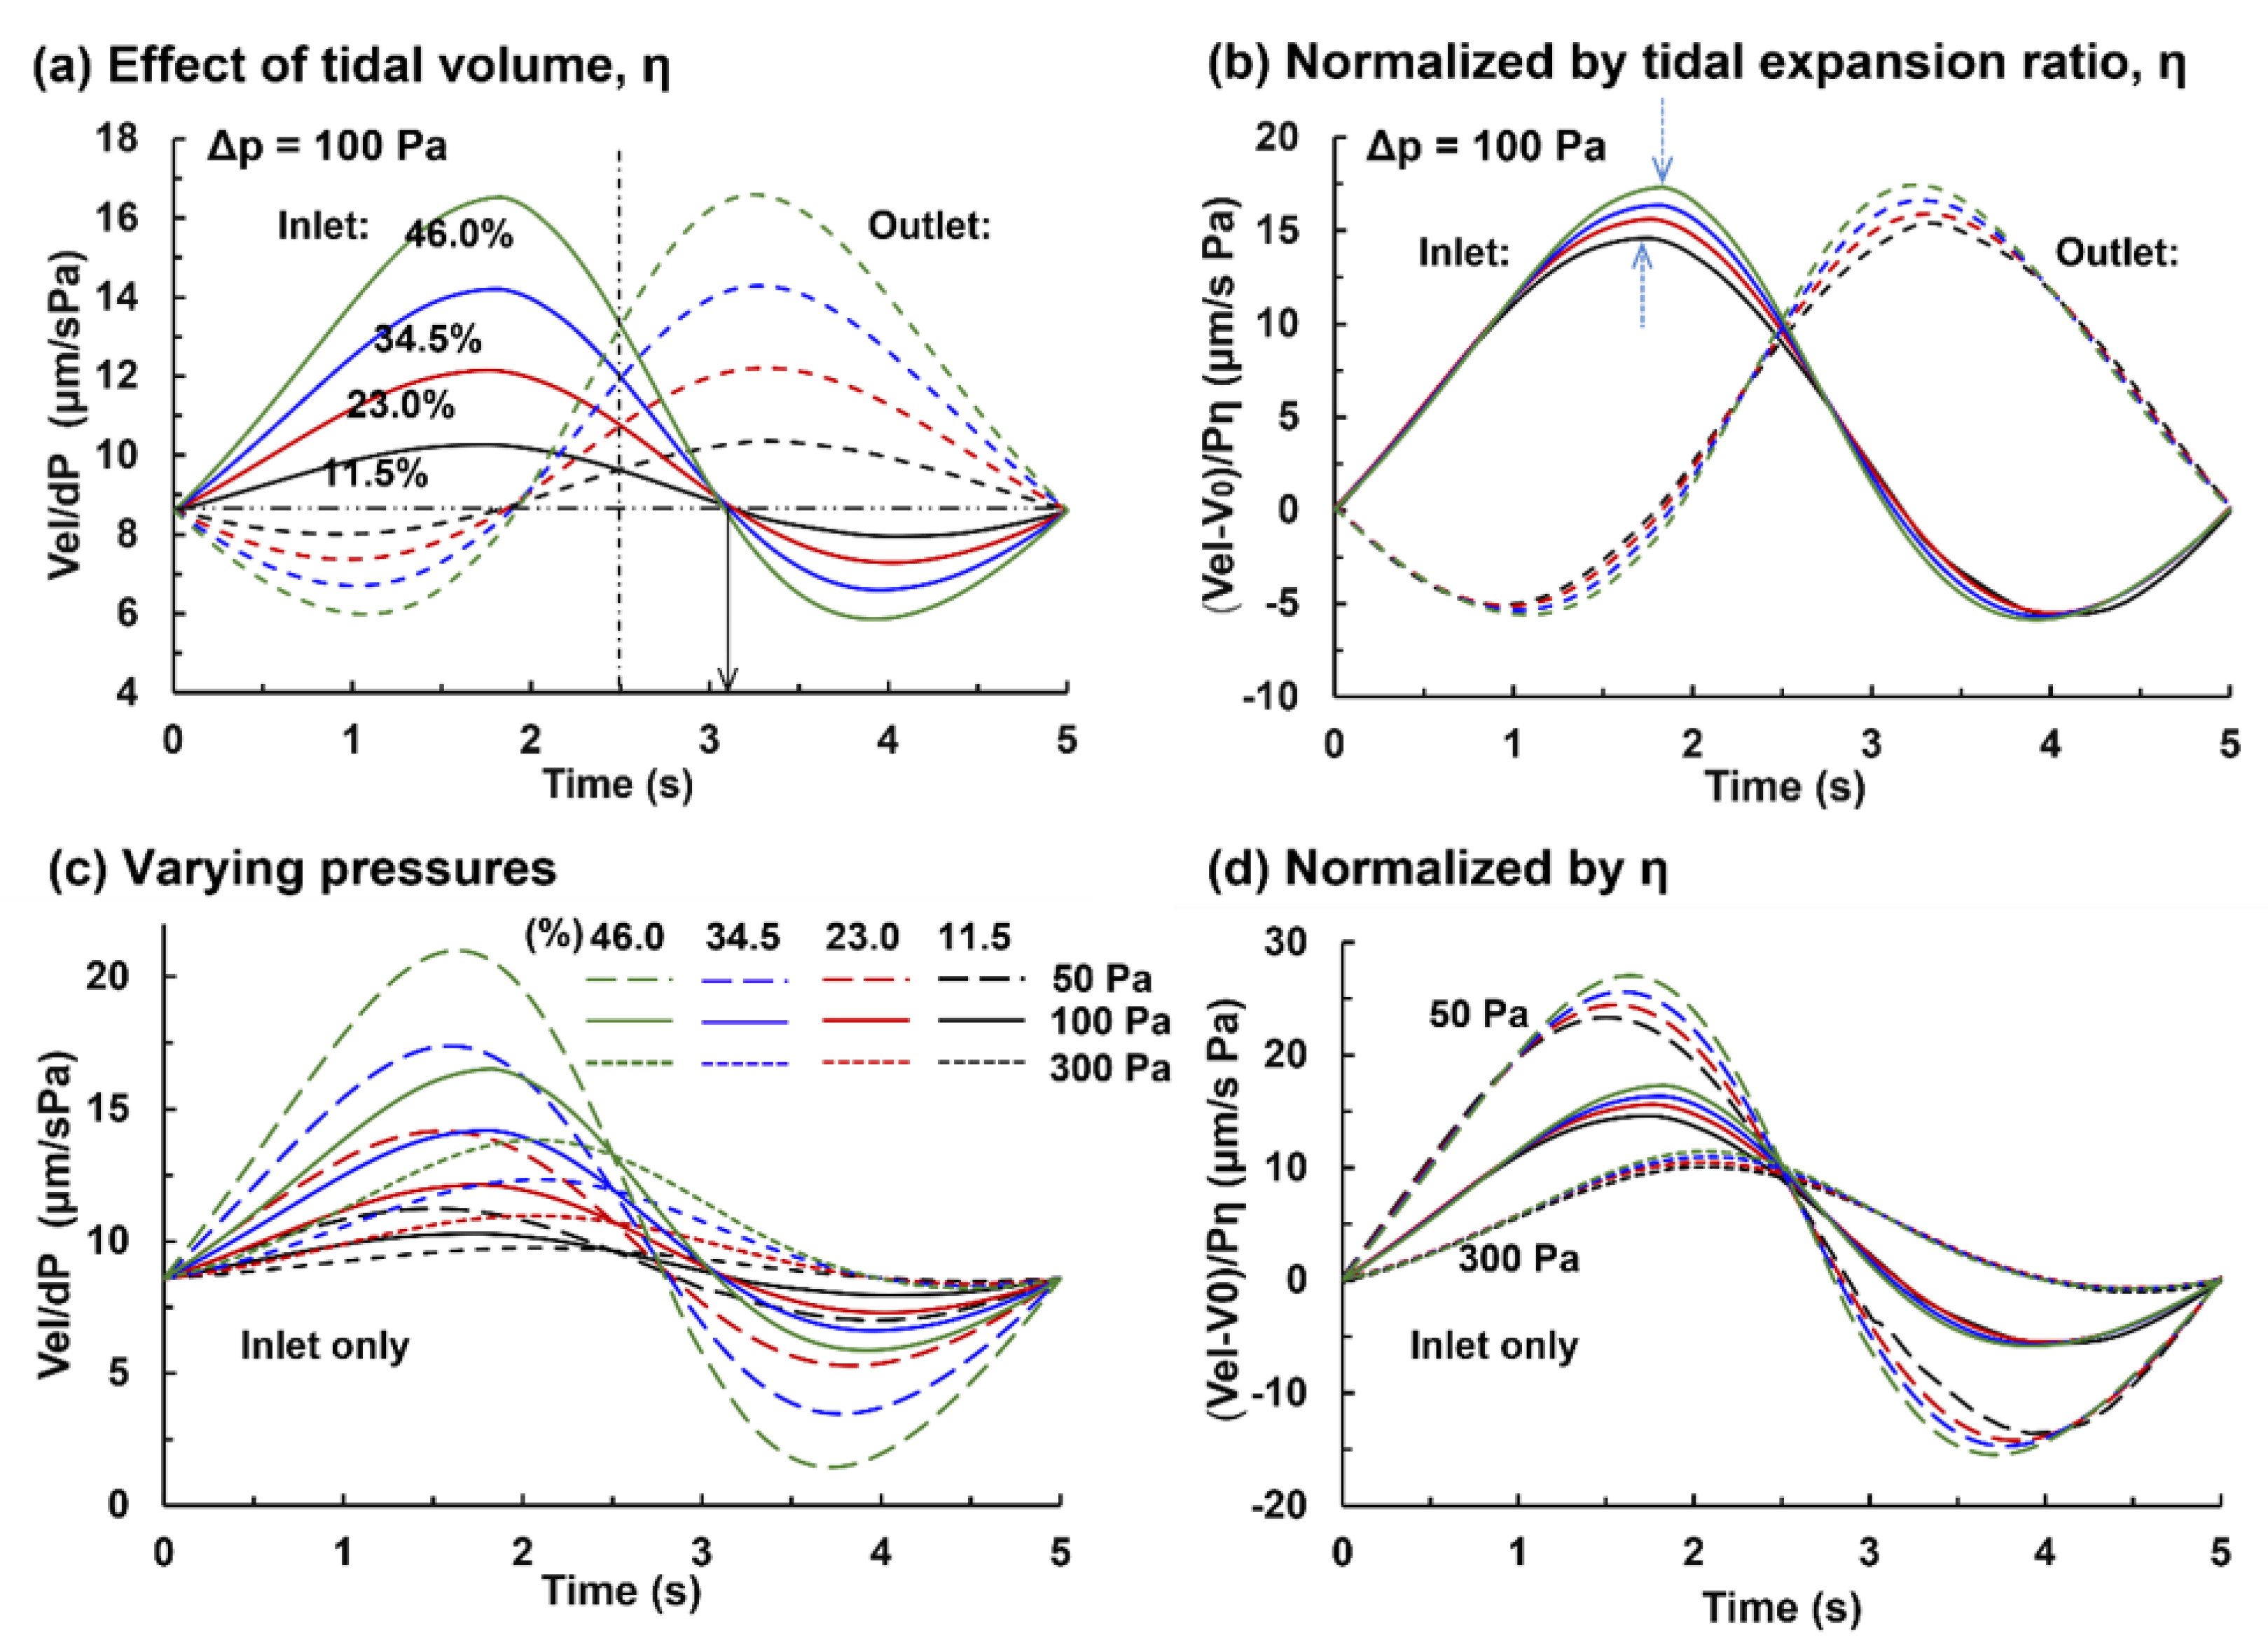
3.2.1. Capillary Blood Flow Rate
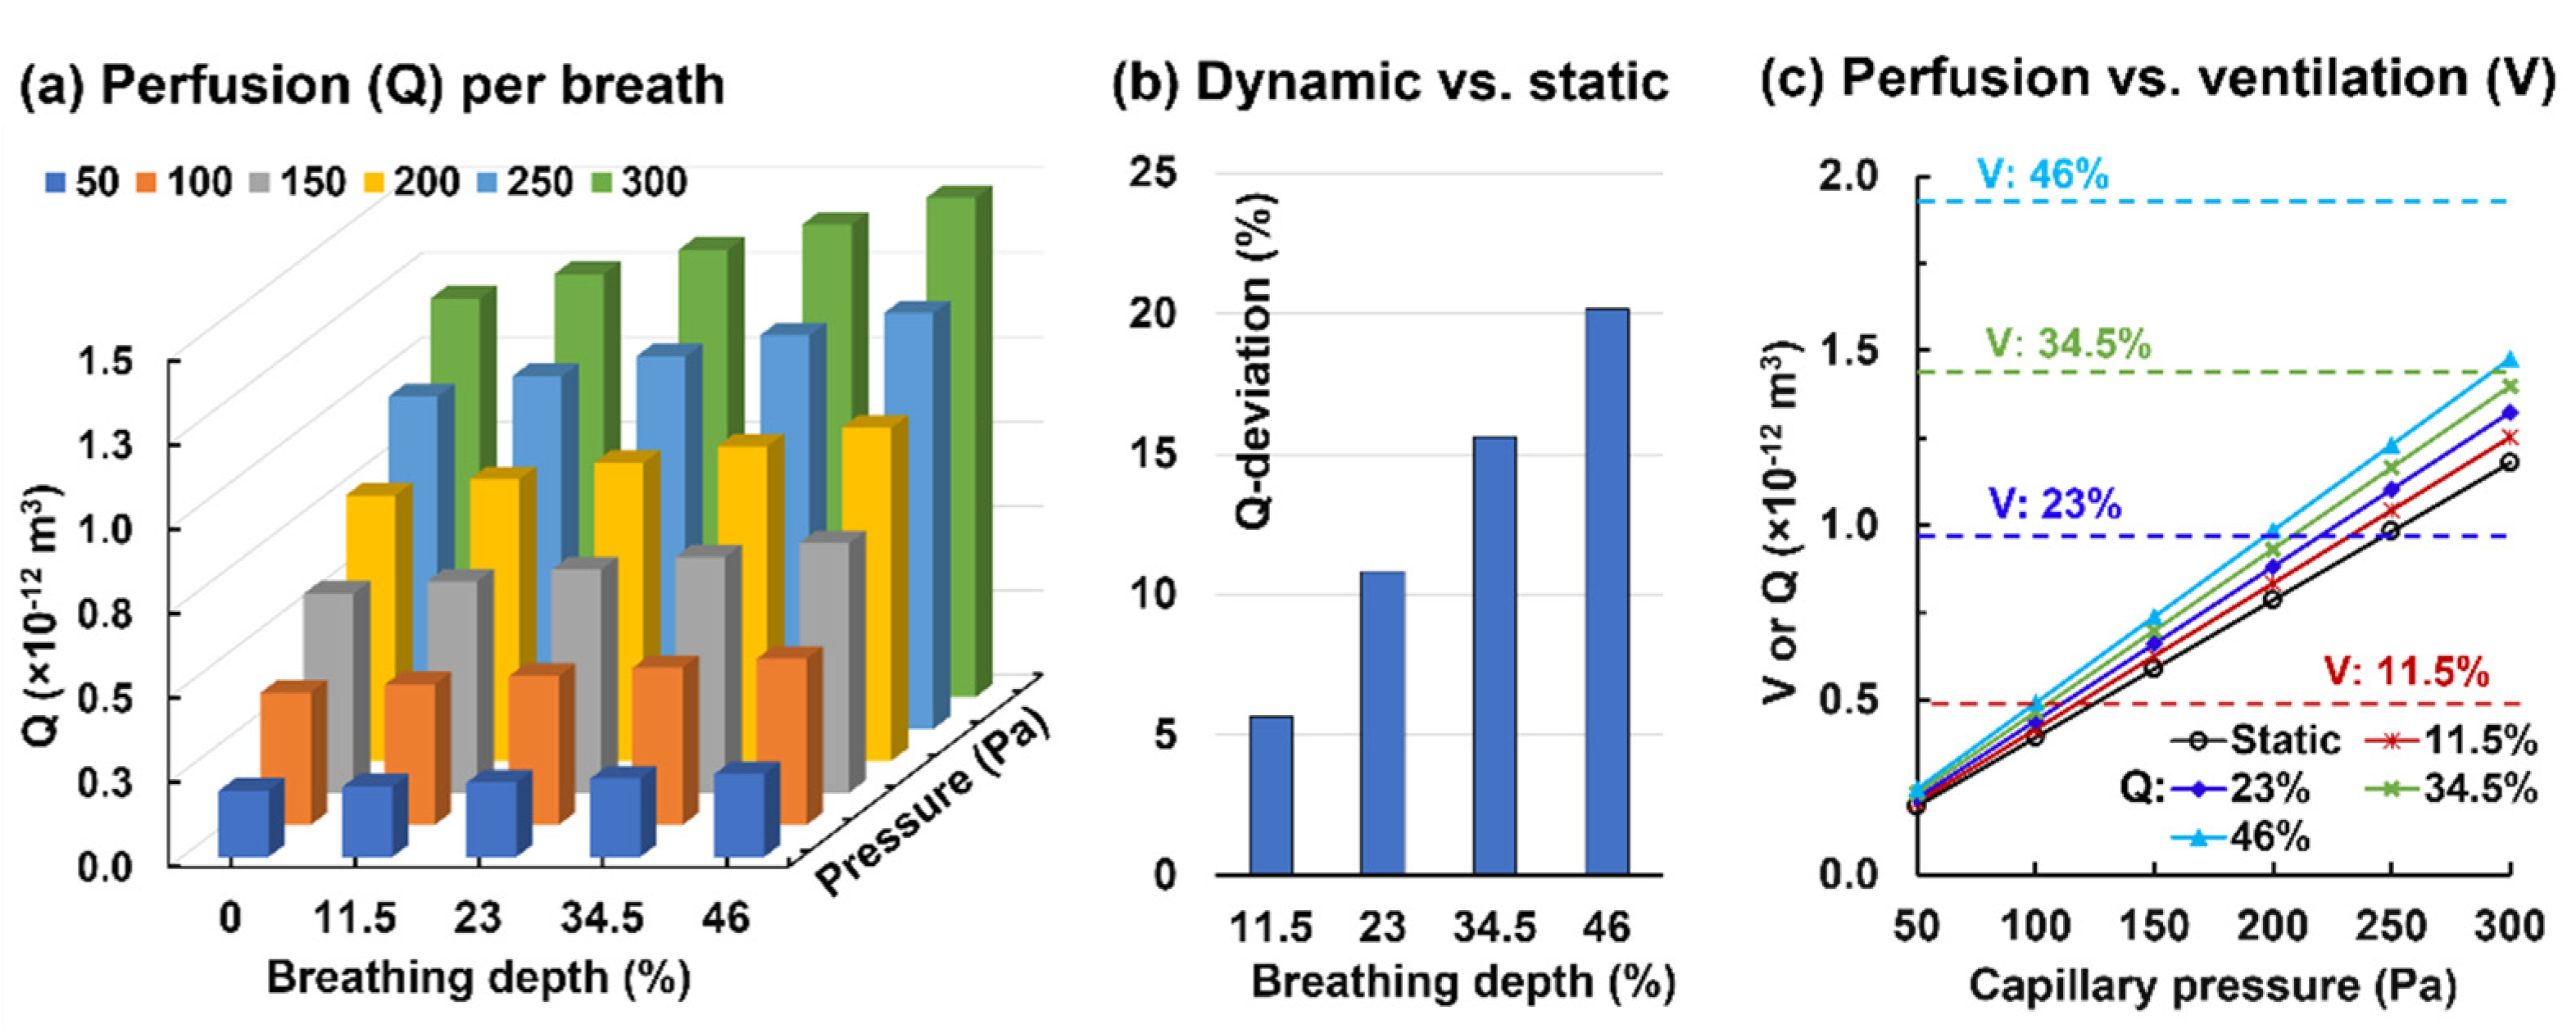
3.2.2. Alveolar Perfusion and Ventilation
3.3. Oxygen Exchange and Transport
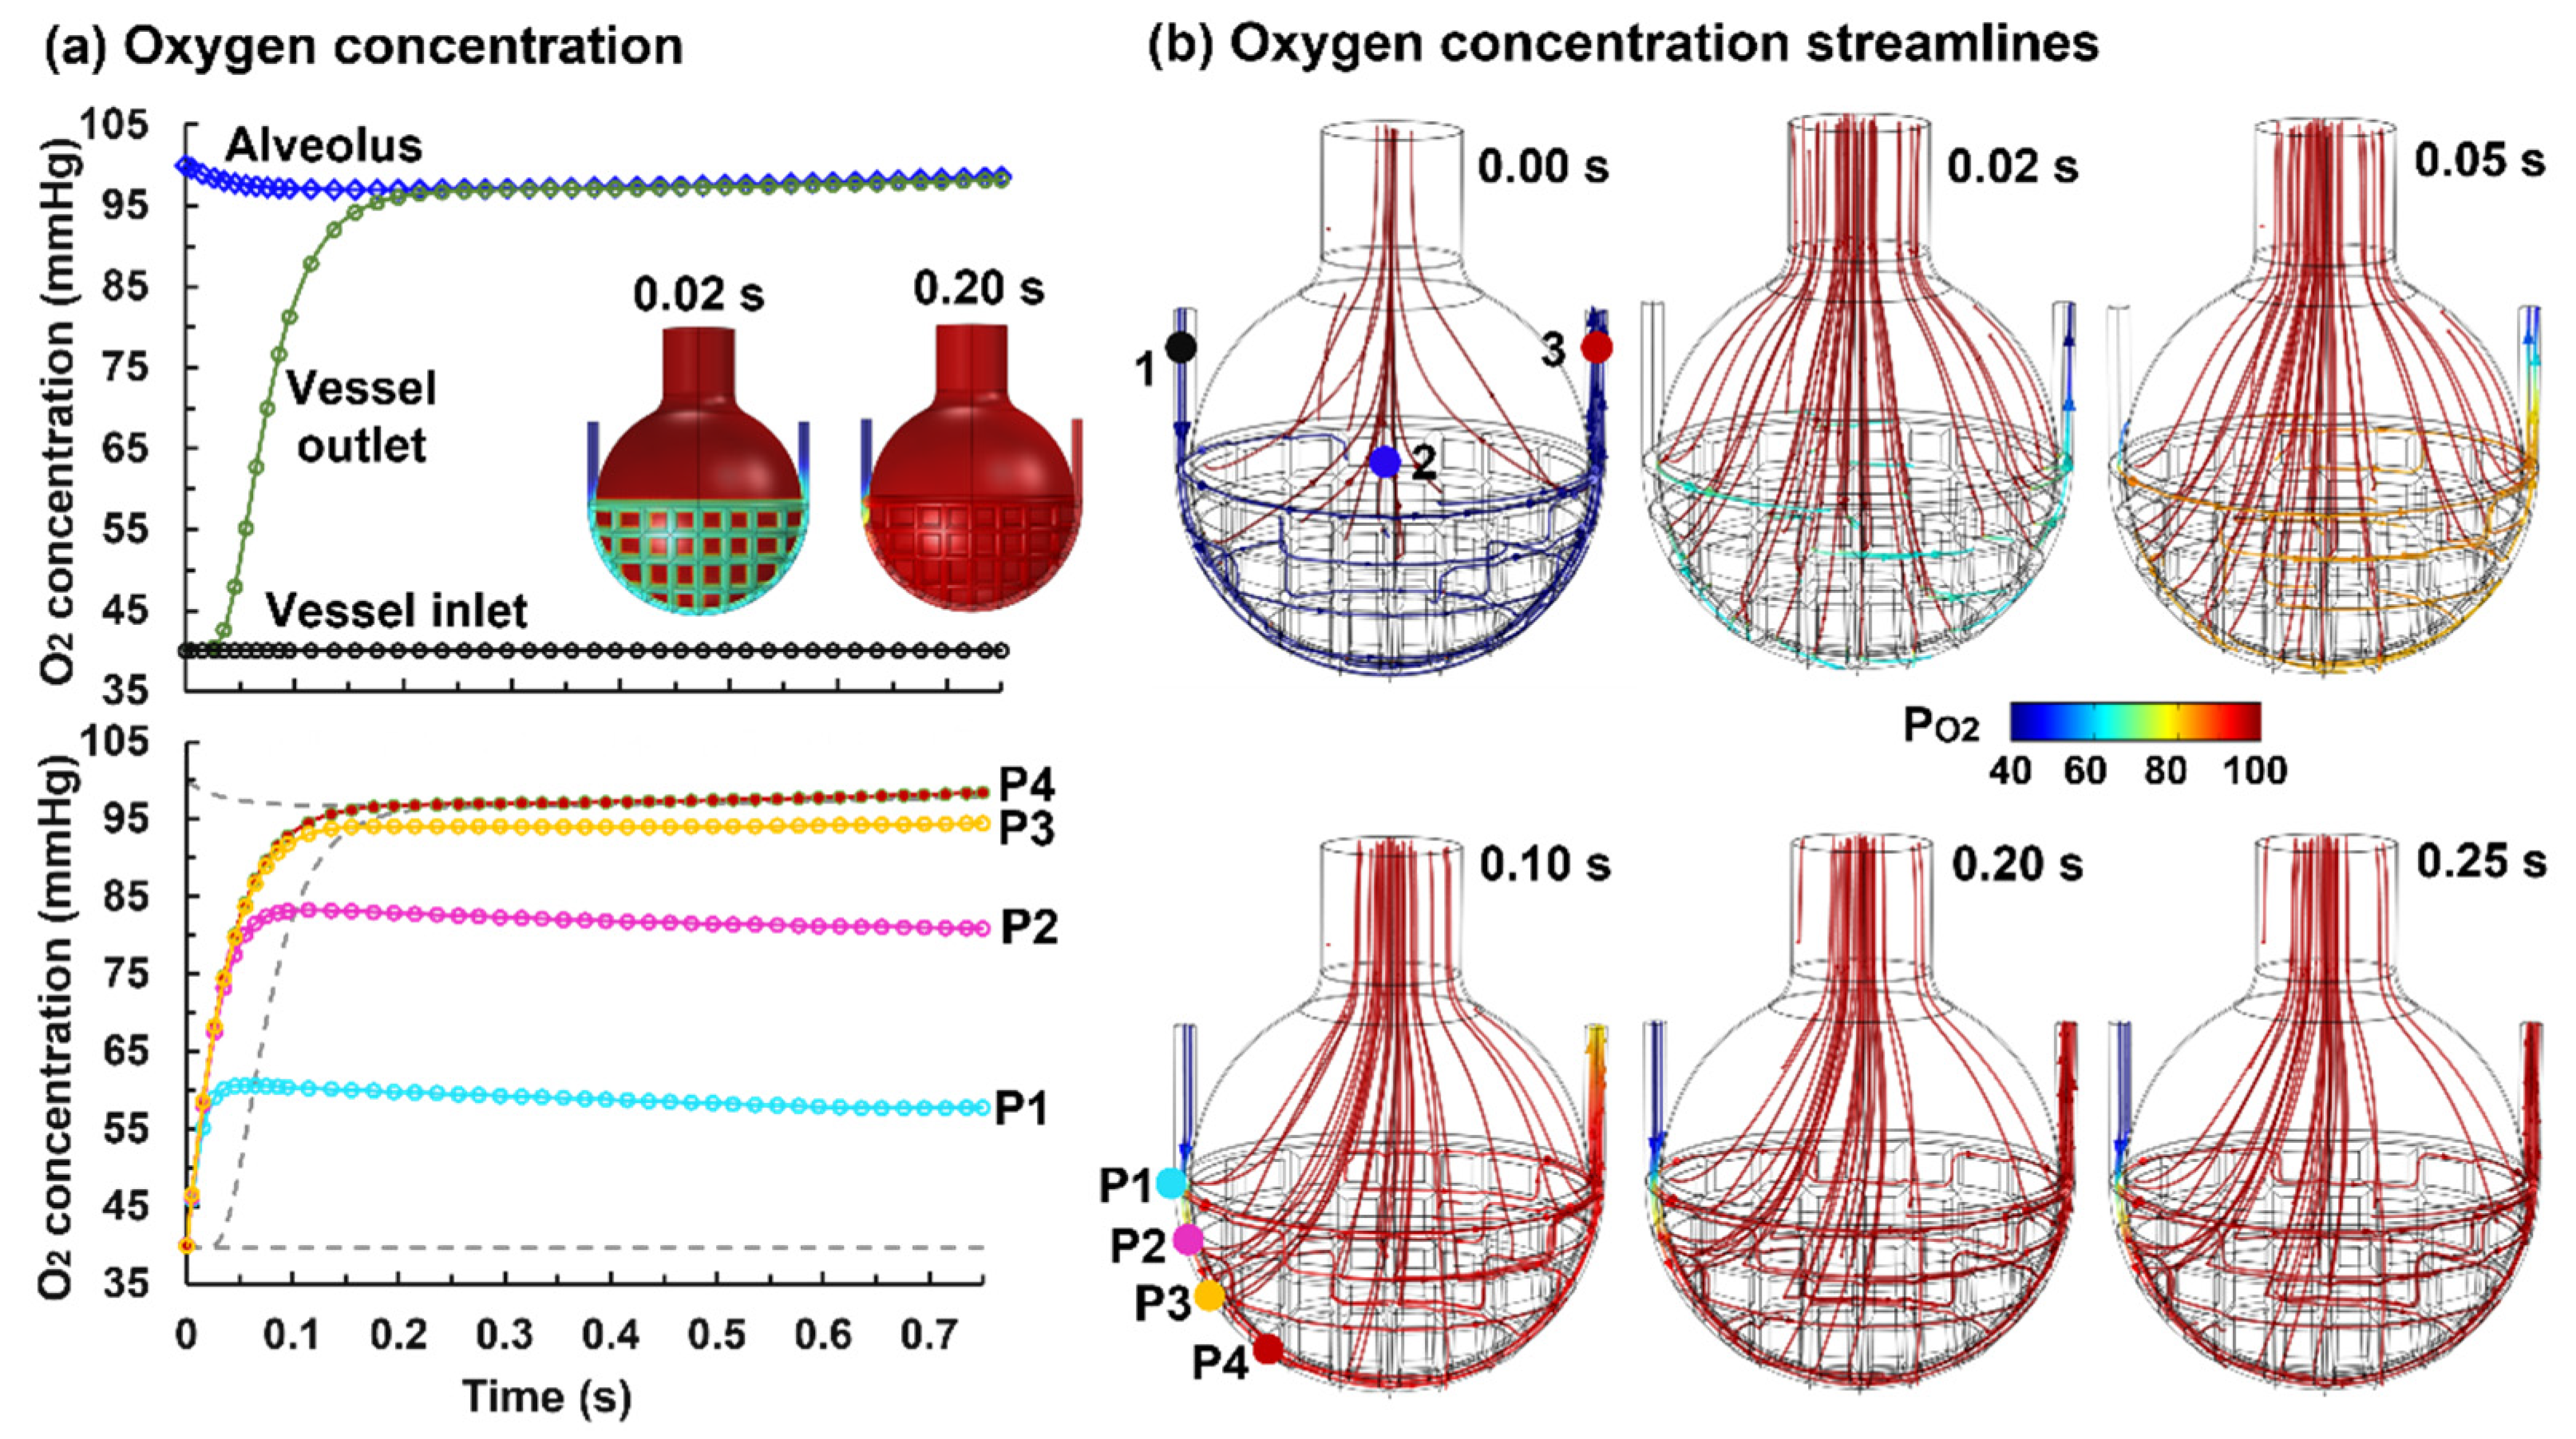
3.3.1. Control Case (η = 0.23 and Dm = 2.0 × 10⁻¹⁰ m2/s)
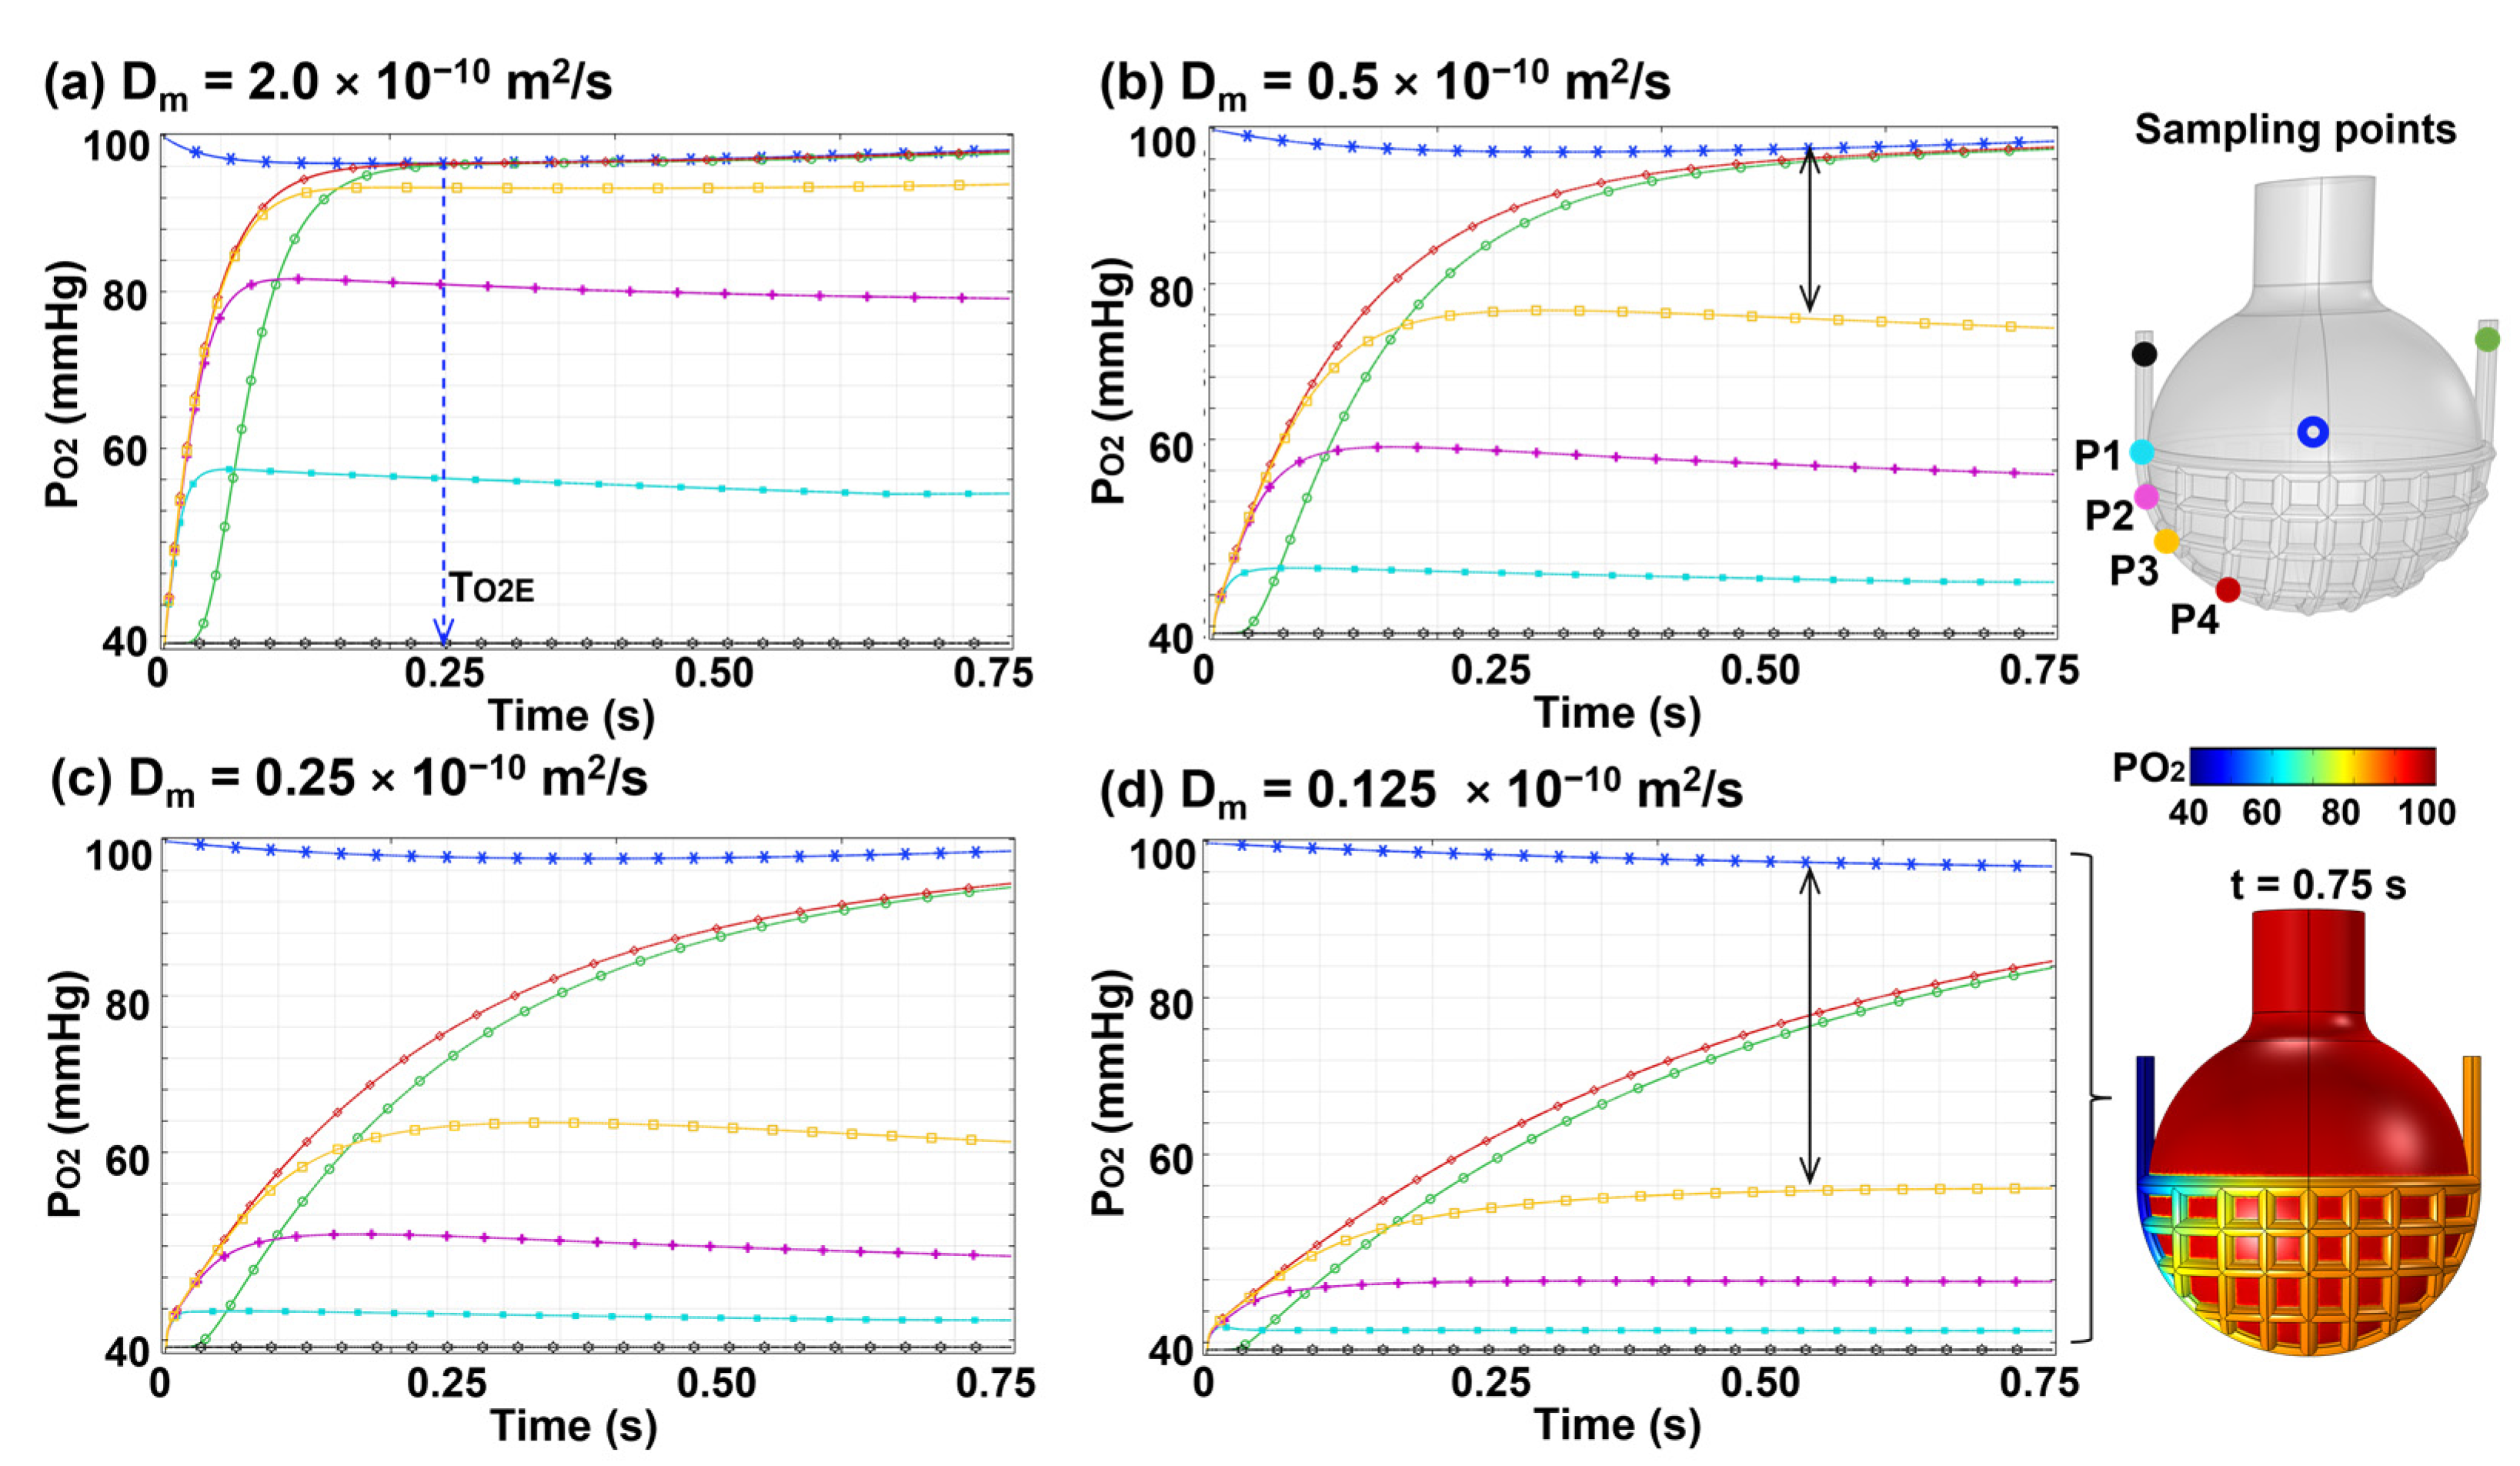
3.3.2. Effects of Membrane Diffusivity (Dm)
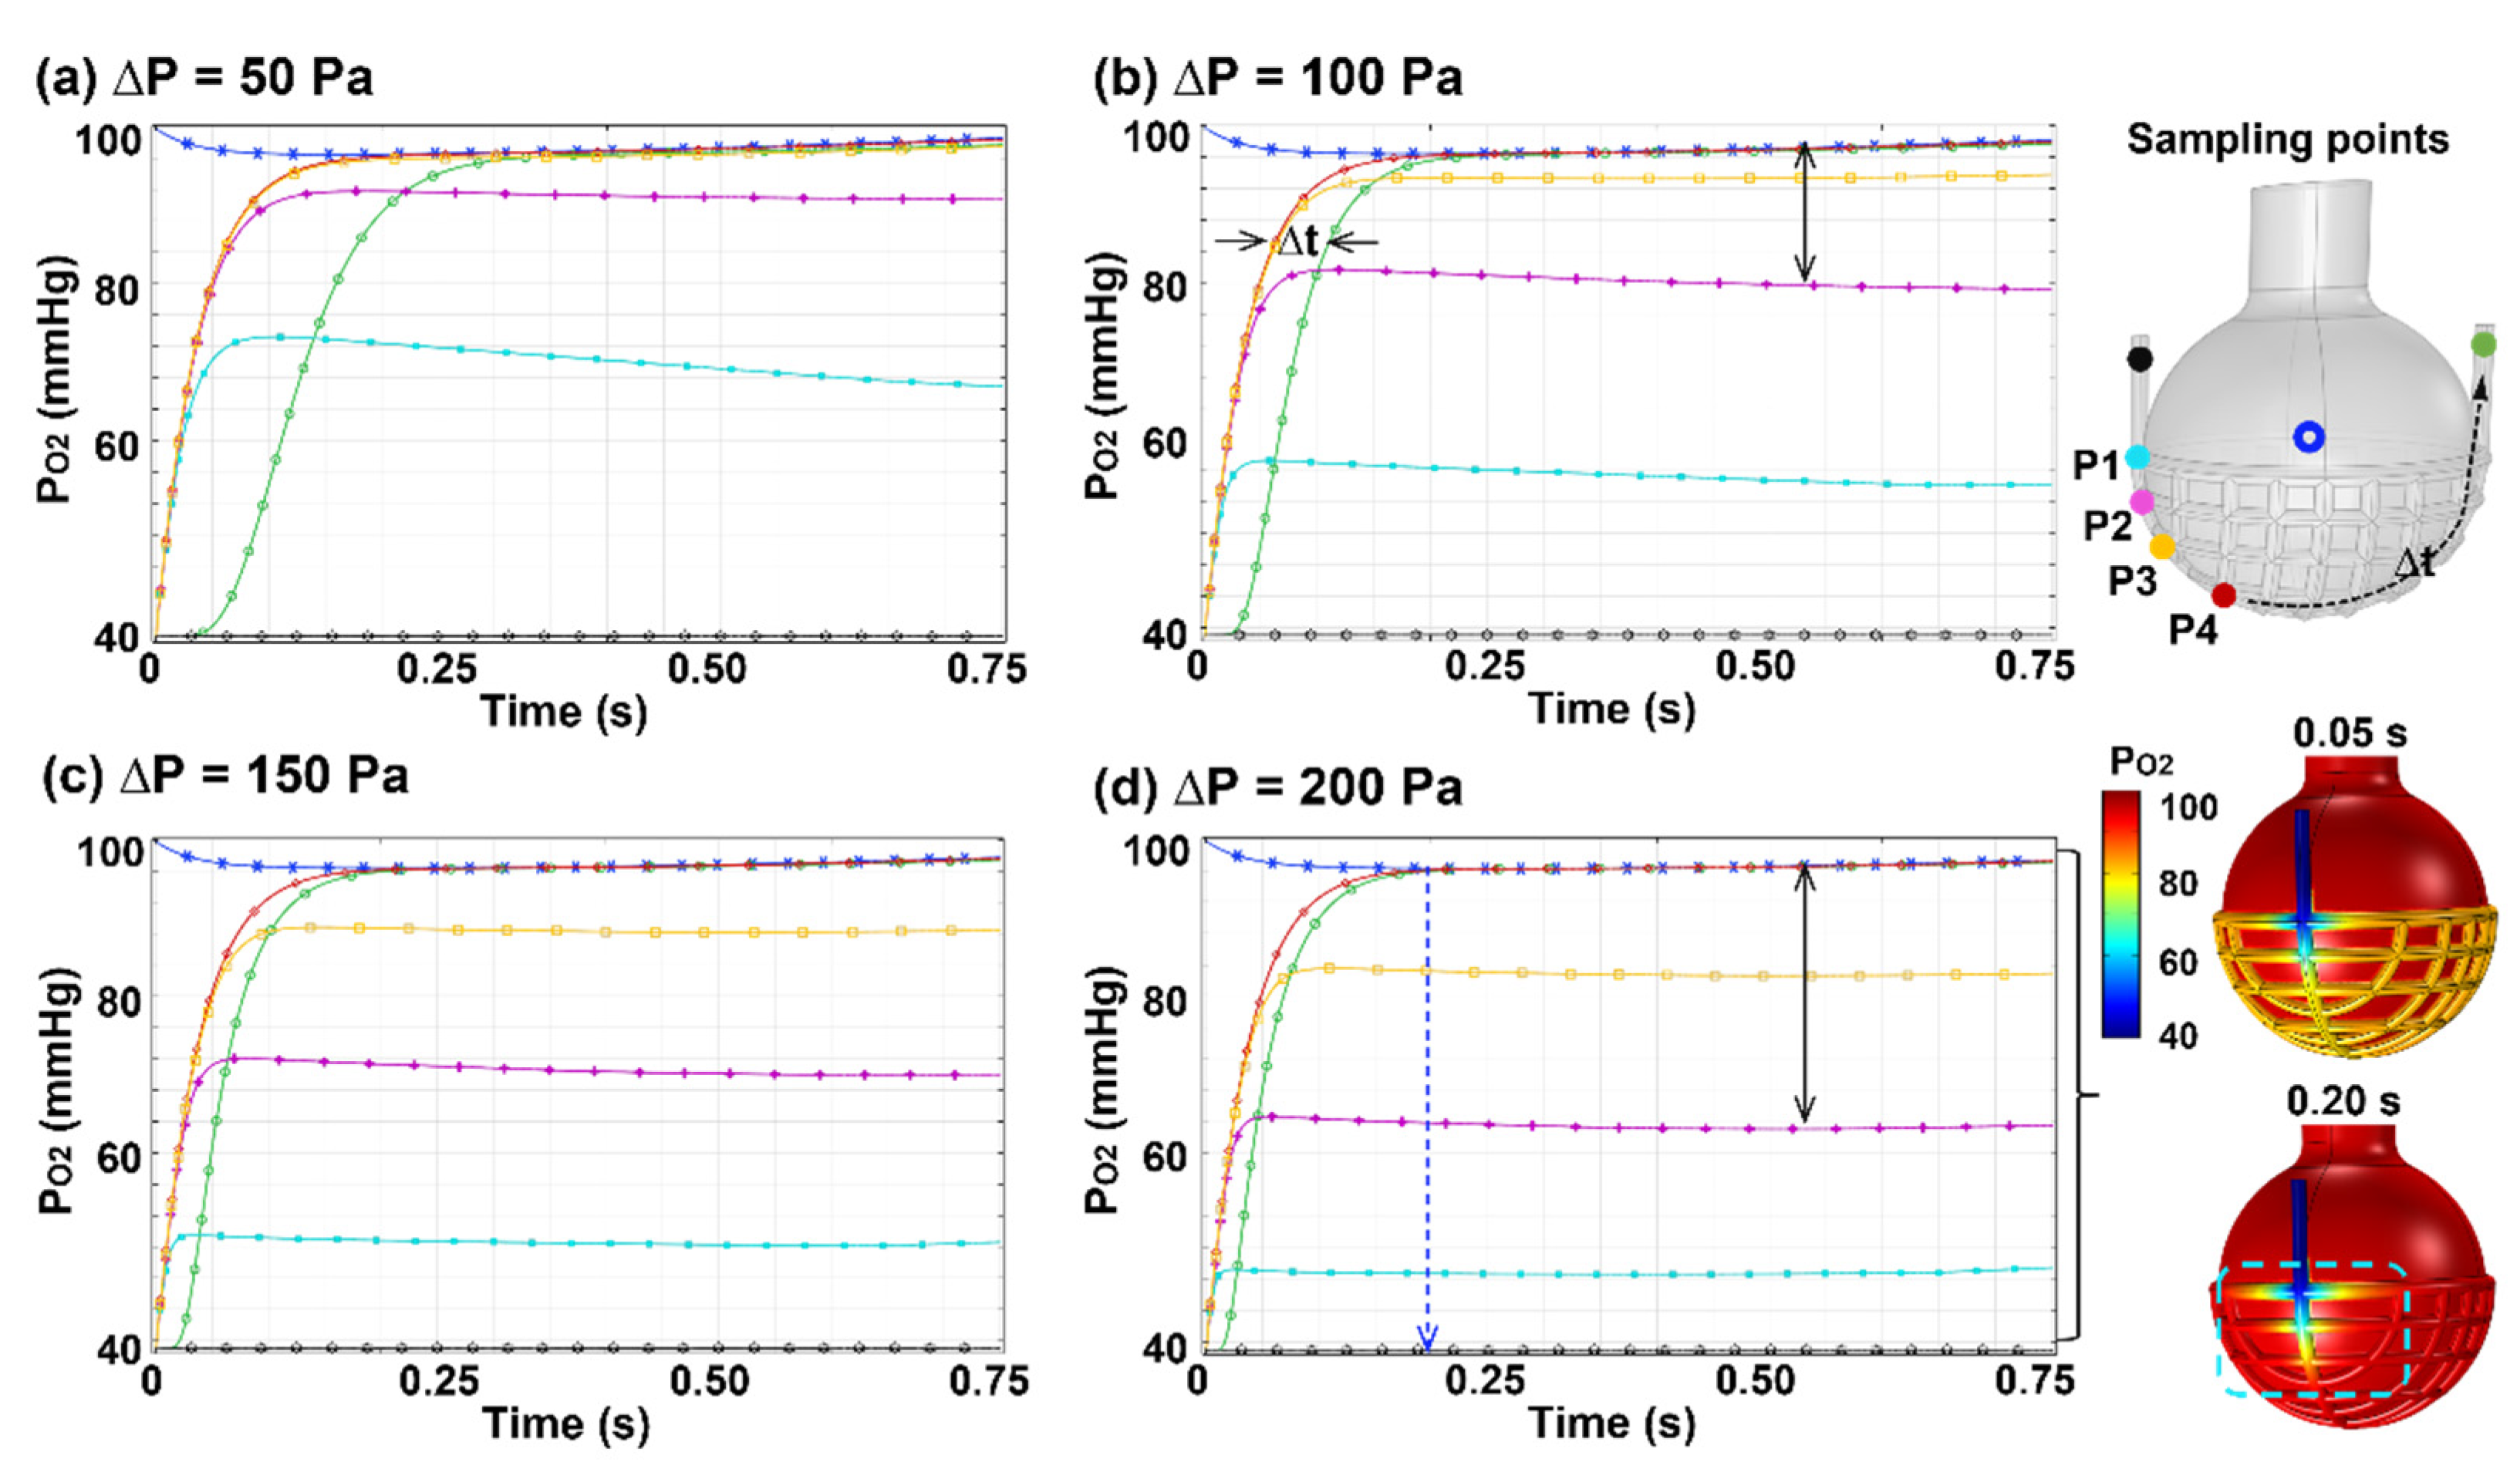
3.3.3. Effects of Perfusion Rate
4. Discussion
5. Conclusions
- (1)
- Blood perfusion was nonuniform among the capillary vessels, and the geometry oscillation further increased the nonuniformity;
- (2)
- A static alveolus–capillary model underestimated the blood flow rate by 11% under resting conditions and increased linearly with the breathing depth for a given capillary pressure;
- (3)
- The blood flow had a phase lag (~0.55 s) than the alveolar motion under resting conditions; the phase lag increased with increasing cardiac output;
- (4)
- The blood oxygen level reached the alveolar level around 1/5–1/3 of the capillary; oxygen exchange was diffusion driven within this region and was perfusion limited beyond this region;
- (5)
- The time to reach the air–blood equilibrium in PO2 was sensitive to the membrane diffusivity and was relatively insensitive to the blood flow rate;
- (6)
- Without measured alveolus–capillary barrier diffusivity for oxygen in the literature, a value of 2.0 × 10⁻¹⁰ m2/s was proposed for normal conditions based on the match to empirical data.
Author Contributions
Funding
Institutional Review Board Statement
Informed Consent Statement
Data Availability Statement
Acknowledgments
Conflicts of Interest
References
- Nova, Z.; Skovierova, H.; Calkovska, A. Alveolar-capillary membrane-related pulmonary cells as a target in endotoxin-induced acute lung injury. Int. J. Mol. Sci. 2019, 20, 831. [Google Scholar] [CrossRef] [PubMed] [Green Version]
- Lavin, K.M.; Straub, A.M.; Uhranowsky, K.A.; Smoliga, J.M.; Zavorsky, G.S. Alveolar-membrane diffusing capacity limits performance in Boston marathon qualifiers. PLoS ONE 2012, 7, e44513. [Google Scholar] [CrossRef] [Green Version]
- Klabukov, I.D.; Krasilnikova, O.A.; Baranovskii, D.S. Quantitative human physiology: An introduction guide for advanced tissue engineering. Biotechnol. J. 2022, 17, 2100481. [Google Scholar] [CrossRef] [PubMed]
- Wilson, H.K. Breath analysis. Physiological basis and sampling techniques. Scand. J. Work Environ. Health 1986, 12, 174–192. [Google Scholar] [CrossRef] [PubMed]
- Xi, J.; Talaat, M. Nanoparticle deposition in rhythmically moving acinar models with interalveolar septal apertures. Nanomaterials 2019, 9, 1126. [Google Scholar] [CrossRef] [PubMed] [Green Version]
- Al-Ashkar, F.; Mehra, R.; Mazzone, P.J. Interpreting pulmonary function tests: Recognize the pattern, and the diagnosis will follow. Cleve. Clin. J. Med. 2003, 70, 866–881. [Google Scholar] [CrossRef] [Green Version]
- Frija-Masson, J.; Bancal, C.; Plantier, L.; Benzaquen, H.; Mangin, L.; Penaud, D.; Arnoult, F.; Flamant, M.; d’Ortho, M.P. Alteration of diffusion capacity after SARS-CoV-2 infection: A pathophysiological approach. Front. Physiol. 2021, 12, 624062. [Google Scholar] [CrossRef]
- Si, X.; Xi, J.S.; Talaat, M.; Donepudi, R.; Su, W.-C.; Xi, J. Evaluation of impulse oscillometry in respiratory airway casts with varying obstruction phenotypes, locations, and complexities. J. Respir. 2022, 2, 44–58. [Google Scholar] [CrossRef]
- Yuan, J.; Chiofolo, C.M.; Czerwin, B.J.; Karamolegkos, N.; Chbat, N.W. Alveolar tissue fiber and surfactant effects on lung mechanics-model development and validation on ARDS and IPF patients. IEEE Open J. Eng. Med. Biol. 2021, 2, 44–54. [Google Scholar] [CrossRef]
- Ledford, H.; Callaway, E. Biologists who decoded how cells sense oxygen win medicine Nobel. Nature 2019, 574, 161–162. [Google Scholar] [CrossRef]
- Forouzan, O.; Yang, X.; Sosa, J.M.; Burns, J.M.; Shevkoplyas, S.S. Spontaneous oscillations of capillary blood flow in artificial microvascular networks. Microvasc. Res. 2012, 84, 123–132. [Google Scholar] [CrossRef] [PubMed]
- Darquenne, C.; Harrington, L.; Prisk, G.K. Alveolar duct expansion greatly enhances aerosol deposition: A three-dimensional computational fluid dynamics study. Philos. Trans. A Math. Phys. Eng. Sci. 2009, 367, 2333–2346. [Google Scholar] [CrossRef] [PubMed] [Green Version]
- Hajari, A.J.; Yablonskiy, D.A.; Quirk, J.D.; Sukstanskii, A.L.; Pierce, R.A.; Deslée, G.; Conradi, M.S.; Woods, J.C. Imaging alveolar-duct geometry during expiration via ³He lung morphometry. J. Appl. Physiol. 2011, 110, 1448–1454. [Google Scholar] [CrossRef] [PubMed] [Green Version]
- Xi, J.; Talaat, M.; Si, X.A.; Han, P.; Dong, H.; Zheng, S. Alveolar size effects on nanoparticle deposition in rhythmically expanding-contracting terminal alveolar models. Comput. Biol. Med. 2020, 121, 103791. [Google Scholar] [CrossRef]
- Talaat, K.; Xi, J. Computational modeling of aerosol transport, dispersion, and deposition in rhythmically expanding and contracting terminal alveoli. J. Aerosol Sci. 2017, 112, 19–33. [Google Scholar] [CrossRef]
- Talaat, M.; Si, X.; Tanbour, H.; Xi, J. Numerical studies of nanoparticle transport and deposition in terminal alveolar models with varying complexities. Med One 2019, 4, e190018. [Google Scholar]
- Si, X.; Talaat, M.; Xi, J. SARS COV-2 virus-laden droplets coughed from deep lungs: Numerical quantification in a single-path whole respiratory tract geometry. Phy. Fluids 2021, 33, 023306. [Google Scholar]
- Talaat, M.; Si, X.A.; Xi, J. Lower inspiratory breathing depth enhances pulmonary delivery efficiency of proair sprays. Pharmaceuticals 2022, 15, 706. [Google Scholar] [CrossRef]
- Pittman, R.N. Regulation of Tissue Oxygenation. In San Rafael (CA): Regulation of Tissue Oxygenation; Morgan & Claypool Publishers: Kentfield, CA, USA, 2011. [Google Scholar]
- Dunn, J.-O.; Mythen, M.; Grocott, M. Physiology of oxygen transport. BJA Educ. 2016, 16, 341–348. [Google Scholar] [CrossRef] [Green Version]
- Zanen, P.; van der Lee, I.; van der Mark, T.; van den Bosch, J.M.M. Reference values for alveolar membrane diffusion capacity and pulmonary capillary blood volume. Eur. Respir. J. 2001, 18, 764–769. [Google Scholar] [CrossRef] [Green Version]
- Wilson, R.H.; Evans, R.L.; Johnson, R.S.; Dempsey, M.E. An estimation of the effective alveolar respiratory surface and other pulmonary properties in normal persons. Am. Rev. Tuberc. 1954, 70, 296–303. [Google Scholar] [PubMed]
- Huang, C.; Chambers, D.; Matthews, G. Alveolar diffusion. In Basic Physiology for Anaesthetists; Huang, C., Chambers, D., Matthews, G., Eds.; Cambridge University Press: Cambridge, UK, 2015; pp. 40–44. [Google Scholar]
- Beretta, E.; Grasso, G.S.; Forcaia, G.; Sancini, G.; Miserocchi, G. Differences in alveolo-capillary equilibration in healthy subjects on facing O2 demand. Sci. Rep. 2019, 9, 16693. [Google Scholar] [CrossRef] [PubMed]
- Park, J.O.; Choi, I.S.; Park, K.O. Normal predicted values of single-breath diffusing capacity of the lung in healthy nonsmoking adults. Korean J. Intern Med. 1986, 1, 178–184. [Google Scholar] [CrossRef] [PubMed]
- Munkholm, M.; Marott, J.L.; Bjerre-Kristensen, L.; Madsen, F.; Pedersen, O.F.; Lange, P.; Nordestgaard, B.G.; Mortensen, J. Reference equations for pulmonary diffusing capacity of carbon monoxide and nitric oxide in adult Caucasians. Eur. Respir. J. 2018, 52, 1500677. [Google Scholar] [CrossRef] [Green Version]
- Rummer, J.L.; Brauner, C.J. Root effect haemoglobins in fish may greatly enhance general oxygen delivery relative to other vertebrates. PLoS ONE 2015, 10, e0139477. [Google Scholar] [CrossRef] [Green Version]
- MacDougall, J.D.; McCabe, M. Diffusion coefficient of oxygen through tissues. Nature 1967, 215, 1173–1174. [Google Scholar] [CrossRef]
- Zimmerman, R.A.; Tsai, A.G.; Intaglietta, M.; Tartakovsky, D.M. A mechanistic analysis of possible blood transfusion failure to increase circulatory oxygen delivery in anemic patients. Ann. Biomed. Eng. 2019, 47, 1094–1105. [Google Scholar] [CrossRef]
- Xi, J.; Kim, J.; Si, X.A.; Corley, R.A.; Zhou, Y. Modeling of inertial deposition in scaled models of rat and human nasal airways: Towards in vitro regional dosimetry in small animals. J. Aerosol Sci. 2016, 99, 78–93. [Google Scholar] [CrossRef]
- Xi, J.; Si, X.; Kim, J.; Zhang, Y.; Jacob, R.E.; Kabilan, S.; Corley, R.A. Anatomical details of the rabbit nasal passages and their implications in breathing, air conditioning, and olfaction. Anat. Rec. 2016, 299, 853–868. [Google Scholar] [CrossRef] [Green Version]
- Horimoto, M.; Koyama, T.; Mishina, H.; Asakura, T.; Murao, M. Blood flow velocity in pulmonary microvessels of bullfrog. Respir. Physiol. 1979, 37, 45–59. [Google Scholar] [CrossRef]
- Razavi, M.S.; Shirani, E.; Kassab, G.S. Scaling laws of flow rate, vessel blood volume, lengths, and transit times with number of capillaries. Front. Physiol. 2018, 9, 581. [Google Scholar] [CrossRef] [PubMed]
- Czerwin, B.; Patel, S.; Chiofolo, C.; Yuan, J.; Chbat, N. Modeling the steady-state effects of mean arterial pressure on the kidneys. IEEE Open J. Eng. Med. Biol. 2020, 2, 1–10. [Google Scholar] [CrossRef] [PubMed]
- Hayano, J.; Yasuma, F.; Okada, A.; Mukai, S.; Fujinami, T. Respiratory sinus arrhythmia. A phenomenon improving pulmonary gas exchange and circulatory efficiency. Circulation 1996, 94, 842–847. [Google Scholar] [CrossRef]
- Hyde, R.W.; Forster, R.E.; Power, G.G.; Nairn, J.; Rynes, R. Measurement of O2 diffusing capacity of the lungs with a stable O2 isotope. J. Clin. Investig. 1966, 45, 1178–1193. [Google Scholar] [CrossRef] [PubMed]
- Richardson, S.L.; Swietach, P. Red blood cell thickness is evolutionarily constrained by slow, hemoglobin-restricted diffusion in cytoplasm. Sci. Rep. 2016, 6, 36018. [Google Scholar] [CrossRef] [PubMed] [Green Version]
- Butler, J.P.; Tsuda, A. Transport of gases between the environment and alveoli--theoretical foundations. Compr. Physiol. 2011, 1, 1301–1316. [Google Scholar]
- Zhang, Q.; Yan, Q.; Yang, H.; Wei, W. Oxygen sensing and adaptability won the 2019 Nobel Prize in Physiology or medicine. Genes Dis. 2019, 6, 328–332. [Google Scholar] [CrossRef]
- Yu, M.; Sandhu, V.K.; Lezcano, S.D.; Maken, K.; Kirk, S.; Torralba, K.D. Sarcoidosis and systemic sclerosis: Strange bedfellows. Case Rep. Rheumatol. 2017, 2017, 7851652. [Google Scholar] [CrossRef] [Green Version]
- Cottin, V.; Hirani, N.A.; Hotchkin, D.L.; Nambiar, A.M.; Ogura, T.; Otaola, M.; Skowasch, D.; Park, J.S.; Poonyagariyagorn, H.K.; Wuyts, W.; et al. Presentation, diagnosis and clinical course of the spectrum of progressive-fibrosing interstitial lung diseases. Eur. Respir. Rev. 2018, 27, 180076. [Google Scholar] [CrossRef] [Green Version]
- Solomon, J.J.; Olson, A.L.; Fischer, A.; Bull, T.; Brown, K.; Raghu, G. Scleroderma lung disease. Eur. Respir. Rev. 2013, 22, 6–19. [Google Scholar] [CrossRef]
- Eklund, A.; Broman, L.; Broman, M.; Holmgren, A. V/Q and alveolar gas exchange in pulmonary sarcoidosis. Eur. Respir. J. 1989, 2, 135–144. [Google Scholar] [PubMed]
- Cottin, V.; Brown, K.K. Interstitial lung disease associated with systemic sclerosis (SSc-ILD). Respir. Res. 2019, 20, 13. [Google Scholar] [CrossRef] [PubMed]
- Xi, J.; Si, X.; Dong, H.; Zhong, H. Effects of glottis motion on airflow and energy expenditure in a human upper airway model. Eur. J. Mech. B 2018, 72, 23–37. [Google Scholar] [CrossRef]
- Chan, E.D.; Chan, M.M.; Chan, M.M. Pulse oximetry: Understanding its basic principles facilitates appreciation of its limitations. Respir. Med. 2013, 107, 789–799. [Google Scholar] [CrossRef] [Green Version]
- Petersson, J.; Glenny, R.W. Gas exchange and ventilation–perfusion relationships in the lung. Eur. Respir. J. 2014, 44, 1023–1041. [Google Scholar] [CrossRef] [Green Version]
- O’Driscoll, B.R.; Howard, L.S.; Davison, A.G. BTS guideline for emergency oxygen use in adult patients. Thorax 2008, 63, vi1–vi68. [Google Scholar] [CrossRef] [Green Version]
- Neder, J.A.; Kirby, M.; Santyr, G.; Pourafkari, M.; Smyth, R.; Phillips, D.B.; Crinion, S.; de-Torres, J.P.; O’Donnell, D.E. V/Q mismatch: A novel target for COPD treatment. Chest 2022, in press.
- Rodriguez-Roisin, R. Pulmonary gas exchange in acute respiratory failure. Eur. J. Anaesthesiol. 1994, 11, 5–13. [Google Scholar]
- Karbing, D.S.; Panigada, M.; Bottino, N.; Spinelli, E.; Protti, A.; Rees, S.E.; Gattinoni, L. Changes in shunt, ventilation/perfusion mismatch, and lung aeration with PEEP in patients with ARDS: A prospective single-arm interventional study. Crit. Care 2020, 24, 111. [Google Scholar] [CrossRef] [Green Version]
- Schaffartzik, W.; Poole, D.C.; Derion, T.; Tsukimoto, K.; Hogan, M.C.; Arcos, J.P.; Bebout, D.E.; Wagner, P.D. VA/Q distribution during heavy exercise and recovery in humans: Implications for pulmonary edema. J. Appl. Physiol. 1992, 72, 1657–1667. [Google Scholar] [CrossRef]
- Conhaim, R.L.; Rodenkirch, L.A. Functional diameters of alveolar microvessels at high lung volume in zone II. J. Appl. Physiol. 1998, 85, 47–52. [Google Scholar] [CrossRef] [PubMed]
- Xi, J.; Talaat, K.; Si, X. Deposition of bolus and continuously inhaled aerosols in rhythmically moving terminal alveoli. J. Comput. Multiphase Flow 2018, 10, 178–193. [Google Scholar] [CrossRef]
- Xi, J.; Talaat, M.; Tanbour, H.; Talaat, K. Airflow and particle deposition in acinar models with interalveolar septal walls and different alveolar numbers. Comput. Math. Methods Med. 2018, 2018, 3649391. [Google Scholar] [CrossRef]
- De Paepe, M.E.; Mao, Q.; Powell, J.; Rubin, S.E.; DeKoninck, P.; Appel, N.; Dixon, M.; Gundogan, F. Growth of pulmonary microvasculature in ventilated preterm infants. Am. J. Respir. Crit. Care. Med. 2006, 173, 204–211. [Google Scholar] [CrossRef] [Green Version]
- Guazzi, M. Alveolar-capillary membrane dysfunction in heart failure: Evidence of a pathophysiologic role. Chest 2003, 124, 1090–1102. [Google Scholar] [CrossRef]
- Puri, S.; Baker, B.L.; Dutka, D.P.; Oakley, C.M.; Hughes, J.M.B.; Cleland, J.G.F. Reduced alveolar-capillary membrane diffusing capacity in chronic heart failure. Circulation 1995, 91, 2769–2774. [Google Scholar] [CrossRef]
- Ahlfeld, S.K.; Conway, S.J. Assessment of inhibited alveolar-capillary membrane structural development and function in bronchopulmonary dysplasia. Birth. Defects. Res. A Clin. Mol. Teratol. 2014, 100, 168–179. [Google Scholar] [CrossRef] [PubMed] [Green Version]
- Malte, H.; Lykkeboe, G. The Bohr/Haldane effect: A model-based uncovering of the full extent of its impact on O2 delivery to and CO2 removal from tissues. J. Appl. Physiol. 2018, 125, 916–922. [Google Scholar] [CrossRef]


Publisher’s Note: MDPI stays neutral with regard to jurisdictional claims in published maps and institutional affiliations. |
© 2022 by the authors. Licensee MDPI, Basel, Switzerland. This article is an open access article distributed under the terms and conditions of the Creative Commons Attribution (CC BY) license (https://creativecommons.org/licenses/by/4.0/).
Share and Cite
Si, X.A.; Xi, J. Pulmonary Oxygen Exchange in a Rhythmically Expanding–Contracting Alveolus–Capillary Model. J. Respir. 2022, 2, 159-173. https://doi.org/10.3390/jor2040015
Si XA, Xi J. Pulmonary Oxygen Exchange in a Rhythmically Expanding–Contracting Alveolus–Capillary Model. Journal of Respiration. 2022; 2(4):159-173. https://doi.org/10.3390/jor2040015
Chicago/Turabian StyleSi, Xiuhua April, and Jinxiang Xi. 2022. "Pulmonary Oxygen Exchange in a Rhythmically Expanding–Contracting Alveolus–Capillary Model" Journal of Respiration 2, no. 4: 159-173. https://doi.org/10.3390/jor2040015