Article

Epidemiological Characteristics of COVID-19 Inpatient Deaths during the First and Second Waves in Limpopo Province, South Africa

by
Takalani G. Tshitangano
1,*,
Musa E. Setati
2,3,
Peter M. Mphekgwana
4,
Naledzani J. Ramalivhana
5 and
Sogo F. Matlala
6
1
Department of Public Health, University of Venda, Thohoyandou 0950, South Africa
2
Department of Health, Polokwane 0700, South Africa
3
Department of Public Health Medicine, University of Limpopo, Sovenga, Polokwane 0727, South Africa
4
Department of Pharmacy, University of Limpopo, Sovenga, Polokwane 0727, South Africa
5
Research Administration and Development, University of Limpopo, Sovenga, Polokwane 0727, South Africa
6
Department of Public Health, University of Limpopo, Sovenga, Polokwane 0727, South Africa
*
Author to whom correspondence should be addressed.
J. Respir. 2022, 2(2), 111-122; https://doi.org/10.3390/jor2020009
Submission received: 4 April 2022 / Revised: 24 May 2022 / Accepted: 26 May 2022 / Published: 10 June 2022

Abstract

:
More COVID-19 inpatient deaths occurred during the second wave when compared to the first wave in South Africa in both the public and private sectors. This study describes the characteristics of 969 COVID-19 inpatient deaths in the public sector of Limpopo Province during the first and second waves using population-based retrospective design. The results indicate that about 84% of deaths were aged 50+ years; 53.6% were females; 43% occurred in Capricorn district; 56% occurred in PUI wards; 64% had hypertension followed by diabetes mellitus; 88% manifested with shortness of breaths/respiratory distress on admission. The study concludes that as the average age among the population aged 60+ was greater among females than males, the increased death among females compared to males might be influenced by the older age of female inpatients during the first and second waves in Limpopo Province. Some COVID-19 inpatient deaths are possibly preventable if older women may be taken into consideration when planning prevention and management interventions in future pandemics.

1. Introduction

The SARS-CoV-2 virus causing COVID-19 disease was first discovered from the Wuhan seafood market in 2019 [1]. On 30 January 2020, the World Health Organization (WHO) declared that this SARS-CoV-2 outbreak was a Public Health Emergency of global concern, when more than 80,000 confirmed cases had been reported worldwide [2]. By then, twelve countries, namely, the United States of America, India, Brazil, the Russian Federation, France, Spain, the United Kingdom, Italy, Argentina, Columbia, Mexico, and Germany, had contributed more than 66% of the total confirmed cases globally, with the first four being the worst affected [3]. Daily confirmed COVID-19 deaths during the first and second waves in the top ten nations stood at 2272:1187 (USA), India (1170:4684), Brazil (1081:3125), Russia (178:567), France (975:667), UK (944:1250), Turkey (122:256), Argentina (407:601), Colombia (324:391), and Italy (817:741). The USA ranked first in deaths during the first wave followed by India and Brazil [3]. In Spain, an average total of 49 daily confirmed deaths occurred during the first wave and 35 during the second wave [3]. The patients who died in the second wave were older than those in the first wave (83 ± 10 vs. 78 ± 13 years; p = 0.042). The global mortality as of 31 December 2020 stood at 1 813 188 [4]. As of 21 July 2021, there were 4.13 million deaths worldwide due to COVID-19. From 5 March 2020 to 27 March 2021, a total of 1 545 431 SARS-CoV-2 cases and 227 932 COVID-19 hospital admissions were reported in South Africa [5].
Though South Africa experienced its first case on 5 March 2020, according to the DATCOV (which is the South African national active surveillance system for COVID-19 admissions to hospital), South Africa’s first wave started on epidemiological week 24 and ended on week 34 of 2020. The second wave started on epidemiological week 47 of 2020 and ended on week 5 of 2021 [6]. This is according to the National Institute of Communicable Diseases (NICD) definition of a wave, stating that it is the period from when COVID-19 weekly incidence is equal to or greater than 30 cases per 100,000 persons until the weekly incidence is equal or below 30 cases per 100,000 persons. However, since every South African province experienced its 30 cases per 100,000 persons at different times. In Limpopo province, the first wave started on 16 March 2020 and ended on 31 October 2020; whereas the second wave started on 1 November 2020 and ended on 31 March 2021 [7]. At that time, the public sector’s COVID-19 inpatient case fatality rate in Limpopo province was 27.1%, which was higher than SA’s average of 25.8% [8]. Table 1 below describes the South African and Limpopo COVID-19 data during the first and second waves.
Limpopo province ranks fifth in South Africa in both surface area and population, covering an area of 125,754 km² and being home to a population of 5,926,724 [9]. The province is made up of 2.6% white and 97.4% black (comprised of 52.9% Northern Sotho speaking, 17% Tsonga speaking and 16.7% Tshivenda speaking) people [9]. The province population is made up of 51.3% females and 48.7% males. Among those from the ages of 0–29 years, there are more males than females. This province is divided into five districts, namely, Vhembe, Mopani, Capricon, Waterberg, and Sekhukhune. About 90% of the population in this province lives in rural areas.
The analysis of COVID-19 inpatient deaths may highlight characteristics that require a more targeted approach for intervention to minimize hospitalizations and fatalities with subsequent waves. Maslo, et al. [10] described the characteristics and outcomes of privately hospitalized patients in SA’s Netcare hospital during the Omicron wave compared with previous ones. The Western Cape Provincial Department of Health [11] in South Africa examined the association between HIV, TB, and COVID-19 deaths adjusted for age, gender, location, and comorbidity. This study describes the characteristics of all COVID-19 inpatient deaths that occurred in public hospitals of Limpopo province since the first COVID-19 case was identified on 16 March 2020 until 31 March 2021 (first and second waves). COVID-19 inpatient deaths in this study refer to death that occurred to a patient with confirmed COVID-19 laboratory results admitted in any hospital unit/ward and was recorded on DATCOV in Limpopo province during the first and second waves [12]. For the period 16 March 2020 to 31 March 2021 (first and second waves), there were 9080 patients admitted in Limpopo province’s 41 public (4720) and 7 private (4360) hospitals.
All patients with confirmed COVID-19 laboratory results admitted in hospitals of Limpopo province are captured by ward clerks on DATCOV, which is a sentinel hospital surveillance system initiated by the NICD on 1 April 2020 to capture all COVID-19 infections, admissions, and deaths in South Africa. To collect the mortality audit data, each hospital audit team (comprised of a doctor who managed patients in the COVID-19 ward; a professional nurse from medical/COVID-19 ward; infection prevention and control nurse; patients’ records representative; health information representative; data capture and employee responsible for capturing and reporting of cases on DATCOV) compiled a list of all COVID-19 positive deaths from the DATACOV (2517). The files of identified COVID-19 inpatients deaths were retrieved by the record clerks from each of the 41 hospitals of the province. These hospitals are categorized into 31 district hospitals, 5 regional hospitals, 2 tertiary hospitals, and 3 specialized hospitals. About 958 deaths that occurred at homes and in the private sector were excluded because of logistic and protocol problems. About 314 files with missing information were also excluded to avoid a hidden or non-response bias in the results.
Each hospital audit team served as data abstractors and were trained on how to use the data abstraction mortality audit instrument and the accompanying protocols and guidelines. The trainers were the WHO provincial audit team members. Training lasted for two weeks from 23 to 30 April 2021. To minimize subjectivity in classification in relation the study’s aims, data abstractors remained blind to the aims of the mortality audit. Inter-rater reliability of both the data abstraction instrument and the individual data abstractors was accomplished through a pilot investigation, which took place during training, and random checks that were performed unannounced by the provincial mortality audit team during data abstraction process. Data extraction took place from 7 to 14 May 2021. Thus, the hospital audit team at each of the 41 hospitals conducted a retrospective chart review of each identified COVID-19 inpatient death file, which had complete information. The Provincial mortality audit team served as an independent adjudication committee for consultations and random checks. Two trained abstractors collected information from the same file onto a paper/word-based mortality audit tool to ensure interrater reliability. The mortality audit instrument comprised of seven sections, namely, facility details, demographic characteristics, clinical information, physical examination on admission, oxygen requirement during hospitalization, diagnosis on admission, and hospital outcome. Data captured by the two abstractors were compared for similarities, and amendments were made, where discrepancies were found. Trained data capturers in each hospital transferred the mortality audit information from paper/word-based mortality audit tool onto a standardized electronic excel spreadsheet. The mortality audit information on the Excel spread sheet from each hospital was submitted to the district mortality audit leader, who in turn compiled and submitted one district mortality audit information to the Limpopo Provincial Department of Health (LPDoH). The provincial audit team (comprised of a provincial public health specialist, an NICD epidemiologist, two WHO public health specialists, and a Cuban brigade biostatistician) collated the districts mortality audit information and cleaned and consolidated such information into one Limpopo province mortality audit data. These data are kept by the LPDoH, which the current study analyzed.

2. Materials and Methods

This study used secondary data kept by the LPDoH. Ethical issues and permission to access the data are described in the published protocol [13]. Only 969 records of these data were analyzed using a quantitative retrospective population-based design [6], as 314 records had missing information. Thus, no sampling was required, as the study used total population of COVID-19 inpatients records with complete information. Of the 969 records with complete information, Waterberg district contributed 129, Capricorn (359), Vhembe (151), Mopani (181), and Sekhukhune (111).
All data from the COVID-19 mortality audit of inpatient fatalities kept by the Limpopo Department of Health have restricted access to permitted researchers and provincial managers only. All principles of research ethics related to patient’s information were respected in terms of the Protection of Personal Information (POPI) Act of South Africa and the Declaration of Helsinki.
All data analyses for this study were performed using STATA software (Stata 9.0, Stata Corp, College Station, TX, USA) and R software. Characteristics of all COVID-19 inpatient deaths during the first and second waves were expressed as frequencies and percentages, and findings were presented in tables and bar charts.

3. Results

Figure 1 below presents the distribution of COVID-19 inpatient deaths by waves. The figure depicts that the majority (90%, n = 873) of COVID-19 inpatient deaths occurred during the second wave as compared to few (10%, n = 96) during the first wave. The province mortality rate set at 34.8 per 1000 with a case fatality rate of 27.5%.

3.1. COVID-19 Inpatient Deaths by Wave and Age in Limpopo Province

Figure 2 below indicates that most COVID-19 in-patient deaths in Limpopo Province occurred among 60+ years in both waves (59% and 71%, respectively), followed by ages of 50 and 59 years old at 15 and 22%, respectively. Similarly, the case fatality rates in Table 2 shows that in-patients older than 60 years had the highest case fatality rate at 25%, followed by those between the ages of 50 and 59 years at 17%. The case fatality rates of persons below the age of 49 was small, ranging from 2–4%.

3.2. COVD-19 Deaths by Wave and Gender

Regarding gender, Figure 3 below indicates that during the first wave, more (58%) deaths occurred among males compared to females (42%); whereas, during the second wave, more (54%) deaths occurred among females as compared to males (46%) in Limpopo province. The case fatality rate displayed in Table 2 below is in alignment with these findings, showing that females had a high fatality rate (11%) compared to male (8%) during the first and second waves in Limpopo Province.

3.3. COVID-19 Inpatient Deaths by Districts and Wave

Figure 4 below indicates that the majority of COVID-19 inpatient deaths occurred in Capricorn district during the first and second waves (37% and 44%, respectively), followed by Vhembe district at 19% and 25%, respectively. Very few inpatient fatalities occurred in Sekhukhune (n = 54, 8%) and Waterberg (n = 48, 5%) districts. These results are congruent with the overall Limpopo Province COVID-19 inpatient case fatality rate (CFR) per district displayed in Table 2 below, which depicts that, as of 13 March 2021, Capricorn had the highest CFR (4%), followed by Vhembe (3.9%), then Mopani (3.8%), with Waterberg (3.1%) and Sekhukhune (2.5%) having the smallest CFRs.

3.4. COVID-19 Inpatient Deaths by Wards and Wave

Figure 5 below indicates that, during the first and second waves, most of the inpatient deaths in Limpopo Province occurred in PUI wards (51% and 56%, respectively) followed by general wards (39% and 37%, respectively). The ICU experienced a noticeable number of inpatient deaths during the first wave (5%) compared to the second wave (2%).

3.5. COVID-19 Inpatient Deaths by Mechanical Ventilation Use

The results in Table 3 below indicate that of the 969 COVID-19 inpatient deaths, only 59 patients (8%) used mechanical ventilation, the majority (n = 33, 5%) being females when compared to males (n = 26, 3%).

3.6. COVID-19 Inpatient Deaths by Underlying Conditions in Limpopo Province

Data in Table 3 above indicate that the majority (n= 586, 64%) of COVID-19 inpatient deaths occurred among those who were known to have hypertension, followed by diabetes mellitus (n = 450, 52%), HIV/AIDS (n= 141, 19%), and obesity (n = 81, 12%). Few fatalities occurred among TB (n = 37, 5%), asthma (n = 35, 5%), cancer (n = 23, 4%), and COPD (n = 18, 3%).

3.7. COVID-19 Inpatient Deaths by Clinical Manifestations

Table 3 above shows that more in-patient deaths (919, 88%) manifested with respiratory distress symptoms, followed by shortness of breath (714) and cough (650). Again, it is evident that the majority of patients who manifested with respiratory distress were females (53%) compared to males (45%). The gender distribution was similar among those who manifested with shortness of breath and cough. Few patients manifested with anosmia, loss of appetite, and chest pain (65, 65, and 55).

4. Discussion

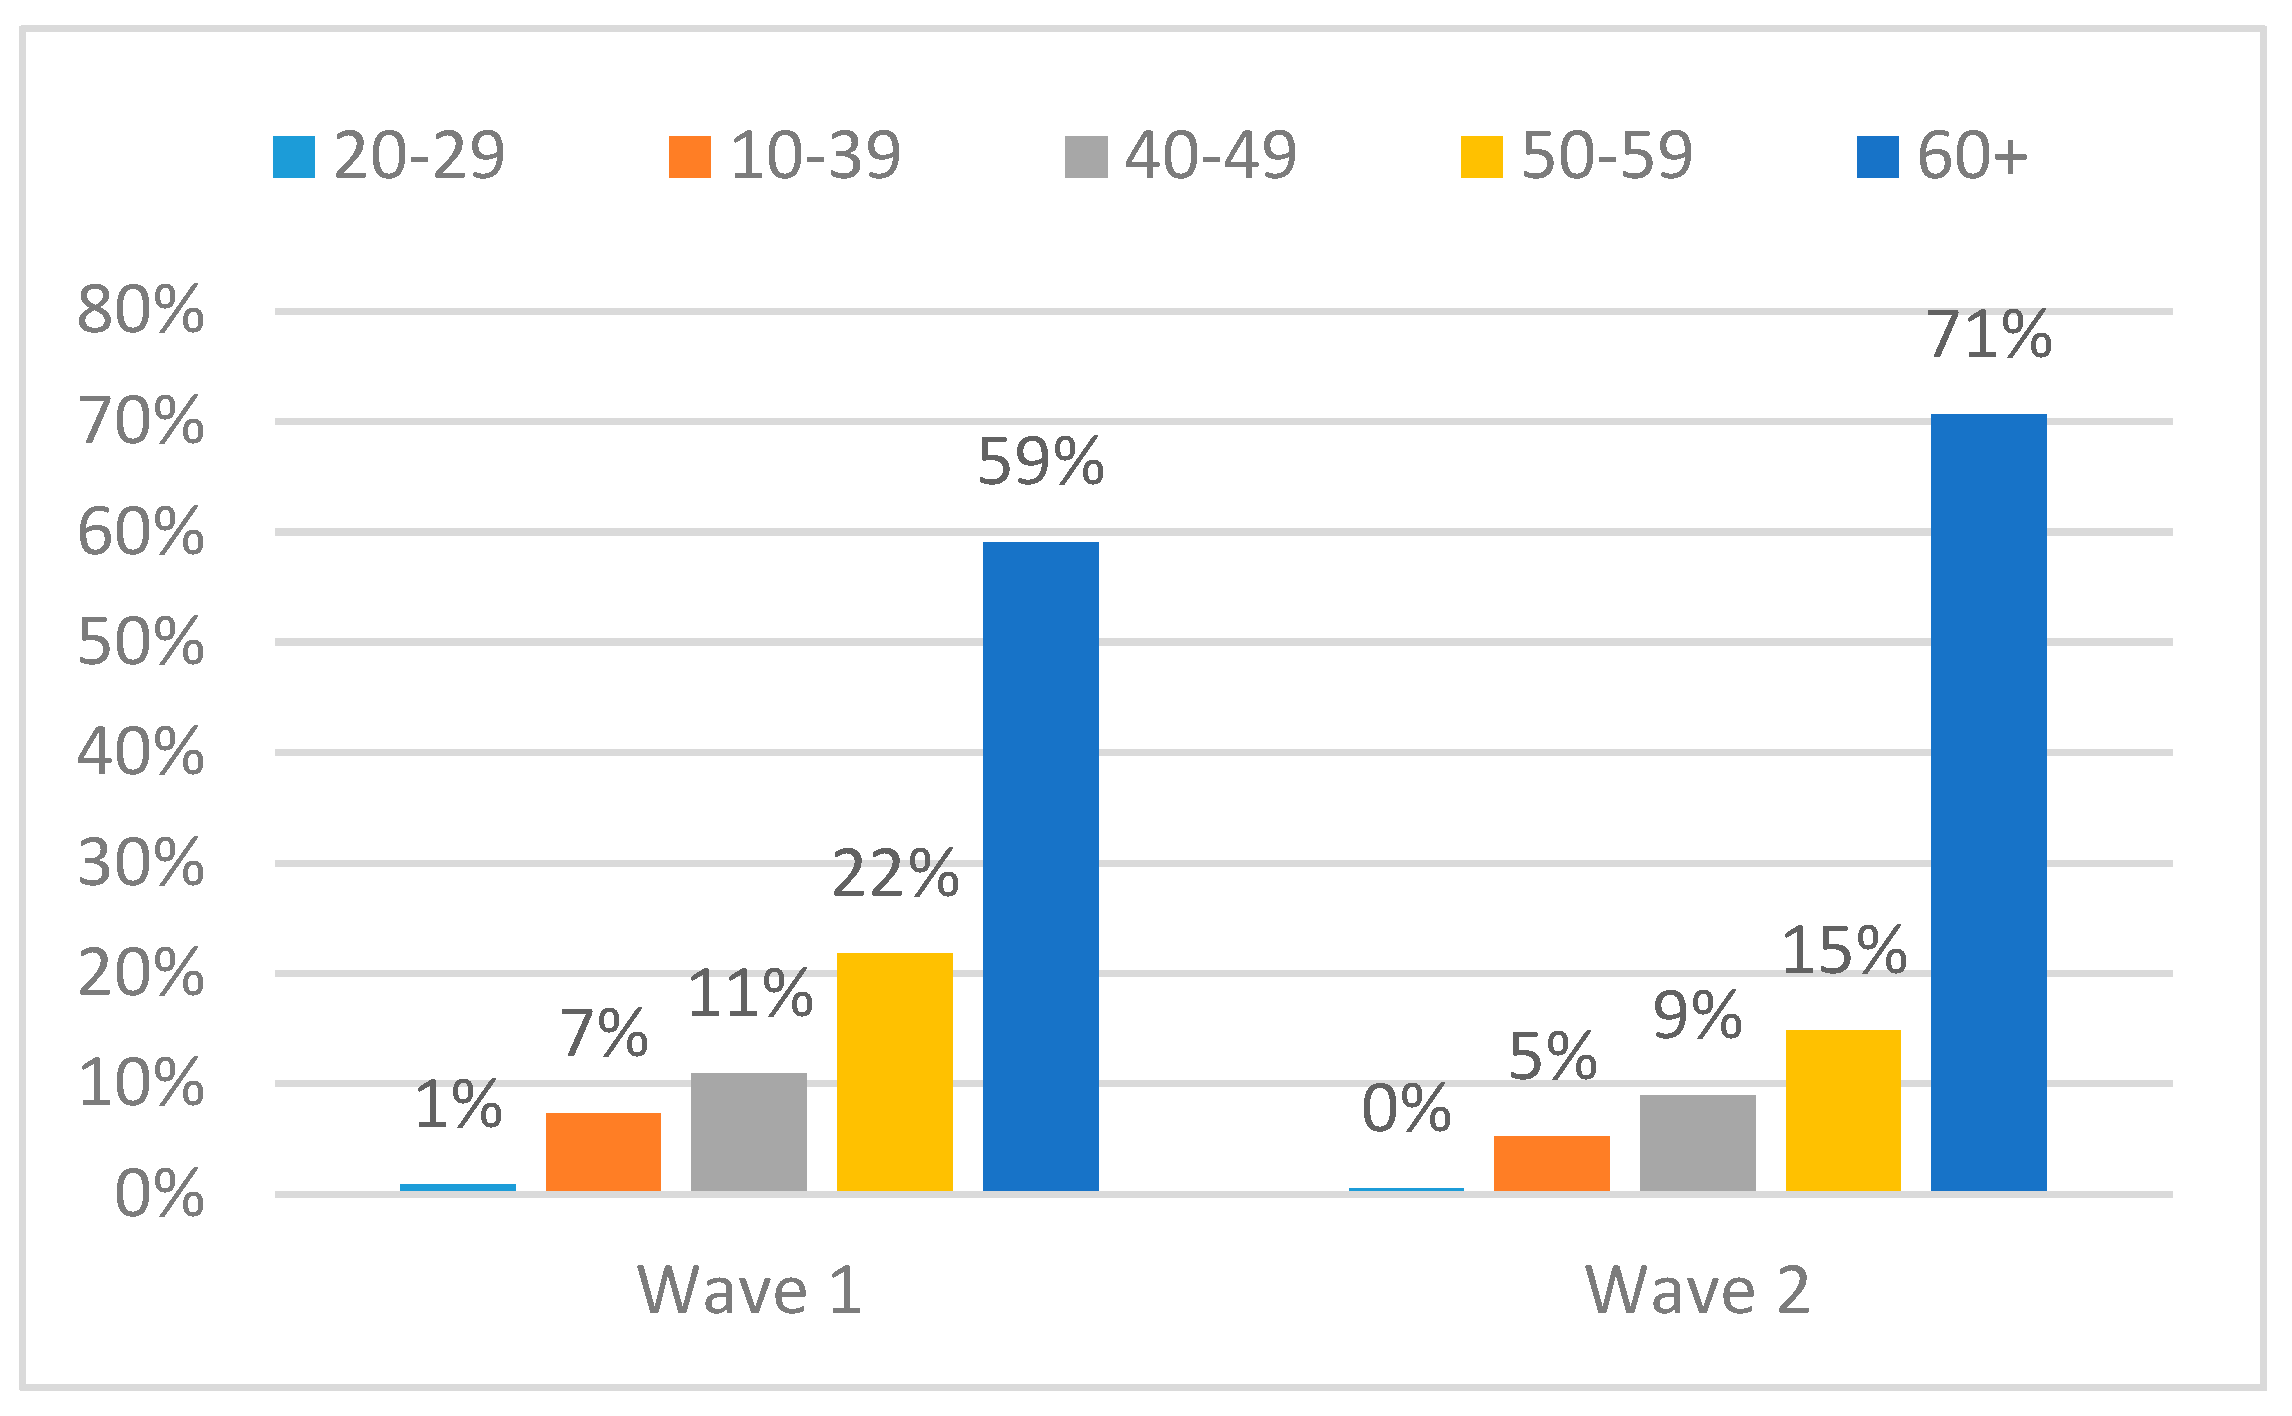
The analysis of the audit data of COVID-19 mortality in public hospitals in Limpopo Province revealed that more inpatient deaths occurred among persons aged 50+ years. Maslo, et al. [10] found similar results at the private hospitals of Netcare group in South Africa. These findings confirm the notion that COVID-19 most commonly affects middle-aged and older adults [14]. The WHO [14] asserts that although all age groups are at risk of contracting COVID-19, older people face significant risk of developing severe illness if they contract the disease due to the physiological changes that come with ageing and the potential underlying health conditions. These results confirm what happened in all United States of America and China, where most COVID-19 deaths occurred among people older than 60 years sliding downwards with fewer deaths occurring among people less than 50 years old [15,16] cited in [17].
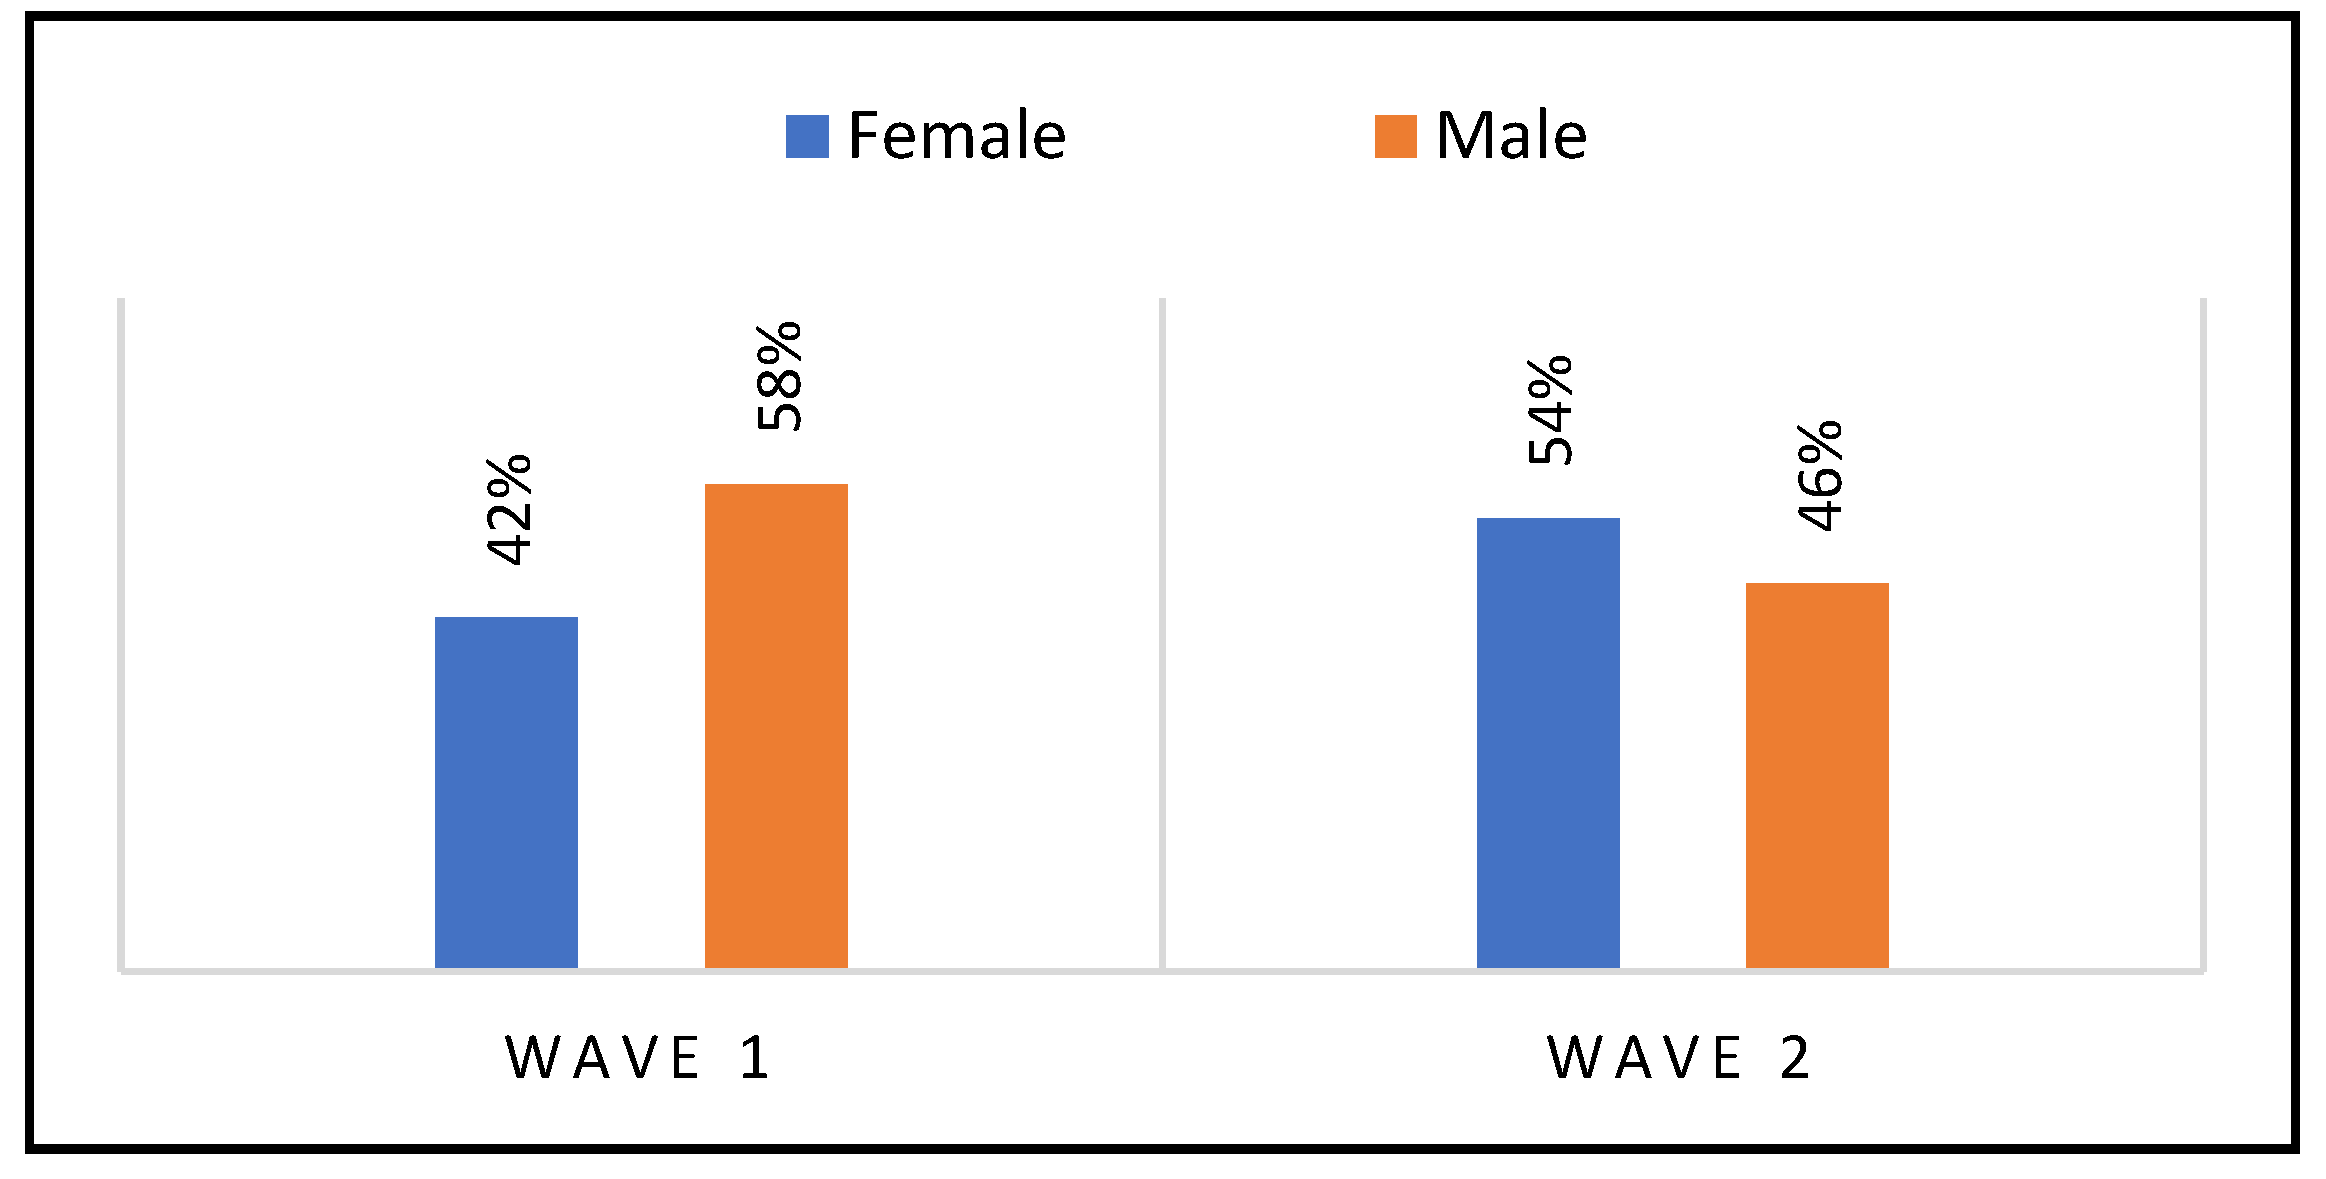
Another key characteristic identified among COVID-19 inpatient deaths in Limpopo was female gender. Maslo, et al. [10] also found similar results at the private hospitals of Netcare group in South Africa. In confirmation, on 5 August 2020 in South Africa, it was established that more females were infected by COVID-19 compared to males [18]. Similarly, on 18 September 2020, there were more confirmed cumulative female COVID-19 cases compared to male cases. Thus, more females between the ages of 40 and 74 years died of COVID-19 compared to males on week 47 in 2020 [19]. These findings are contrary to the South African COVID-19 deaths profile during the first wave. Thus, according to the NICD cited in [18], as of 10/08/2020, death rates among the male population were higher than female ones amongst the older population, increasing from a rate of 0.32 (50–59) to (1.80) 80+ per 1000 population. Similar contrary findings were observed in other countries such as the USA and China [15,16] cited in [17], where the majority of deaths occurred more commonly among males as compared to females [20,21,22].
The discovery that more females died of COVID-19 is supported in this study by the fact that the majority of females used mechanical ventilatory support when compared to males. This is also aligned to the findings presented in preceding sections, which indicate that the majority of inpatient deaths occurred among patients who presented with respiratory distress and shortness of breaths, many of whom were females compared to males. The results are also supported by the fact that the majority were known to have hypertension, many of whom were females compared to males, followed by diabetes mellitus, HIV/AIDS, and obesity. Even when analyzed by district, the majority of COVID-19 deaths during the first and second waves occurred among females as compared to males in Limpopo Province. However, in Waterberg district, the results indicates that more males died of COVID-19 when compared to females. According to the district Health Barometer 2019/2020 [20], all districts studied have a greater female population than male population. According to mid-year population estimates by age and gender in 2019 [23], the South African population has more females than males between the ages of 40 and 80+, as shown in Table 4 below:
Data consolidated by the province have been categorized using the 60+ age class. No other data are available to divide them into plural age classes, e.g., 60–69 and 70+. As the average age among the population aged 60+ was higher among females compared to males (Table 4), the increased deaths among females compared to males might be influenced by the older age of female inpatients. It is therefore hypothesized that more female COVID-19 inpatients deaths in Limpopo province may be aggregated to the population.
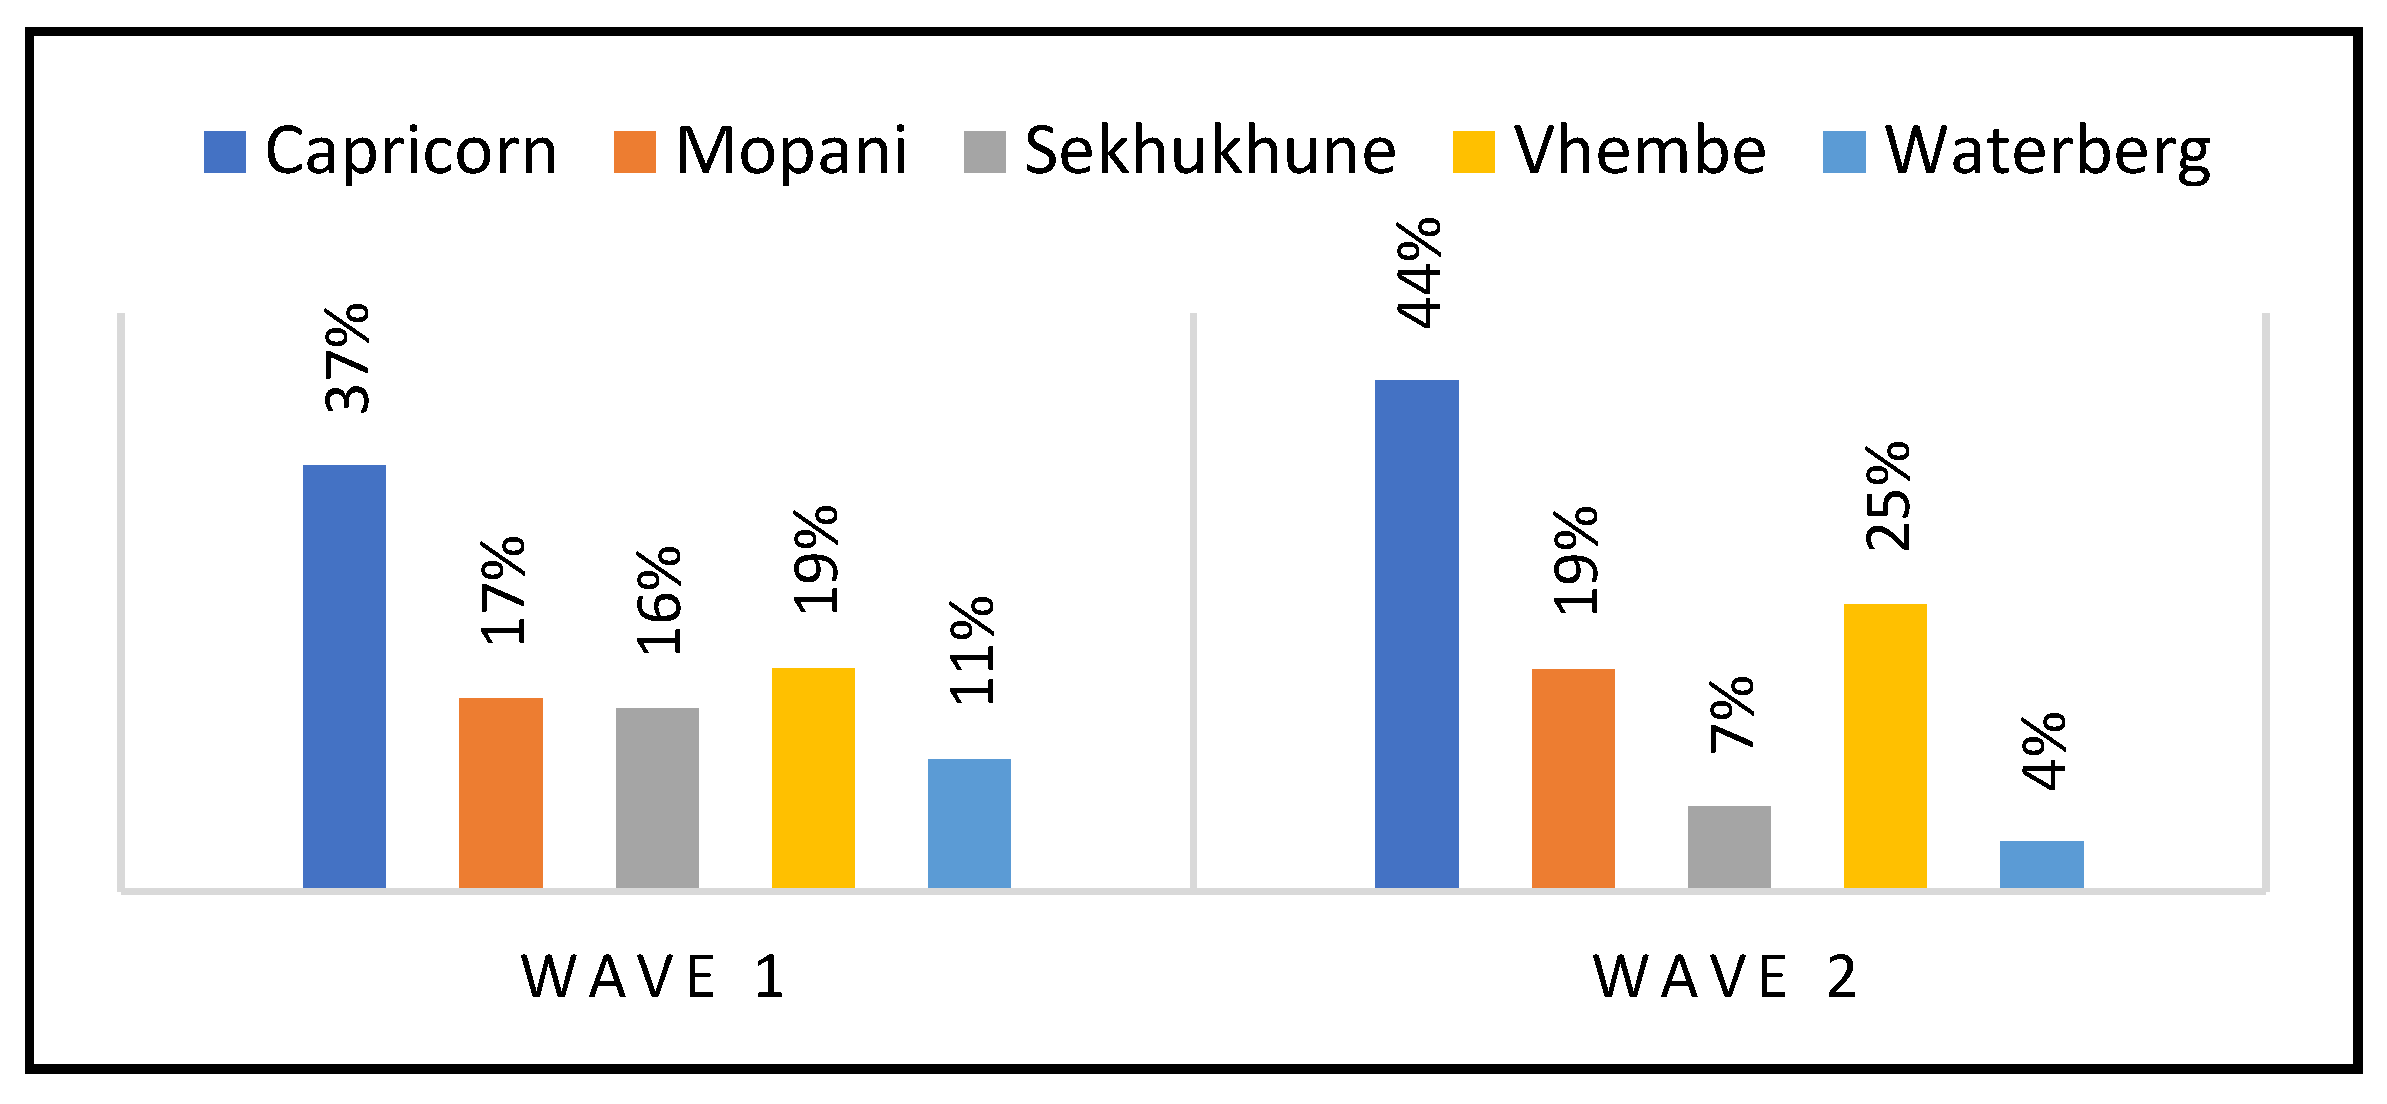
Another key characteristic identified among COVID-19 inpatient deaths was the district where death occurred. This study discovered that Capricorn district experienced the highest deaths when compared with others, with a case fatality rate of 4, followed by Vhembe and Mopani. Waterberg experienced the lowest deaths after Sekhukhune. This is congruent to the fact that Capricorn district experienced more admissions, less of which occurred during the first wave when compared to the second wave [7]. However, it is not clear how Vhembe district experienced the second largest number of COVID-19 deaths when it had the lowest number of admissions. The same goes for Waterberg, which admitted the second largest numbers and yet experienced the lowest COVID-19 deaths. The province attributed these findings to health-seeking behavior as well as risky behaviors [15]. No research identified confounding variables associated with fewer deaths in places with higher admissions, as well as more deaths in places with fewer admissions.
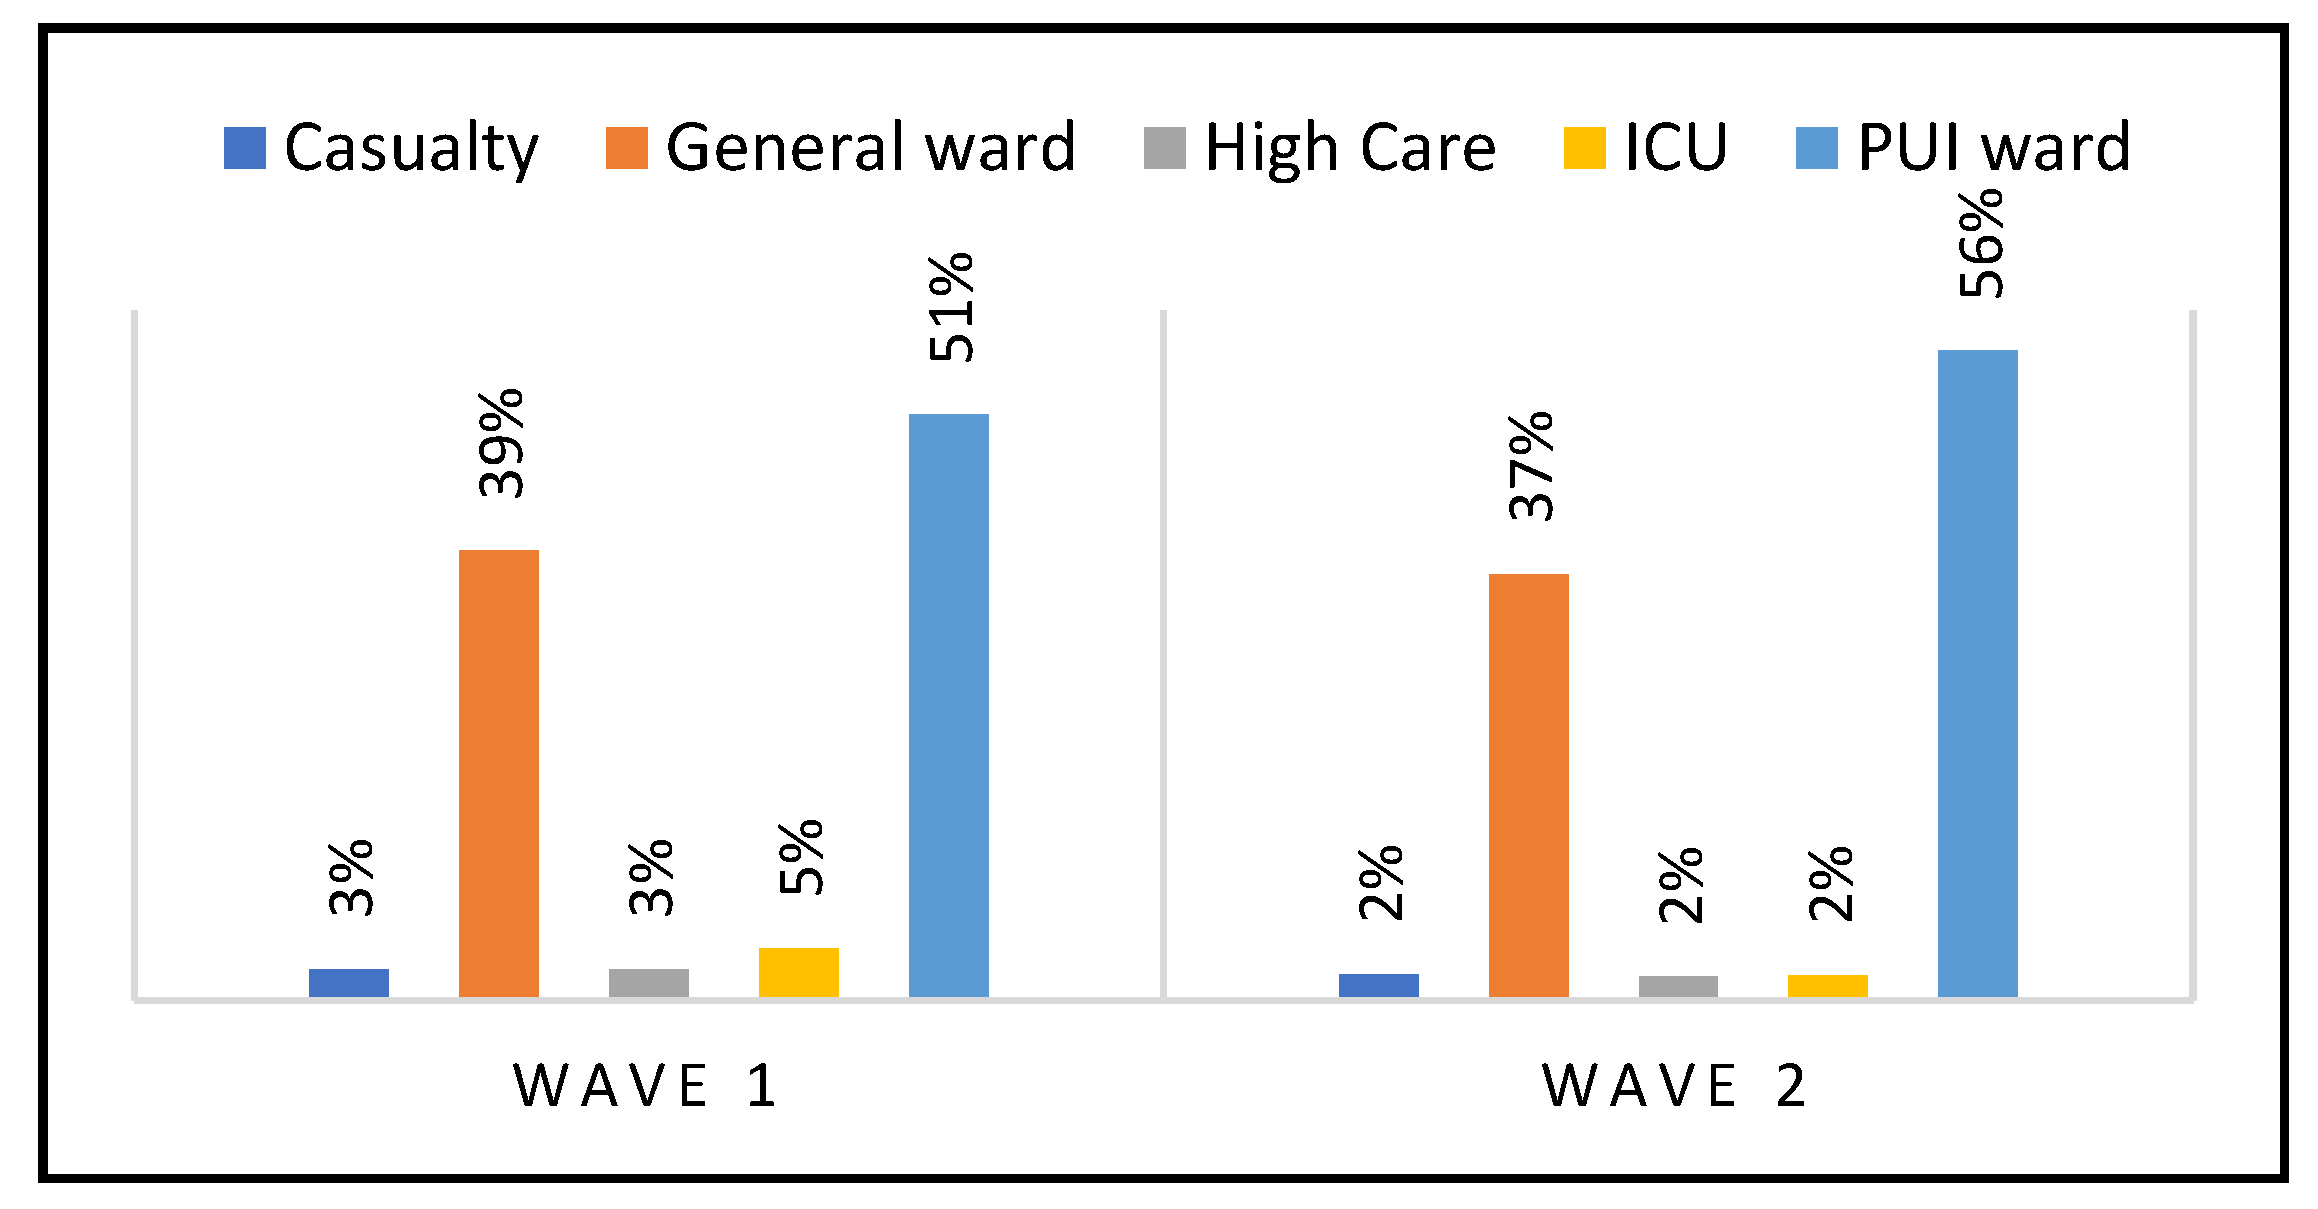
Another key characteristic identified among COVID-19 inpatient deaths was wards where patients were admitted. Most COVID-19 inpatients deaths occurred in Persons Under Investigation (PUI) wards, followed by general wards. Limpopo province had 2210 COVID-19 beds distributed across PUI, general, high care, and intensive care units (ICU) in all hospitals. This means that COVID-19 patients were admitted in these beds. The PUI wards were used to admit those patients who required further investigations to confirm COVID-19 diagnosis. They also needed isolation to contain the virus from spreading [14]. Many patients were admitted in these wards during the first and second waves. Casualty on the other hand is made up of emergency rooms, where all patients are assessed, for decisions to discharge or transfer to general/PUI wards for further management. Thus, patients spend a short duration of time in emergency rooms. High care and ICU wards only admit critical cases that require individualized close medical and nursing attention, as well as mechanical ventilation. Limpopo province had only 185 critical care beds at all regional and tertiary hospitals and 62 high care beds [12]. Data describing the number of inpatients or beds by ward are not available. As the number of beds by wards was not available, the fatality rate could not be compared among wards. Very few cases in Limpopo required mechanical ventilation and were admitted in these wards. It is therefore hypothesized that PUI wards carried increased risk of COVID-19 inpatients deaths, when compared to casualty, high care and ICU in Limpopo province. However, further research is needed to identify factors (health system as well as personal factors) associated with many deaths in PUI and general wards. Grasselli, Cattaneo, Florio et al. [24] found that, in Europe and North America, few (10–20%, depending on age) of the patients admitted to hospital undergo some form of mechanical ventilator support due to acute hypoxemic respiratory failure, either in the ward or in the ICU.
Another key character identified among COVID-19 inpatient deaths was comorbidity with underlying conditions, where most COVID-19 fatalities occurred among those, who were known to have hypertension, followed by diabetes mellitus, HIV/AIDS, and obesity. Maslo, et al. [11] found similar results at the private hospitals of Netcare group in South Africa. According to STATSSA [19], diabetes mellitus followed by cardiovascular disease, hypertension, and other forms of heart conditions were the four leading causes of deaths among women in South Africa in 2017 (Table 5). In addition, STATSSA [22] revealed that most South African women between the ages of 35 and 64 yrs are obese, with BMIs of >50. According to the South African demographic health survey 2016 cited in STATSSA [23], more females suffered from hypertension compared to males. In South Africa in 2017, data show that the proportion of deaths due to non-communicable diseases (e.g., cancer, diabetes, heart disease, and asthma) increased with age. It was relatively low for infants (aged 0) for both sexes and increased remarkably until the age group of 10–14 years and decreased thereafter up until age group of 20–24 years for both sexes. It rose notably at older ages for both sexes (with higher percentages in females) due to the increasing incidence of cancers and cardiovascular diseases as indicated in the Table 6 below.
According to STATSSA [22], a higher prevalence of asthma and obesity were recorded among females, with significant difference between sexes in Limpopo province. Similarly, according to Chiwandire, et al. [25], the odds of hypertension among adults living with HIV were consistently associated with being female and the age group 45 years older across all the survey years in South Africa, whereas increased odds of diabetes were consistently associated with hypertension across all the survey years. These findings are similar to what was discovered among indigenous communities in Mexico, indicating that diabetes was the most found disease among COVID-19 deaths [25]. Similarly, in Italy, of those who succumbed to COVID-19 in hospital, 67 per cent suffered from hypertension, and 31 per cent had type 2 diabetes [26]. According to the CDC [26], having heart conditions such as heart failure, coronary artery disease, cardiomyopathies, and possibly high blood pressure (hypertension) can make one more likely to become very sick from COVID-19. However, the reason why more women suffered from underlying condition may be aggregated to population demographics, as shown in Table 4 above [23], indicating that the population in South Africa among 40–80+ years old is comprised of more females than males.
Another character identified amongst COVID-19 in-patient deaths was the use of chronic medication, where more females were using chronic medication compared to males. The CDC [26] reports that there was a global disruption (Limpopo province included) in healthcare services including NCD diagnosis and treatments in 69 per cent of cases; and that those living with one or more NCDs were among the most likely to become severely ill and die from the new coronavirus.
Presenting with respiratory distress/shortness of breaths was also identified as one of the key characters among COVID-19 in-patient deaths in Limpopo province, where most occurred among patients who presented with respiratory distress and shortness of breaths. Maslo, et al. [10] found similar results at the private hospitals of the Netcare group in South Africa. On the contrary, a study conducted in Saudi Arabia and Kuwait by Alanazi, Alashaikh, Alqurashi, et al. [27], found that the top three symptoms experienced by self-reported patients on tweeter were fever, anosmia, and headache. Zoe’s COVID-19 symptoms study however, indicates that symptoms do evolve over time with the emergence of new variants and vaccine status [28]. According to the Zoe study [29], shortness of breaths/respiratory distress is no longer among the top 5 symptoms of COVID-19 among fully vaccinated, partially vaccinated, and unvaccinated persons. Instead, the top five symptoms include headache, sore throat, runny nose, fever, and persistent cough. This might mean that with the evolvement of COVID-19, fewer deaths might be noticed.
Since this study was using secondary mortality audit data, the limitation is that the authors did not have the actual admission data to calculate fatality rate by gender and age classes. In addition, records/files with missing information were excluded, which might have lost valuable information, influence the findings negatively.

5. Conclusions

In Limpopo Province, more COVID-19 inpatient deaths occurred during the second waves compared to the first, with most occurring among patients with characteristics such as age above 50 years, female gender, comorbidity with underlying conditions, admission in PUI and general wards, shortness of breath/respiratory distress, and use of mechanical ventilation. The study concludes that, as the average age among the population aged 60+ was elder among female compared to male, the increased deaths among females compared to males might be influenced by the older age of female inpatients during the first and second waves in Limpopo Province. It is therefore suggested that some COVID-19 in-patient deaths are possibly preventable if older women may be taken into consideration when planning prevention and management interventions in future pandemics.

Author Contributions

Conceptualization, M.E.S., S.F.M., T.G.T. and N.J.R.; methodology, T.G.T. and M.E.S. software, P.M.M.; validation, P.M.M.; formal analysis, P.M.M., N.J.R. and M.E.S.; resources, M.E.S.; data curation, P.M.M.; writing original draft preparation, T.G.T.; writing review and editing, S.F.M.; project administration, M.E.S. All authors have read and agreed to the published version of the manuscript.

Funding

This research received no external funding.

Institutional Review Board Statement

The study was conducted in accordance with the Declaration of Helsinki and approved by the Institutional Review Board (or Ethics Committee) of the university of Limpopo (protocol code TREC/293/2021: IR-11/2021).

Informed Consent Statement

Not applicable.

Data Availability Statement

Not applicable.

Acknowledgments

Limpopo Provincial Department of Health for granting access to the data.

Conflicts of Interest

The authors declare no conflict of interest.

References

  1. Sarra, P.; Xue, T. COVID-19: An announced pandemic. Cell Death Dis. 2020, 10, 8–13. [Google Scholar]
  2. Mangal, D.; Gupta, D. COVID-19 Pandemic: Complacence in Public Health Response Could be Disastrous. J. Health Manag. 2022, 2, 513–515. [Google Scholar] [CrossRef]
  3. Iftimie, S.; López-Azcona, A.F.; Vallverdú, I.; Hernández-Flix, S.; de Febrer, G.; Parra, S.; Hernández-Aguilera, A.; Riu, F.; Andreychuk, N.; Baiges-Gaya, G.; et al. First and second waves of coronavirus disease-19: A comparative study in hospitalized patients in Reus, Spain. PLoS ONE 2021, 16, e0248029. [Google Scholar] [CrossRef] [PubMed]
  4. World Health Organization. Coronavirus Disease. Data as Received by WHO from National Authorities as of 4 October 2020. Global Epidemiological Situation. 2020. Available online: https://www.who.int/docs (accessed on 26 January 2022).
  5. Jassat, W.; Madara, C.; Ozougwa, L.; Tempia, S.; Blumbeg, L.; Davis, M. Differences in mortality among individuals admitted to hospitals with COVID-19 during the first and second waves in SA: A cohort study. Lancet Glob. Health 2021, 9, e1216–e1225. [Google Scholar] [CrossRef]
  6. NICD (National Institute of Communicable Diseases) of South Africa. An update on COVID-19 outbreak in South Africa. The first and the second wave of COVID-19 cases in South Africa. Commun. Dis. Commun. 2021, 20. Available online: https://www.nicd.ac.za/wp-content/uploads/2021/01/An-update-on-COVID-19-outbreak-in-South-Africa_The-first-and-second-wave.pdf (accessed on 26 January 2022).
  7. Limpopo Provincial Department of Health. Report for Ministerial Briefing. 2020; Unpublished work. [Google Scholar]
  8. Statistics South Africa (STATSSA). Mid-Year Population Estimates for South Africa. 2021. Available online: www.statssa.ac.za (accessed on 26 January 2022).
  9. NICD (National Institute of Communicable Diseases) of South Africa. COVID-19 Statistics for South Africa Up-Date. 2020. Available online: https://twitter.com/nicd_sa/status/1486383623666286597?ref_src (accessed on 27 January 2022).
  10. Maslo, C.; Friedland, R.; Toubkin, J.; Laubscher, A.; Akaloo, T.; Kama, B. Characteristics and Outcome of Hospitalized Patients in South Africa during the COVID-19 Omicron Wave Compared with Previous Waves in the Private Sector. Jama Network. American Medical Association. 2022. Available online: https://www.jamanetwork.com/ (accessed on 27 April 2022).
  11. Western Cape Department of Health in Collaboration with the National Institute for Communicable Diseases, South Africa. Risk Factors for Coronavirus Disease 2019 (COVID-19) Death in a Population Cohort Study from the Western Cape Province, South Africa. Clin. Infect. Dis. 2021, 73, e2005–e2015. [Google Scholar] [CrossRef] [PubMed]
  12. Limpopo Provincial Department of Health Reports. Audit Training. 2020; Unpublished work. [Google Scholar]
  13. Matlala, S.F.; Tshitangano, T.G.; Setati, M.E.; Ramalivhana, N.J.; Mphekgwana, P.M. Determinants of the Limpopo Province of South Africa’s Response to COVID-19: A Mixed Methods Protocol to Analyze and Share Lessons Learned. Healthcare 2022, 10, 926. [Google Scholar] [CrossRef] [PubMed]
  14. World Health Organization. Report of the WHO-China Joint Mission on Coronavirus Disease 2019 (COVID-19). Coronavirus Age, Sex, Demographics (COVID-19). Available online: https://www.who.int/docs/default-source/coronaviruse/who-china-joint-mission-on-covid-19-final-report.pdf (accessed on 25 January 2022).
  15. China CDC. The Epidemiological Characteristics of an Outbreak of 2019 Novel Coronavirus Diseases (COVID-19). Coronavirus Age, Sex, Demographics (COVID-19). Available online: https://weekly.chinacdc.cn/en/article/id/e53946e2-c6c4-41e9-9a9b-fea8db1a8f51 (accessed on 25 January 2022).
  16. Worldometer. Age, Sex, Existing Conditions of COVID-19 Cases and Deaths. Coronavirus Age, Sex, Demographics (COVID-19). Available online: https://www.worldometers.info/coronavirus/coronavirus-age-sex-demographics/ (accessed on 25 January 2022).
  17. World Health Organisation (WHO). The True Death Toll of COVID-19. Available online: www.who.int (accessed on 14 March 2022).
  18. STATSA. COVID-19 Pandemic in South Africa Demography Volume 2020. Available online: https://www.statssa.gov.za/publications/report (accessed on 25 January 2022).
  19. CDC. COVID-19 Provisional Counts: Deaths Involving COVID-19 Reported to CCHS by Time-Period, Jurisdiction of Occurrence, Sex and Age-Group (Available at COVID-19 Provisional Counts—Weekly Updates by Select Demographic and Geographic Characteristics. 2022. Available online: cdc.gov (accessed on 25 January 2022).
  20. District Health Barometer 2019/2020. Health System Trust. 2021. Available online: www.hst.org.za (accessed on 25 January 2022).
  21. STATSSA. Mortality and Causes of Deaths in South Africa: Findings from Death Notification. 2017. Available online: https://www.statssa.gov.za/publications/P030932017 (accessed on 25 January 2022).
  22. National Center for Immunization and Respiratory Diseases (NCIRD), Division of Viral Diseases. Science Brief: Evidence Used to Update the List of Underlying Medical Conditions Associated with Higher Risk for Severe COVID-19. In CDC COVID-19 Science Briefs [Internet]; Centers for Disease Control and Prevention (US): Atlanta, GA, USA, 2020. Available online: https://pubmed.ncbi.nlm.nih.gov/34009770/ (accessed on 26 January 2022).
  23. STATSSA. Statistical Release P0302. Mid-Year Population Estimates 2019; 2016. Available online: https://www.stssa.gov.za/pubications/P0302/p03022015.pdf (accessed on 26 January 2022).
  24. Grasselli, G.; Cattaneo, E.; Florio, G.; Ippolito, M.; Zanella, A.; Cortegiani, A.; Huang, J.; Pesenti, A.; Einav, S.S. Mechanical ventilation parameters in critically ill COVID-19 patients: A scoping review. Crit. Care 2021, 25. [Google Scholar] [CrossRef] [PubMed]
  25. Chiwandire, N.; Zungu, N.; Mabaso, M.; Chasela, C. Trends, prevalence and factors associated with hypertension and diabetes among South African adults living with HIV, 2005–2017. BMC Public Health 2021, 21, 462. [Google Scholar] [CrossRef] [PubMed]
  26. CDC. People with Certain Medical Conditions. 2022. Available online: https://www.cdc.gov/coronavirus/2019-ncov/need-extra-precautions/people-with-medical-conditions.html (accessed on 27 April 2022).
  27. Alanazi, E.; Alashaikh, A.; Alqurashi, S.; Alanazi, A. Identifying and Ranking Common COVID-19 Symptoms from Tweets in Arabic: Content Analysis. J. Med. Internet Res. 2020, 22, e21329. [Google Scholar] [CrossRef] [PubMed]
  28. Relief Web. COVID-19 Impact on Treatment for Chronic Illness Revealed. UN News. 2020. Available online: https://reliefweb.int/report/world/covid-19-impact-treatment-chronic-illness-reveale (accessed on 26 January 2022).
  29. Zoe COVID-19 Symptom’s Study. What Are the Symptoms of COVID-19? Research Updates—COVID Symptom Study. 2021. Available online: joinzoe.com (accessed on 27 January 2022).
Figure 1. Distribution of deaths by waves.
Jor 02 00009 g001
Figure 2. Distribution of COVID-19 deaths by wave and age.
Jor 02 00009 g002
Figure 3. Distribution of deaths by waves and gender.
Jor 02 00009 g003
Figure 4. Distribution of in-patient fatalities by district and waves.
Jor 02 00009 g004
Figure 5. Distribution of in-patient deaths by ward and waves.
Jor 02 00009 g005
Table 1. Data on waves, period, numbers of cases, and deaths in Limpopo and South Africa in both the public and private sector.
South African COVID-19 data during the first and second waves
South African COVID-19 dataFirst waveSecond wave
13 June 2020–21 November 2020–
22 August 20206 February 2021
Cumulative confirmed cases609,7733,526,054
Deaths48020,903
Case fatality2%3.1%
Highest proportion of confirmed cases by age30–39 years old30–39 years old
Highest propotion of confirmed cases by genderFemales (56.9%)Females (57.2%)
Limpopo Province COVID-19 data during the first and second waves
Limpopo Province COVID-19 dataFirst waveSecond wave
13 June 2020–21 November 2020–
24 August 20206 February 2021
Cumulative confirmed cases12 54559 662
Deaths3011960
Case fatalityNo data27.5%
Highest proportion of cases by age35–39 years old35–39 years old
Highest propotion of cases by genderFemalefemales
Source: NICD [9] epidemiological weeks 34 of 2020 and week 5 of 2021.
Table 2. Case fatality rate by gender, age, and district.
DemographicsCumulative Admission CasesNo. of DeathsCase Fatality Rate
Gender
Male37444318%
Female460553811%
Age
20–29485102%
30–391267222%
40–491571614%
50–5921291427%
60+289773425%
DistrictCumulative Admission CasesNo. of In-Patient DeathsCase Fatality Rate as of 13 March 2021
Capricorn20,2908114.0
Mopani11,6544483.8
Sekhukhune79162433.1
Vhembe11,6514603.9
Waterberg11,9622942.5
Limpopo63,47322563.55
Source: Limpopo provincial department of health reports [12].
Table 3. Overall COVID-19 inpatient deaths by underlying conditions, mechanical ventilation, and clinical manifestations.
Deaths by Underlying ConditionsOverallPercentageFemalePercentageMalePercentage
HIV/AIDS (Human immune virus/acquired Immune deficiency syndrome14119%6918%7220%
TB (tuberculosis)375%123%258%
COPD (chronic obstructive pulmonary disease)183%93%93%
Hypertension58664%31965%26762%
Diabetes Mellitus45052%24354%20750%
Asthma355%257%103%
Obesity8112%5214%299%
Cancer234%113%124%
Deaths by Mechanical ventilationOverallPercentageFemalePercentageMalePercentage
598%335%263%
Deaths by Clinical presentationsOverallPercentageFemalePercentageMalePercentage
Fever (self-reported)26655%12623%14025%
Chills14833%7321%7522%
Cough65081%32441%32642%
Sore throat13732%6214%7518%
Shortness of breath71484%36843%34641%
Anosmia6516%237%429%
Dysgeusia8320%379%4611%
Myalgia/body aches37460%19932%17528%
Diarrhoea14531%7417%7114%
Chest Pain558%295%263%
Loss of appetite659%345%314%
Respiratory distress91988%48353%43645%
Table 4. Concrete ratio between male population and female population by age classes.
Age RangeMalesFemales
40–441,764,7871,820,620
45–491,546,0271,590,334
50–541,129,9001,405,148
55–59945,3881,247,124
60–64745,0711,039,405
65–69553,578816,542
70–74361,408588,404
75–79214,946382,928
80+179,361423,608
Source: STATSSA [23]—mid-year population estimates by age and gender, 2019.
Table 5. Leading non-communicable diseases (NCDs) by gender in 2017.
Names of Leading NCDsMalesFemales
RankNumberPercentRankNumberPercent
Diabetes mellitus499934.2115,3437.3
Cardiovascular disease696434.1212,6146.0
Hypertension877253.3312,1755.8
Other forms of heart diseases310,4224.4411,6715.5
Source: District Health Barometer 2019/2020 [20].
Table 6. Percentage of deaths by non-communicable diseases by age in 2017.
Age01–45–910–1415–1920–2425–2930–3435–3940–4445–4950–5455–5960–6465–6970–7475–7980–8485–8990+
Percentage18.027.631.632.622.117.018.022.326.934.443.955.264.272.276.781.782.284.383.476.8
Source: STATSSA [21]—Mortality and causes of deaths in South Africa, 2019.
Publisher’s Note: MDPI stays neutral with regard to jurisdictional claims in published maps and institutional affiliations.

