
Pericardial Recesses Mimicking Mediastinal Adenopathy on CT
by
 ,
,
John Matthew Archer
1, 
Jitesh Ahuja
2,
Chad D. Strange
2,
Girish S. Shroff
2,
Ebru Unlu
2 and
Mylene T. Truong
2,* 1
Department of Radiology, Massachusetts General Hospital, Boston, MA 02114, USA
2
Department of Thoracic Imaging, University of Texas MD Anderson Cancer Center, Houston, TX 77030, USA
*
Author to whom correspondence should be addressed.
J. Respir. 2022, 2(2), 87-100; https://doi.org/10.3390/jor2020007
Submission received: 6 April 2022
/
Revised: 25 April 2022
/
Accepted: 6 May 2022
/
Published: 20 May 2022
Abstract
:Thin-section computed tomography (CT) has improved the detection of pericardial recesses and sinuses. Physiologic fluid in the pericardial recesses and sinuses can mimic mediastinal adenopathy. The misinterpretation of pericardial recesses and other benign pericardial entities in the oncologic setting can lead to inappropriate staging and management. Knowledge of the anatomy of the pericardium with emphasis on the imaging of different pericardial recesses on CT is important to avoid misdiagnosis, unnecessary further investigations, and/or biopsy.
1. Introduction
The pericardium is a thin, relatively avascular, fibrous sac that envelops the heart. The pericardium consists of the visceral and parietal pericardium. Composed of a thin layer of mesothelial cells, the visceral pericardium lines the epicardial surface of the heart [1]. The parietal pericardium is composed of the outer fibrous component and inner a double-layered inner serosa. The outer fibrous component of the parietal pericardium attaches to the diaphragm, sternum, and great vessels [1]. The inner serosal layer is composed of a thin layer of mesothelial cells [2]. The potential space between the visceral and parietal serous layers is termed the pericardial cavity. The pericardial cavity normally contains up to 50 mL of fluid [3]. The pericardial cavity contains the transverse and oblique sinuses, which further subdivide into the pericardial recesses (Figure 1) [4]. Thin-section computed tomography (CT) has improved the detection of pericardial recesses and sinuses [5,6]. The various appearances of these spaces are known to mimic mediastinal adenopathy. Misinterpretation of these normal findings and variants can lead to incorrect staging, unnecessary follow-up, and inappropriate treatment. Furthermore, pericardial anatomy is essential in the epicardial approach for cardiac electrophysiological interventions to treat cardiac arrhythmias refractory to conventional endocardial ablation. We review normal pericardial anatomy and mimics/pitfalls on CT, magnetic resonance imaging (MRI), and positron emission tomography-CT (PET-CT).
2. Imaging Features
Imaging features that allow confident diagnosis of pericardial recesses include typical locations, fluid attenuation/signal characteristics, lack of mass effect on neighboring structures, and contiguity with pericardial spaces. Mediastinal adenopathy typically demonstrates reniform shape and lobular margins. In contrast to pericardial recess fluid, adenopathy typically has soft tissue attenuation and may demonstrate contrast enhancement. Areas of low-attenuation can be seen in areas of necrosis. Additionally, adenopathy may exert mass effect on neighboring structures. In cases where CT is indeterminate, MRI and PET-CT may be helpful in distinguishing adenopathy from pericardial fluid. Simple pericardial recess fluid shows low signal intensity on T1-weighted images, high signal intensity on T2-weighted images, and steady-state free precession sequences [7]. Lymphadenopathy and pericardial tumors can have variable signal intensity on MRI depending on its composition and typically demonstrates postcontrast enhancement. On 18-fluorodeoxyglucose (FDG)-PET-CT, pericardial recesses do not show FDG uptake, while lymphadenopathy and pericardial tumors can have variable uptake depending on composition.
3. Transverse Sinus
The transverse sinus is positioned caudal and posterior to the aorta and the pulmonary trunk and cephalad to the left atrium (LA) (Figure 2) [4]. The transverse sinus gives rise to four recesses that extend between the great vessels and the LA: the superior aortic recess, inferior aortic recess, left pulmonic recess, and right pulmonic recess.
3.1. Superior Aortic Recess
The cranial extent of the transverse sinus is the superior aortic recess, which can be subdivided into the right lateral, posterior, and anterior portions. The right lateral portion extends along the right side of the ascending aorta to the level of the sternal angle. The posterior portion has a characteristic half-moon shape and extends behind the posterior part of the ascending aorta, and is also referred to as the superior pericardial recess (Figure 3) [4]. The anterior portion of the superior aortic recess passes anterior to the aorta and pulmonary artery, forming a characteristic cleft between the great vessels [8,9]. The anterior portion of the superior aortic recess in the aorto-pulmonic window (APW) is termed the APW recess and can mimic adenopathy (Figure 4) [4].
A lesser-known variant is the “high riding” superior pericardial recess (HRSPR), which extends cephalad into the right paratracheal region between the brachiocephalic vessel and trachea [10]. Contiguity between the caudal aspect of the high-riding and the superior pericardial recess on CT and MRI enables distinguishing this entity from lymphadenopathy or other cystic mediastinal lesions [2]. The reported incidence of the HRSPR ranges from 2–7% [6,10].
3.2. Inferior Aortic Recess
The crescent shaped inferior aortic recess extends caudally to the level of the aortic valve, posterior to the ascending aorta and anterior to the left atrium [11].
3.3. Right and Left Pulmonic Recesses
3.4. Oblique Sinus
The oblique sinus is located posterior to the left atrium and anterior to the esophagus. Typically, a fat plane can be observed between the oblique sinus and the esophagus [12] (Figure 6) [4]. The oblique sinus is separated from the transverse sinus by a double reflection of serous pericardium [8]. Fluid in the oblique sinus can be misinterpreted as abnormalities related to the esophagus, descending thoracic aorta, and subcarinal lymph nodes [4,13] (Figure 7).
4. Pericardial Cavity Proper
The pericardial cavity proper gives rise to three recesses: right and left pulmonary venous recesses and the postcaval recess.
4.1. Postcaval Recess
4.2. Right and Left Pulmonary Venous Recesses
The right and left pulmonary venous recesses are positioned between the superior and inferior pulmonary veins, where the pericardium is attached to the venous adventitia [11,14]. Fluid accumulation in the right pulmonary venous recess is a commonly reported finding and can be mistaken for bronchopulmonary adenopathy. Truong et al. evaluated the imaging characteristics of six patients with fluid in the pericardial sleeve recess mistaken for adenopathy, finding that the fluid in the anterior and posterior components to be spindle shaped, and fluid within the superior and inferior components to be ovoid [14]. Adenopathy usually occurs on one side of the vein. Pericardial pulmonary venous recess fluid has no attributable mass effect on the right inferior pulmonary vein, whereas adenopathy can cause mass effect and narrowing of the vein [4,14] (Figure 8 and Figure 9).
5. Additional Pitfalls in Pericardial Imaging
Infectious and inflammatory conditions can result in FDG uptake on PET-CT. A few potential pitfalls include hypermetabolic brown fat, acute pericarditis, and epipericardial fat necrosis.
5.1. Hypermetabolic Brown Fat
Brown fat (or brown adipose tissue) has a smaller cell size, higher mitochondrial density, and increased vascularity compared with white fat tissue. It is found in the cervical, supraclavicular, paravertebral, axillary, mediastinal, and abdominal regions [15]. High physiologic uptake of FDG can be seen in activated brown fat, which can be mistaken for malignancy or potentially obscure small metastases. Brown fat activation is associated with younger age, lower body mass index, and lower temperature environments [15]. Although it can be easily recognized when bilateral and symmetric in distribution and corresponding low attenuation on CT, focal FDG uptake can be seen in the setting of lipomatous hypertrophy of the interatrial septum (LHIS) (Figure 10) [4]. LHIS is a benign finding, in which adipose tissue (including brown adipose) increases between the myocardial fibers of the interatrial septum [16].
5.2. Acute Pericarditis
Acute inflammation of the pericardium can be due to infection, drug reaction, radiation therapy, cardiac injury, systemic inflammatory processes, and metabolic conditions [17]. CT and MRI findings include smooth or nodular pericardial thickening (>4 mm), enhancement, and effusion (Figure 11) [4]. Focal or diffuse FDG uptake can be seen in both neoplastic and nonneoplastic causes [18]. The overlap in imaging findings can make differentiating neoplastic and nonneoplastic causes difficult, and careful correlation with extracardiac findings, laboratory analysis, and history is needed.
5.3. Epipericardial Fat Necrosis
Epipericardial fat necrosis (or pericardial fat necrosis) is a self-limited process that can be a source of chest pain. The CT findings include fat attenuation surrounded by a rim of soft tissue with fat stranding, similar in appearance to epiploic appendagitis [19] (Figure 12) [4]. Associated pericardial and pleural effusions can be seen [17,19]. Focal FDG uptake can be seen on PET-CT [20]. These findings could mimic cardiophrenic adenopathy or pericardial metastasis. Resolution should be seen on follow-up imaging. Avoiding misdiagnosis of this self-limited process can prevent inappropriate staging or testing.
6. Conclusions
The pericardial recesses are commonly observed on cross-sectional imaging, particularly with the advent of thin-section computed tomography. Physiologic fluid in the pericardial recesses and sinuses can mimic mediastinal adenopathy. The misinterpretation of pericardial recesses and other benign pericardial entities in the oncologic setting can lead to inappropriate staging and management. Knowledge of the anatomy of the pericardium and awareness of the spectrum of imaging appearances of different pericardial recesses on CT are essential to avoid misdiagnosis, unnecessary investigations, and/or biopsy.
Author Contributions
J.M.A. prepared the original draft of the manuscript. All authors contributed to obtaining images, manuscript revision, and final approval the submitted version. All authors have read and agreed to the published version of the manuscript.
Funding
This research received no external funding.
Data Availability Statement
No new data were created or analyzed in this study. Data sharing is not applicable to this article.
Acknowledgments
The authors wish to thank Chastity A. Holmes, Senior Administrative Assistant in the Department of Thoracic Imaging, for her invaluable help with the manuscript preparation and Kelly M. Kage, Medical Illustrator in the Division of Diagnostic Imaging at the University of Texas M.D. Anderson Cancer Center, for her skillful expertise in preparing the figures for publication.
Conflicts of Interest
The authors declare that the research was conducted in the absence of any commercial or financial relationships that could be construed as a potential conflict of interest.
References
- Little, W.C.; Freeman, G.L. Pericardial disease. Circulation 2006, 113, 1622–1632. [Google Scholar] [CrossRef] [PubMed]
- Shroff, G.S.; Viswanathan, C.; Godoy, M.C.; Marom, E.M.; Sabloff, B.S.; Truong, M.T. Pitfalls in oncologic imaging: Pericardial recesses mimicking adenopathy. Semin. Roentgenol. 2015, 50, 235–240. [Google Scholar] [CrossRef] [PubMed]
- Bogaert, J.; Francone, M. Pericardial disease: Value of CT and MR imaging. Radiology 2013, 267, 340–356. [Google Scholar] [CrossRef] [PubMed]
- Shroff, G.S.; Ahuja, J.; Strange, C.D.; Gayer, G.; Jo, N.; Archer, J.M.; Truong, M.T. Pitfalls in oncologic imaging of the pericardium on CT and PET/CT. Semin. Ultrasound CT MRI 2022. [Google Scholar] [CrossRef]
- Kodama, F.; Fultz, P.J.; Wandtke, J.C. Comparing thin-section and thick-section CT of pericardial sinuses and recesses. AJR Am. J. Roentgenol. 2003, 181, 1101–1108. [Google Scholar] [CrossRef]
- Basile, A.; Bisceglie, P.; Giulietti, G.; Calcara, G.; Figuera, M.; Mundo, E.; Granata, A.; Runza, G.; Privitera, C.; Privitera, G.; et al. Prevalence of “high-riding” superior pericardial recesses on thin-section 16-MDCT scans. Eur. J. Radiol. 2006, 59, 265–269. [Google Scholar] [CrossRef] [PubMed]
- Axel, L. Assessment of pericardial disease by magnetic resonance and computed tomography. J. Magn. Reson. Imaging 2004, 19, 816–826. [Google Scholar] [CrossRef] [PubMed]
- Vesely, T.M.; Cahill, D.R. Cross-sectional anatomy of the pericardial sinuses, recesses, and adjacent structures. Surg. Radiol. Anat. 1986, 8, 221–227. [Google Scholar] [CrossRef] [PubMed]
- O’Leary, S.M.; Williams, P.L.; Williams, M.P.; Edwards, A.J.; Roobottom, C.A.; Morgan-Hughes, G.J.; Manghat, N.E. Imaging the pericardium: Appearances on ECG-gated 64-detector row cardiac computed tomography. Br. J. Radiol. 2010, 83, 194–205. [Google Scholar] [CrossRef] [PubMed] [Green Version]
- Choi, Y.W.; McAdams, H.P.; Jeon, S.C.; Seo, H.S.; Hahm, C.K. The “High-Riding” superior pericardial recess: CT findings. AJR Am. J. Roentgenol. 2000, 175, 1025–1028. [Google Scholar] [CrossRef] [PubMed]
- Broderick, L.S.; Brooks, G.N.; Kuhlman, J.E. Anatomic pitfalls of the heart and pericardium. Radiographics 2005, 25, 441–453. [Google Scholar] [CrossRef] [PubMed]
- Groell, R.; Schaffler, G.J.; Rienmueller, R. Pericardial sinuses and recesses: Findings at electrocardiographically triggered electron-beam CT. Radiology 1999, 212, 69–73. [Google Scholar] [CrossRef] [PubMed]
- Truong, M.T.; Erasmus, J.J.; Gladish, G.W.; Sabloff, B.S.; Marom, E.M.; Madewell, J.E.; Chasen, M.H.; Munden, R.F. Anatomy of pericardial recesses on multidetector CT: Implications for oncologic imaging. AJR Am. J. Roentgenol. 2003, 181, 1109–1113. [Google Scholar] [CrossRef] [PubMed]
- Truong, M.T.; Erasmus, J.J.; Sabloff, B.S.; Marom, E.M.; Gladish, G.W.; Chasen, M.H.; Munden, R.F. Pericardial “sleeve” recess of right inferior pulmonary vein mimicking adenopathy: Computed tomography findings. J. Comput. Assist. Tomogr. 2004, 28, 361–365. [Google Scholar] [CrossRef] [PubMed]
- Steinberg, J.D.; Vogel, W.; Vegt, E. Factors influencing brown fat activation in FDG PET/CT: A retrospective analysis of 15,000+ cases. Br. J. Radiol. 2017, 90, 20170093. [Google Scholar] [CrossRef] [PubMed]
- Fan, C.M.; Fischman, A.J.; Kwek, B.H.; Abbara, S.; Aquino, S.L. Lipomatous hypertrophy of the interatrial septum: Increased uptake on FDG PET. AJR Am. J. Roentgenol. 2005, 184, 339–342. [Google Scholar] [CrossRef] [PubMed]
- Kligerman, S. Imaging of Pericardial Disease. Radiol. Clin. N. Am. 2019, 57, 179–199. [Google Scholar] [CrossRef] [PubMed]
- Hyeon, C.W.; Yi, H.K.; Kim, E.K.; Park, S.J.; Lee, S.C.; Park, S.W.; Oh, J.K.; Choi, J.Y.; Chang, S.A. The role of (18)F-fluorodeoxyglucose-positron emission tomography/computed tomography in the differential diagnosis of pericardial disease. Sci. Rep. 2020, 10, 21524. [Google Scholar] [CrossRef] [PubMed]
- Fred, H.L. Pericardial fat necrosis: A review and update. Tex. Heart Inst. J. 2010, 37, 82–84. [Google Scholar] [PubMed]
- Kashyap, R.; Lau, E.; George, A.; Seymour, J.F.; Lade, S.; Hicks, R.J.; Hofman, M.S. High FDG activity in focal fat necrosis: A pitfall in interpretation of posttreatment PET/CT in patients with non-Hodgkin lymphoma. Eur. J. Nucl. Med. Mol. Imaging 2013, 40, 1330–1336. [Google Scholar] [CrossRef] [PubMed]
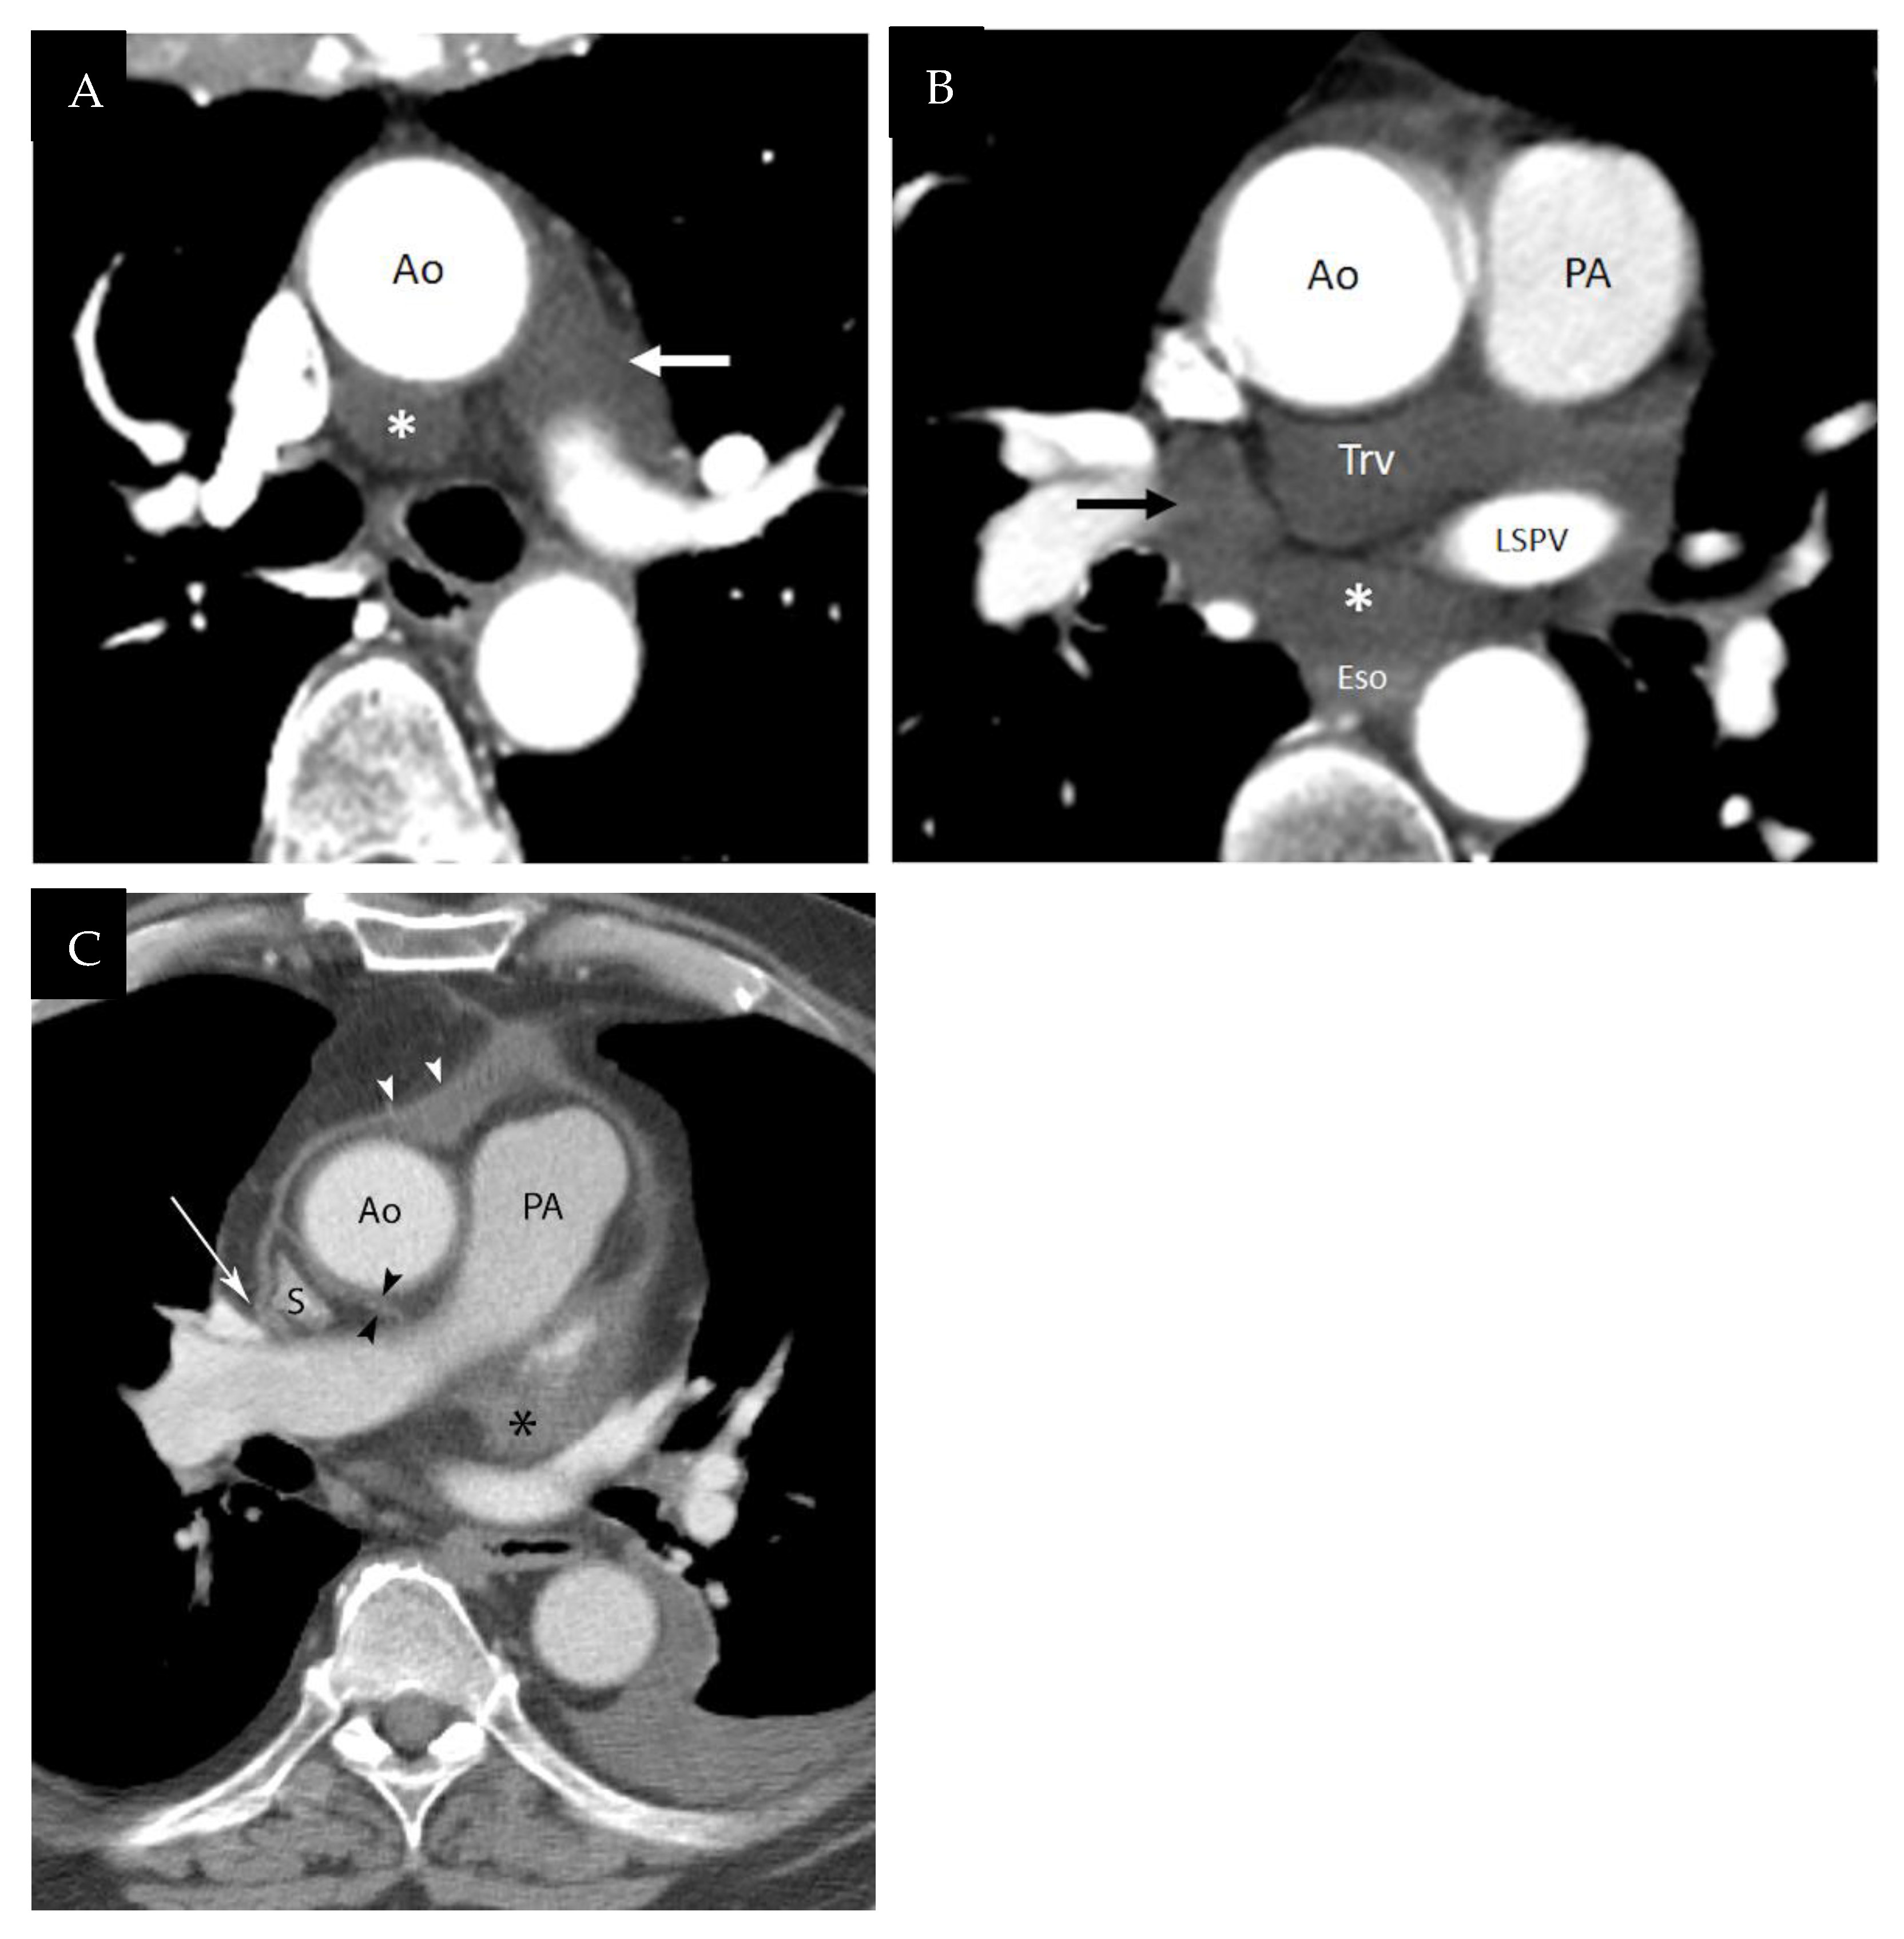
Figure 1.
Normal pericardial recess anatomy. (A) Contrast-enhanced axial CT at a level just superior to the main pulmonary artery shows fluid in the superior pericardial recess (*) and in the AP window recess (arrow). These recesses are part of the transverse sinus. (B). Contrast-enhanced axial CT at a level just inferior to the right pulmonary artery shows fluid in the transverse sinus (Trv), oblique sinus (*), and postcaval recess (arrow). Ao = ascending aorta, Eso = esophagus, LSPV = left superior pulmonary vein, PA = pulmonary artery. (C). Contrast-enhanced axial CT at the level of the right pulmonary artery shows a small amount of fluid in the postcaval recess (arrow), a diverticulum of the pericardial cavity proper lateral and posterior to the superior vena cava (S). Pericardial fluid is seen posterior (black arrowheads) to the ascending aorta in the superior aortic recess, anterior (white arrowheads) to the aorta (A) and pulmonary artery (PA) as well as in left pulmonic recess (asterisk) of the transverse sinus. Reprinted from Shroff G.S. et al. Pitfalls in oncologic imaging of the pericardium on CT and PET/CT [4].

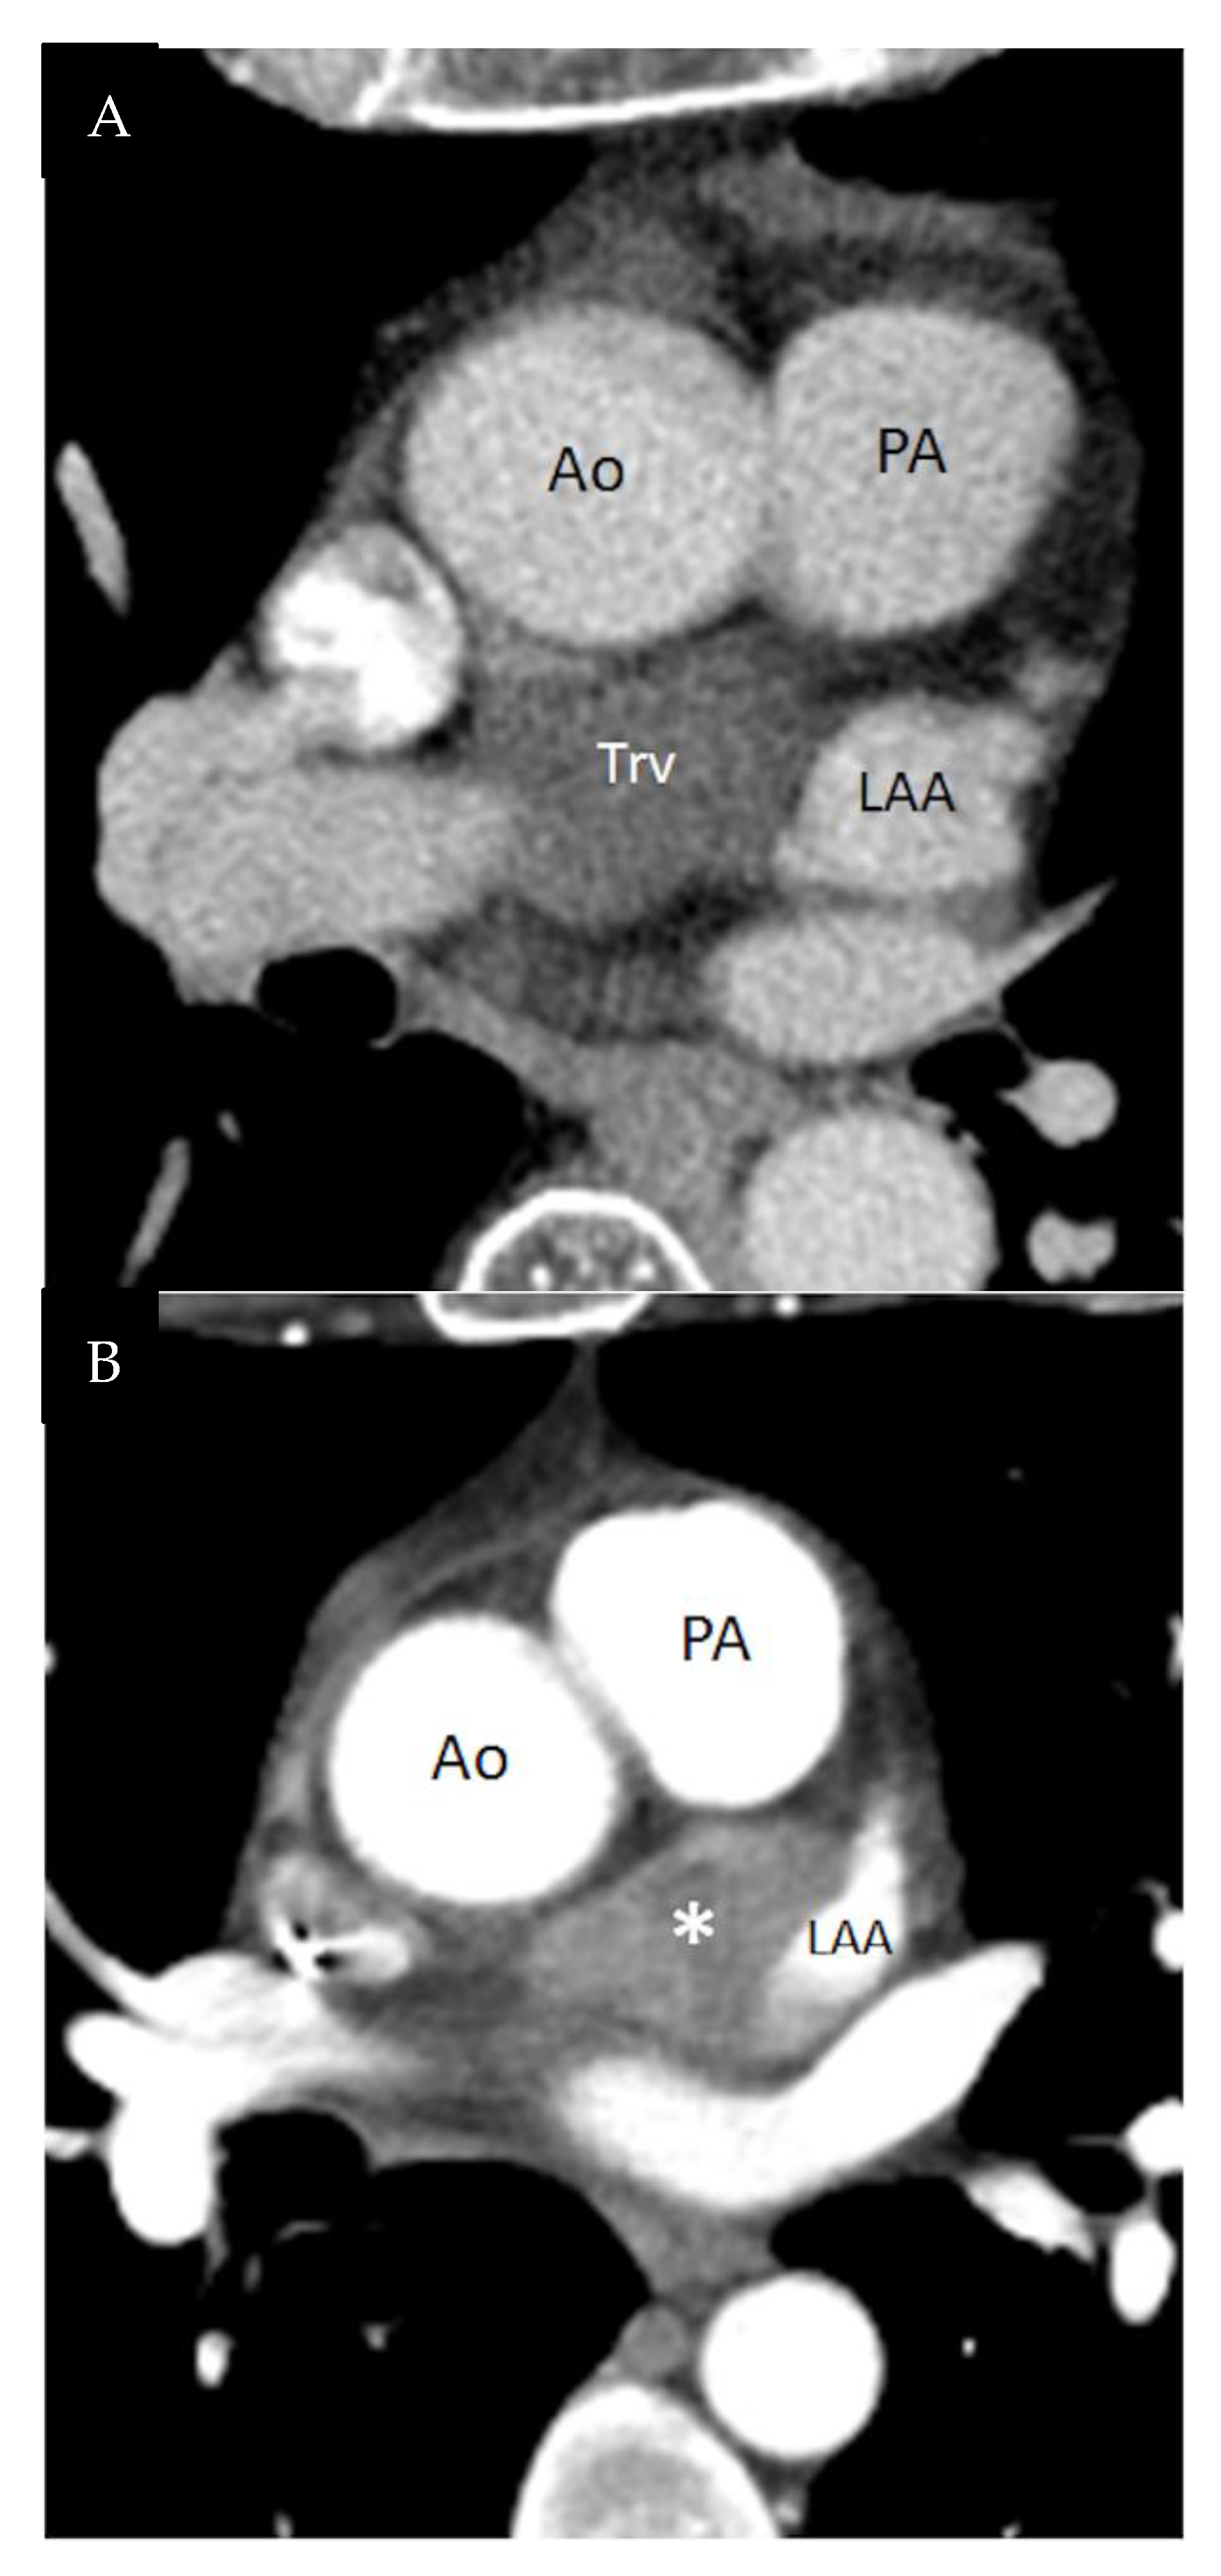
Figure 2.
Fluid versus metastatic disease in the transverse sinus. (A) A 63 year-old woman with hemophilia. Contrast-enhanced axial CT at a level just inferior to the right pulmonary artery shows fluid in the transverse sinus (Trv). (B) A 42 year-old man with melanoma. Contrast-enhanced axial CT shows heterogeneously enhancing soft tissue representing pericardial metastatic disease (*) in the transverse sinus. Soft tissue attenuation and enhancement help distinguish adenopathy or metastatic disease from recess fluid. Ao = ascending aorta, LAA = left atrial appendage, PA = pulmonary artery. Reprinted from Shroff G.S. et al. Pitfalls in oncologic imaging of the pericardium on CT and PET/CT [4].

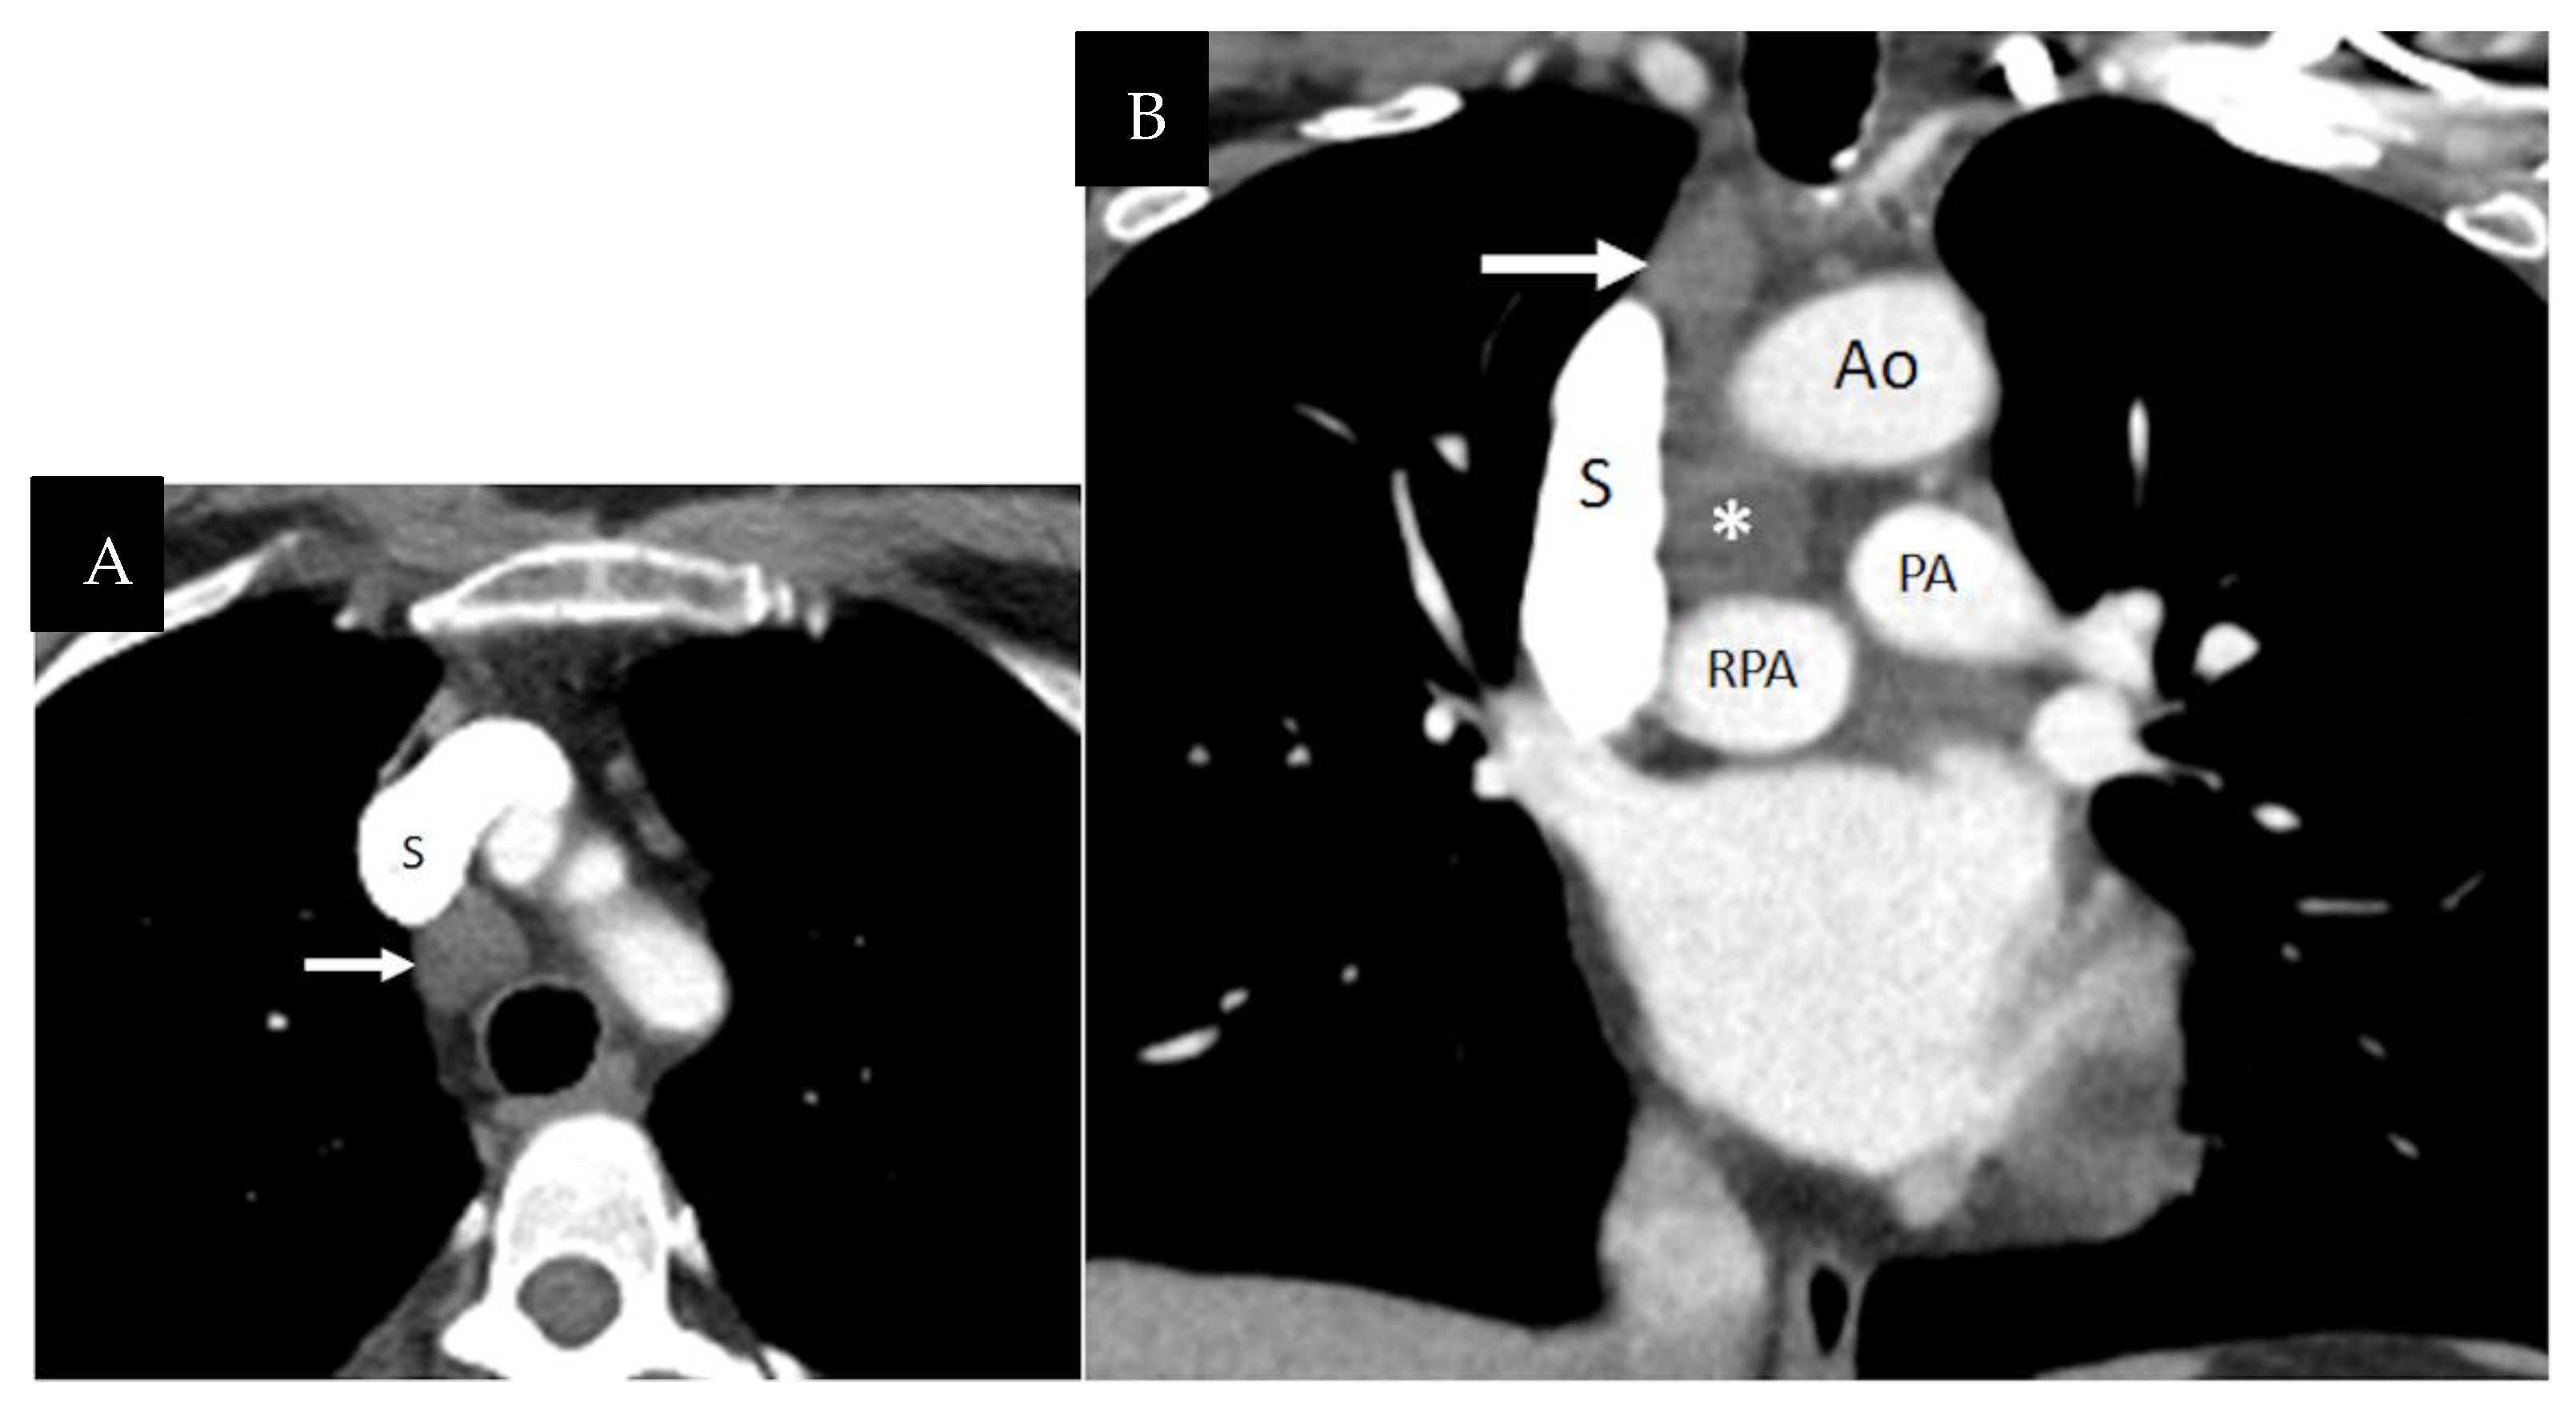
Figure 3.
High-riding superior pericardial recess. 66 year-old woman with cervical cancer. (A) Contrast-enhanced axial CT at the level of superior vena cava origin shows a cystic structure (arrow) at the right paratracheal region. (B) Coronal reformation demonstrates contiguity of the cystic structure (arrow) with the superior pericardial recess (*) of transverse sinus. This “high-riding” variant can be misinterpreted as adenopathy when fluid attenuation and contiguity with the superior pericardial recess are not recognized. Ao = ascending aorta, PA = pulmonary artery, RPA = right pulmonary artery, S = superior vena cava. Reprinted from Shroff G.S. et al. Pitfalls in oncologic imaging of the pericardium on CT and PET/CT [4].

Figure 4.
Fluid versus metastatic disease in the AP window recess. (A) A 69 year-old woman with melanoma. Contrast-enhanced axial CT shows pericardial fluid distending the AP window recess (*). Note the small lymph node (arrow) anterior to the recess. (B) A 64 year-old man with lung cancer. Contrast-enhanced axial CT shows adenopathy at the AP window (arrow) and low left paratracheal region. Soft-tissue attenuation and lobular contour are features that differentiate adenopathy from a fluid-filled pericardial recess. Ao = ascending aorta. Reprinted from Shroff G.S. et al. Pitfalls in oncologic imaging of the pericardium on CT and PET/CT [4].

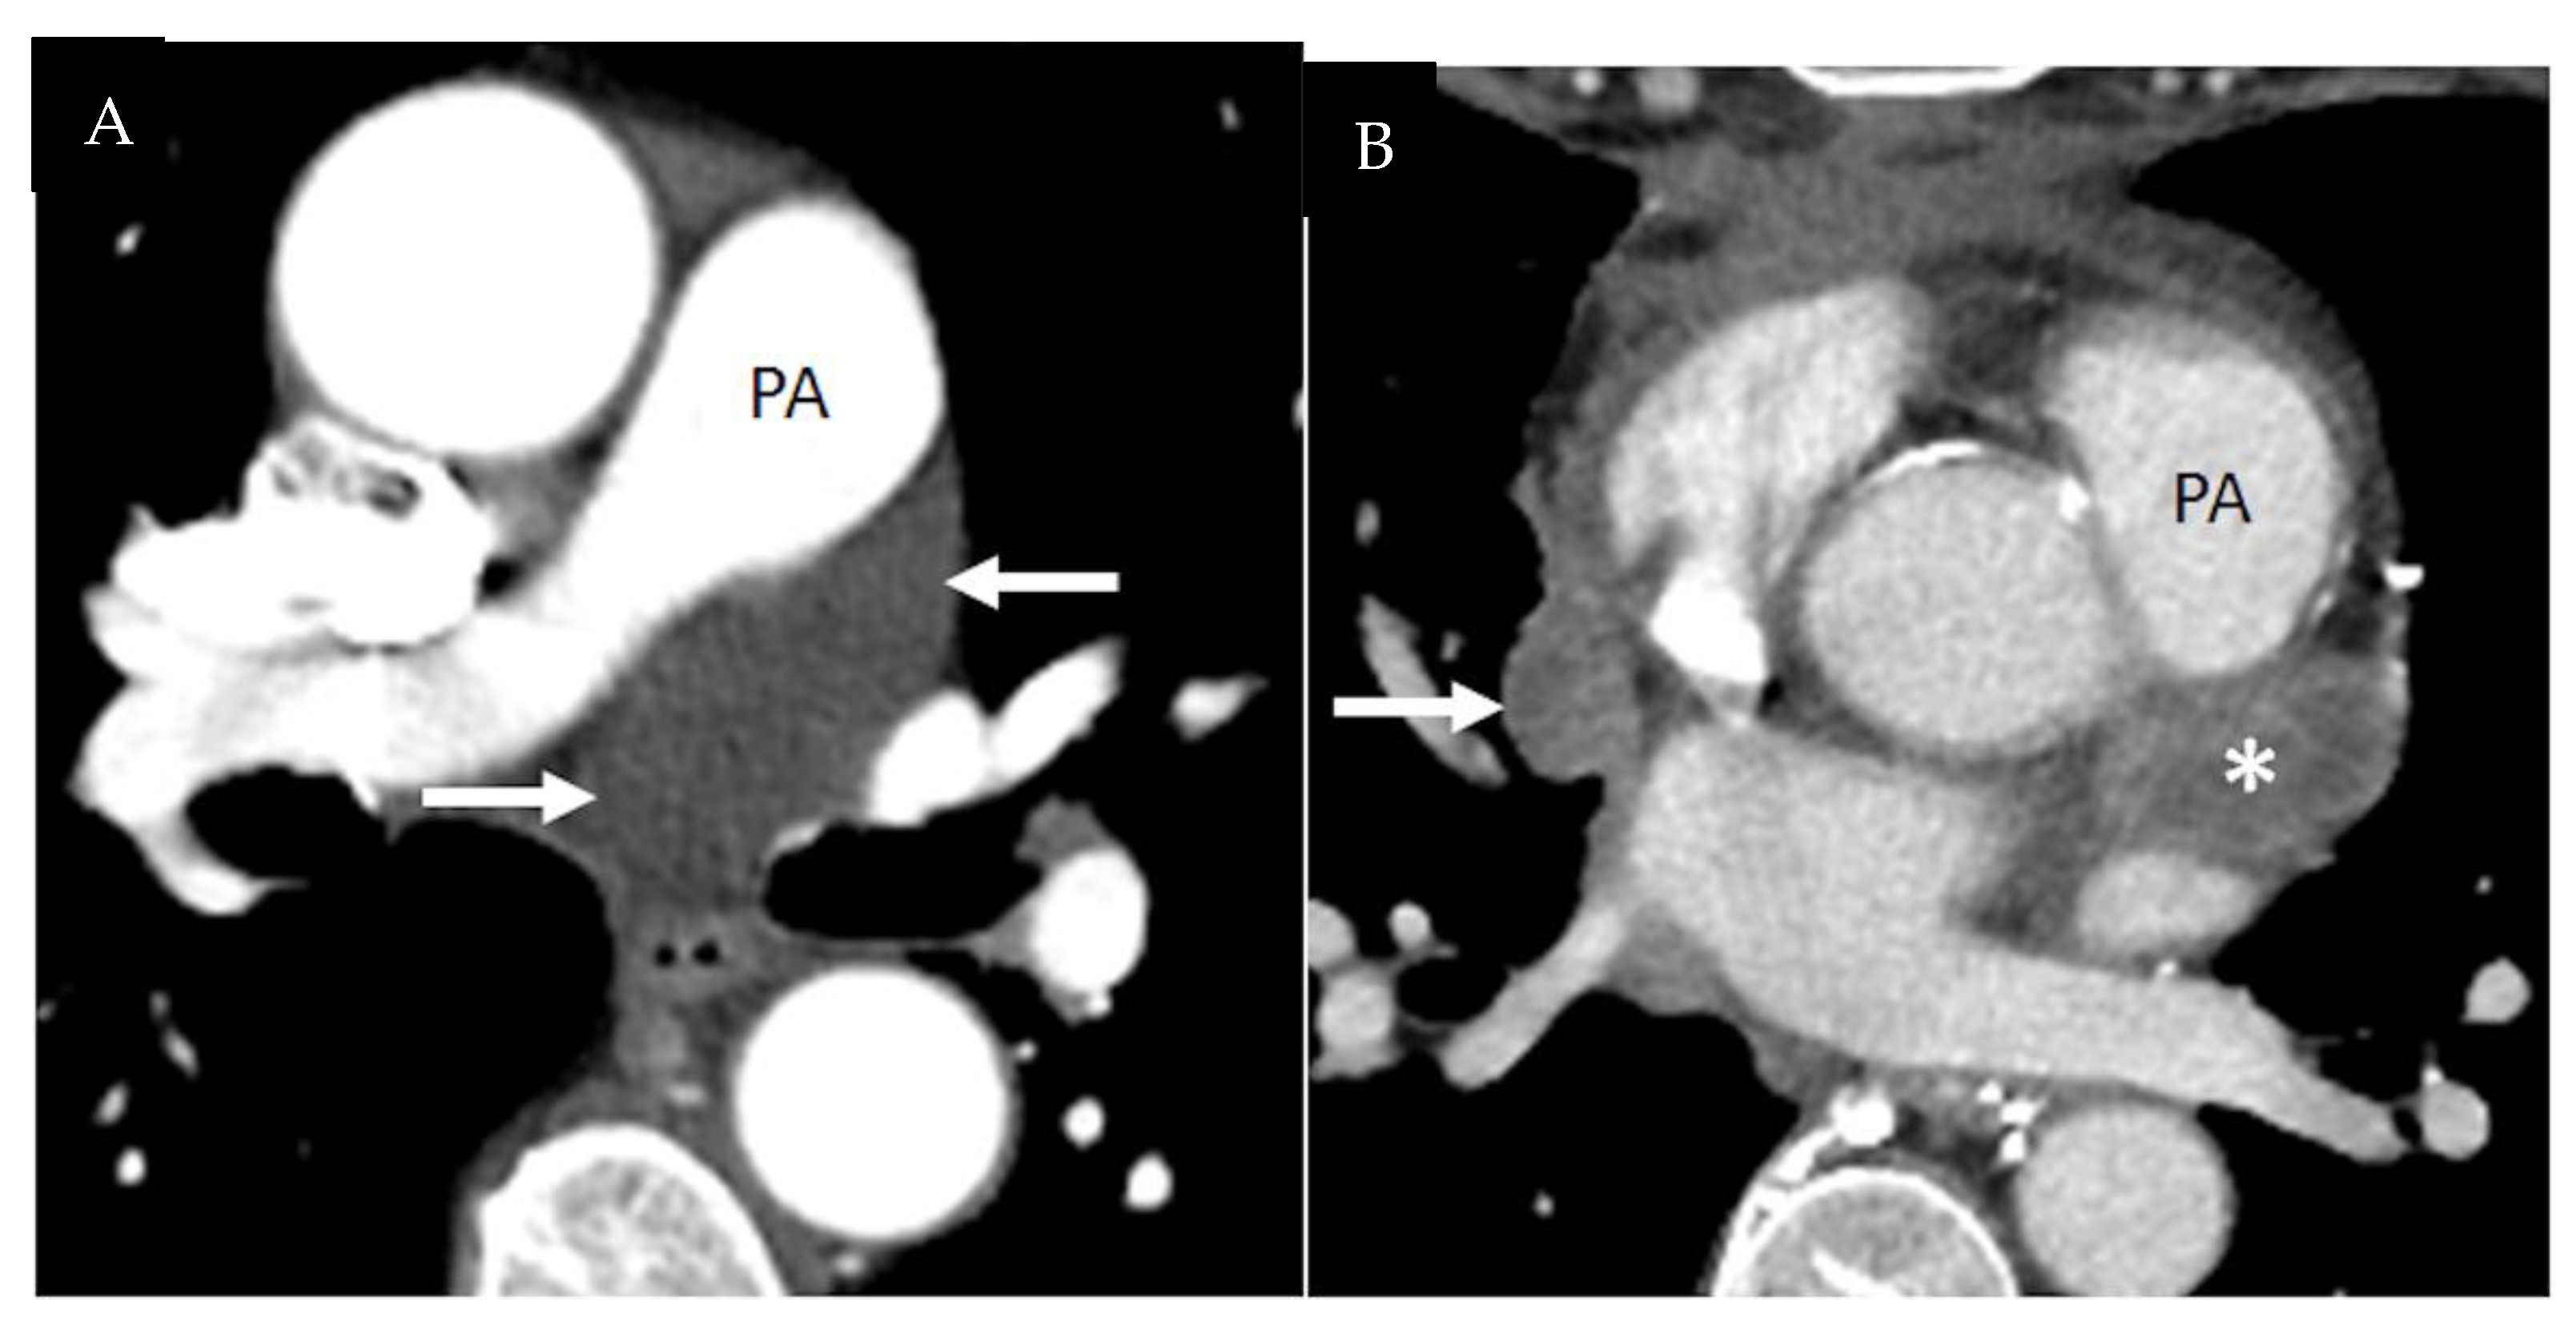
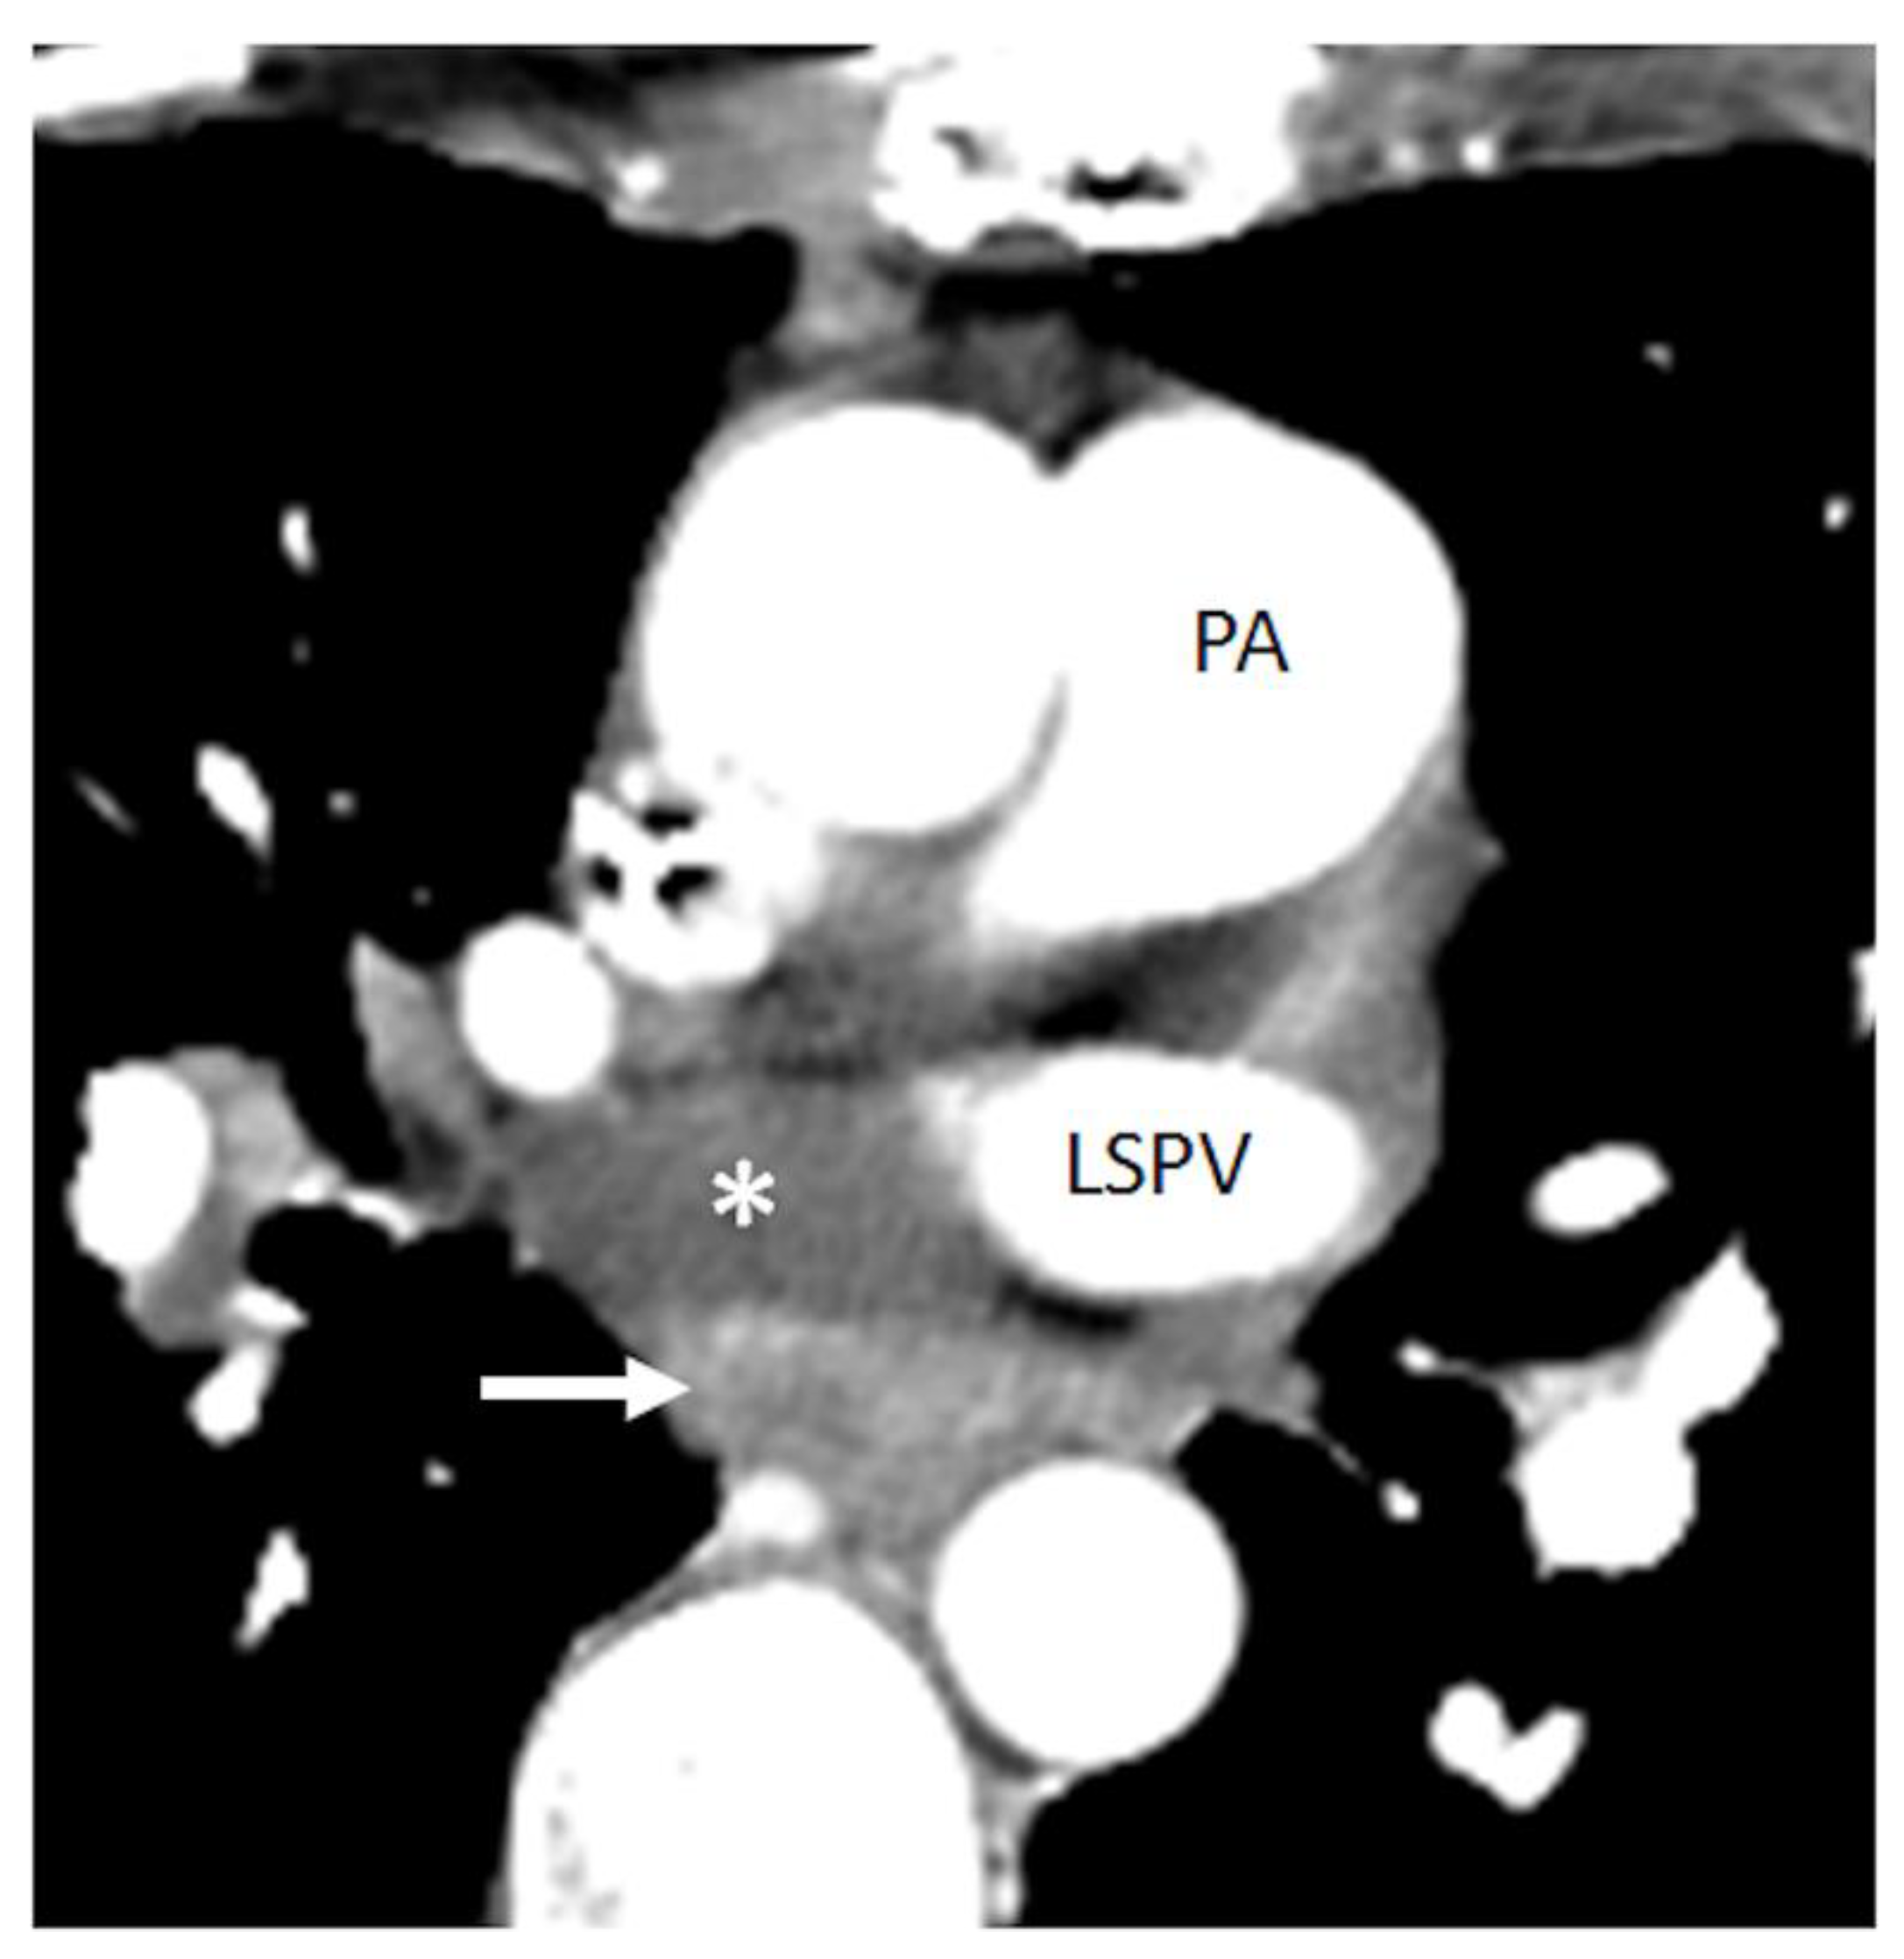
Figure 5.
Fluid versus metastatic disease in the left pulmonic recess. (A) 63 year-old woman with rectal cancer. Contrast-enhanced axial CT at the level of the main pulmonary artery shows fluid distending the left pulmonic recess (arrows). The left pulmonic recess is usually seen as a spindle-shaped or crescentic fluid attenuation structure located immediately adjacent to the posterior wall of the proximal right pulmonary artery. (B) 56 year-old man with thymoma. Contrast-enhanced axial CT at the level of the main pulmonary artery shows heterogeneously enhancing soft tissue representing pericardial metastatic disease (*) in the left pulmonic recess. Arrow denotes additional pericardial metastasis along the right heart. Soft tissue attenuation and enhancement help distinguish adenopathy or metastatic disease from recess fluid. PA = pulmonary artery. Reprinted from Shroff G.S. et al. Pitfalls in oncologic imaging of the pericardium on CT and PET/CT [4].

Figure 6.
Oblique sinus fluid and adjacent adenopathy. 57 year-old woman with breast cancer. Contrast-enhanced axial CT at the level of the main pulmonary artery shows fluid in the oblique sinus (*) and adenopathy (arrow) posterior to the oblique sinus. Note in this case the difference in attenuation between fluid in the oblique sinus and adjacent enhancing adenopathy. Reprinted from Shroff G.S. et al. Pitfalls in oncologic imaging of the pericardium on CT and PET/CT [4].

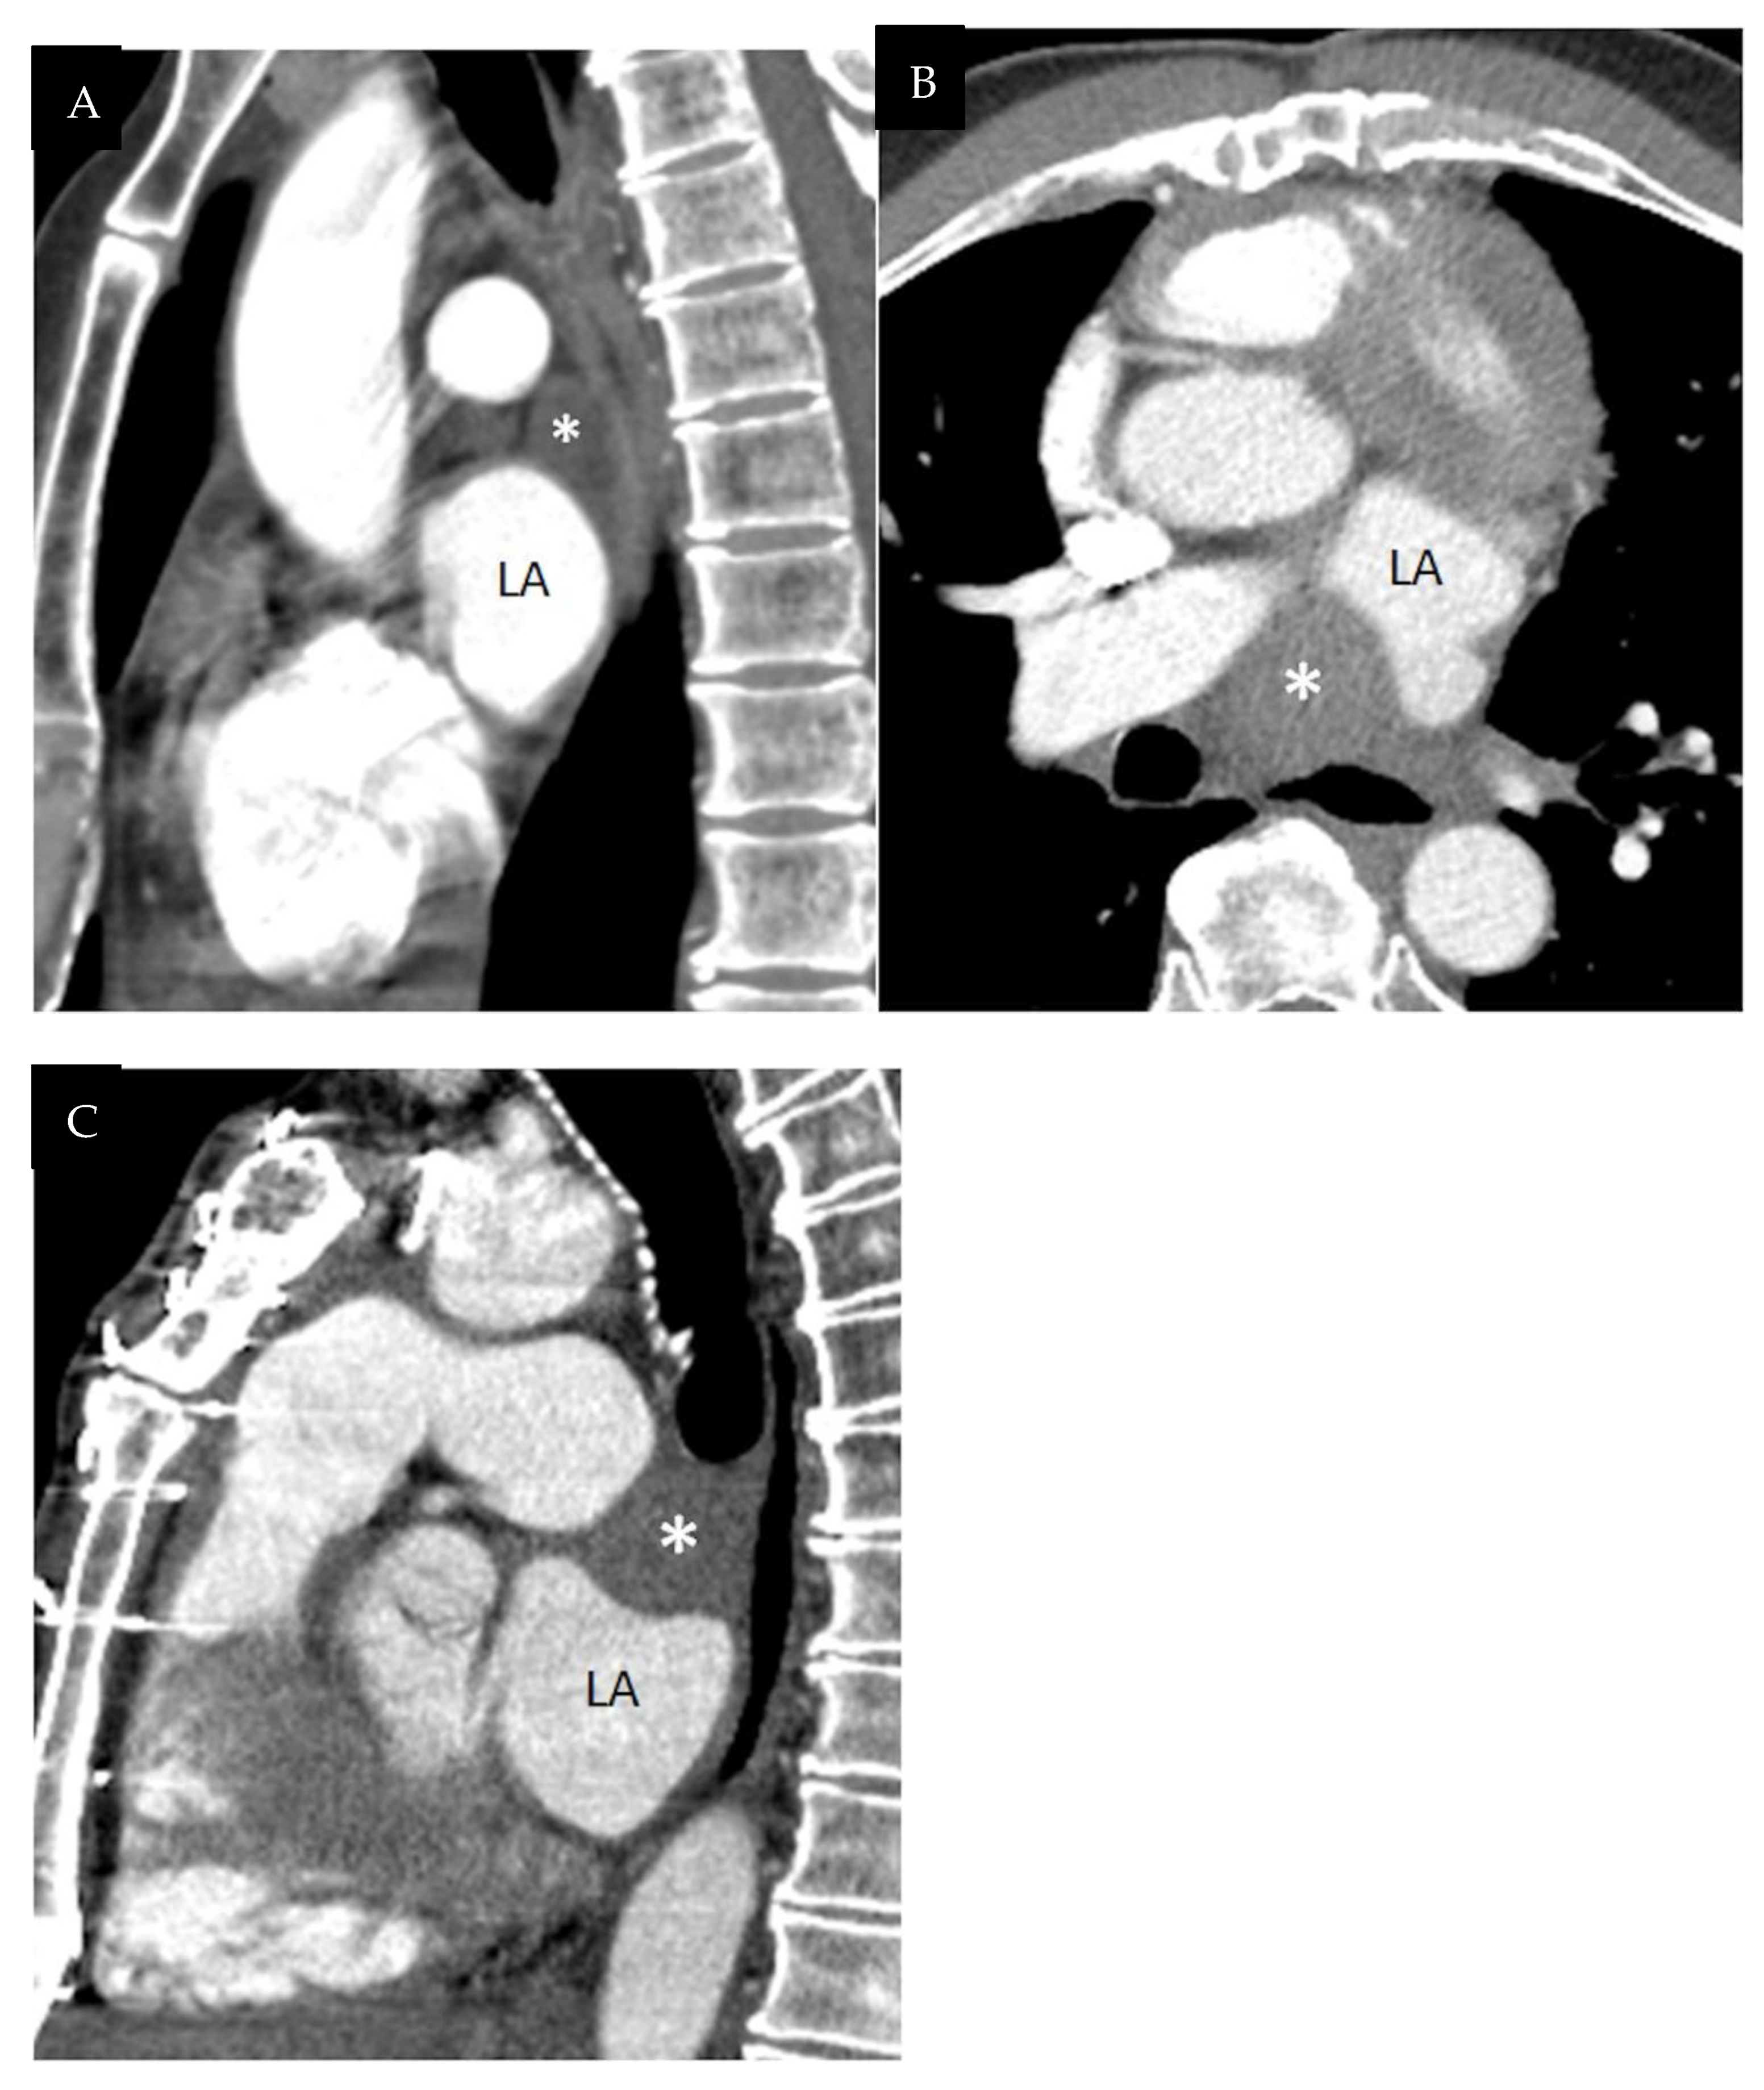
Figure 7.
Fluid versus metastatic disease in the oblique sinus. (A) Sagittal reformation shows a normal oblique sinus (*) with no mass effect on the left atrium. LA = left atrium. Contrast-enhanced axial CT (B) and sagittal reformation (C) in a 61 year-old man with thymoma depict enhancing soft tissue (*) representing pericardial metastatic disease in the oblique sinus. Note mild mass effect on the upper aspect of the left atrium in (C). Soft tissue attenuation, enhancement, and mass effect are characteristics of adenopathy or metastatic disease in pericardial recesses. Reprinted from Shroff G.S. et al. Pitfalls in oncologic imaging of the pericardium on CT and PET/CT [4].

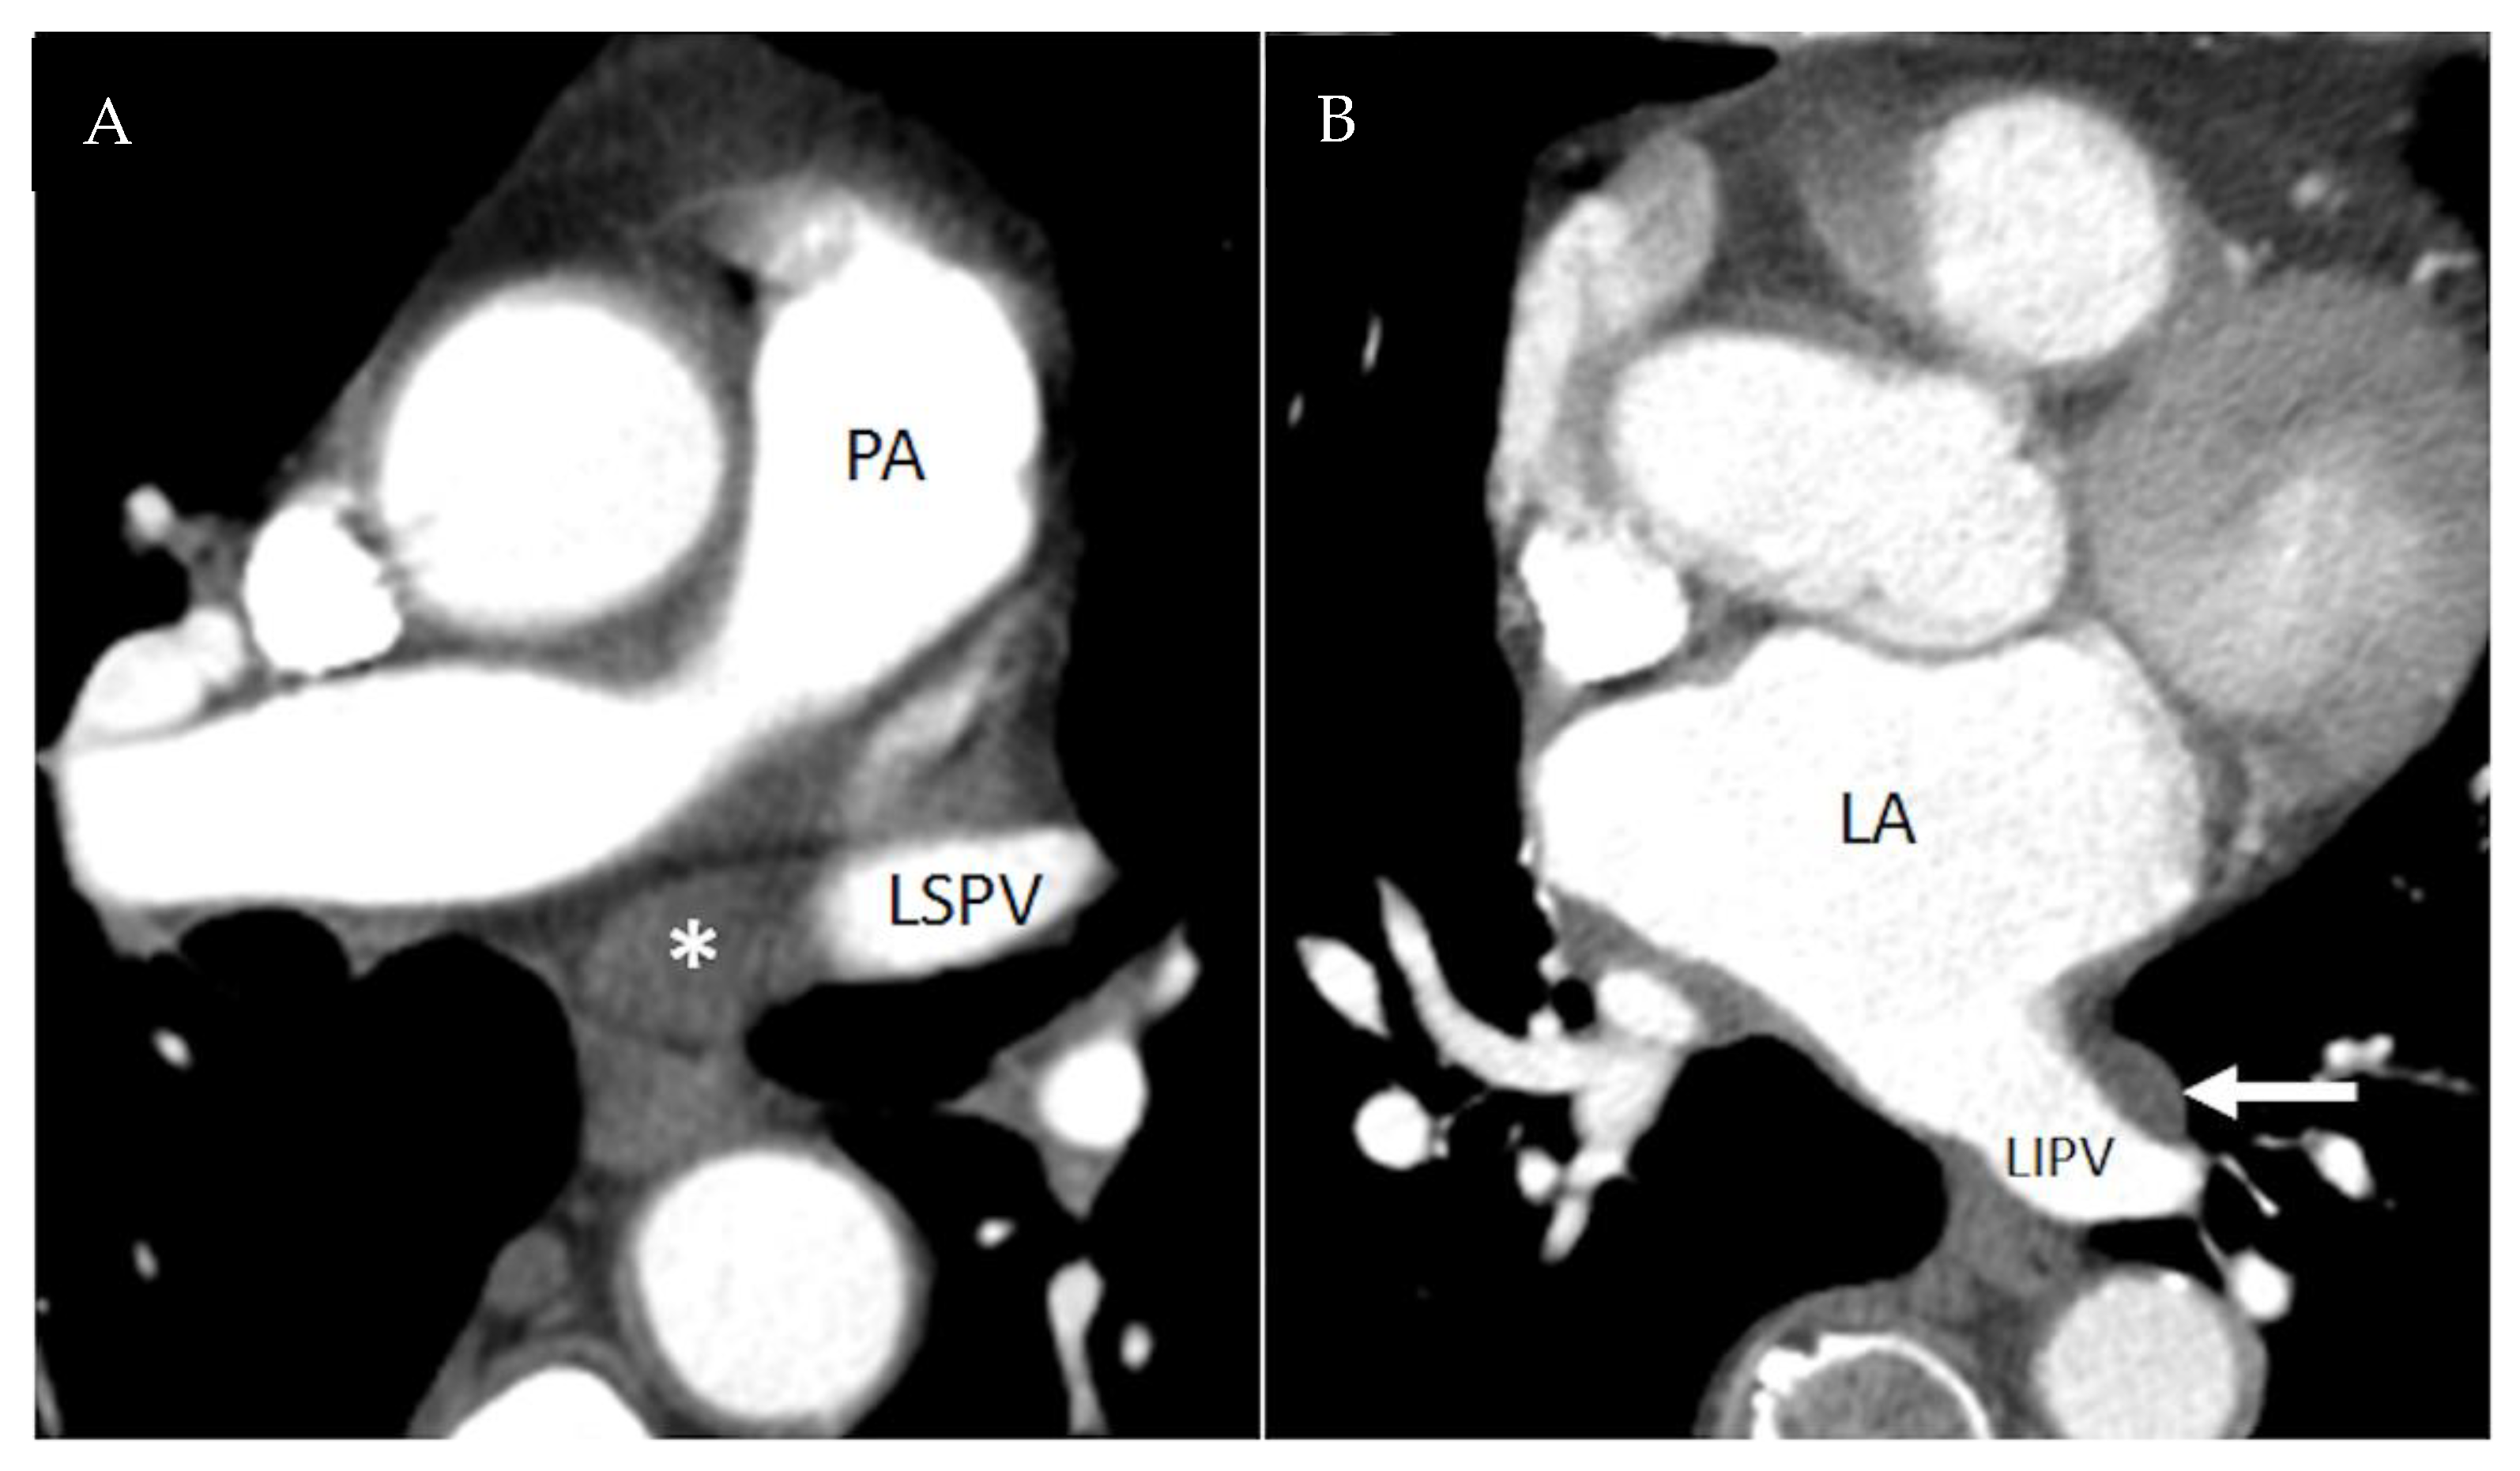
Figure 8.
Normal left pulmonary venous recess. (A) 73 year-old woman for pulmonary nodule evaluation. Contrast-enhanced axial CT shows fluid alongside the left superior pulmonary vein in the left pulmonary venous recess (*). (B) 90 year-old woman with left lower lobe adenocarcinoma. Contrast-enhanced axial CT shows fluid adjacent to the left inferior pulmonary vein in the left pulmonary venous recess (arrow). Typical location, fluid attenuation, lack of mass effect, and lack of enhancement are features that help distinguish fluid from adenopathy or metastatic disease. LA = left atrium, LIPV = left inferior pulmonary vein, LSPV = left superior pulmonary vein, PA = pulmonary artery. Reprinted from Shroff G.S. et al. Pitfalls in oncologic imaging of the pericardium on CT and PET/CT [4].

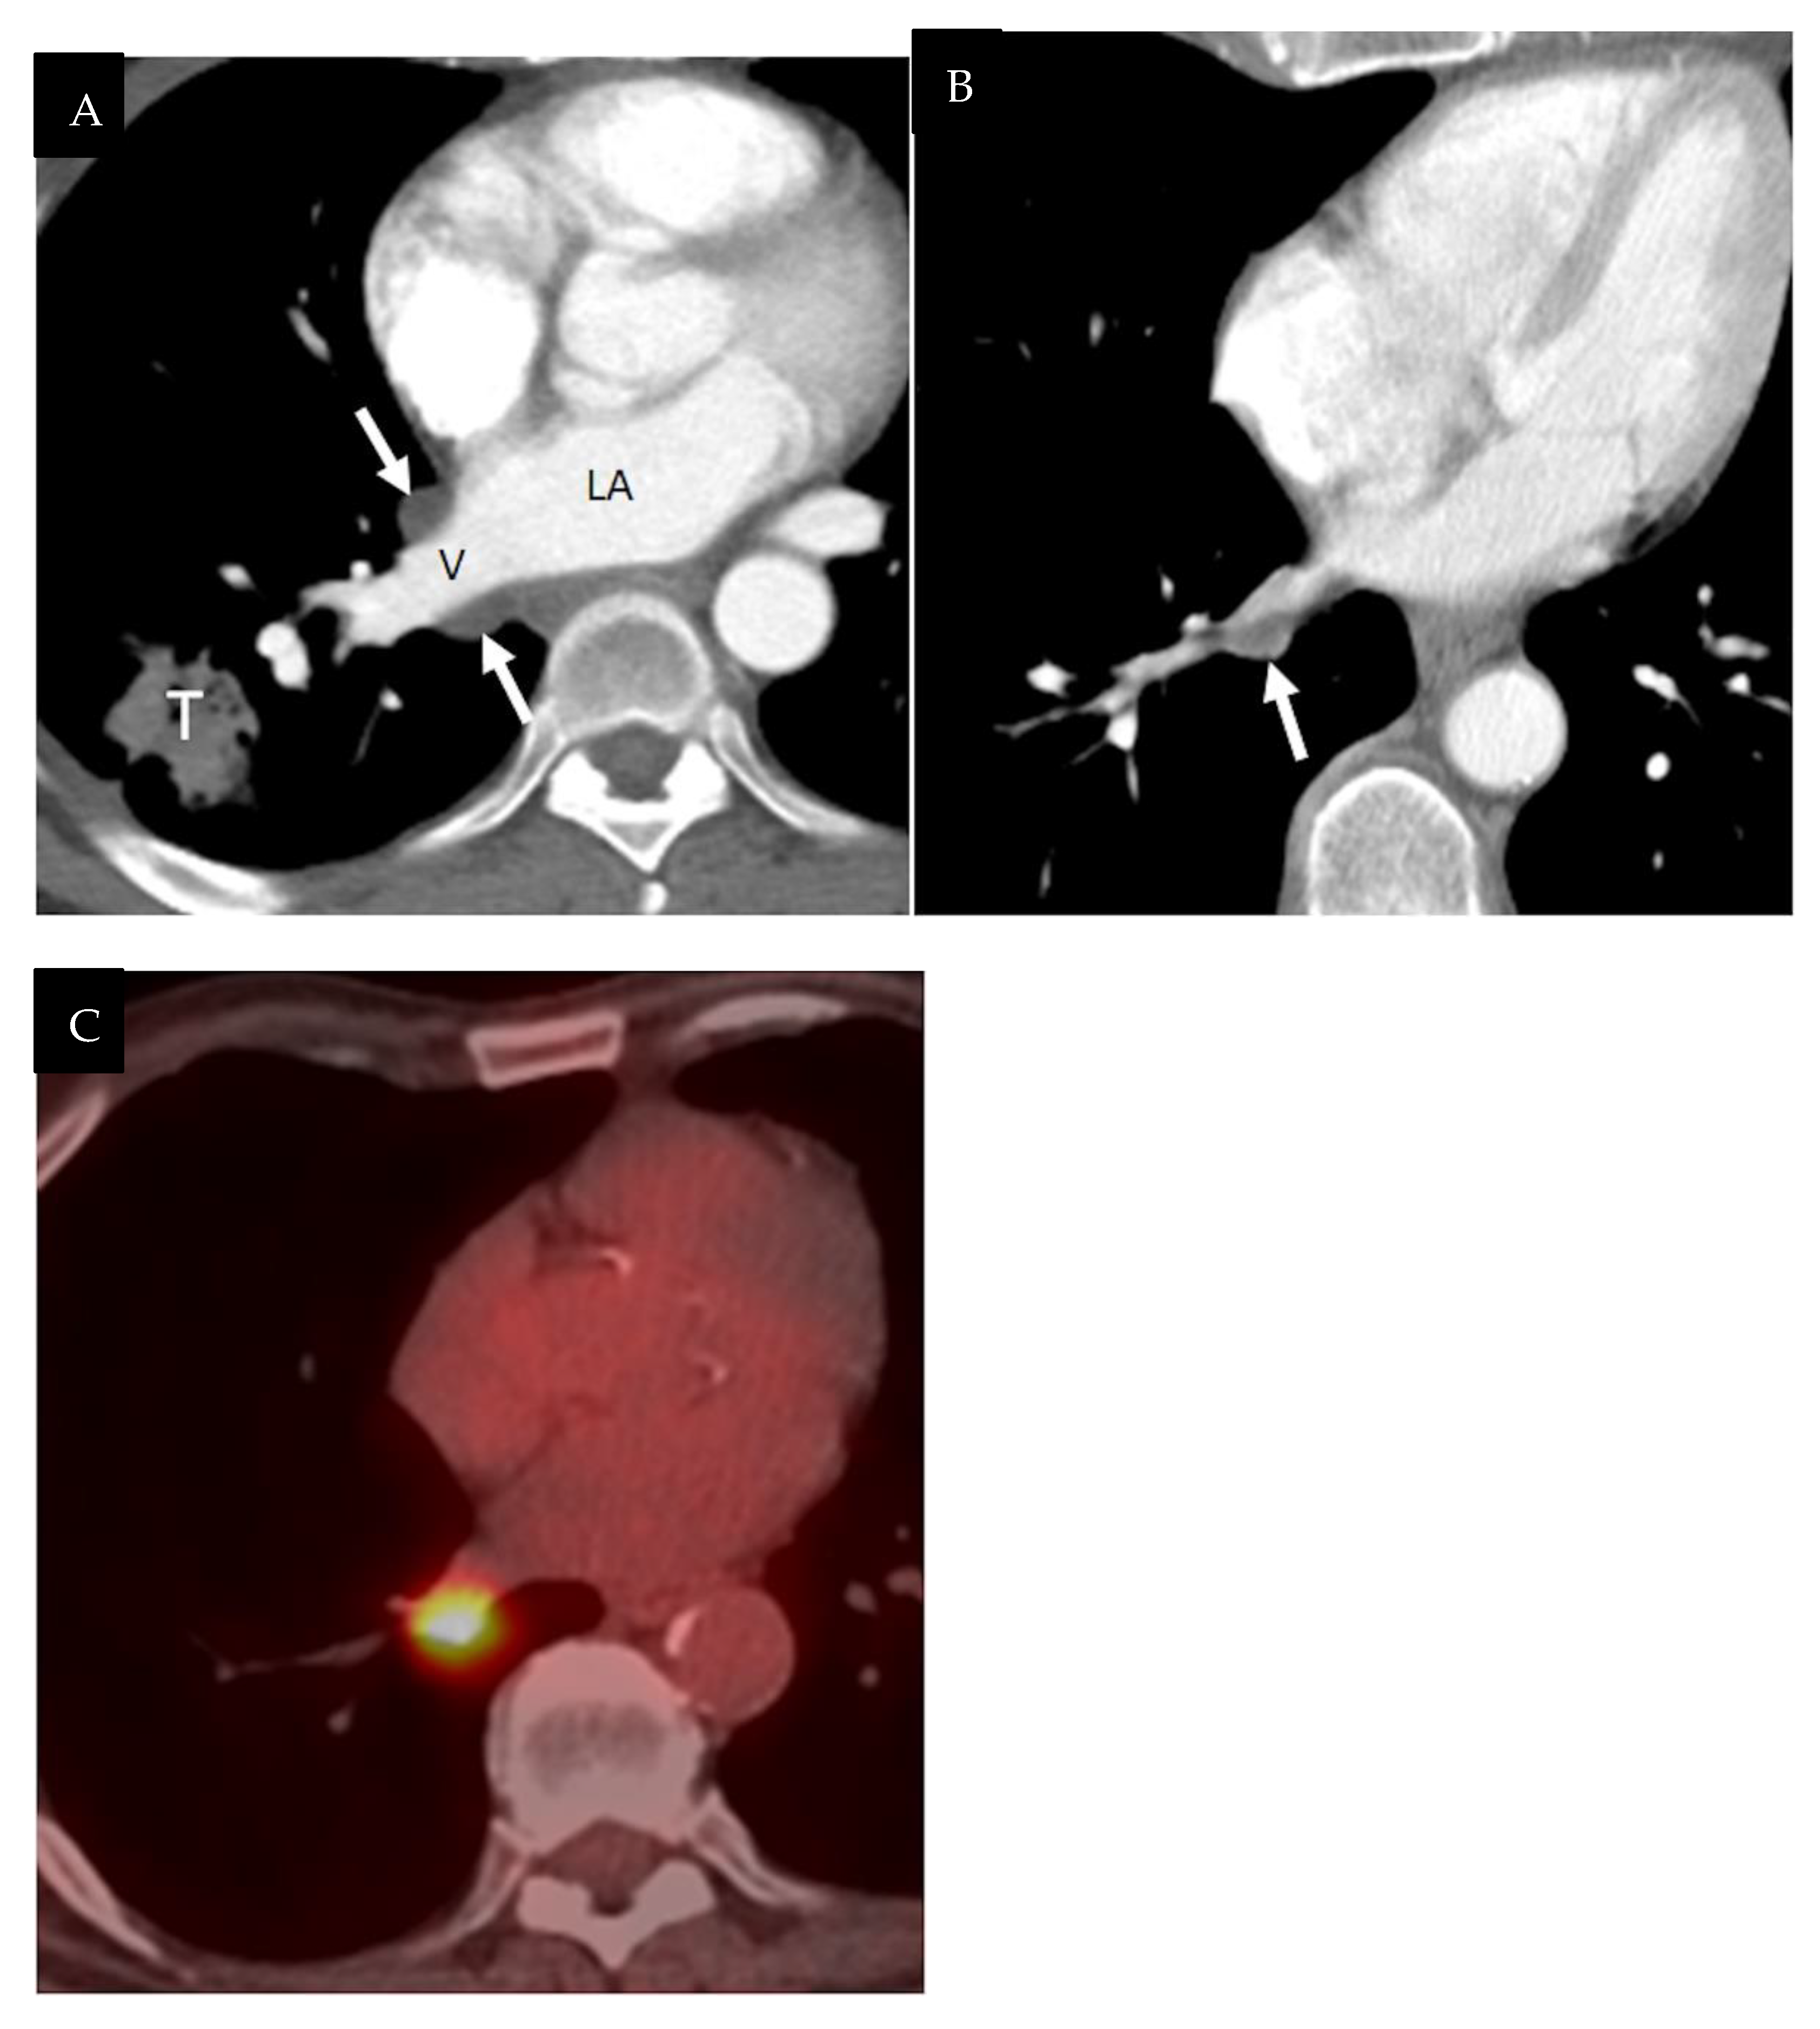
Figure 9.
Fluid and adenopathy in the right pulmonary venous recess adjacent to the right inferior pulmonary vein. 57 year-old woman with right lower lobe adenocarcinoma. (A) Contrast-enhanced axial CT shows the right lower lobe primary tumor (T) and fluid in the right pulmonary venous recess (arrows). Typical location anterior and posterior to the vein and fluid attenuation are features that help prevent misinterpretation as adenopathy. 80 year-old man with esophageal cancer. (B) Contrast-enhanced axial CT shows an indeterminate low attenuation nodular opacity (arrow) posterior to the right inferior pulmonary vein that is FDG avid on PET/CT (C) consistent with nodal metastasis. When findings are equivocal, MRI or PET/CT can be used to distinguish adenopathy from pericardial fluid. Reprinted from Shroff G.S. et al. Pitfalls in oncologic imaging of the pericardium on CT and PET/CT [4].

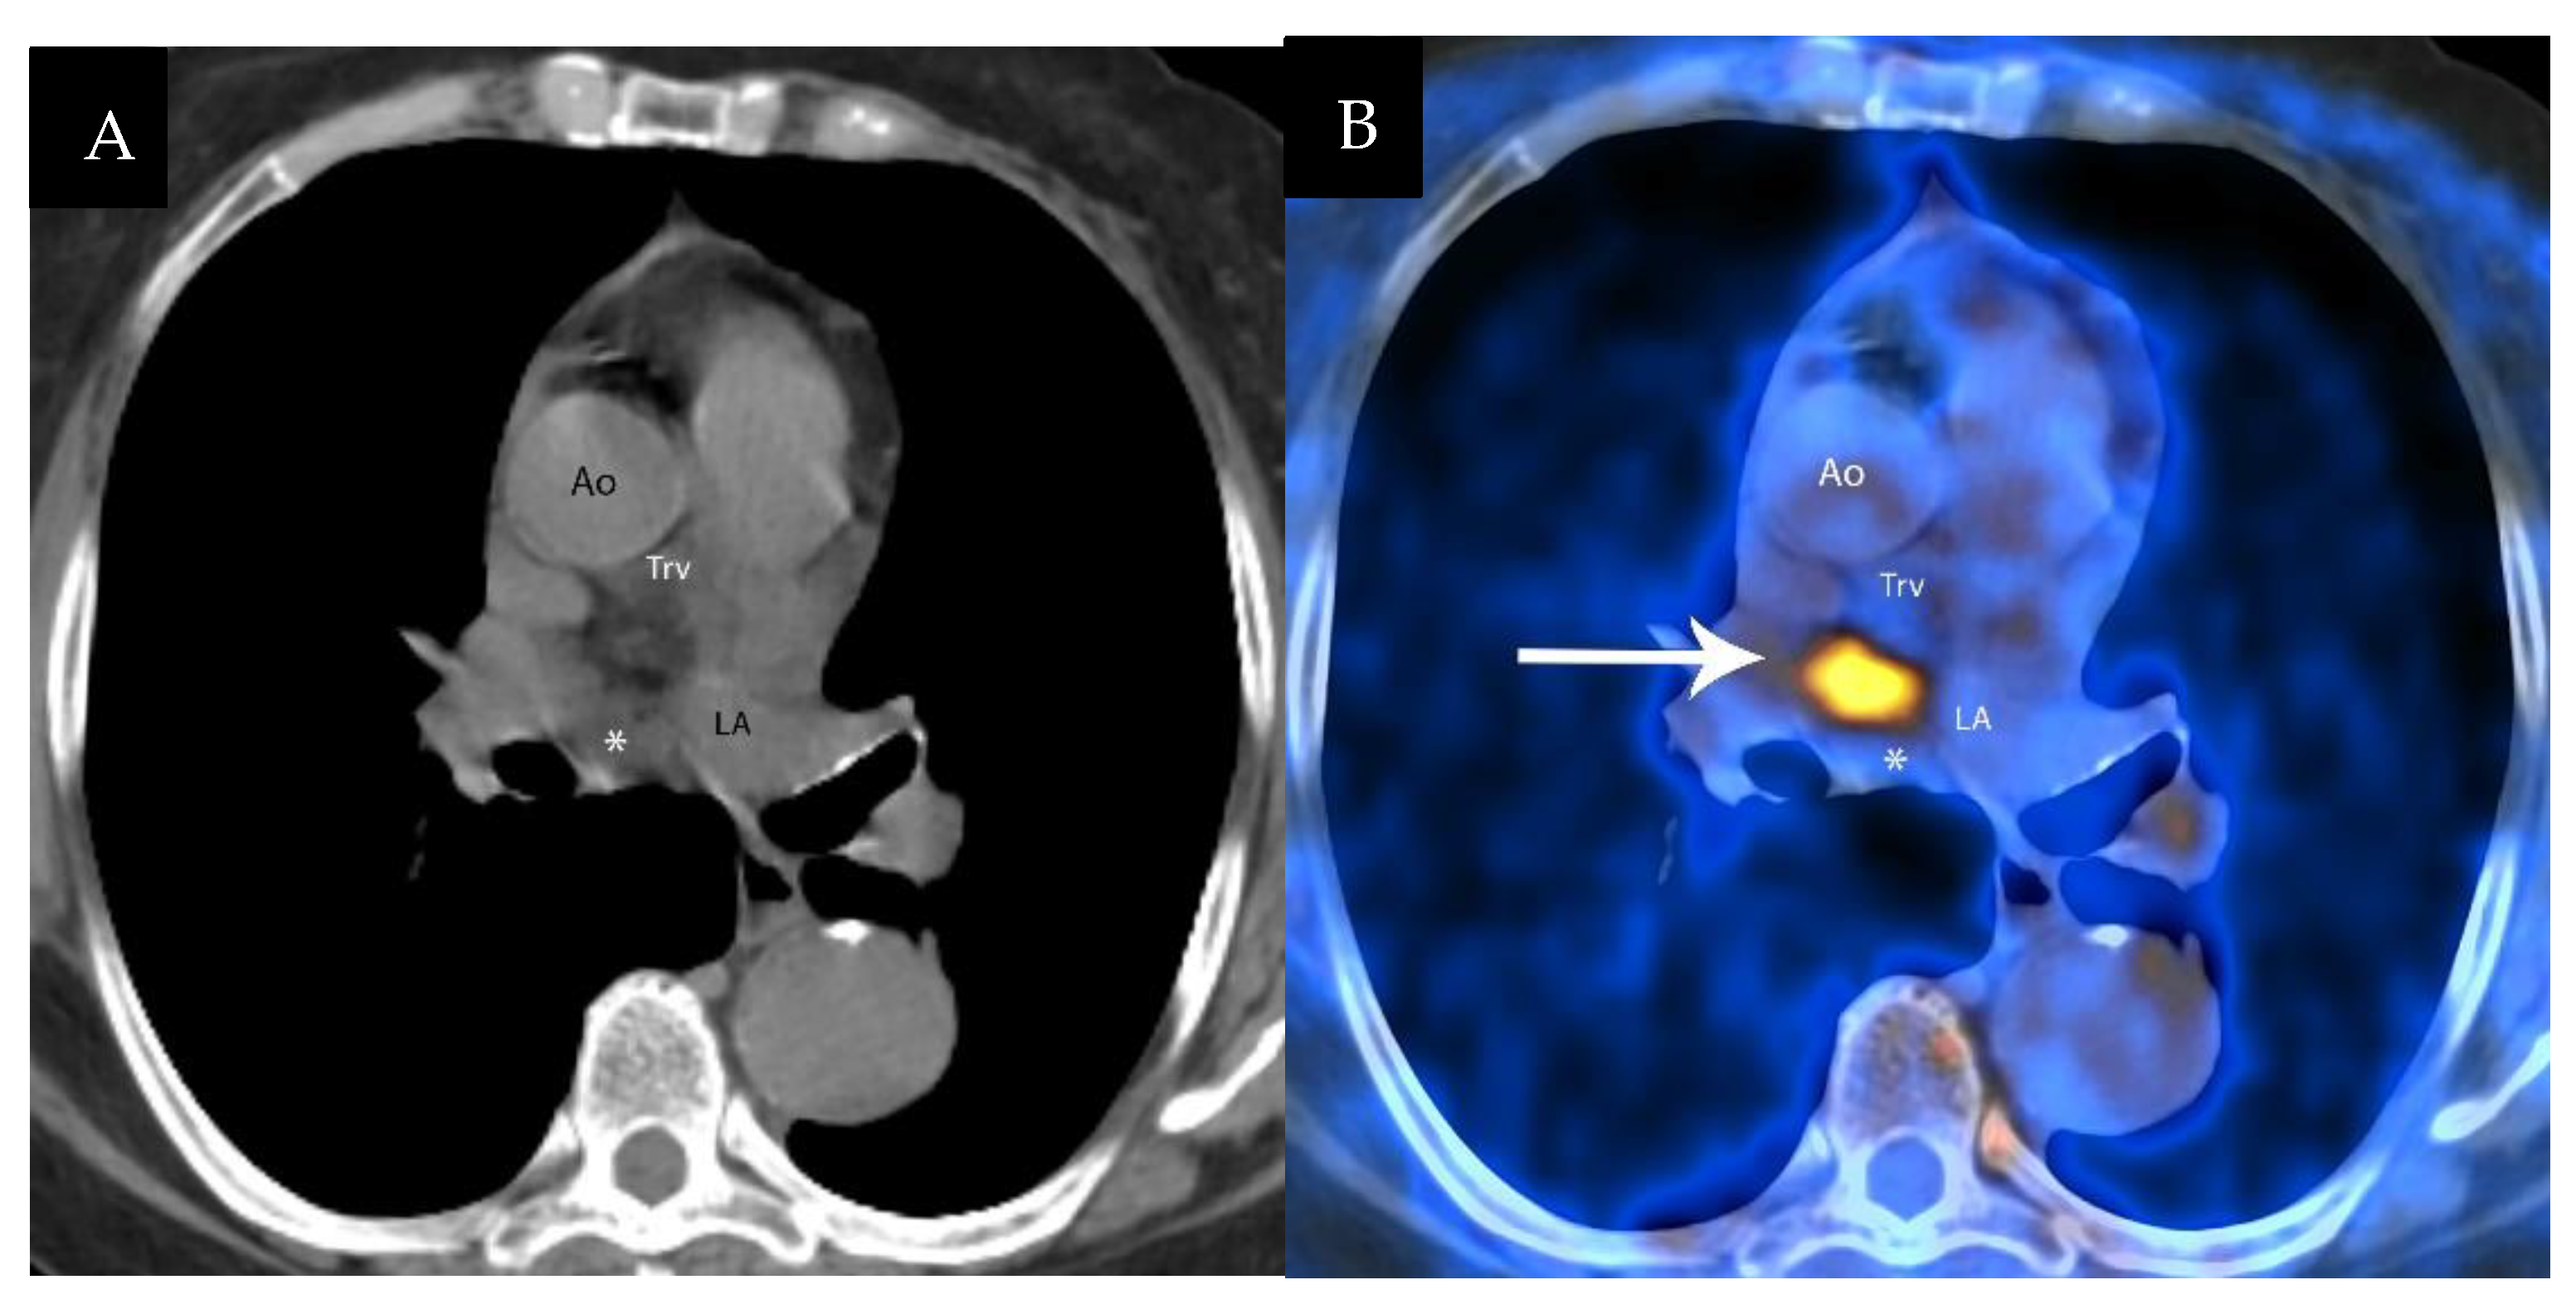
Figure 10.
Hypermetabolic brown fat mimicking nodal metastasis. 69 year-old woman with esophageal cancer. (A). Staging fused axial PET/CT shows FDG avid focus (arrow) in the mediastinum mimicking nodal metastasis. (B). CT with and without intravenous contrast localized the FDG activity to pericardial fat between the fluid in the transverse sinus (Trv) posterior to the aorta (Ao) and the oblique sinus (asterisk) posterior and superior to the left atrium (LA). Physiologic uptake due to hypermetabolic brown fat is a potential pitfall in PET/CT interpretation. Reprinted from Shroff G.S. et al. Pitfalls in oncologic imaging of the pericardium on CT and PET/CT [4].

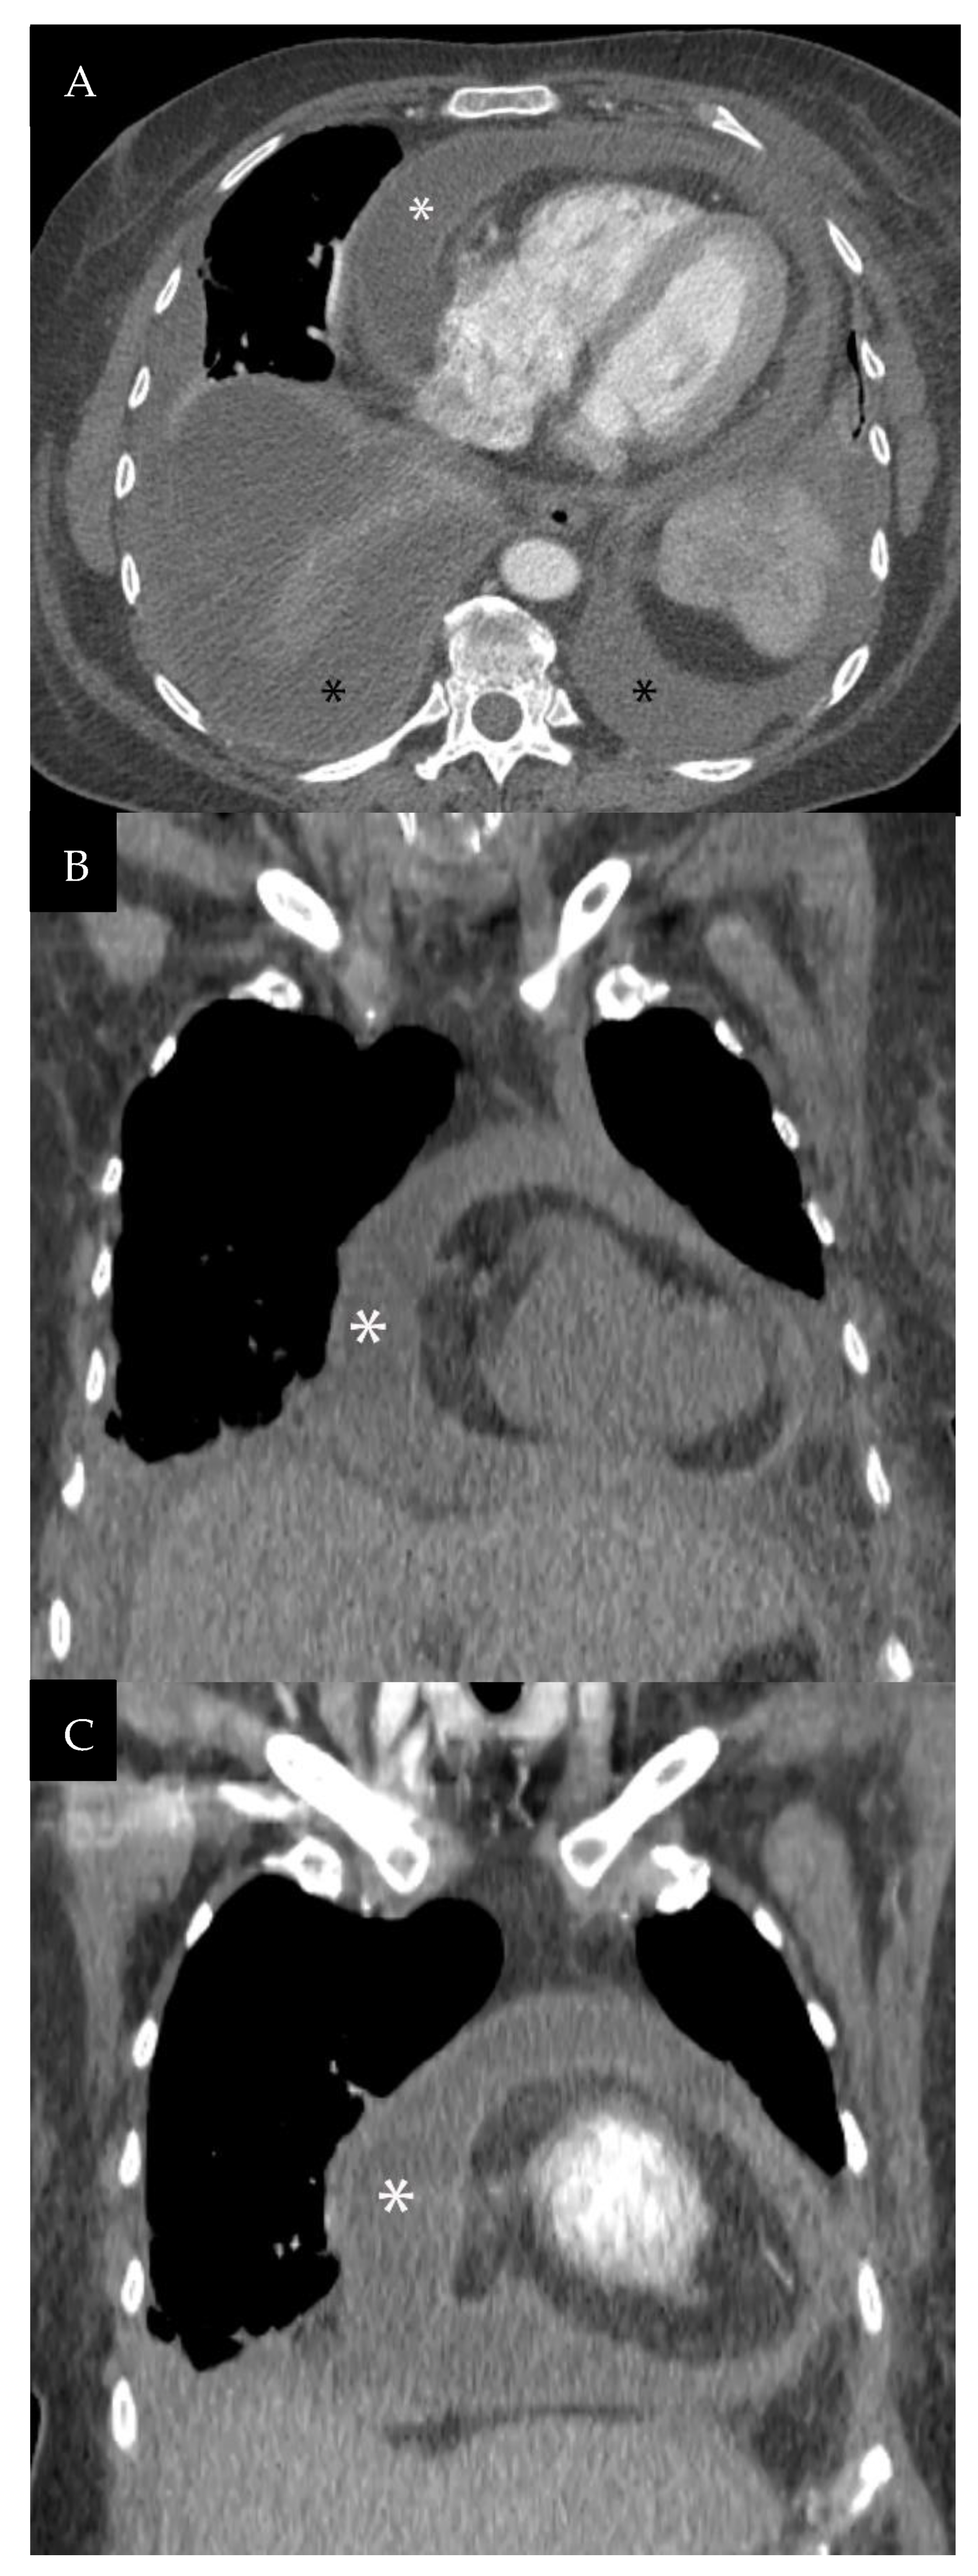
Figure 11.
Acute pericarditis mimicking malignant pericardial effusion. 63 year-old woman with multiple myeloma presents with septic shock. (A) Axial contrast enhanced CT, (B,C) coronal CT pre- and post- intravenous contrast show enhancing pericardial thickening measuring 4 mm in thickness and a moderate pericardial effusion (white asterisk). Note bilateral pleural effusions (black asterisks) and nodular right posterior pleural thickening. Analysis of the pericardial and right pleural effusions showed tuberculosis. Infectious inflammatory processes such as pericarditis and empyema can mimic metastatic disease. Reprinted from Shroff G.S. et al. Pitfalls in oncologic imaging of the pericardium on CT and PET/CT [4].

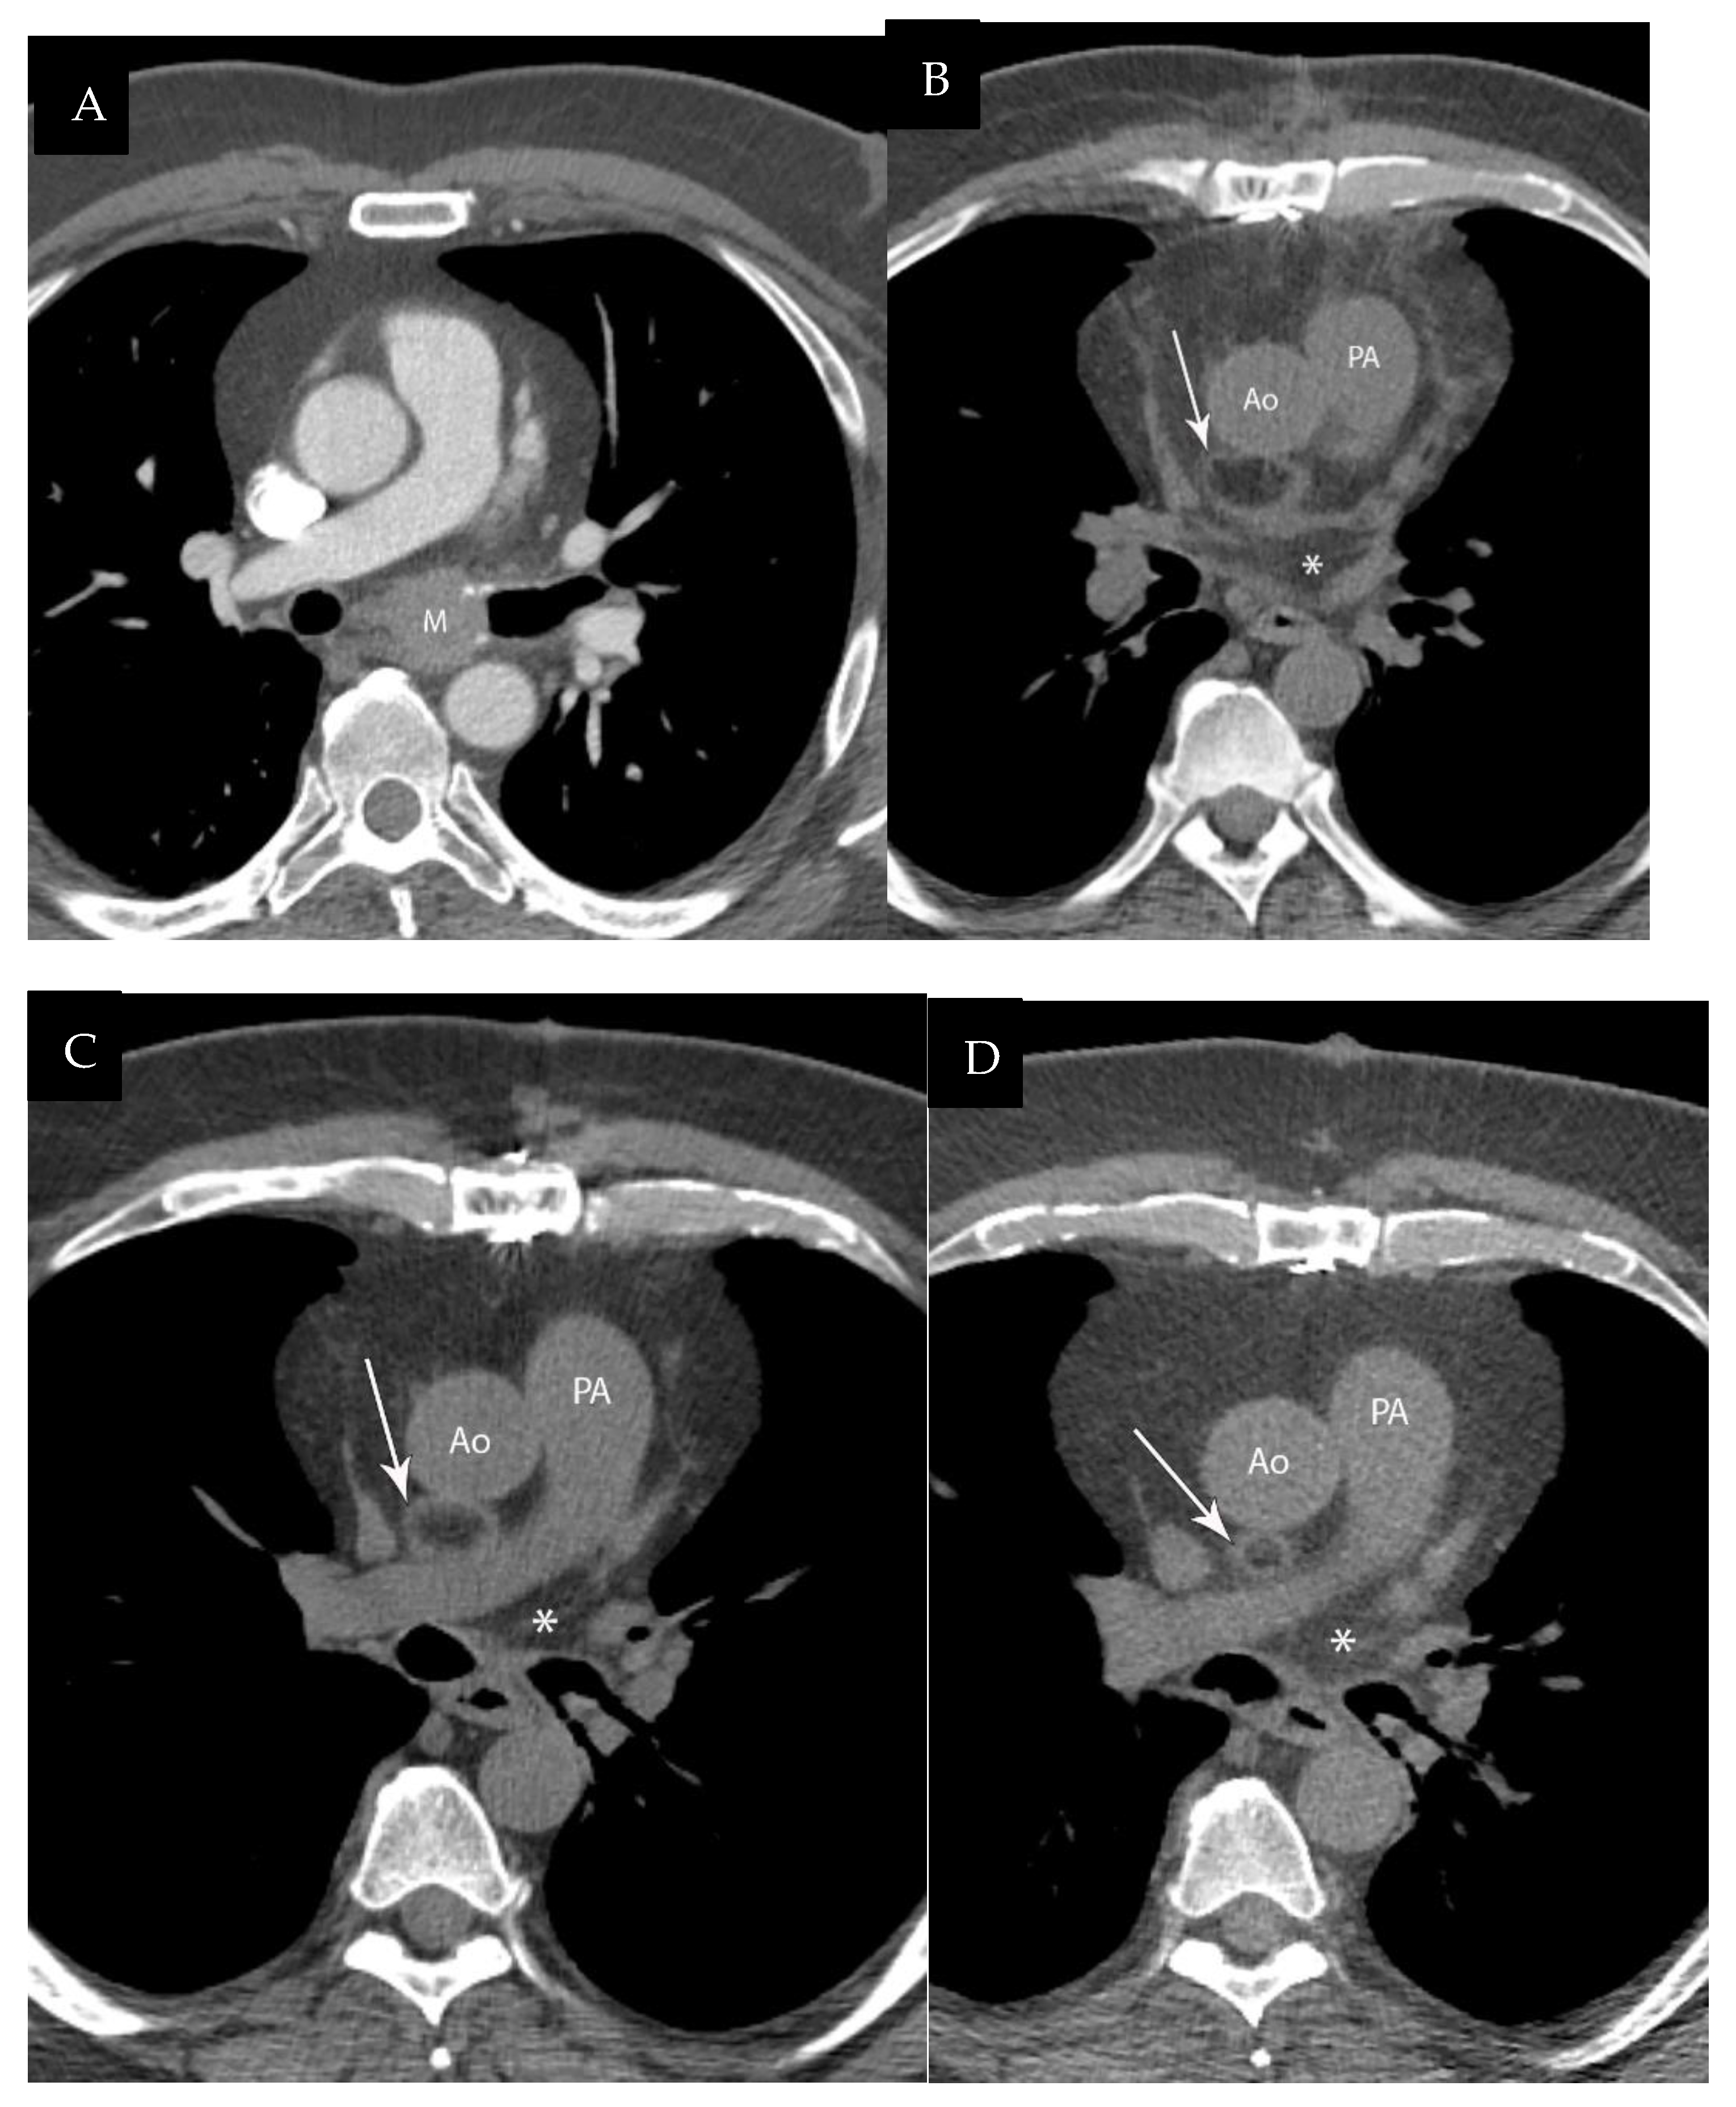
Figure 12.
Epi-pericardial fat necrosis following surgery. 57 year-old man. (A). Contrast enhanced CT shows the mucoepidermoid carcinoma (M) in the left main bronchus. The patient underwent median sternotomy to resect the tumor. (B). CT 4 months following surgery shows fat necrosis with typical fat and soft tissue core with a capsule in the superior aortic recess of the pericardial space (arrow) posterior to the aorta (Ao). PA= pulmonary artery. Note the fat in the oblique sinus of the pericardial space (asterisk). (C). CT 6 months and (D) CT 2 years later show the fat necrosis (arrow) regresses over time. Although patients with epi-pericardial fat necrosis can present with chest pain, this patient was asymptomatic. Reprinted from Shroff G.S. et al. Pitfalls in oncologic imaging of the pericardium on CT and PET/CT [4].

Publisher’s Note: MDPI stays neutral with regard to jurisdictional claims in published maps and institutional affiliations. |
© 2022 by the authors. Licensee MDPI, Basel, Switzerland. This article is an open access article distributed under the terms and conditions of the Creative Commons Attribution (CC BY) license (https://creativecommons.org/licenses/by/4.0/).
Share and Cite
MDPI and ACS Style
Archer, J.M.; Ahuja, J.; Strange, C.D.; Shroff, G.S.; Unlu, E.; Truong, M.T. Pericardial Recesses Mimicking Mediastinal Adenopathy on CT. J. Respir. 2022, 2, 87-100. https://doi.org/10.3390/jor2020007
AMA Style
Archer JM, Ahuja J, Strange CD, Shroff GS, Unlu E, Truong MT. Pericardial Recesses Mimicking Mediastinal Adenopathy on CT. Journal of Respiration. 2022; 2(2):87-100. https://doi.org/10.3390/jor2020007
Chicago/Turabian StyleArcher, John Matthew, Jitesh Ahuja, Chad D. Strange, Girish S. Shroff, Ebru Unlu, and Mylene T. Truong. 2022. "Pericardial Recesses Mimicking Mediastinal Adenopathy on CT" Journal of Respiration 2, no. 2: 87-100. https://doi.org/10.3390/jor2020007