Article

Evaluation of Impulse Oscillometry in Respiratory Airway Casts with Varying Obstruction Phenotypes, Locations, and Complexities

1
Department of Aerospace, Industrial, and Mechanical Engineering, California Baptist University, Riverside, CA 92504, USA
2
Department of Biomedical Engineering, University of Massachusetts, Lowell, MA 01854, USA
3
Sleep and Neurodiagnostic Center, Lowell General Hospital Saints Campus, Lowell, MA 01852, USA
4
Department of Epidemiology, Human Genetics and Environmental Sciences, School of Public Health, University of Texas Health Science Center, Houston, TX 77030, USA
*
Author to whom correspondence should be addressed.
J. Respir. 2022, 2(1), 44-58; https://doi.org/10.3390/jor2010004
Submission received: 16 December 2021 / Revised: 20 February 2022 / Accepted: 25 February 2022 / Published: 2 March 2022

Abstract

:
The use of impulse oscillometry (IOS) for lung function testing does not need patient cooperation and has gained increasing popularity among both young and senior populations, as well as in patients with breathing difficulties. However, studies of the IOS sensitivity to regional lung obstructions are limited and have shown mixed results. The objective of this study was to evaluate the performance of an IOS system in 3D-printed lung models with structural abnormalities at different locations and with different severities. Lung trees of two complexity levels were tested, with one extending to the sixth generation (G6) and the other to G12. The IOS responses to varying glottal apertures, carina ridge tumors, and segmental bronchial constrictions were quantified in the G6 lung geometry. Both the G6 and G12 lung casts were prepared using high-resolution 3D printers. Overall, IOS detected the progressive airway obstructions considered in this study. The resonant frequency dropped with increasing obstructions for all three disease phenotypes in the G6 lung models. R20Hz increased with the increase in airway obstructions. Specifically, R20Hz in the airway model with varying glottal apertures agreed reasonably well with complementary measurements using TSI VelociCalc. In contrast to the high-resistance (R) sensitivity to the frequency in G6 lung models, R was nearly independent of frequency in G12 lung models. IOS R20Hz demonstrated adequate sensitivity to the structural remodeling in the central airways. However, the changes of R5Hz and X5Hz vs. airway obstructions were inconclusive in this study, possibly due to the rigid lung casts and the difference of a container–syringe system from human lungs.

1. Introduction

Regional lung structural remodeling and obstruction can notably alter respiratory airflows and the subsequent deposition distribution of orally inhaled drug products [1,2,3]. Since the delivered dose on the target tissue is key to therapeutic outcomes, a suboptimal dose can greatly compromise the efficacy, even though the total lung dose is the same. Ruffin et al. [4] demonstrated that a targeted dose of histamine to the central airways is as effective as a dose 10 times larger if delivered diffusely to elicit airway constrictions. This is because the histamine receptors that stimulate glandular secretion and smooth muscle contraction have a higher concentration in the submucosal glands of the central airways [5]. By contrast, 90% of β-receptors are found in the acinar region [6]. As a result, β-agonists need to be delivered to the acinar region for optimal outcomes.
An oscillometry system (including IOS) uses small amplitude oscillations over a range of frequencies to probe the mechanical properties of the respiratory system and their variations during normal breathing [7,8,9]. The respiratory system consists of the upper airway (mouth–throat), conducting lungs (G0–G16), and pulmonary acini (or alveoli). Each region has its unique geometry, tissue properties, and kinematics. When airflows travel through these regions, their responses can be theoretically described using a linear system of resistance (R), compliance (C), and inertia (I), i.e., a single compartment model. Thus, the impedance of the respiratory system can be thought of as a complex combination of individual compartmental models arranged either in a series or in parallel. The compartmental models have been shown to work reasonably well for healthy lungs. However, it does not describe well the impedance vs. frequency in disease, since the resistance can be frequency-dependent due to disease-induced flow heterogeneity [10,11,12,13,14]. Moreover, lung diseases can occur in different regions with varying severities and phenotypes, so it is challenging to study how regional airway remodeling contribute differently to the overall impedance [15,16].
To evaluate the utility of the IOS for probing regional lung function changes after inhalation therapies, knowledge of the IOS sensitivity to the regional airway remodeling is needed. However, the IOS outputs are integrative properties that contain contributions from the airflow, lung tissues, and the chest wall (rib cage and diaphragm). Usually, one change in the lungs is accompanied by some changes in other parameters, making it difficult to evaluate the sensitivity of an individual parameter [1,2]. To do so, it is desirable to vary one certain parameter only while keeping other parameters unchanged. In this study, we used 3D-printed lung casts with regional structural remodeling as test subjects and evaluated their effects on IOS outputs, which was hypothesized to minimize the confounding factors.
The IOS system has been frequently suggested as an alternative tool to evaluate lung function variations after inhalation therapies due to its characteristics of noninvasiveness and no requirement for patient coordination [17,18]. While IOS testing has been demonstrated to be reliable in small airway disease diagnosis, its accuracy in detecting obstructions in large airways is unclear [19,20,21,22]. The objective of this study is to experimentally evaluate the performance of an impulse oscillometry system in 3D-printed lung casts with controlled airway obstructions. Lung casts of two complexity levels will be used, with one retaining the branching bifurcations up to the sixth generation (G6) and the other retaining up to the twelfth generation (G12). The G6 lung geometry will be modified to generate three types of airway structural remodeling due to (1) the glottal aperture (A), (2) the carina ridge tumor (T), and (3) the segmental bronchial constriction (B). Each remodeling phenotype consists of multiple variants that represent the progression of the airway obstruction. By comparing the IOS measured the resistance (R) and reactance (X) in airway models with controlled airway obstructions and geometrical complexities, a better understanding of the correlation between the IOS outputs and regional lung function can be obtained.

2. Materials and Methods

2.1. Study Design

The experimental setup was shown in Figure 1a, which consisted of an IOS system (CareFusion, Yorba Linda, CA, USA), a respiratory tract model, a syringe pump, and a computer. The respiratory model consisted of a mouth–lung cast and a plastic container, with the mouth being connected to the IOS system while the container was connected to the syringe pump, both through a flexible adaptor for good sealing. The syringe pump was used to simulate cyclic breathing, which had an opening diameter of 13 mm and a tubular volume of 3 L.
The right panel of Figure 1b shows the respiratory model that consists of a mouth–throat geometry, a hollow lung cast extending to the sixth branching generation (G6), and a 5-L plastic container that represents lung parenchyma. This lung cast was prepared using a 3D printer (Stratasys Objet30 Pro, Northville, MI, USA) with the printing material being polypropylene (Veroclear, Northville, MI, USA). The interface between the trachea and the container cap was well-sealed with playdoh to prevent airflow leakage through this interface. This G6 lung cast was used as the control case, based on which different disease models were built, as demonstrated in Figure 1c.
The G6 lung cast could be replaced by a lung model that extended up to the twelfth generation (G12) and retained 1126 outlets (the 2nd panel of Figure 1b). A zoomed-out view of the bronchial outlets in the left lower lobe of the G12 lung cast is shown in the left panel of Figure 1b. The average diameter of these outlets was 0.98 mm [23]. Note that the G12 lung cast had a variable wall thickness as opposed to the constant thickness in the G6 lung and mouth-through casts. In this G12 model, the wall thickness was 0.35 of the circumferential diameters of the branches throughout the geometry.
There were three groups of variants based on the G6 lung model (Figure 1c). The first group considered the effects from the carina ridge tumor, which included the control (T0, no tumor), a small tumor (T1), and a large tumor (T2). The second group considered the influences from constricted bronchi in the left upper lobe, including the control (B0, same as T0, no tumor, no constriction) and three progressively constricted bronchi (i.e., B1–3) in the left upper lobe. A transparent view of the B3 cast, as well as the T1 and T2 casts, is shown in Figure 1c. The third group considered the glottal aperture effects and included four variants (GA1–4) besides the control (GA0), with GA1 having the minimum aperture and GA4 the maximum.
The IOS endpoints were compared to complementary computational fluid dynamics (CFD) simulations in the same airway model. Specifically, the IOS R20Hz (resistance at 20 Hz) was compared to the VelociCalc-measured pressure drop, as well as to CFD predictions. The significance could be twofold: (1) to validate the CFD model and (2) to evaluate the IOS endpoint sensitivity to airway obstructions of different phenotypes, at different locations, and with different extents.

2.2. IOS Testing Platform

2.2.1. Testing Procedures

An IOS system (CareFusion, Yorba Linda, CA, USA) was used to test in vitro airway models. The lung cast was put in a 5-L plastic container that approximated lung parenchyma. The mouth-opening was then connected to the IOS system via a flexible adaptor, and the plastic container was connected to the syringe pump (Figure 1a). Soap water was used to check whether there was any air leakage before testing and would be resealed if so. We observed that even a small amount of air leakage would skew the IOS endpoints and worsen the data reproducibility. Calibration of the IOS system was performed before data acquisition. After calibration, two operators would coordinate to conduct the IOS testing, with one controlling the IOS system and the other operating the syringe pump who moved the handle as consistently as possible for 4–6 strokes. During the test, the CareFusion IOS system monitored the quality of the collected data in each breathing cycle and automatically determined how many cycles were needed to finish the data collection. A syringe pump was used for both calibration and testing to drive the tidal breathing through the respiratory model. To ensure test repeatability, the same tests was conducted on five different days. Minitab 18 (State College, PA, USA) was applied to quantify the variability of the IOS measurements using the method of one-way analysis of variance (ANOVA).
Minimizing extraneous compounding artifacts is essential to ensure in vitro cast testing to best simulate human lung physiology. In addition to device calibration each time before testing, extra care was exercised to ensure the repeatability of the IOS endpoints measured with different lung cast models. The mouth opening and the IOS device were connected using a flexible adaptor that fit seamlessly with the mouth. The connection between the container and the lung cast (with the interface at the middle trachea), as well as that between the container and the syringe pump, was sealed with sealant. Soap water was applied around the connections to ensure no leakage at the connections before testing. We have observed large variances if leakage occurred.

2.2.2. IOS Governing Equations

IOS outputs include R5hz (resistance at 5 Hz), R20Hz, X5Hz (reactance at 5 Hz), f0 (resonant frequency), and AX5 (reactance area). Their values can be derived from the resistance–frequency (Rf) and reactance–frequency (Xf) curves, which are calculated from the reactive pressures sampled at the mouth opening. The reaction of pressure to flow variations can be modeled with three constituents, i.e., the resistance (R), inertia (I), and compliance (C), which describes the pressure–velocity, pressure–acceleration, and pressure–volume relationships, respectively. The inertial portion is positive and increases with frequency, while the capacitive portion is negative and decreases with frequency, as shown below:
Z = R + j X = R + j ω I 1 ω C
where Z is the impedance, and ω = 2πf is the oscillation frequency in radians.

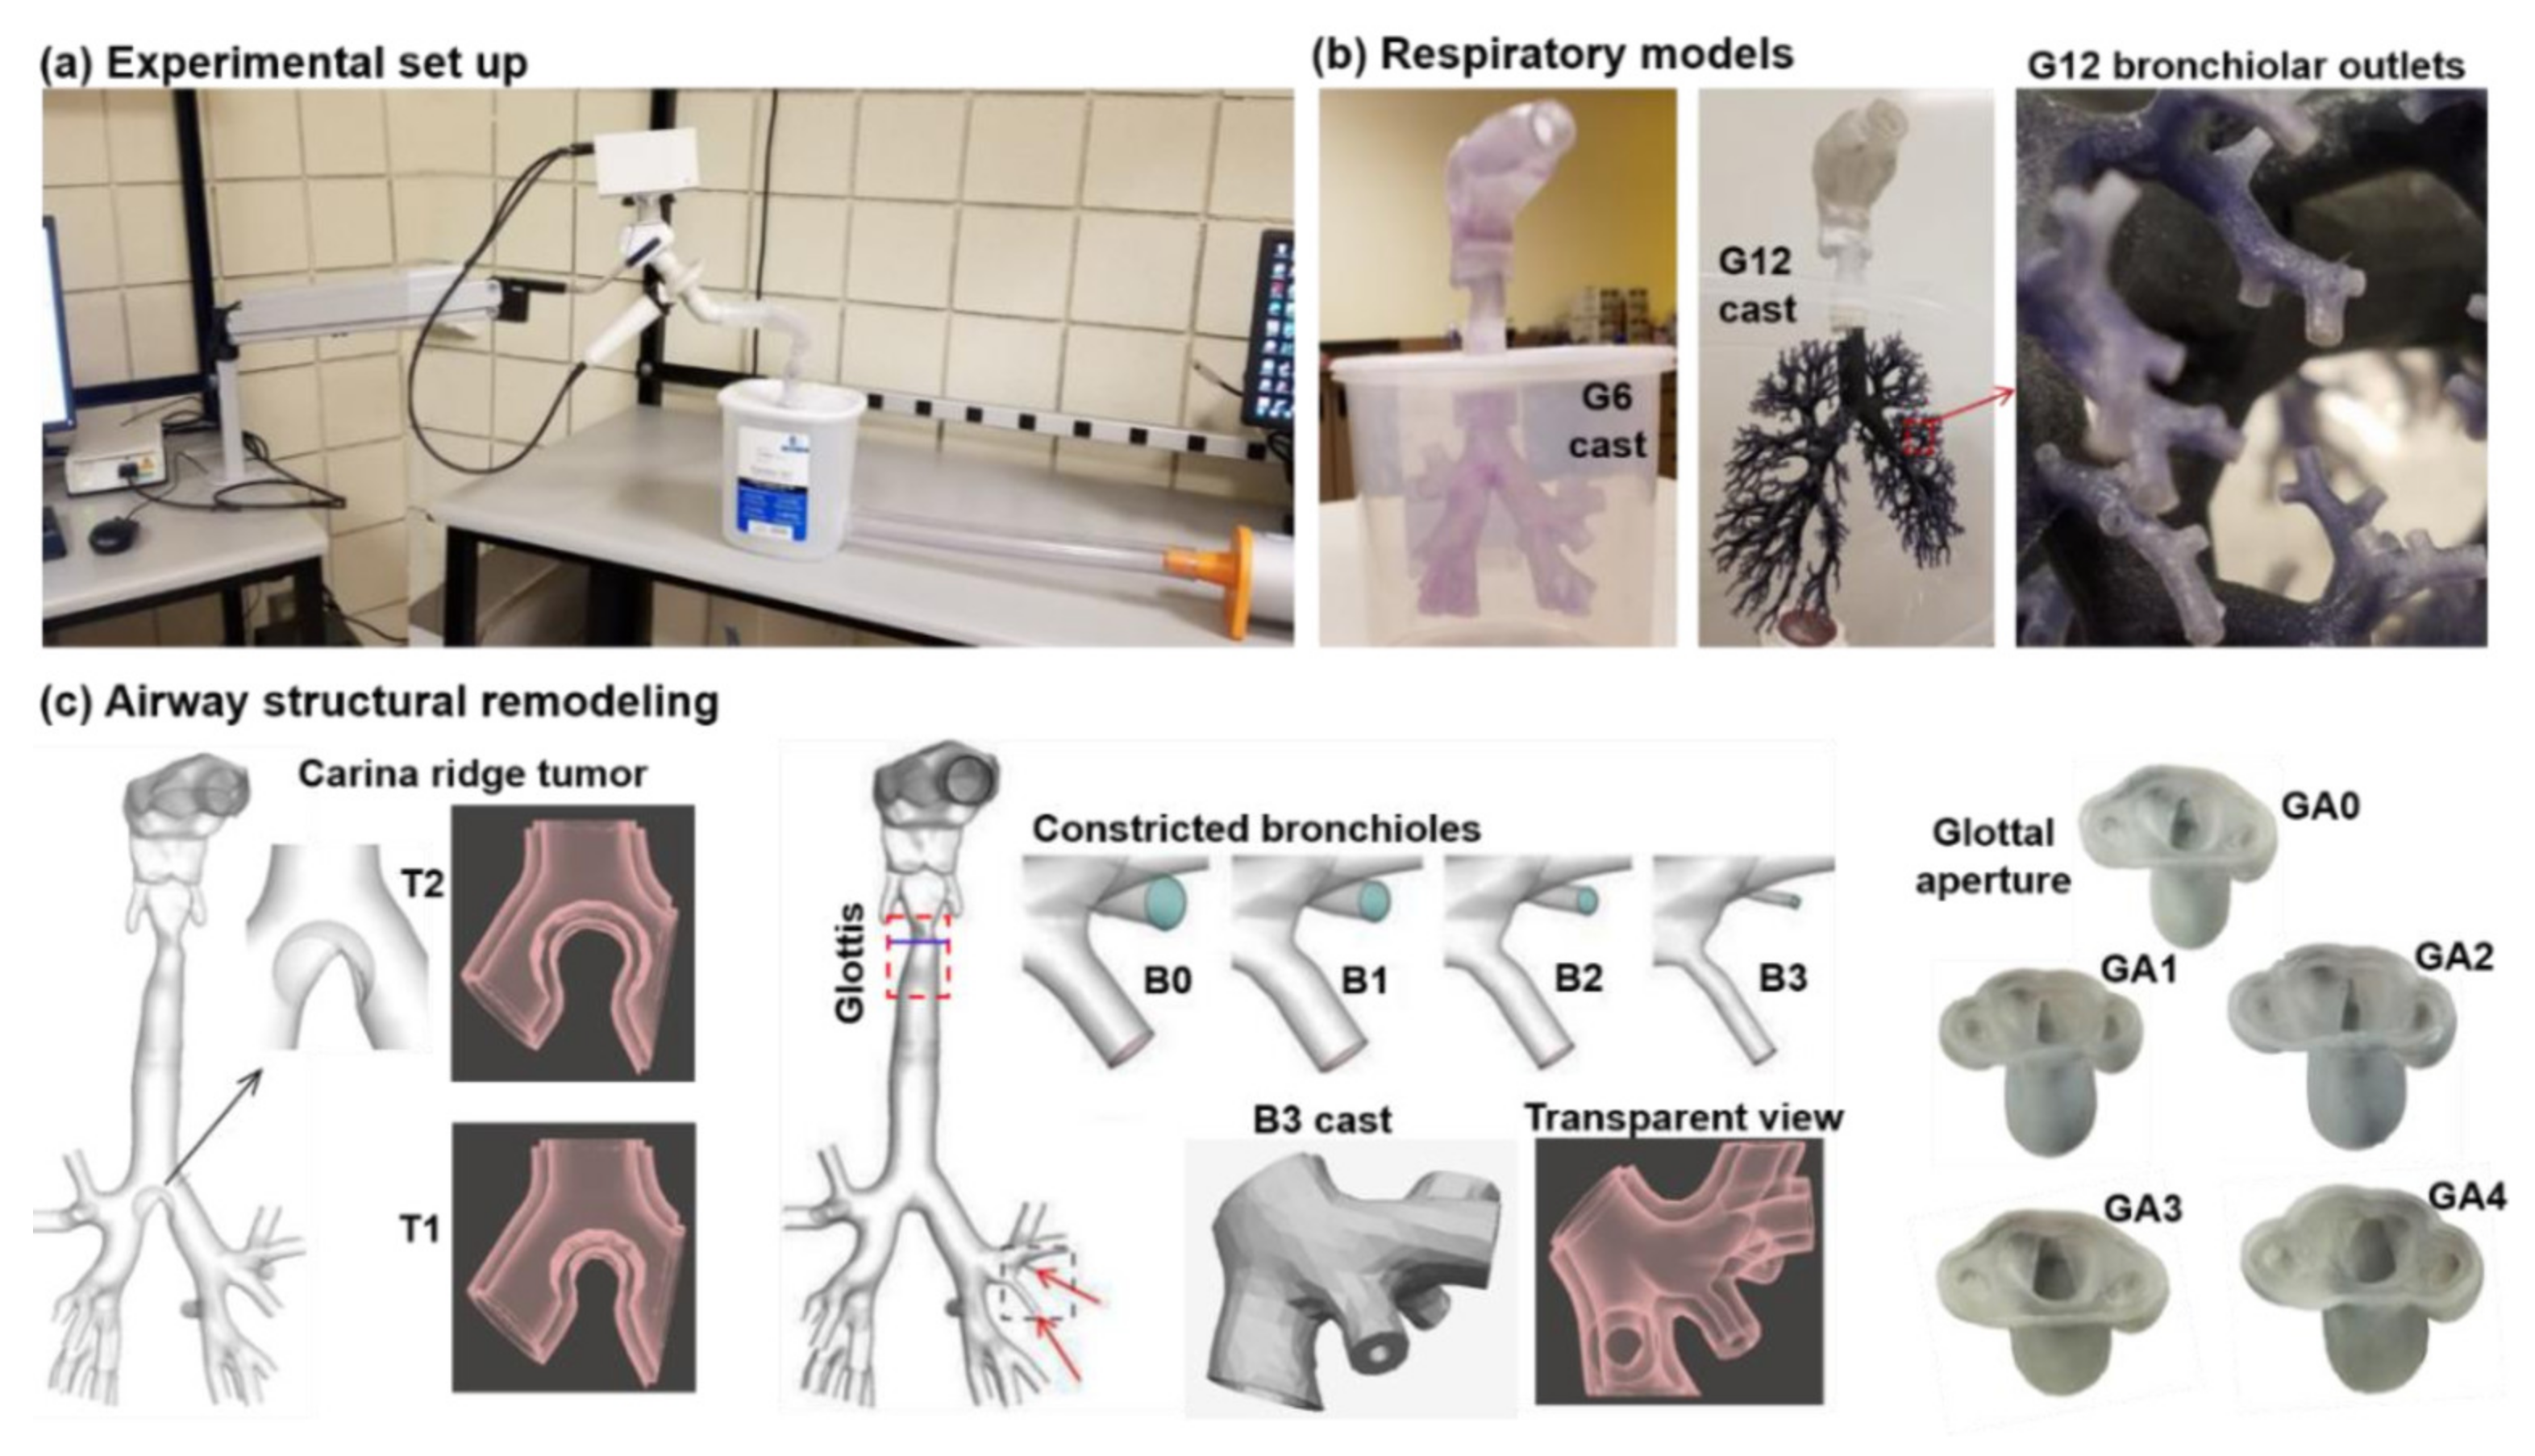
2.3. Airway Models with Controlled Abnormalities

The G6 model consisted of the oral cavity, pharyngolaryngeal airway, and upper tracheobronchial region, which had been reconstructed from three different image databases [24]. The oral cavity was developed from a dental impression reported by Cheng et al. [25], the pharyngolaryngeal airway from CT scans of a healthy adult (53-year-old male) [26], and the tracheobronchial region from a lung cast that was originally prepared postmortem from a 34-year-old man by Cohen et al. [27]. The three parts were connected with appropriate scaling and in agreement with the population means of an average adult male. Our previous studies have numerically simulated different airway abnormalities in the G6 lung geometry. These include a carina ridge tumor [28,29], constricted segmental bronchi (G3) [30], and glottal apertures [31], as shown in Figure 1c. The software Magics (Materialise, Ann Arbor, MI, USA) was used to convert the surface geometries into hollow cast computer models. A Stratasys Objet30 Pro 3D printer (Northville, MI, USA) was used to prepare the physical hollow cast replicas with different airway obstructions in the G6 lung. The printing material is polypropylene (Veroclear, Northville, MI, USA).
The G12 lung geometry was developed mathematically using in-house software Lung4CerE [32,33,34]. It retained around 3200 branches and had 1126 outlets, with the average outlet diameter being 0.98 mm. Due to these much finer anatomical details, a different 3D printer, PolyJet J750 (Stratasys Ltd., Valencia, CA, USA), was employed to fabricate the hollow cast of the G12 lung (the second panel, Figure 1b). Besides having a fine printing layer thickness of 14 µm, PolyJet J750 used wax as the support material, which would evaporate in an oven and leave the fragile hollow distal bronchioles intact.

2.4. Experimental Pressure Measurements

A TSI 9565 VelociCalc ventilation meter (Shoreview, MN, USA) was utilized to sample the pressure gradient in the G6 lung casts at different sites along the mean flow direction. At each site, the pressure was measured five times to obtain its average and variance [35,36]. To study the glottal aperture effects, five variants of the throat model (GA0–4, Figure 1c) were measured and compared to the complementary IOS testing and numerical simulations. Considering that each cast model consisted of multiple parts, a step-shaped groove was created at the interface of two mating parts to achieve accurate assembly and good sealing [37].

2.5. Flow Simulations and Numerical Methods

The multi-regime flows in the respiratory tract were resolved using a large eddy simulation (LES) for its accuracy in capturing the vortex dynamics and laminar-to-turbulent transitions [38,39]:
ρ ¯ t + ρ ¯ u ˜ i x i = 0 ,         ρ ¯ u ˜ i t + ρ ¯ u ˜ i u ˜ j x j = p ¯ x i + σ ¯ i j x j τ i j x j
where u ˜ i is the spatially filtered velocity, ρ ¯ is the filtered density, and τij is the sub-grid-scale stress tensor computed using the wall-adapting local eddy-viscosity (WALE) algorithm [38]. The cyclic respiration flow and vortex dynamics were simulated using ANSYS Fluent 19.1 (Canonsburg, PA, USA). The computational mesh was created using ICEM CFD. To resolve the boundary layer flows, five layers of prismatic cells were created in the near-wall region throughout the mouth–lung geometry, and the first layer had a height of 0.05 mm. The grid-independent results were obtained at 2.4 million computational cells by comparing six meshes from 650 k million to 3.6 million [40].

3. Results

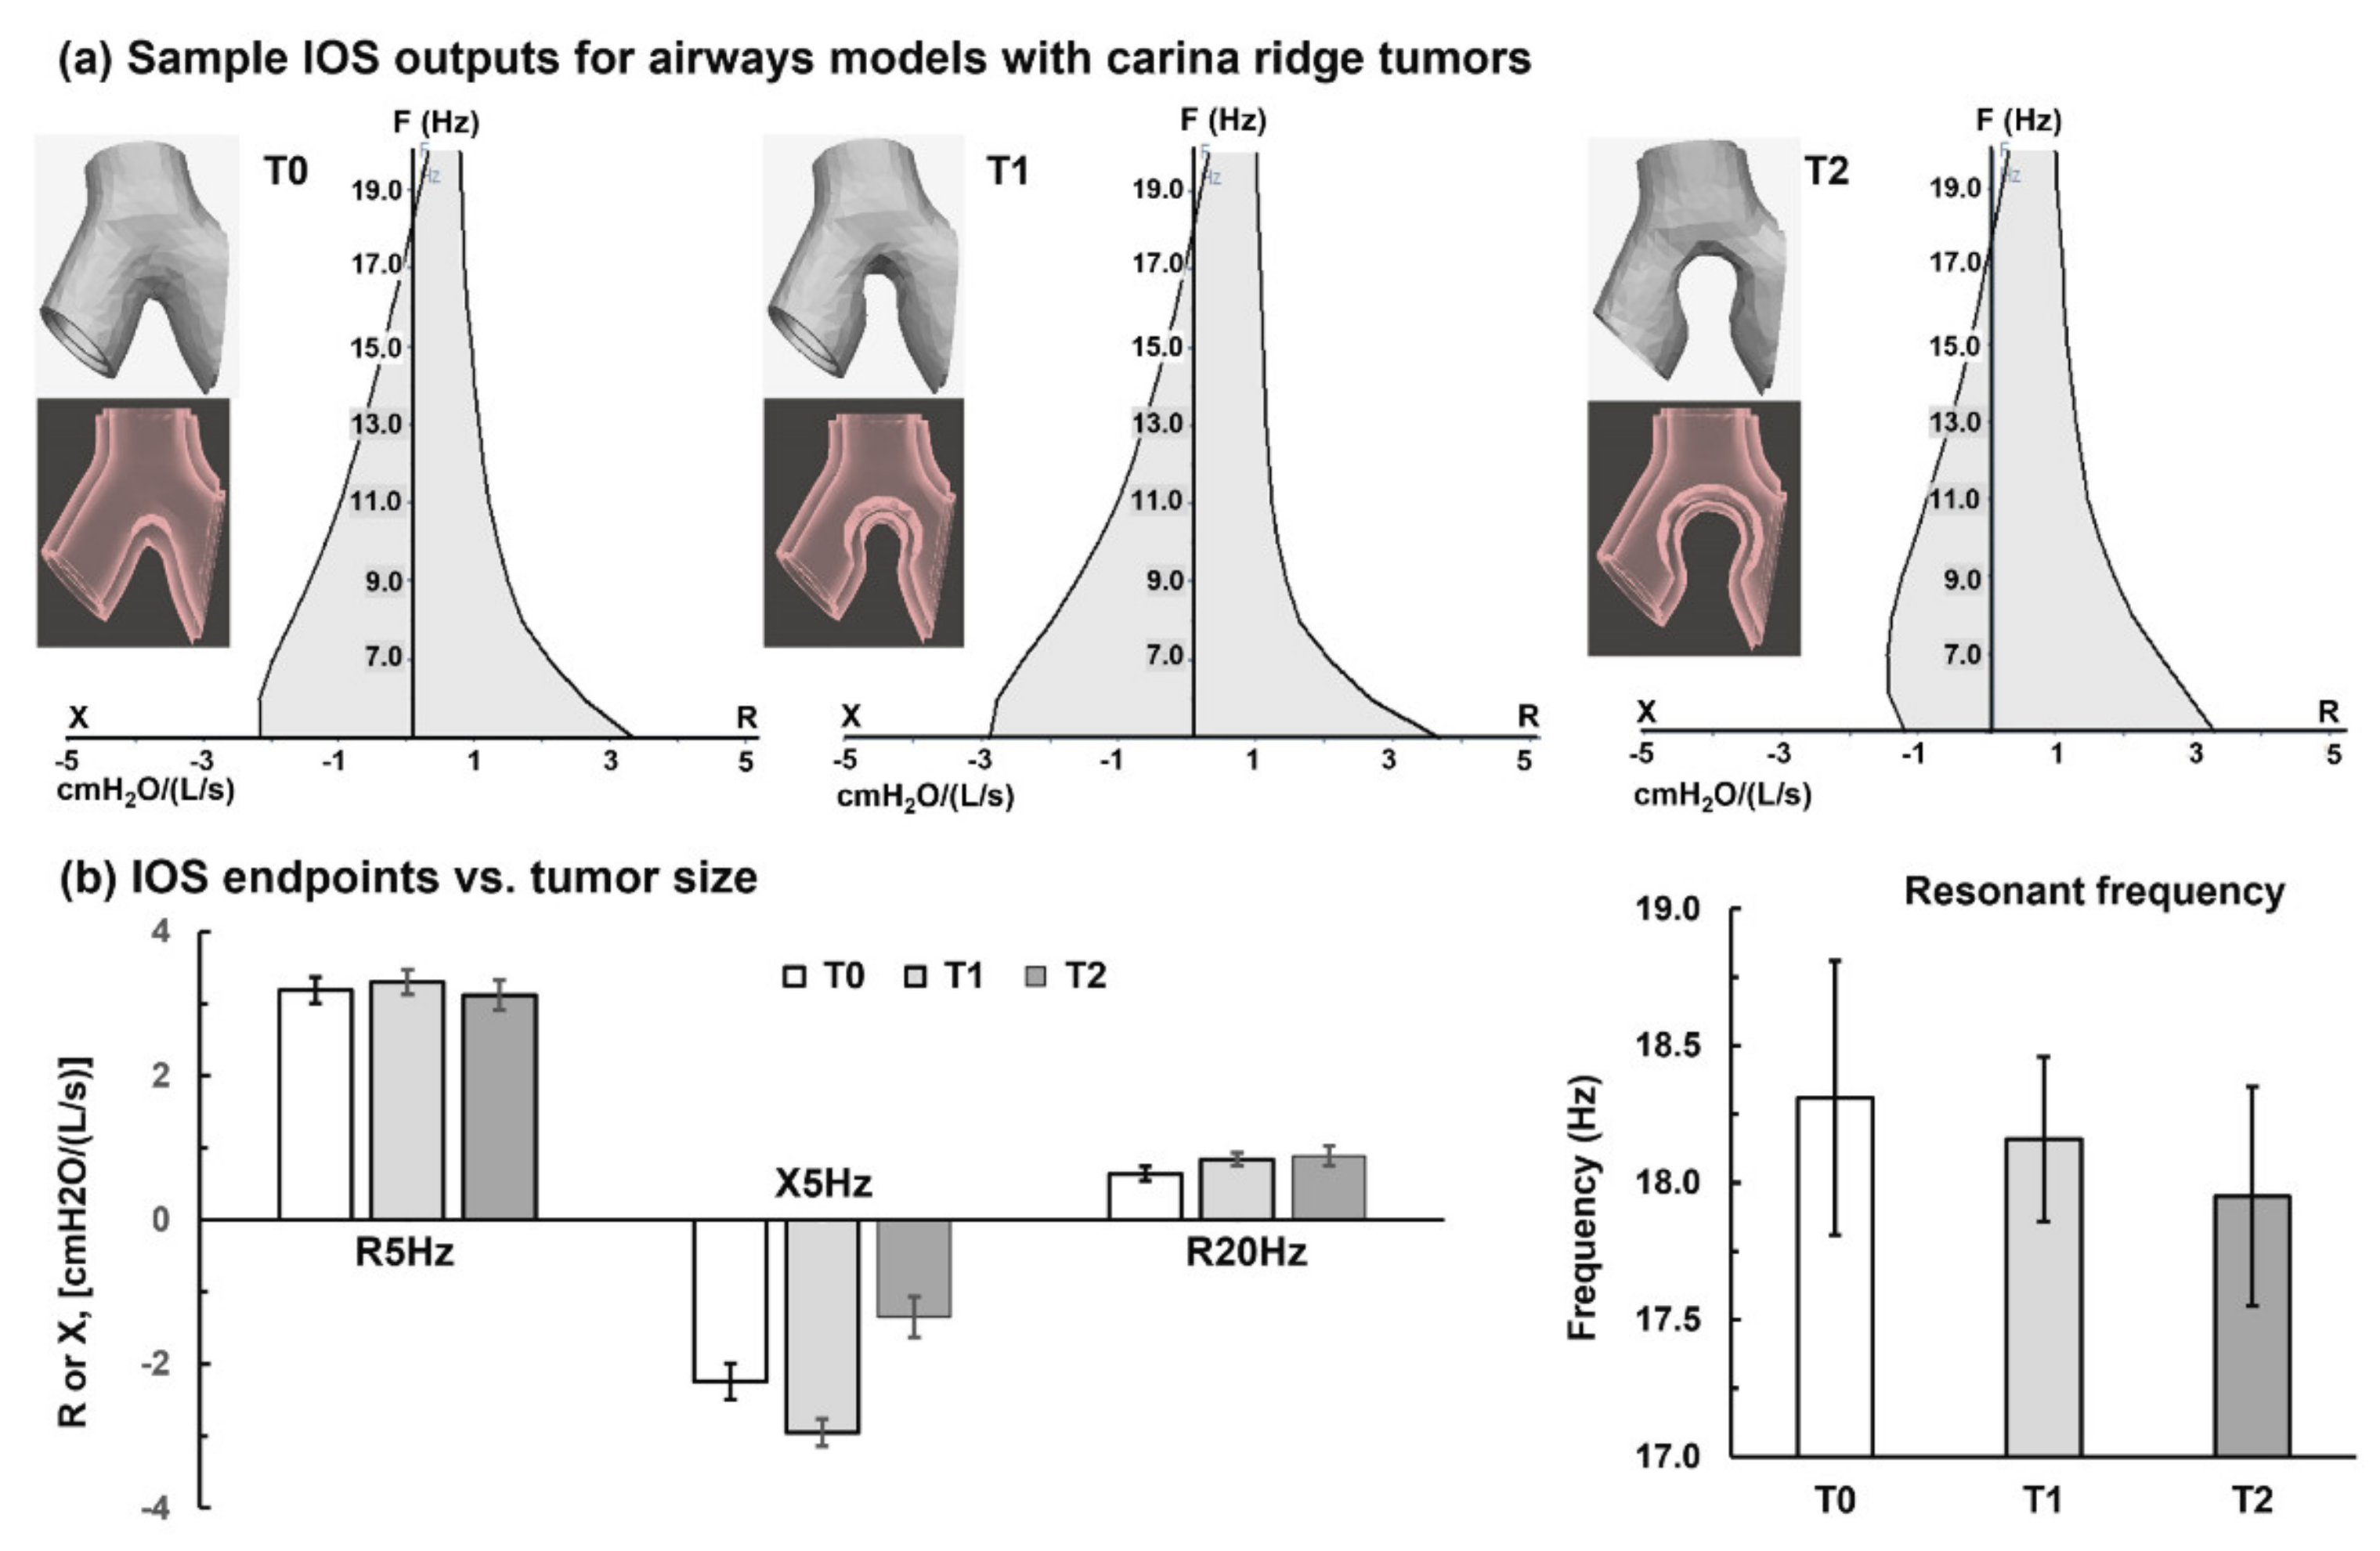
3.1. Carina Ridge Tumor

The screenshots of the IOS outputs with T0–2 are shown in the three panels in Figure 2a, respectively. The graphs display the reactance–frequency curve to the left and the resistance–frequency curve to the right, with the frequency plotted in y-coordinates ranging from 5 Hz to 20 Hz. This format was chosen due to its conciseness that presented both the resistance and reactance in one figure [8]. Table 1 shows the endpoint quantities of T0 (i.e., G6 lung with no tumor and no constriction), indicating specific resistance and reactance values at specific frequencies in different trials. These quantities include R5Hz, X5Hz, R20Hz, and the resonant frequency (Fres. or f0). For each parameter, the reference value (Ref), the upper and low limits of normal (ULN and LLN), the percentage relative to the reference (%Ref), and the best measurements among the trials (Best) are also shown in Table 1. The reference values in Table 1 were provided by the manufacturer (CareFusion) for a typical adult and were the same for all tests in this study [41]. The “Best” in Table 1 are the best trial results from multiple trials determined by the algorithm of the CareFusion IOS system.
From Figure 2a,b, there is an insignificant change in R5Hz among T0–2. By contrast, R20Hz increases with the increasing tumor size from T0 to T2 while the resonant frequency decreases with the tumor size (Figure 2b). A consistent profile is not observed for X5Hz (Figure 2b); however, AX5 (i.e., the area to the left of the y-coordinate) appears to decrease progressively (Figure 2a). The relatively small standard derivation (SD) in Figure 2b indicates the high repeatability of the tests.

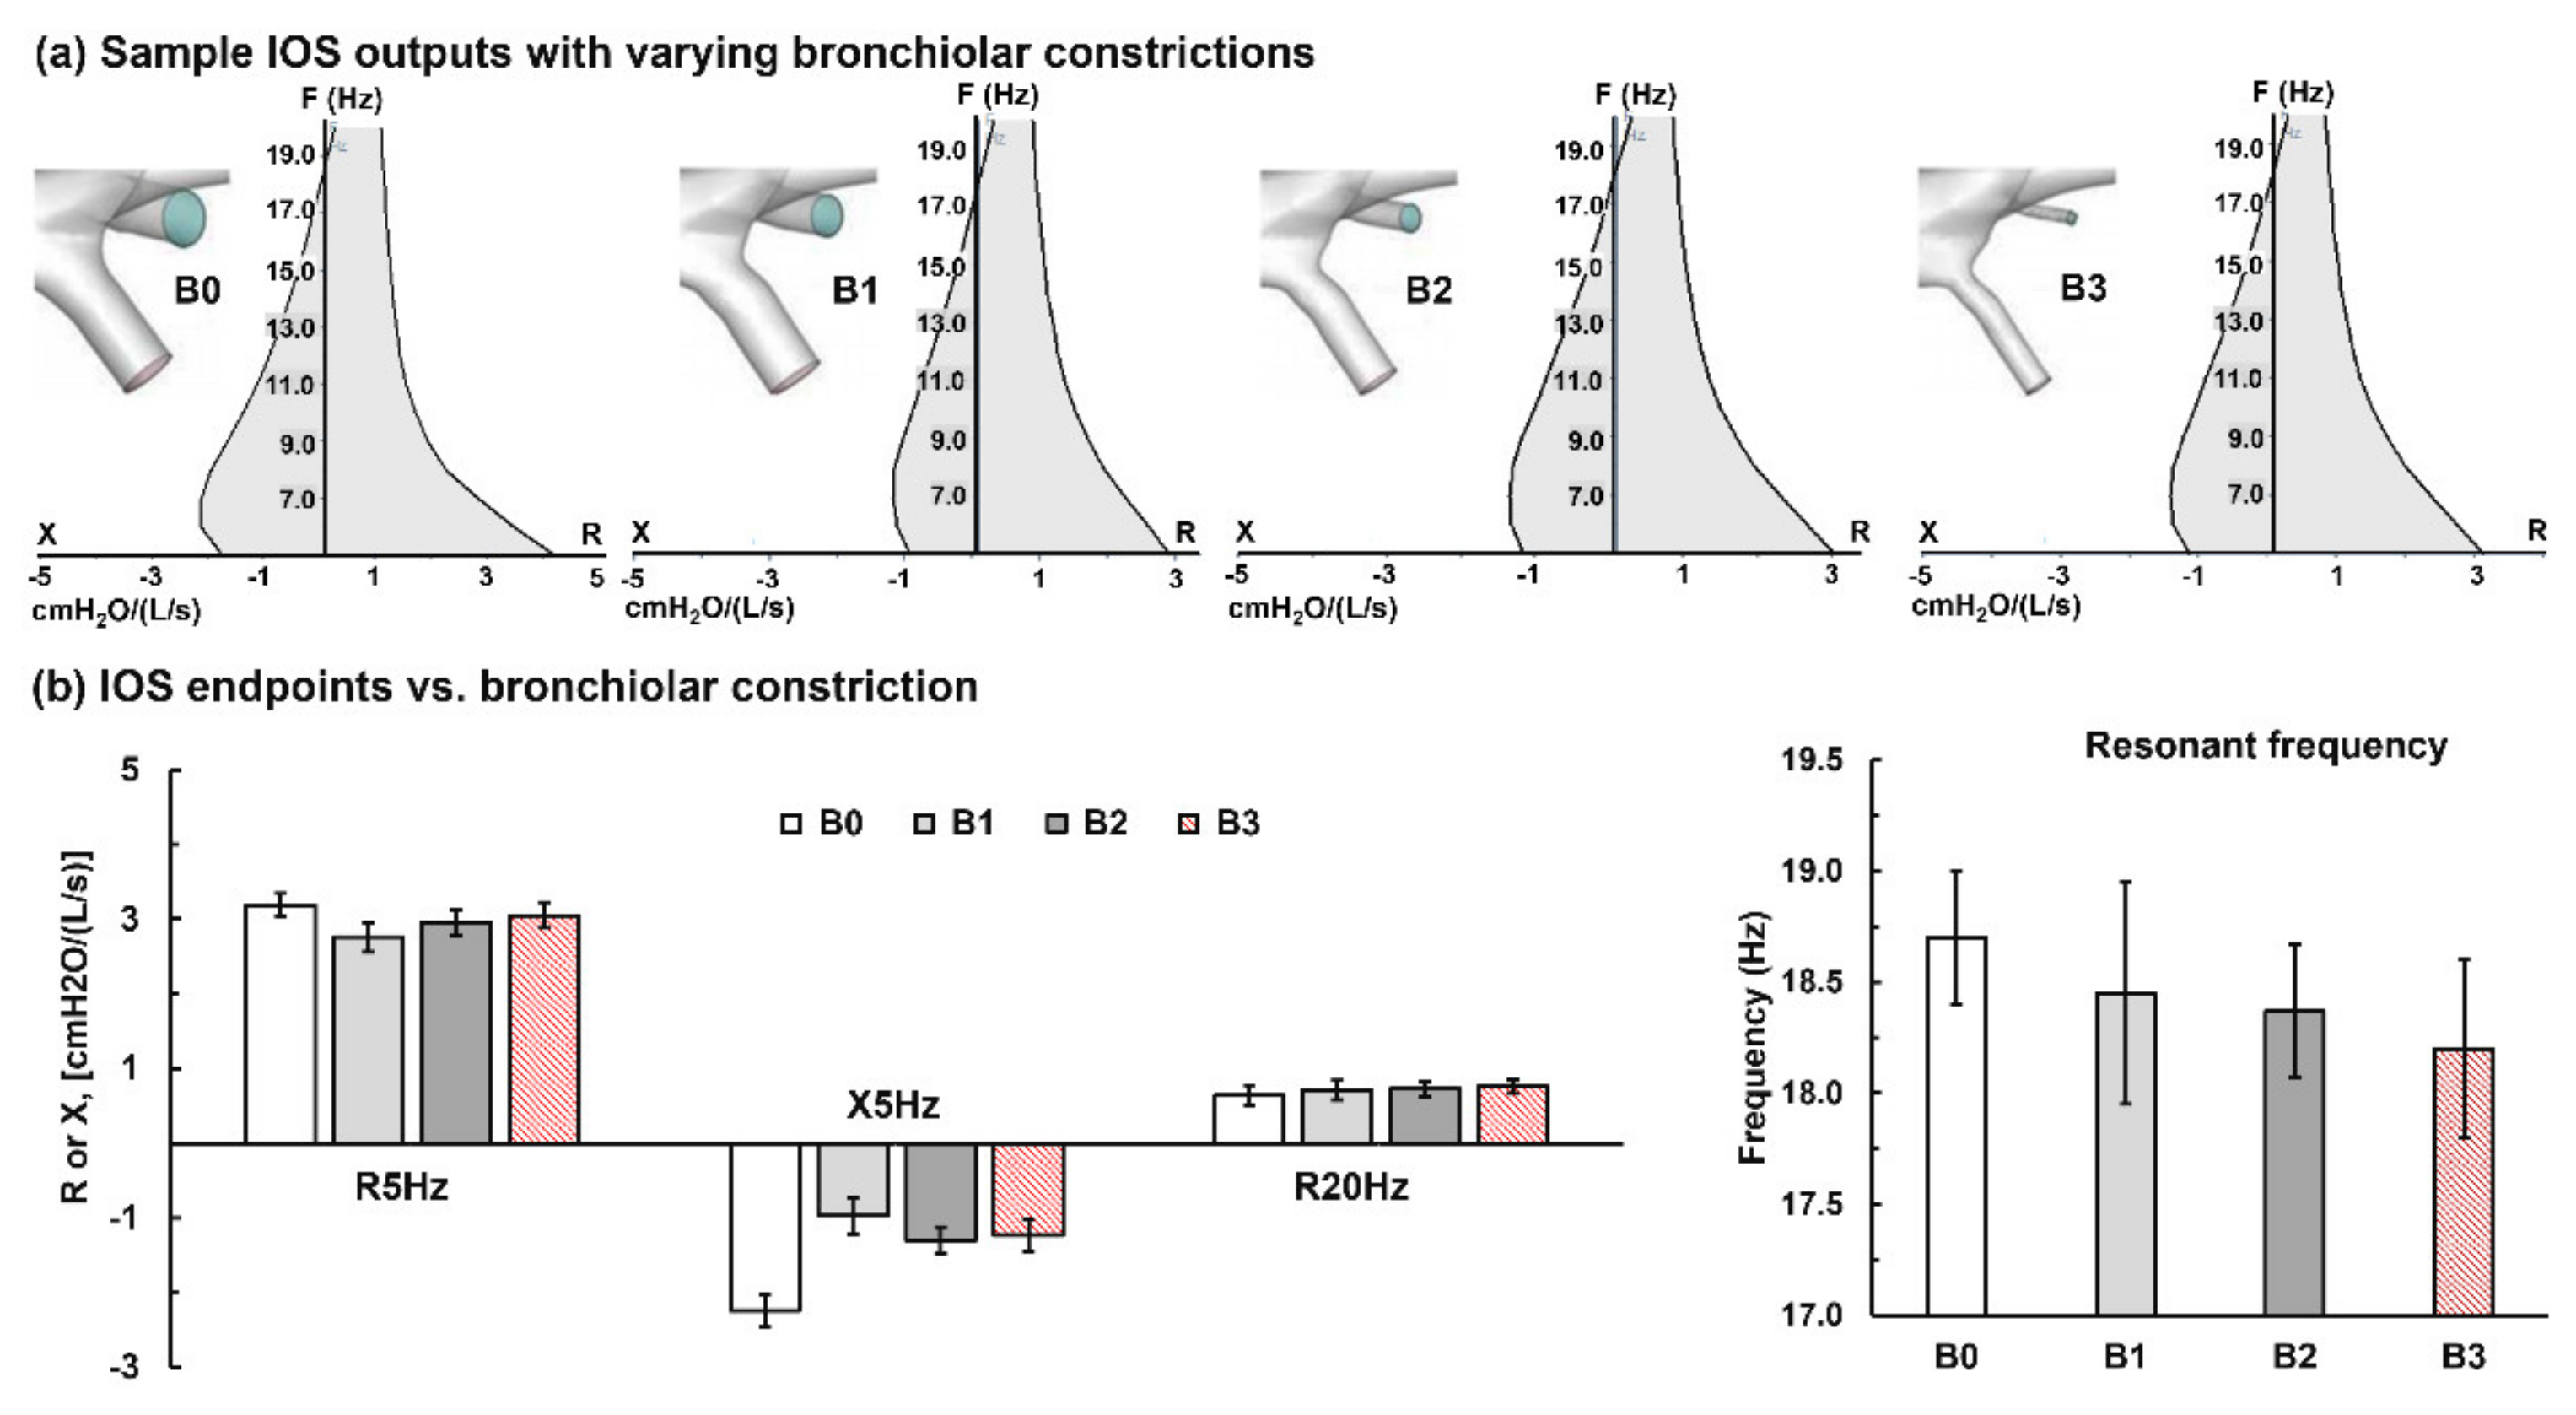
3.2. Bronchial Constrictions

The screenshots of the IOS outputs with varying bronchial constrictions (B0–3) in the left upper lobe are shown in Figure 3a. For the bronchial constrictions considered (B1–3), the variation of R5Hz appears insignificant (Figure 3b). The R20Hz value increases with B1–3 but with a smaller slope than that for T1 and T2, which is reasonable considering the relatively smaller structural variations in B1–3 than in T1 and T2. All of the three constricted models exhibit a smaller amplitude of X5Hz than the normal model (Figure 3b). The resonant frequency, f0, decreases consistently with the bronchial constrictions (Figure 3b, right panel). Note that the f0 in this figure ranges from 17.0 Hz to 19.5 Hz to highlight the variations. The percentage change of f0 is only 2.7% from B0 (18.7 Hz) to B3 (18.2 Hz). The result that f0 decreased with the enhanced obstruction is counterintuitive and is presumably due to the neglect of compliance-associated components in the current model. In life conditions, compliance C decreases with disease severity, leading to a more negative reactance X = (ωI − 1/ωC) and a higher resonant frequency. With an invariant C, however, the increased turbulence in obstructed lungs could increase the inertance and make X less negative, leading to a decreased f0.

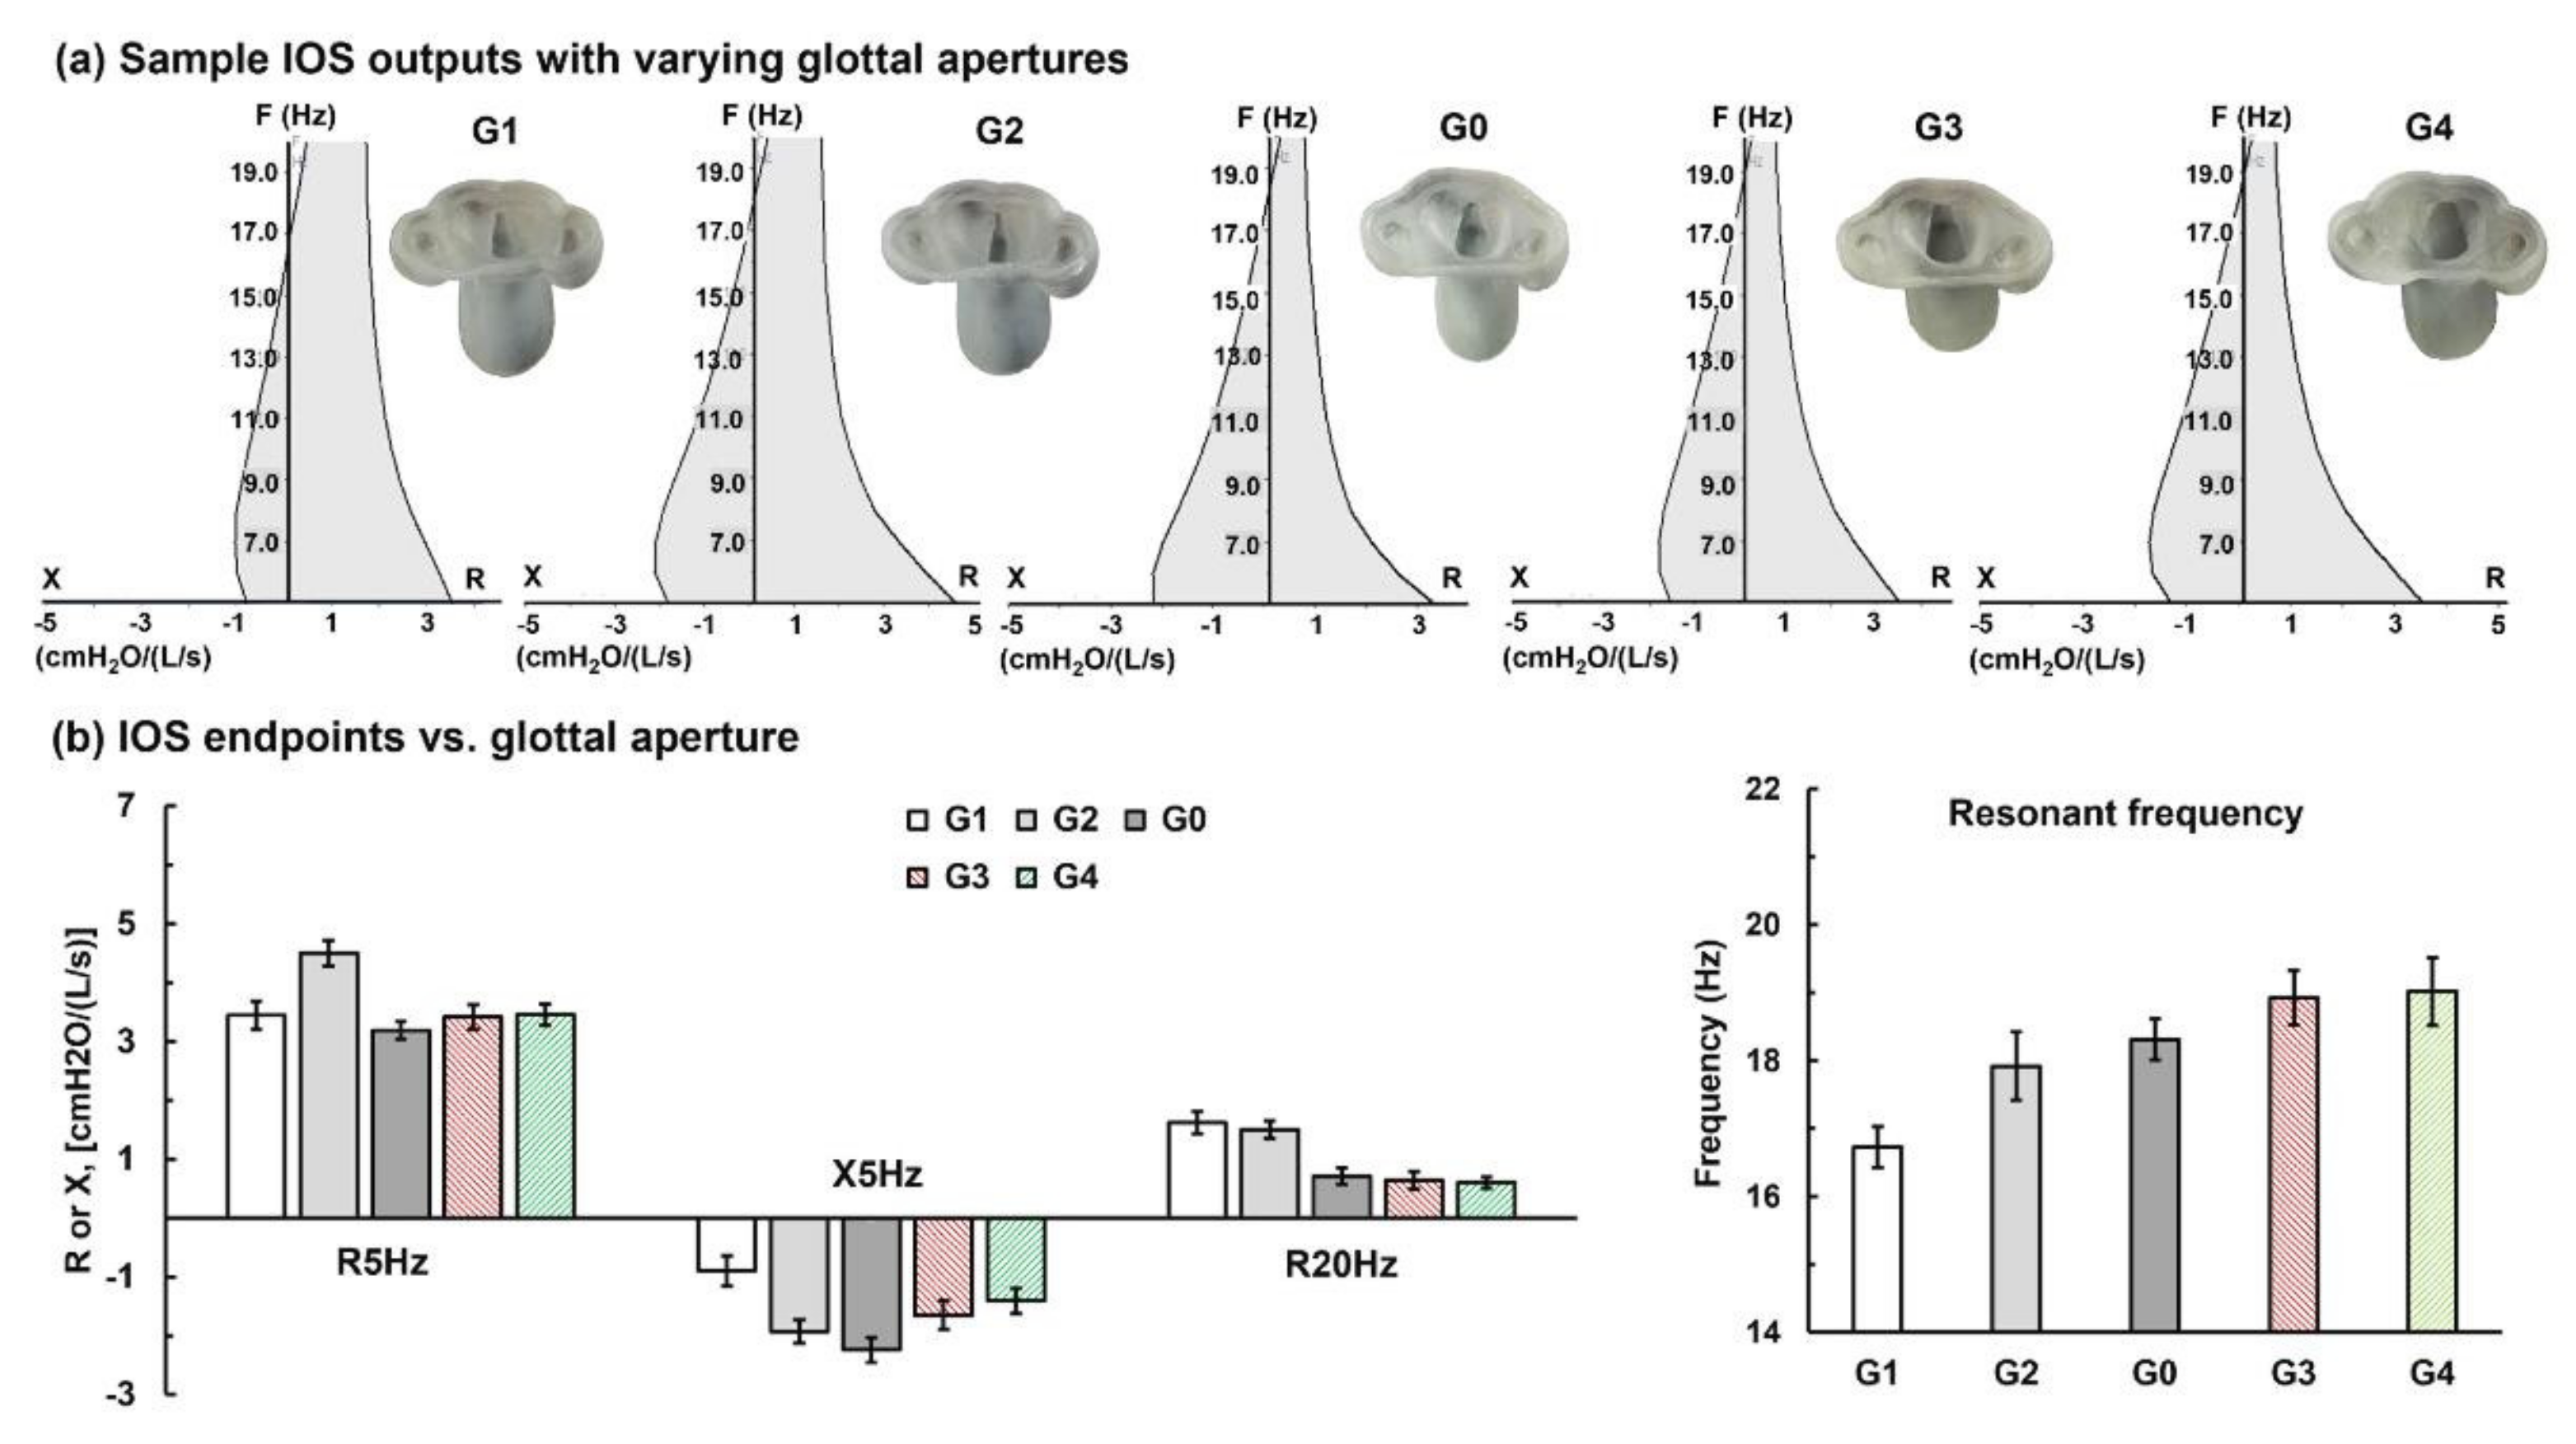
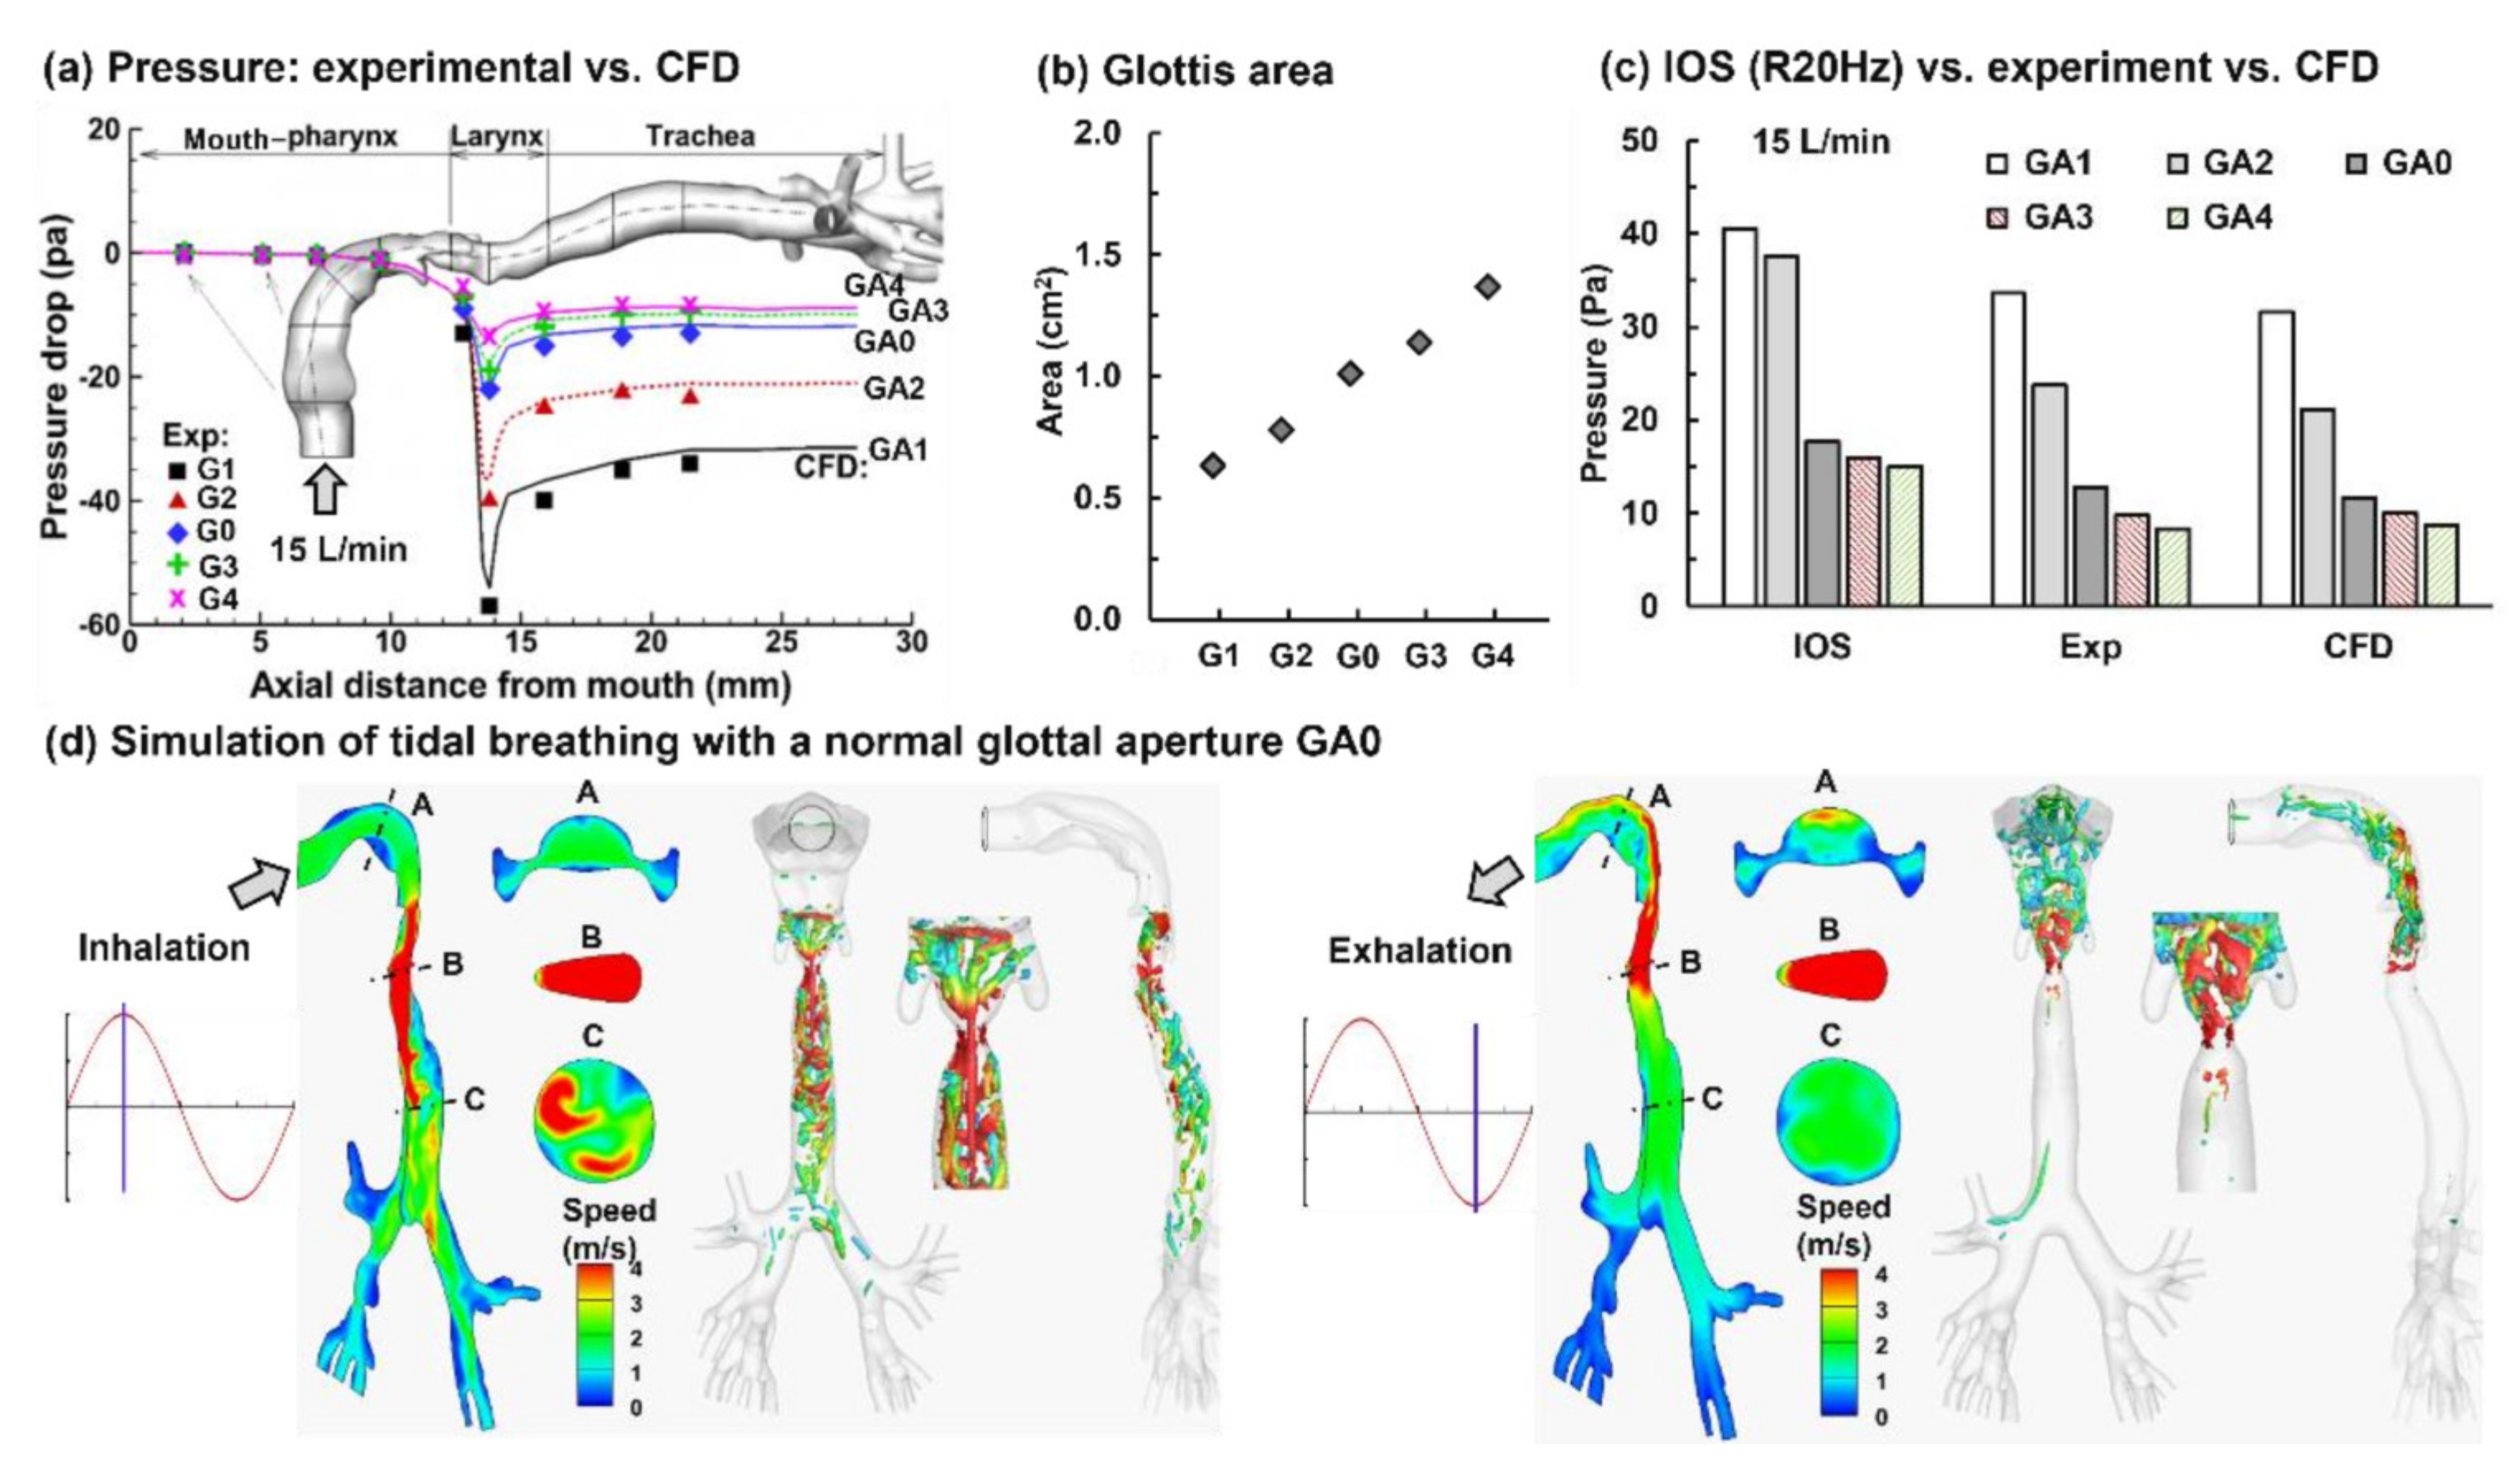
3.3. Glottal Aperture Effects

The IOS outputs with varying glottal apertures are shown in Figure 4. It is clear that R20Hz decreases with larger apertures. The resonant frequency is also observed to persistently increase with increasing apertures. The trends for R5Hz and X5Hz are not inclusive (Figure 4b). Again, the small variance of the IOS outputs (R5Hz, X5Hz, R20Hz, and f0) in Figure 4b indicates the high data repeatability in the in vitro hollow casts with parameterized geometrical variations.
The IOS-measured R20Hz was compared to the experimental measurements (Figure 5a) and CFD simulations (Figure 5d) of the flow resistance conducted in the five models with different glottal apertures (GA0–4) at an equivalent respiration flow rate (15 L/min). A conversion was needed from R20Hz to the pressure drop; for instance, the R20Hz in GA1 was 1.62-cm H2O/(L/s) or 162 Pa/(L/s), and the flow rate was 15L/min or 0.25 L/s, which gave a 40.5 Pa [= 162 Pa/(L/s) * 0.25 L/s]. A good agreement was achieved between the IOS R20Hz, the TSI VelociCalc measurements, and the CFD-predicted pressure drops (Figure 5c). It is also observed in Figure 5c that the resistance increases nearly exponentially when the glottal aperture decreases linearly (Figure 5b), indicating that turbulent flows become more dominant at GA1 and GA2.
The overall agreement among the three methods indicated that the IOS quantitatively captured the flow resistance, which was comparable to the in vitro measurements and CFD predictions. This agreement also indicated that the impulse of 20 Hz reached the G6 bronchioles. A slightly higher flow resistance was found in IOS testing than in the experiment and CFD, especially with the two narrow apertures GA1 and GA2. Additionally, there is an abrupt change from GA2 (narrow) to GA0 (normal) in the IOS results compared to a smooth profile in both the experiment and CFD. There might be multiple factors individually or cumulatively leading to these two differences. One possible factor is that the IOS impulse measures the volumetric field of the system, and the 20-Hz impulses do not necessarily reach the same generation of bronchioles. By contrast, both the experiment and CFD quantify the flow resistance using the pressure difference at two points. Another possible reason is that IOS R20Hz is a cumulative result of transient returning pressures over several breathing cycles, while the experiment and CFD both use steady inhalation flows [42,43,44]. For a sinusoidal waveform, the peak inhalation and exhalation velocities are approximately 1.414 times the mean, presumably leading to more intensified turbulences. As shown in Figure 5d, the glottal aperture is the predominant flow-limiting region in the extrathoracic airway, causing strong vortex shedding downstream during both inhalation and exhalation. Furthermore, the vortex topology and dissipation rate are different between the inspiratory and expiratory phases, with the vortices reaching the carina ridge during inhalation and oropharynx during exhalation (Figure 5d).

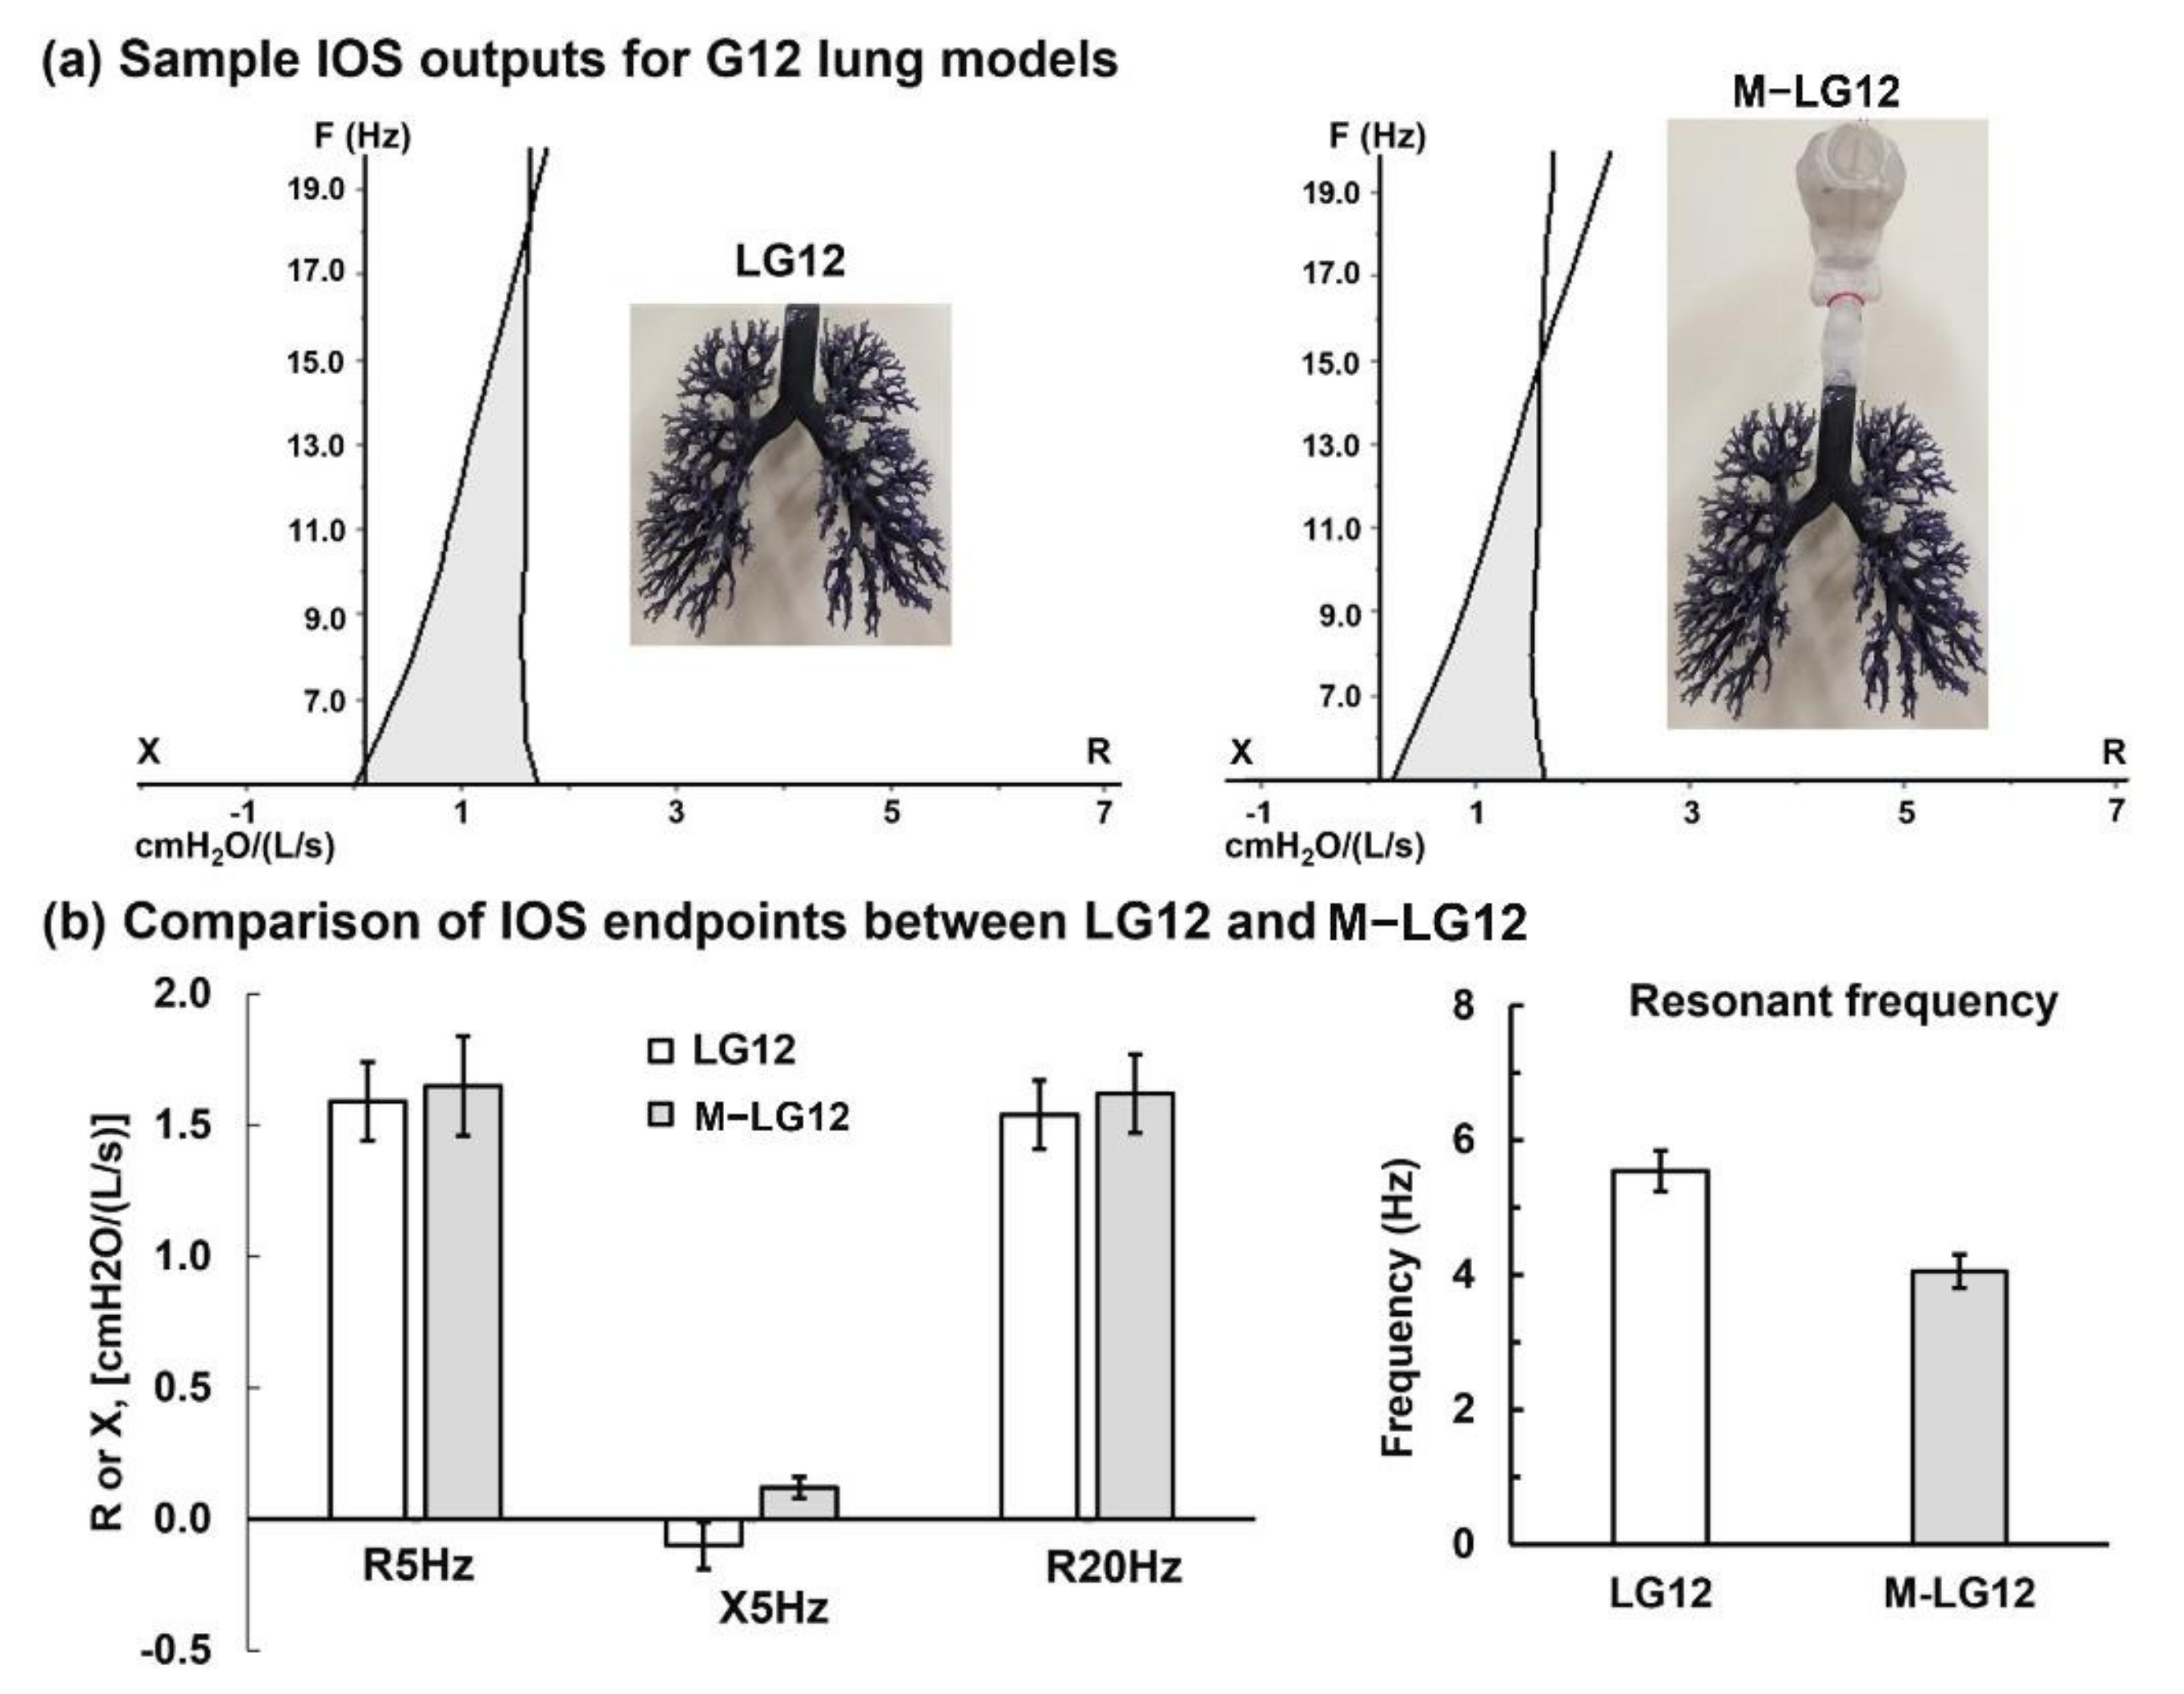
3.4. Lung Geometrical Complexity Effects: G6 vs. G12

To evaluate the IOS performance with respiratory airway models with increased complexities, a G12 lung cast (LG12) was tested with and without mouth–throat geometry, as illustrated in the right and left panels in Figure 6a, respectively. Notable differences in the IOS outputs are observed between G12 and G6 (Figure 6 vs. Figure 2, Figure 3 and Figure 4). The reactance (X) is significantly lower in both G12 cases (LG12 and M–LG12) in comparison to those in the G6 cases. Accordingly, the resonant frequency f0 is much lower in G12 (i.e., 4.1–5.5) than in G6 (16.7–19.0), which is the frequency when the reactance components of inertia and capacitance cancel each other.
Comparing the G12 testing with and without mouth–throat geometry, the presence of mouth–throat geometry only slightly increased the airway resistance R5Hz and R20Hz, indicating that the flow resistance in the mouth–throat model is small compared to that in the G12 lung geometry. Moreover, the R5Hz is only slightly larger than R20Hz in both cases, as shown in Figure 6b. The presence of the mouth–throat geometry also reduced the resonant frequency (i.e., from 5.5 in MLG12 to 4.1 in LG12).
An interesting observation is the magnitude and sign of X5Hz, which is −0.10 in LG12 and 0.12 in MLG12. As shown in Equation (1), the reactance X comes from two components: inertia (ωL, with a positive contribution) and compliance (−1/ωC, with a negative contribution). Mouth–throat geometry has a volume of 77.4 mm3 in comparison to the G0–12 lung volume of 47.2 mm3; adding mouth–throat geometry will appreciably increase the flow inertia, while the compliance of the system is supposed to remain relatively unchanged, thus leading to a more positive reactance.

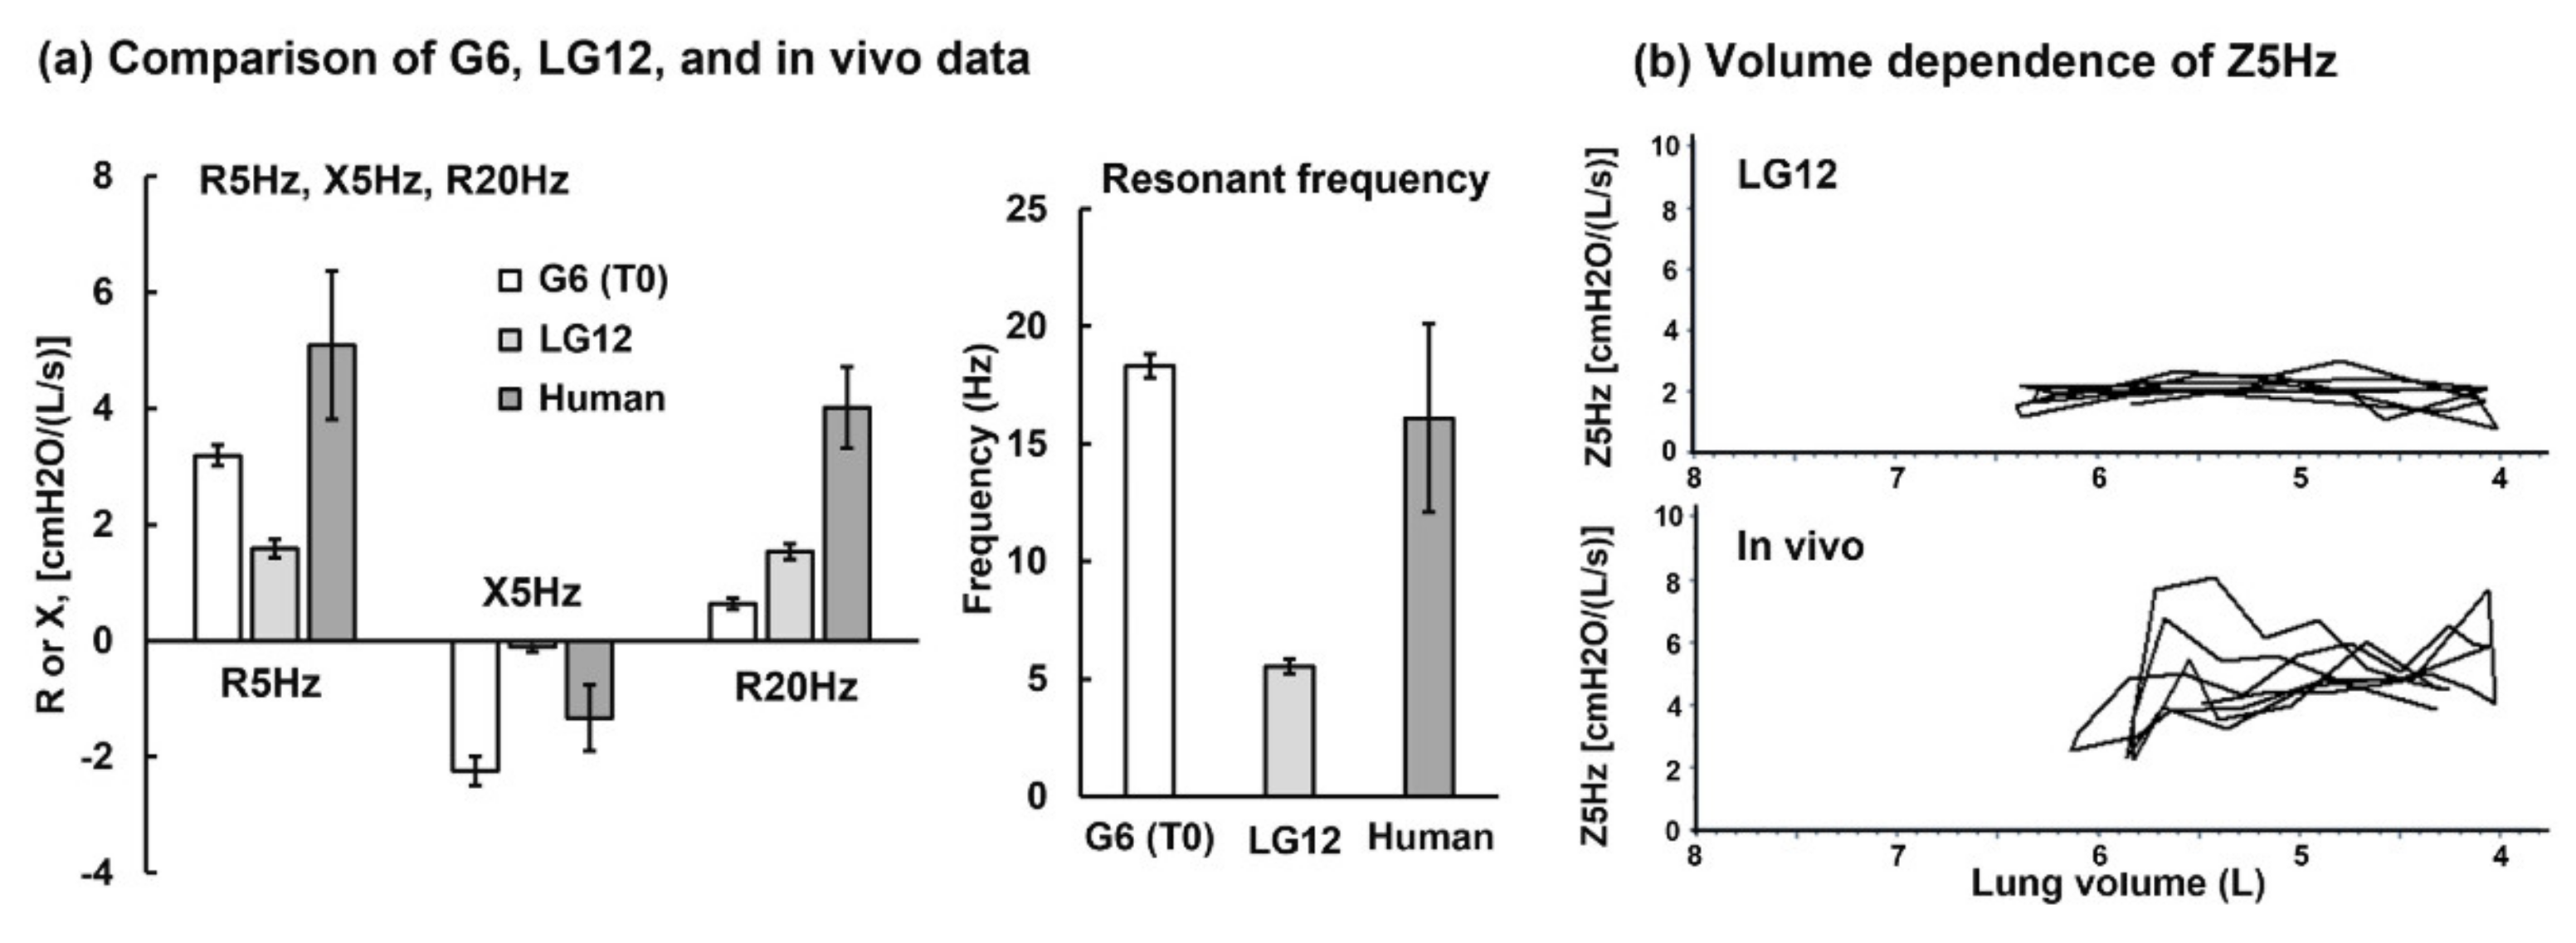
3.5. In Vitro Testing vs. Human Data

The comparison of the IOS outputs between in vitro casts (G6 and G12) and human subjects is shown in Figure 7. The human test data was from the mean IOS values of 24 healthy nonsmokers (three males, 21 females, aged 24–28 years old, with no history of airway disease) measured by Williamson et al. [45]. Three observations are noteworthy in Figure 7. First, R20Hz increases with the increasing lung geometry complexity (i.e., from G6 to G12 to the human lung, Figure 7a), which is expected considering the inevitable simplifications when reconstructing the airway models and thus the loss of some anatomical details, which may contribute to the local and overall airflow resistance.
Second, the IOS output variability among the human subjects is much larger than those in both hollow casts (G6 and LG12), reflecting the large variance in lung physiology among people as opposed to the controlled variation in hollow casts. This allows us to isolate the individual parameters to examine their impact on IOS responses. The contrast between in vivo and in vitro variability is also shown in Figure 7b, with a small range of variation of Z5Hz (impedance at 5Hz) with the volume in LG12 (upper panel) and a much larger range of Z5Hz in a typical human subject (lower panel in Figure 7b). In this figure, the x-coordinate is the airway volume, and the y-coordinate is Z5Hz (cmH2O/(L/s0)). Additionally, note that the airway volume changes with a larger amplitude (2.4 L) in LG12 testing than the human subject (2.9–2.2 L). In this sense, more robust and repeatable measurements are expected using the 3D-printed hollow airway casts than in human subjects.
The third observation regards the irregularity of the R5Hz and X5Hz among the G6, G12, and human subjects. It was expected that the G12 model would lead to improved IOS endpoints of the human data compared to the G6 model because of its higher similarity to human lungs. However, both R5Hz and X5Hz in G12 have a smaller amplitude than those in G6 (i.e., the control case T0) and human subjects, indicating a more complex mechanism of the reactive responses of the flow and pressure than a linear function. Potential factors that could contribute to this irregularity (R5Hz and X5Hz) will be presented in the Discussion, Section 4.2.

4. Discussion

4.1. How Well 3D Printed Casts Can Simulate Human Lungs?

Despite the geometrical similarity of the G12 model to human lungs, not all of its IOS outputs are closer to the human IOS data than a simpler G6 lung model. The airway resistance R20Hz did capture the increasing geometrical complexity, with the lowest R20Hz in the G6 lung and the highest in human lungs. However, the other three variables (i.e., R5Hz, X5Hz, and f0) vs. the lung geometrical complexity failed to exhibit a monotonic trend. The IOS system has been mainly used in small airway diseases, such as asthma. Although it can be used to diagnose obstructive lung diseases, the accuracy and reproducibility for such diseases remain unclear [46,47,48]. A better understanding of the underlying factors can be helpful to accurately interpret the IOS endpoints.
There are several apparent differences between the 3D-printed lung casts and human lungs that may contribute to this observation. First, the lung casts are rigid, whose effects can be two-fold: the lack of capacitive responses (energy storage) and the different wall responses to impulse waves. Second, the lung casts are incomplete. One group of lung casts retained the bronchiolar tress up to the sixth generation (G6) and the other retained G12. However, there are a total of 23 generations of bifurcations in a typical adult lung. G0–16 are conducting lungs, and G17–23 are acinar regions or alveoli, which can deform at large amplitudes. The exclusion of the peripheral conducting airway and the entire pulmonary alveolar region also contribute to the differences observed above. Third, the driving force for respiration is different in experiments and humans. A syringe pump was used to draw in and push out airflows in IOS cast tests, while the expansion and contraction of the diaphragm and chest walls drive the human inhalation and exhalation. At last, the lung cast was housed in a 5-L container that was further connected to the syringe pump. The main airflow and impulse waves also traveled through and interacted with the plastic container and the syringe pump, while the reactive flows and pressures were sampled and analyzed to generate the outputs shown in Figure 2, Figure 3, Figure 4, Figure 5 and Figure 6. However, using the same system by varying the lung cast geometries only, the relative variations between the control and a diseased model reflected the impact of that disease morphological variations. By modifying the disease-associated airway obstruction in a controlled manner, we can gain a quantitative understanding of the disease progression of that specific disease phenotype on IOS indices and therefore provide reference values for respiratory disease diagnosis and therapeutic outcome evaluations [49,50,51]. It is acknowledged that lung compliance varies with diseases, and neglecting the compliance variations cannot fully capture the IOS responses in diseased lungs [52]. However, at this stage, such neglect is nearly inevitable for two reasons: (1) incapacity of the current 3D printing techniques to fabricate flexible lung casts with controlled compliances and (2) the unavailability of disease-specific compliances measured in vivo.

4.2. CFD as a Complementary Tool in Understanding IOS Responses

In this study, we observed an overall increase in R5Hz and R20Hz with airway obstructions (Figure 3 and Figure 4). However, certain outliers were also noted, such as R5Hz in B0 (Figure 3b) and GA2 (Figure 4b), which deviated from the expected resistance–obstruction trend. These outliers occurred even though special efforts had been taken to minimize human errors such as leakage from connections and inconsistent syringe piston motion. Turbulence and associated flow heterogeneity could be the factors that contributed to the erratic results, which led to nonlinear behaviors of the oscillatory flows at varying frequencies. Note that the oscillometry relied on a linear flow–pressure relationship to derive the mechanical properties at these frequencies. Computational fluid dynamic (CFD) modeling can provide detailed flow–pressure responses and is promising to improve our understanding of the interactions among different reactive constituents in human lungs. The IOS systems were developed based on the LRC concept and linear assumptions [53]. Note that the airflows in the large airway are not laminar, and the relationship between the pressure and flow is not linear [54]. In the complementary computational modeling, we observed complex vortex structures in the large airway (Figure 5d); moreover, the vortex dynamics differed remarkably between inhalation and exhalation. As a result, the pressure responses were different between these two phases. Since vortices store and dissipate energy (as flow energy capacitors), the distinct vortex dynamics during inhalation and exhalation can affect both the IOS capacitive and resistive responses. Similarly, Shimoda et al. reported different IOS endpoints during inhalation and exhalation in asthma patients [55]. It is anticipated that CFD modeling of IOS testing with a patient-specific airway geometry with a controlled lung function variation (i.e., before and after treatments) can provide correlations between the IOS endpoints and regional lung function [56]. To date, such correlations are still empirical, while quantitative correlations are not available [57]. The direct comparison between CFD simulations and IOS testing in the same patients with controlled lung function variations will hopefully shed new light on this less-explored area.

4.3. Limitations and Future Studies

A limited number of airway casts (count 14, four types) were tested in this study. To obtain a clear picture of the IOS sensitivity to airway obstructions, more airway casts with refined structural remodeling are needed. Second, the airway cast walls are rigid, and the compliance of the airway models cannot be assessed. Considering that most of the lung compliance is from the pulmonary region, the model presented in this study should not be used to evaluate the effects of compliance variations. An alternative is to attach balloons to the distal bronchioles to simulate downstream the lungs. Another option is to use flexible materials to prepare airway casts. However, such methods have their setbacks, such as the low strength of rubber materials, which makes hollow cast preparation highly challenging. It is also noted that IOS did not distinguish inspiratory and expiratory resistance and reactance, which can be notably different due to different inspiratory and expiratory airflows, as illustrated in Figure 5d.
Diseased-induced airway obstruction can be modeled in several ways. If CT images of a diseased lung are available with sufficiently high resolution, segmentation methods can be used to reconstruct the patient-specific lung geometries. In this case, the patient’s lung function data are needed to establish regional shape–function correlations. One alternative is to use algorithm-generated lung geometries (such as the G12 lung model in this study) and computer-aided remodeling in regional lungs (such as the three phenotypes of airway obstruction in the G6 lung model). There are multiple computer-aided design methodologies to generate diseased airway geometries, such as (1) manual remodeling using Gambit, ANSYS Workbench, Solidworks, Maya, or Blender; (2) semiautomatic remodeling using Hypermorph; and (3) automatic, algorithm-controlled remodeling using statistical shape modeling (SSM) [58]. SSM was initially designed for computer-aided graphics and imaging processing in the 1990s and has found wide applications in other disciplines due to this powerful morphing capacity [59,60]. These include bone biomechanics [61], implant risk evaluation [62], forensics [63], anthropology [64], and evolutional biology [65]. One advantage of SSM is that it can learn the shape features from a database and use the major features to generate new shapes as a linear combination, thus providing a feasible tool to create an infinite number of new shapes in a controlled manner [66]. Using this method, diseased lung models with larger areas of structural remodeling have been reconstructed and can be implemented for future IOS testing [67,68].

5. Conclusions

The performance of an impulse oscillometry (IOS) system (CareFusion) was evaluated in 3D-printed lung casts with varying obstruction phenotypes, locations, and complexities. The IOS system could detect progressive airway obstructions and agreed satisfactorily with the complementary measurements and numerical predictions. The specific findings include:
  • The resonant frequency dropped with the increase in obstructions for all the three phenotypes of obstructions considered, possibly from neglect of the compliance-associated components.
  • The R20Hz value increased with the increase in airway obstructions.
  • R20Hz in the airway model with varying glottal apertures agreed reasonably well with complementary experimental measurements using TSI VelociCalc.
  • The variations of R5Hz and X5Hz vs. airway obstructions were inconclusive in this study, indicating that 3D-printed rigid casts cannot test the compliance-related properties.
  • Using 3D-printed airway casts to mimic IOS–lung interactions is still in its infancy. Factors that can significantly affect the physical realism of lung dynamics are still challenging to consider, such as elastic walls, small airway structures, and pulmonary compliance.

Author Contributions

Conceptualization, X.S., R.D., W.-C.S. and J.X.; methodology, J.S.X., M.T. and J.X.; software, X.S. and J.X.; validation, X.S., R.D. and W.-C.S.; formal analysis, X.S., J.S.X., M.T., R.D., W.-C.S. and J.X.; investigation, X.S., J.S.X., M.T. and J.X.; resources, X.S. and J.X.; data curation, J.S.X. and M.T.; writing—original draft preparation, J.X.; writing—review and editing, X.S., R.D. and W.-C.S.; visualization, J.X.; supervision, X.S. and J.X.; and project administration, X.S. and J.X. All authors have read and agreed to the published version of the manuscript.

Funding

This research received no external funding.

Institutional Review Board Statement

Not applicable.

Informed Consent Statement

Not applicable.

Data Availability Statement

Not applicable.

Acknowledgments

Kitaoka Hiroko at Tokyo University of Agriculture and Technology, Japan is gratefully acknowledged for sharing the morphing module Lung4Cer to generate the lung models in this study.

Conflicts of Interest

The authors declare no conflict of interest.

References

  1. Desai, U.; Joshi, J.M. Impulse oscillometry. Adv. Respir. Med. 2019, 87, 235–238. [Google Scholar] [CrossRef] [PubMed]
  2. Chaiwong, W.; Namwongprom, S.; Liwsrisakun, C.; Pothirat, C. Diagnostic ability of impulse oscillometry in diagnosis of chronic obstructive pulmonary disease. COPD 2020, 17, 635–646. [Google Scholar] [CrossRef] [PubMed]
  3. Martonen, T.; Fleming, J.; Schroeter, J.; Conway, J.; Hwang, D. In silico modeling of asthma. Adv. Drug Deliv. Rev. 2003, 55, 829–849. [Google Scholar] [CrossRef]
  4. Ruffin, R.E.; Dolovich, M.B.; Wolff, R.K.; Newhouse, M.T. The effects of preferential deposition of histamine in the human airway. Am. Rev. Respir. Dis. 1978, 117, 485–492. [Google Scholar]
  5. Mak, J.C.; Barnes, P.J. Autoradiographic visualization of muscarinic receptor subtypes in human and guinea pig lung. Am. Rev. Respir. Dis. 1990, 141, 1559–1568. [Google Scholar] [CrossRef]
  6. Carstairs, J.R.; Nimmo, A.J.; Barnes, P.J. Autoradiographic visualization of beta-adrenoceptor subtypes in human lung. Am. Rev. Respir. Dis. 1985, 132, 541–547. [Google Scholar]
  7. Brashier, B.; Salvi, S. Measuring lung function using sound waves: Role of the forced oscillation technique and impulse oscillometry system. Breathe 2015, 11, 57–65. [Google Scholar] [CrossRef]
  8. Bickel, S.; Popler, J.; Lesnick, B.; Eid, N. Impulse oscillometry: Interpretation and practical applications. Chest 2014, 146, 841–847. [Google Scholar] [CrossRef] [PubMed]
  9. King, G.G.; Bates, J.; Berger, K.I.; Calverley, P.; de Melo, P.L.; Dellacà, R.L.; Farré, R.; Hall, G.L.; Ioan, I.; Irvin, C.G.; et al. Technical standards for respiratory oscillometry. Eur. Respir. J. 2020, 55, 1900753. [Google Scholar] [CrossRef]
  10. Otis, A.B.; McKerrow, C.B.; Bartlett, R.A.; Mead, J.; McIlroy, M.B.; Selver-Stone, N.J.; Radford, E.P., Jr. Mechanical factors in distribution of pulmonary ventilation. J. Appl. Physiol. 1956, 8, 427–443. [Google Scholar] [CrossRef]
  11. Abdo, M.; Trinkmann, F.; Kirsten, A.M.; Pedersen, F.; Herzmann, C.; von Mutius, E.; Kopp, M.V.; Hansen, G.; Waschki, B.; Rabe, K.F.; et al. Small airway dysfunction links asthma severity with physical activity and symptom control. J. Allergy Clin. Immunol. Pract. 2021, 9, 3359–3368. [Google Scholar] [CrossRef] [PubMed]
  12. Hou, S.P.; Meskin, N.; Haddad, W.M. A general multicompartment lung mechanics model with nonlinear resistance and compliance respiratory parameters. In Proceedings of the American Control Conference, Portland, OR, USA, 4–6 June 2014; pp. 566–571. [Google Scholar]
  13. Guan, W.J.; Yuan, J.J.; Gao, Y.H.; Li, H.M.; Zheng, J.P.; Chen, R.C.; Zhong, N.S. Impulse oscillometry and spirometry small-airway parameters in mild to moderate bronchiectasis. Respir. Care 2016, 61, 1513–1522. [Google Scholar] [CrossRef]
  14. Handa, H.; Huang, J.; Murgu, S.D.; Mineshita, M.; Kurimoto, N.; Colt, H.G.; Miyazawa, T. Assessment of central airway obstruction using impulse oscillometry before and after interventional bronchoscopy. Respir. Care 2014, 59, 231–240. [Google Scholar] [CrossRef] [PubMed] [Green Version]
  15. Yasuo, M.; Kitaguchi, Y.; Kinota, F.; Kosaka, M.; Urushihata, K.; Ushiki, A.; Yamamoto, H.; Kawakami, S.; Hanaoka, M. Usefulness of the forced oscillation technique in assessing the therapeutic result of tracheobronchial central airway obstruction. Respir. Investig. 2018, 56, 222–229. [Google Scholar] [CrossRef] [PubMed]
  16. Becker, H.D.; Slawik, M.; Miyazawa, T.; Gat, M. Vibration response imaging as a new tool for interventional-bronchoscopy outcome assessment: A prospective pilot study. Respir. Int. Rev. Thorac. Dis. 2009, 77, 179–194. [Google Scholar] [CrossRef] [PubMed]
  17. Wei, X.; Shi, Z.; Cui, Y.; Mi, J.; Ma, Z.; Ren, J.; Li, J.; Xu, S.; Guo, Y. Impulse oscillometry system as an alternative diagnostic method for chronic obstructive pulmonary disease. Medicine 2017, 96, e8543. [Google Scholar] [CrossRef]
  18. Porojan-Suppini, N.; Fira-Mladinescu, O.; Marc, M.; Tudorache, E.; Oancea, C. Lung function assessment by impulse oscillometry in adults. Ther. Clin. Risk Manag. 2020, 16, 1139–1150. [Google Scholar] [CrossRef]
  19. Rodriguez, E.; Bullard, C.M.; Armani, M.H.; Miller, T.L.; Shaffer, T.H. Comparison Study of Airway Reactivity Outcomes due to a Pharmacologic Challenge Test: Impulse Oscillometry versus Least Mean Squared Analysis Techniques. Pulm. Med. 2013, 2013, 618576. [Google Scholar] [CrossRef] [Green Version]
  20. Lipworth, B.J.; Jabbal, S. What can we learn about COPD from impulse oscillometry? Respir. Med. 2018, 139, 106–109. [Google Scholar] [CrossRef] [Green Version]
  21. Yasuo, M.; Kitaguchi, Y.; Tokoro, Y.; Kosaka, M.; Wada, Y.; Kinjo, T.; Ushiki, A.; Yamamoto, H.; Hanaoka, M. Differences Between Central Airway Obstruction and Chronic Obstructive Pulmonary Disease Detected with the Forced Oscillation Technique. Int. J. Chronic Obstr. Pulm. Dis. 2020, 15, 1425–1434. [Google Scholar] [CrossRef]
  22. Hira, H.; Munjal, J.; Zachariah, S.; Chauhan, M.; Singh, A. The site of airway obstruction among patients of emphysema: Role of impulse oscillometry. Lung India Off. Organ Indian Chest Soc. 2008, 25, 8–13. [Google Scholar] [CrossRef] [PubMed]
  23. Su, W.C.; Chen, Y.; Xi, J. A new approach to estimate ultrafine particle respiratory deposition. Inhal. Toxicol. 2019, 31, 35–43. [Google Scholar] [CrossRef] [PubMed]
  24. Longest, P.W.; Xi, J. Condensational growth may contribute to the enhanced deposition of cigarette smoke particles in the upper respiratory tract. Aerosol. Sci. Tech. 2008, 42, 579–602. [Google Scholar] [CrossRef]
  25. Cheng, K.H.; Cheng, Y.S.; Yeh, H.C.; Swift, D.L. Measurements of airway dimensions and calculation of mass transfer characteristics of the human oral passage. J. Biomech. Eng. 1997, 119, 476–482. [Google Scholar] [CrossRef] [PubMed]
  26. Xi, J.; Longest, P.W. Transport and deposition of micro-aerosols in realistic and simplified models of the oral airway. Ann. Biomed. Eng. 2007, 35, 560–581. [Google Scholar] [CrossRef] [PubMed]
  27. Cohen, B.S.; Sussman, R.G.; Lippmann, M. Ultrafine particle deposition in a human tracheobronchial cast. Aerosol. Sci. Tech. 1990, 12, 1082–1093. [Google Scholar] [CrossRef]
  28. Xi, J.; Kim, J.; Si, X.A.; Zhou, Y. Diagnosing obstructive respiratory diseases using exhaled aerosol fingerprints: A feasibility study. J. Aerosol. Sci. 2013, 64, 24–36. [Google Scholar] [CrossRef]
  29. Xi, J.; Kim, J.; Si, X.A.; Mckee, E.; Corley, R.A.; Kabilan, S.; Wang, S. CFD Modeling and Image Analysis of Exhaled Aerosols due to a Growing Bronchial Tumor: Towards Non-Invasive Diagnosis and Treatment of Respiratory Obstructive Diseases. Theranostics 2015, 5, 443–455. [Google Scholar] [CrossRef]
  30. Xi, J.; Zhao, W.; Yuan, J.E.; Kim, J.; Si, X.; Xu, X. Detecting lung diseases from exhaled aerosols: Non-Invasive lung diagnosis using ractal analysis and SVM classification. PLoS ONE 2015, 10, e0139511. [Google Scholar] [CrossRef] [Green Version]
  31. Xi, J.; Wang, Z.; Talaat, K.; Glide-Hurst, C.; Dong, H. Numerical study of dynamic glottis and tidal breathing on respiratory sounds in a human upper airway model. Sleep Breath 2018, 22, 463–479. [Google Scholar] [CrossRef] [Green Version]
  32. Kitaoka, H.; Koc, S.; Tetsumoto, S.; Koumo, S.; Hirata, H.; Kijima, T. 4D model generator of the human lung, “Lung4Cer”. In Proceedings of the 2013 35th Annual International Conference of the IEEE Engineering in Medicine and Biology Society (EMBC), Osaka, Japan, 3–7 July 2013; pp. 453–456. [Google Scholar]
  33. Kitaoka, H.; Nieman, G.F.; Fujino, Y.; Carney, D.; Di Rocco, J.; Kawase, I. A 4-dimensional model of the alveolar structure. J. Physiol. Sci. 2007, 57, 175–185. [Google Scholar] [CrossRef] [PubMed] [Green Version]
  34. Kitaoka, H.; Tamura, S.; Takaki, R. A three-dimensional model of the human pulmonary acinus. J. Appl. Physiol. 2000, 88, 2260–2268. [Google Scholar] [CrossRef] [PubMed]
  35. Zhou, Y.; Xi, J.; Simpson, J.; Irshad, H.; Cheng, Y.-S. Aerosol Deposition in a Nasopharyngolaryngeal Replica of a 5-Year-Old Child. Aerosol. Sci. Tech. 2013, 47, 275–282. [Google Scholar] [CrossRef]
  36. Zhou, Y.; Guo, M.; Xi, J.; Irshad, H.; Cheng, Y.-S. Nasal Deposition in Infants and Children. J Aerosol Med 2014, 26, 110–116. [Google Scholar] [CrossRef]
  37. Xi, J.; Yuan, J.E.; Zhang, Y.; Nevorski, D.; Wang, Z.; Zhou, Y. Visualization and quantification of nasal and olfactory deposition in a sectional adult nasal airway cast. Pharm. Res. 2016, 33, 1527–1541. [Google Scholar] [CrossRef]
  38. Nicoud, F.; Ducros, F. Subgrid-scale stress modelling based on the square of the velocity gradient tensor. Flow Turbul. Combust. 1999, 62, 183–200. [Google Scholar] [CrossRef]
  39. Xi, J.; Si, X.; Kim, J.; Su, G.; Dong, H. Modeling the pharyngeal anatomical effects on breathing resistance and aerodynamically generated sound. Med. Biol. Eng. Comput. 2014, 52, 567–577. [Google Scholar] [CrossRef]
  40. Xi, J.; Yuan, J.E.; Yang, M.; Si, X.; Zhou, Y.; Cheng, Y.-S. Parametric study on mouth–throat geometrical factors on deposition of orally inhaled aerosols. J. Aerosol. Sci. 2016, 99, 94–106. [Google Scholar] [CrossRef]
  41. Kalchiem-Dekel, O.; Hines, S.E. Forty years of reference values for respiratory system impedance in adults: 1977–2017. Respir. Med. 2018, 136, 37–47. [Google Scholar] [CrossRef] [Green Version]
  42. Kaczka, D.W.; Dellacá, R.L. Oscillation mechanics of the respiratory system: Applications to lung disease. Crit. Rev. Biomed. Eng. 2011, 39, 337–359. [Google Scholar] [CrossRef] [Green Version]
  43. Bates, J.H.; Irvin, C.G.; Farré, R.; Hantos, Z. Oscillation mechanics of the respiratory system. Compr. Physiol. 2011, 1, 1233–1272. [Google Scholar] [PubMed]
  44. Lundblad, L.K.A.; Robichaud, A. Oscillometry of the respiratory system: A translational opportunity not to be missed. Am. J. Physiol. Lung Cell Mol. Physiol. 2021, 320, L1038–L1056. [Google Scholar] [CrossRef] [PubMed]
  45. Williamson, P.A.; Clearie, K.; Menzies, D.; Vaidyanathan, S.; Lipworth, B.J. Assessment of small-airways disease using alveolar nitric oxide and impulse oscillometry in asthma and COPD. Lung 2011, 189, 121–129. [Google Scholar] [CrossRef] [PubMed]
  46. Hafez, M.R.; Abu-Bakr, S.M.; Mohamed, A.A. Forced oscillometry track sites of airway obstruction in bronchial asthma. Ann. Allergy Asthma Immunol. 2015, 115, 28–32. [Google Scholar] [CrossRef]
  47. Qi, G.S.; Zhou, Z.C.; Gu, W.C.; Xi, F.; Wu, H.; Yang, W.L.; Liu, J.M. Detection of the airway obstruction stage in asthma using impulse oscillometry system. J. Asthma Off. J. Assoc. Care Asthma 2013, 50, 45–51. [Google Scholar] [CrossRef]
  48. Wollmer, P.; Tufvesson, E.; Wennersten, A.; Malmqvist, U.; Engström, G.; Olsson, H.K.; Zaigham, S.; Frantz, S.; Nihlén, U. Within-session reproducibility of forced oscillometry. Clin. Physiol. Funct. Imaging 2021, 41, 401–407. [Google Scholar] [CrossRef]
  49. Zheng, S.; Hu, Y.; Chen, Z.; Wang, M.; Liao, W. Predicting asthma exacerbation by impulse oscillometry evaluation of small airway function and fractional exhaled nitric oxide in preschool children. Pediatr. Pulmonol. 2020, 55, 1601–1607. [Google Scholar] [CrossRef]
  50. Dawman, L.; Mukherjee, A.; Sethi, T.; Agrawal, A.; Kabra, S.K.; Lodha, R. Role of impulse oscillometry in assessing asthma control in children. Indian Pediatr. 2020, 57, 119–123. [Google Scholar] [CrossRef]
  51. Díaz Palacios, M.; Hervás Marín, D.; Giner Valero, A.; Colomer Hernández, N.; Torán Barona, C.; Hernández Fernández de Rojas, D. Correlation between impulse oscillometry parameters and asthma control in an adult population. J. Asthma Allergy 2019, 12, 195–203. [Google Scholar] [CrossRef] [Green Version]
  52. Oppenheimer, B.W.; Goldring, R.M.; Berger, K.I. Distal airway function assessed by oscillometry at varying respiratory rate: Comparison with dynamic compliance. COPD 2009, 6, 162–170. [Google Scholar] [CrossRef] [PubMed]
  53. Linhas, R.; Lima, F.; Coutinho, D.; Almeida, J.; Neves, S.; Oliveira, A.; Ladeira, I.; Lima, R.; Campainha, S.; Guimarães, M. Role of the impulse oscillometry in the evaluation of tracheal stenosis. Pulmonology 2018, 24, 224–230. [Google Scholar] [CrossRef] [PubMed]
  54. Wang, J.; Xi, J.; Han, P.; Wongwiset, N.; Pontius, J.; Dong, H. Computational analysis of a flapping uvula on aerodynamics and pharyngeal wall collapsibility in sleep apnea. J. Biomech. 2019, 94, 88–98. [Google Scholar] [CrossRef] [PubMed]
  55. Shimoda, T.; Obase, Y.; Nagasaka, Y.; Kishikawa, R.; Iwanaga, T. Lung Sound Analysis and the Respiratory Cycle Dependence of Impulse Oscillometry in Asthma Patients. Intern. Med. Tokyo Jpn. 2019, 58, 47–52. [Google Scholar] [CrossRef] [PubMed] [Green Version]
  56. Andrade, D.S.M.; Ribeiro, L.M.; Lopes, A.J.; Amaral, J.L.M.; Melo, P.L. Machine learning associated with respiratory oscillometry: A computer-aided diagnosis system for the detection of respiratory abnormalities in systemic sclerosis. Biomed. Eng. Online 2021, 20, 31. [Google Scholar] [CrossRef]
  57. Walenga, R.L.; Babiskin, A.H.; Zhao, L. In Silico Methods for Development of Generic Drug-Device Combination Orally Inhaled Drug Products. CPT Pharmacomet. Syst. Pharmacol. 2019, 8, 359–370. [Google Scholar] [CrossRef] [Green Version]
  58. Xi, J.; Talaat, M.; Si, X.A.; Chandra, S. The application of statistical shape modeling for lung morphology in aerosol inhalation dosimetry. J. Aerosol Sci. 2021, 151, 105623. [Google Scholar] [CrossRef]
  59. Chandra, S.S.; Xia, Y.; Engstrom, C.; Crozier, S.; Schwarz, R.; Fripp, J. Focused shape models for hip joint segmentation in 3D magnetic resonance images. Med. Image Anal. 2014, 18, 567–578. [Google Scholar] [CrossRef]
  60. Heimann, T.; Meinzer, H.P. Statistical shape models for 3D medical image segmentation: A review. Med. Image Anal. 2009, 13, 543–563. [Google Scholar] [CrossRef]
  61. Castro-Mateos, I.; Pozo, J.M.; Cootes, T.F.; Wilkinson, J.M.; Eastell, R.; Frangi, A.F. Statistical shape and appearance models in osteoporosis. Curr. Osteoporos. Rep. 2014, 12, 163–173. [Google Scholar] [CrossRef] [PubMed]
  62. Fitzpatrick, C.; FitzPatrick, D.; Lee, J.; Auger, D. Statistical design of unicompartmental tibial implants and comparison with current devices. Knee 2007, 14, 138–144. [Google Scholar] [CrossRef]
  63. Hauser, R.; Smoliński, J.; Gos, T. The estimation of stature on the basis of measurements of the femur. Forensic Sci. Int. 2005, 147, 185–190. [Google Scholar] [CrossRef]
  64. Krishan, K.; Chatterjee, P.M.; Kanchan, T.; Kaur, S.; Baryah, N.; Singh, R.K. A review of sex estimation techniques during examination of skeletal remains in forensic anthropology casework. Forensic Sci. Int. 2016, 261, e161–e168. [Google Scholar] [CrossRef]
  65. Sella, G.; Hirsh, A.E. The application of statistical physics to evolutionary biology. Proc. Natl. Acad. Sci. USA 2005, 102, 9541–9546. [Google Scholar] [CrossRef] [Green Version]
  66. Bryan, R.; Nair, P.B.; Taylor, M. Use of a statistical model of the whole femur in a large scale, multi-model study of femoral neck fracture risk. J. Biomech. 2009, 42, 2171–2176. [Google Scholar] [CrossRef]
  67. Talaat, M.; Si, X.A.; Dong, H.; Xi, J. Leveraging statistical shape modeling in computational respiratory dynamics: Nanomedicine delivery in remodeled airways. Comput. Methods Programs Biomed. 2021, 204, 106079. [Google Scholar] [CrossRef]
  68. Si, X.A.; Talaat, M.; Su, W.C.; Xi, J. Inhalation dosimetry of nasally inhaled respiratory aerosols in the human respiratory tract with locally remodeled conducting lungs. Inhal. Toxicol. 2021, 33, 143–159. [Google Scholar] [CrossRef]
Figure 1. The impulse oscillometry (IOS) system and airway models: (a) the experimental setup consists of an IOS system, a respiratory model, and a syringe pump simulating cyclic breathing; (b) the model of the respiratory system consists of a mouth–throat hollow cast, a conducting lung cast that retains branches up to either G6 (i.e., the sixth bifurcation generation) or G12, and a container simulating lung parenchyma; and (c) the airway obstructions considered herein include carina ridge tumors (T1 and T2); constricted segmental bronchi (B1, B2, and B3) in the left upper lobe, and varying glottal apertures (GA1, GA2, GA3, and GA4), each group in contrast to the control case (GA0).
Jor 02 00004 g001
Figure 2. IOS characterization of the mouth–lung (G6) models with varying carina ridge tumors; (a) sample IOS outputs for the models T0 (no tumor), T1 (small), and T2 (large), and (b) comparison of the ISO endpoints (R5Hz, X5Hz, R20Hz, and resonant frequency) between T0, T1, and T2. The variables in (a) are the resistance R (cmH2O/(L/s)) in the positive x-axis, reactance X (cmH2O/(L/s)) in the negative x-axis, and frequency (Hz) in the y-axis.
Jor 02 00004 g002
Figure 3. IOS characterization of the mouth–lung (G6) models with varying bronchial constriction levels in the left upper lobe; (a) sample IOS outputs for the models B0 (no constriction), B1 (mild constriction), B2 (moderate constriction), and B3 (severe constriction), and (b) comparison of ISO endpoints (R5Hz, X5Hz, R20Hz, and resonant frequency) among the four models B0–3. The variables in (a) are the resistance R (cmH2O/(L/s)) in the positive x-axis, reactance X (cmH2O/(L/s)) in the negative x-axis, and frequency (Hz) in the y-axis.
Jor 02 00004 g003
Figure 4. IOS characterization of the mouth–lung (G6) models with varying glottal apertures; (a) sample IOS outputs for the models GA1 (narrowest), GA2 (narrower), GA0 (normal), GA3 (wider), and GA4 (widest); (b) comparison of ISO endpoints (R5Hz, X5Hz, R20Hz, and resonant frequency) among the five models G0–4. The variables in (a) are the resistance R (cmH2O/(L/s)) in the positive x-axis, reactance X (cmH2O/(L/s)) in the negative x-axis, and frequency (Hz) in the y-axis.
Jor 02 00004 g004
Figure 5. Cross-validation of the pressure drop (resistance) between the IOS, in vitro experiments, and numerical simulations: (a) experimentally measured pressure gradients within the 3D hollow cast vs. CFD (computational fluid dynamics) simulations at a flow rate of 15 L/min, (b) the glottis area of G0–4, and (c) the converted resistances (i.e., R5Hz and Pa) at 15 L/min in comparison to the experiments and CFD predictions for the five models G0–4. Computational simulations of tidal breathing with a static normal glottal aperture are shown in (d) at the peak inhalation (left panel) and exhalation (right panel).
Jor 02 00004 g005
Figure 6. IOS characterization of the lung casts extending up to G12 (LG12); (a) sample IOS outputs for the lung cast model (LG12) and the mouth–lung model (M–LG12); (b) comparison of the ISO endpoints (R5Hz, X5Hz, R20Hz, and resonant frequency) between LG12 and M–LG12. The variables in (a) are the resistance R (cmH2O/(L/s)) in the positive x-axis, reactance X (cmH2O/(L/s)) in the negative x-axis, and frequency (Hz) in the y-axis.
Jor 02 00004 g006
Figure 7. Effect of the lung model complexity: (a) comparison of the IOS outputs (R5Hz, X5Hz, R20Hz, and resonant frequency) from G6 (T0) and G12 to in vivo IOS measurements (i.e., human) from Williamson et al. [45], who measured 24 healthy subjects aged 24−28 years old; (b) volume dependence of the impedance Z5Hz for the lung casts (LG12) and a normal human subject in our lab.
Jor 02 00004 g007
Table 1. Sample IOS outputs for lung casts retaining different generations of lung branches: G6 vs. LG12. Ref: reference value; ULN: upper limit of normal; LLN: low limit of normal; %Ref: percentage relative to the reference value; Tr: trial.
G6 Cast (T0)Ref(ULN)(LLN)%RefBestTr1Tr2Tr3Tr4Tr5
R5Hz cmH2O/(L/s)2.924.571.261183.443.753.383.483.233.35
R5Hz cmH2O/(L/s)−0.011.64−1.677053−0.90−0.85−0.93−0.93−0.90−0.88
R5Hz cmH2O/(L/s)2.513.821.191.621.621.821.621.531.551.59
Fres. 1/s 16.7316.7316.816.8116.6716.5416.82
LG12 castRef(ULN)(LLN)%RefBestTr1Tr2Tr3Tr4Tr5
R5Hz cmH2O/(L/s)2.924.571.26551.591.681.831.491.731.54
R5Hz cmH2O/(L/s)−0.011.64−1.67768−0.10−0.14−0.05−0.11−0.08−0.09
R5Hz cmH2O/(L/s)2.513.821.19611.541.621.721.431.681.49
Fres. 1/s 5.545.765.325.615.465.52
Publisher’s Note: MDPI stays neutral with regard to jurisdictional claims in published maps and institutional affiliations.

