
Analysis of Extreme Rainfall Events on a Sub-Daily Scale in Northeast †
by
 , and
, and
Paula Andressa Alves de Araújo
1,*, 
Cláudio Moisés Santos e Silva
1,*,
Daniele Tôrres Rodrigues
2 and
and
Aléxia Monteiro Valentim
1 1
Department of Atmospheric and Climate Sciences, Universidade Federal do Rio Grande do Norte (UFRN), Natal 59078-970, Rio Grande do Norte, Brazil
2
Department of Statistic, Universidade Federal do Piauí (UFPI), Teresina 64049-550, Piauí, Brazil
*
Authors to whom correspondence should be addressed.
†
Presented at the 7th International Electronic Conference on Water Sciences, 15–30 March 2023; Available online: https://ecws-7.sciforum.net .
Environ. Sci. Proc. 2023, 25(1), 97; https://doi.org/10.3390/ECWS-7-14299
Published: 3 April 2023
(This article belongs to the Proceedings of The 7th International Electronic Conference on Water Sciences)
Abstract
:Given the complex climate of the Brazilian Northeast, its variable rainfall regime in spatial and temporal scales due to multiple geographic factors and the action of various atmospheric systems, as well as intense precipitation events becoming increasingly present and strong, are incipient the initiatives to analyze extreme rainfall on a sub-daily scale. Thus, characterizing the spatial and temporal distribution of IPESS on the NEB, analyzing the seasonality of the number of events for each location, and the influence of interannual variability in the occurrence of these events became the objective of that work. For this, hourly precipitation observations were collected from 119 automatic surface weather stations spread across the NEB between 2009 and 2018. The night period presented the highest amounts of IPESS. The meteorological stations Ibimirim/PE and Ilhéus/BA had the highest and lowest number of occurrences, respectively. The amplitude of the values of Q presented the thresholds of the stations with the values of 3.4 mm as a minimum, and 28.6 mm as a maximum, referring to the stations of Petrolina/PE and São Luís/MA, respectively. Among the capitals, Teresina/PI had the highest number of EPIES, as well as João Pessoa/PB had the lowest, not only among the capitals but also the second with the lowest number in general. It was observed that during 2009 the events were more frequent, while 2012 presented the smallest amounts.
1. Introduction
Since precipitation is one of the most important climate variables, as its variations directly affect numerous human activities, the knowledge about this variable’s spatial and temporal variability is crucial to subsidize the decision-making and actions planning to minimize impacts caused by extreme precipitation events.
The North East of Brazil (NEB) is a region with a difficult climatic characterization as a result of geographic factors associated with different atmospheric systems. Then, there are different factors that fluctuate the precipitation regime of the NEB on a wide time and space scale [1,2,3,4].
A large part of the climate studies about analyses of precipitation that focus the NEB report mainly the water deficit. Trying to understand the complex social functions of these climatic characteristics is very important since they cause economic losses in addition to deaths. In contrast, heavy rainfall is also reported, which, together with water deficits, are the main types of adverse natural phenomena from the NEB, so those cause significant impacts that can be catastrophes.
Since intense rainfall events have become increasingly more common and strong, according to projections made by the Intergovernmental Panel Climate Change (IPCC) [5], there is vast scientific literature on extreme indices on a daily scale around the world, including in the NEB [6]. However, initiatives to analyze extreme rainfall on a sub-daily scale are still incipient, as well as the hourly analysis, mainly due to the lack of meteorological data with hourly or minute sampling. That said, the objective of the present study was to characterize the spatial and temporal distribution of the Subdaily Scale Intense Precipitation Events (EPIES) over the NEB from hourly data collected in the period between 2009 and 2018, analyzing the seasonality of the number of events for each location and the influence of interannual variability on the occurrence of EPIES.
2. Materials and Methods
2.1. Study Area
The NEB is located latitudinally between 1° S and 18° S and longitudinally between 48° W and 34° W. It comprises a territorial extension of 1,558,000 km2, according to the Brazilian Institute of Geography and Statistics [7], comprising 9 states.
2.2. Data Collection
The dataset refers to precipitation observations from 119 automatic surface meteorological stations that are distributed in the NEB and are operated by the Brazilian National Institute of Meteorology (INMET). Data were collected hourly for the period between 1 January 2009 and 31 December 2018.
To organize the dataset and apply the methodology, Microsoft Excel software was used to calculate the results. The exploratory analysis of the heavy precipitation indices of each meteorological station was conducted using the R statistical computational system, realized through a box-plot cartogram, which is a graphic technique that shows the behavior of the data in space.
2.3. Methods
The methodology is divided into several stages, so the first consists of selecting the days with accumulated daily precipitation equal to or greater than 1 mm, keeping only the days on which they occurred (RR).
RR ≥ 1 mm
The second step is equivalent to using the percentile 95 [8] in order to find the extreme precipitation measurement values (Q) for each station. Thus, this method was applied to the accumulated precipitation values of all days validated in the previous step.
After completing the first and second stages, the third intended to emphasize the days with precipitation that went beyond the Q value. For this purpose, only those days with daily accumulations greater than the Q value of the station were maintained. That’s it:
RR ≥ Q
With the limits applied, these conditions were adopted as the definition of an EPIES for these days: it is considered an EPIES if, in a single hour, the accumulated precipitation rate (RI) represents more than 25% of the daily total with extreme rain. Thus, it is necessary to locate the hour with the highest precipitation value (max(RR)) for each day with extreme rain and calculate the percentage value of this record in relation to the daily accumulation:
RI = (max (RR)/RR) × 100, EPIES = RI ≥ 25
Finally, the occurrences of EPIES are counted, and the number of these events is analyzed from a temporal and spatial perspective, presenting them graphically with the support of Microsoft Office Excel.
3. Results
During the exploratory analysis, the Q values varied between 3.4 mm and 28.6 mm, referring to the Petrolina/PE and São Luís/MA stations, respectively. This indicates the great discrepancy of precipitation indices between meteorological stations. The distribution structure of the Q values of the meteorological stations was shown using the Box Plot. Via the interquartile amplitude, it is visualized that 50% of the Q values obtained are between 8.5 mm and 18.55 mm.
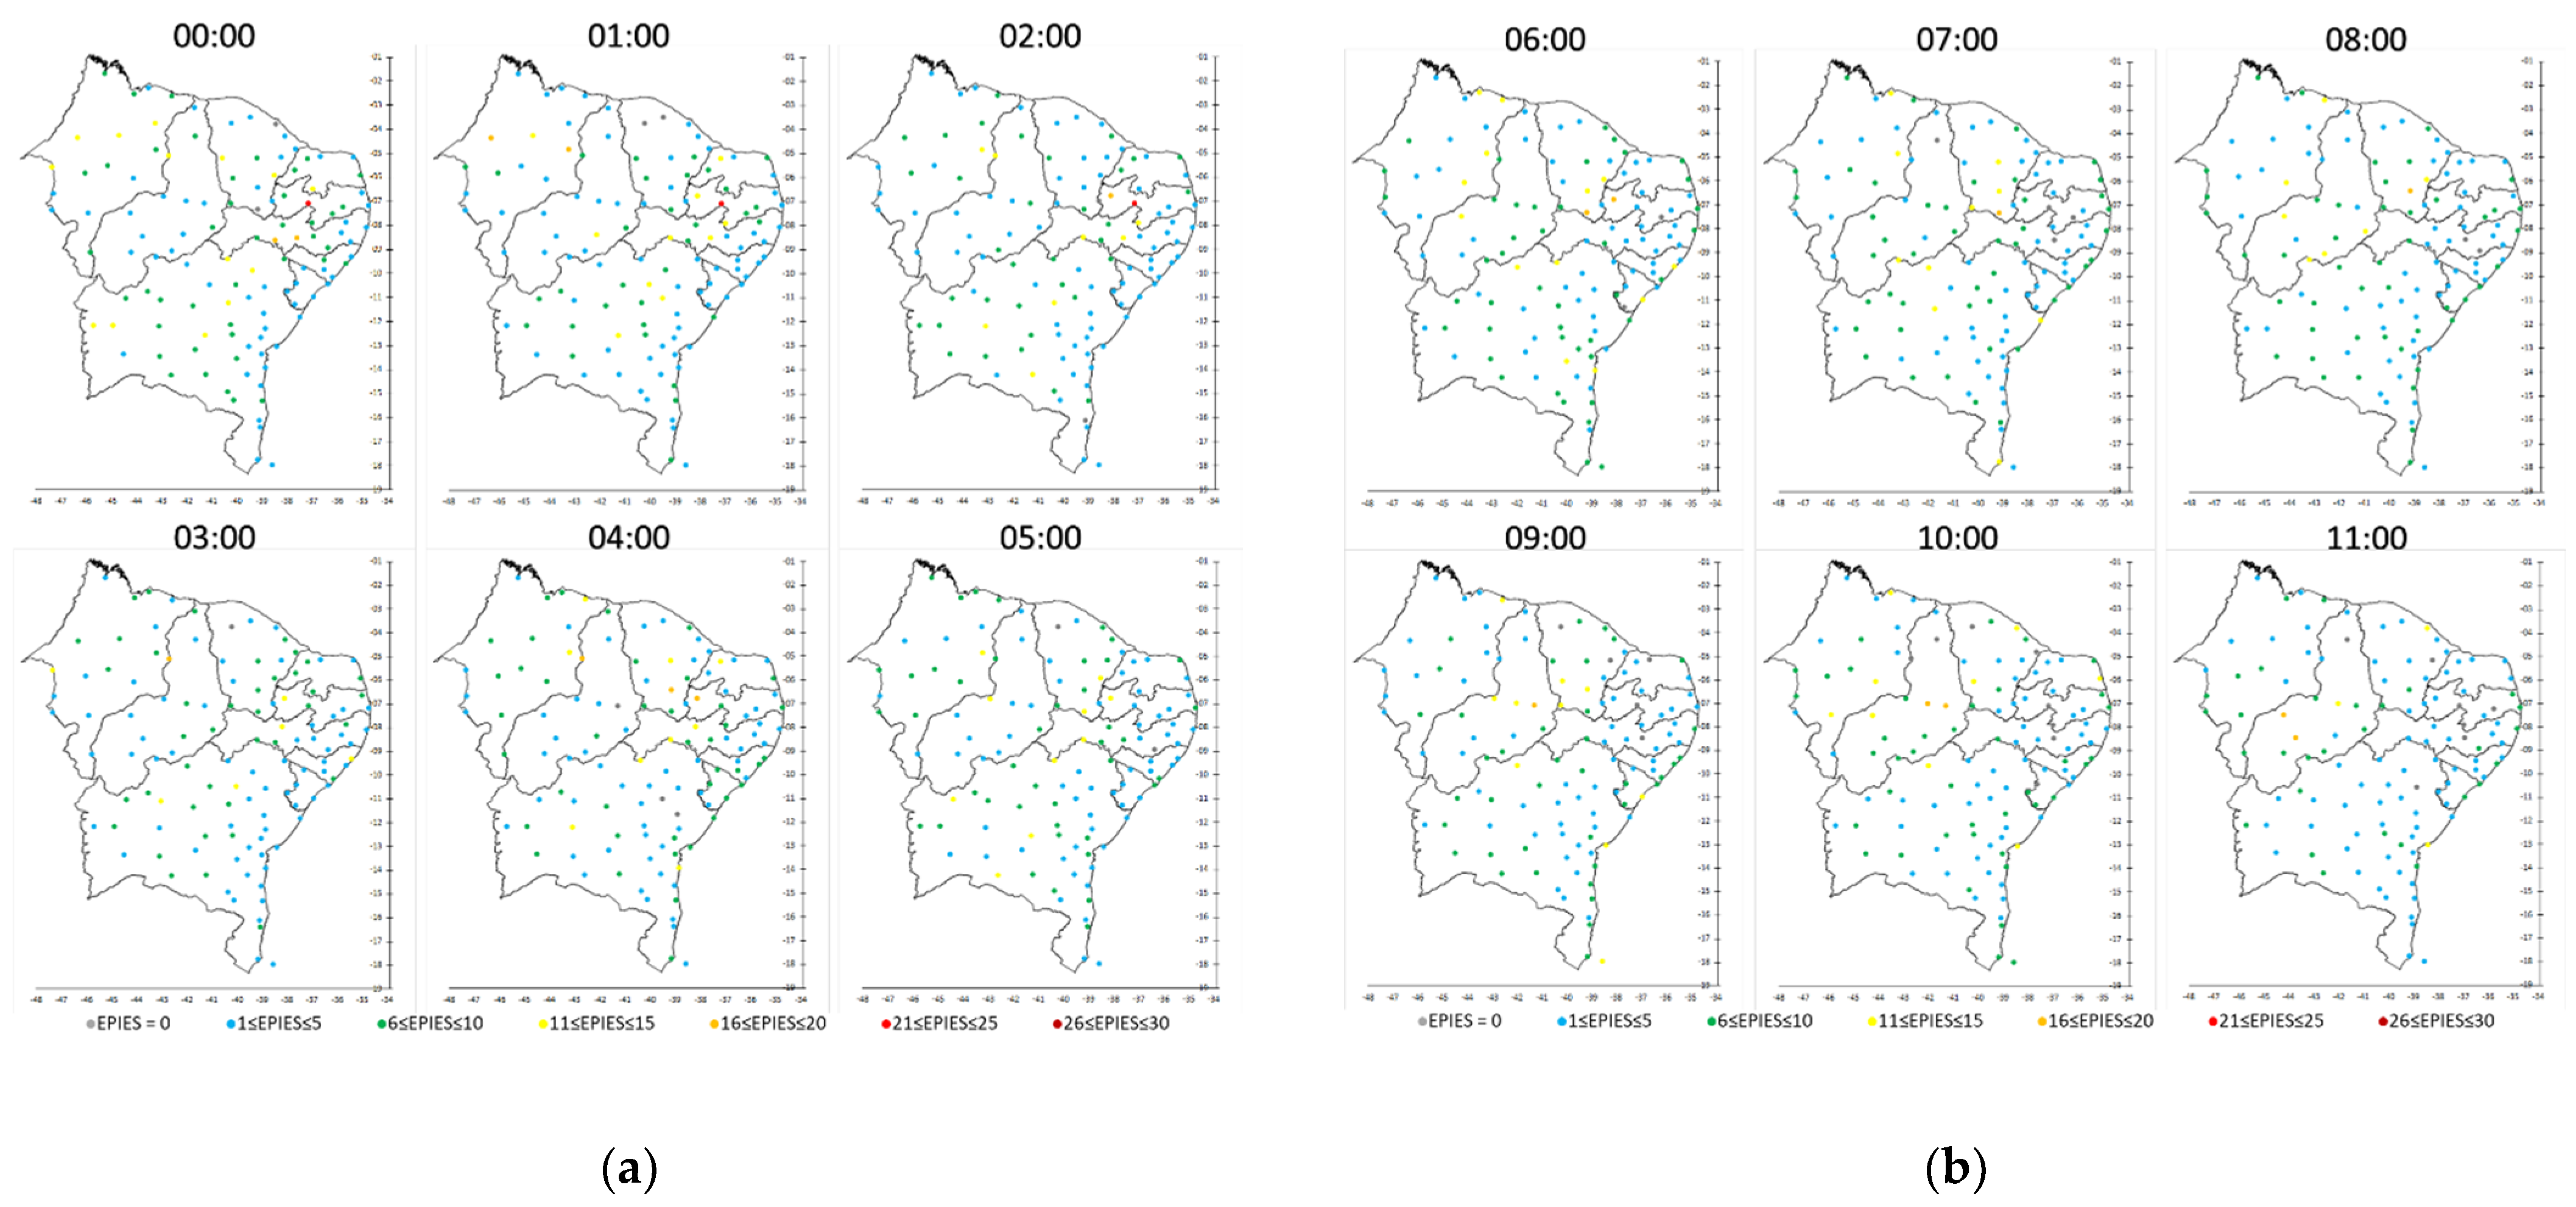
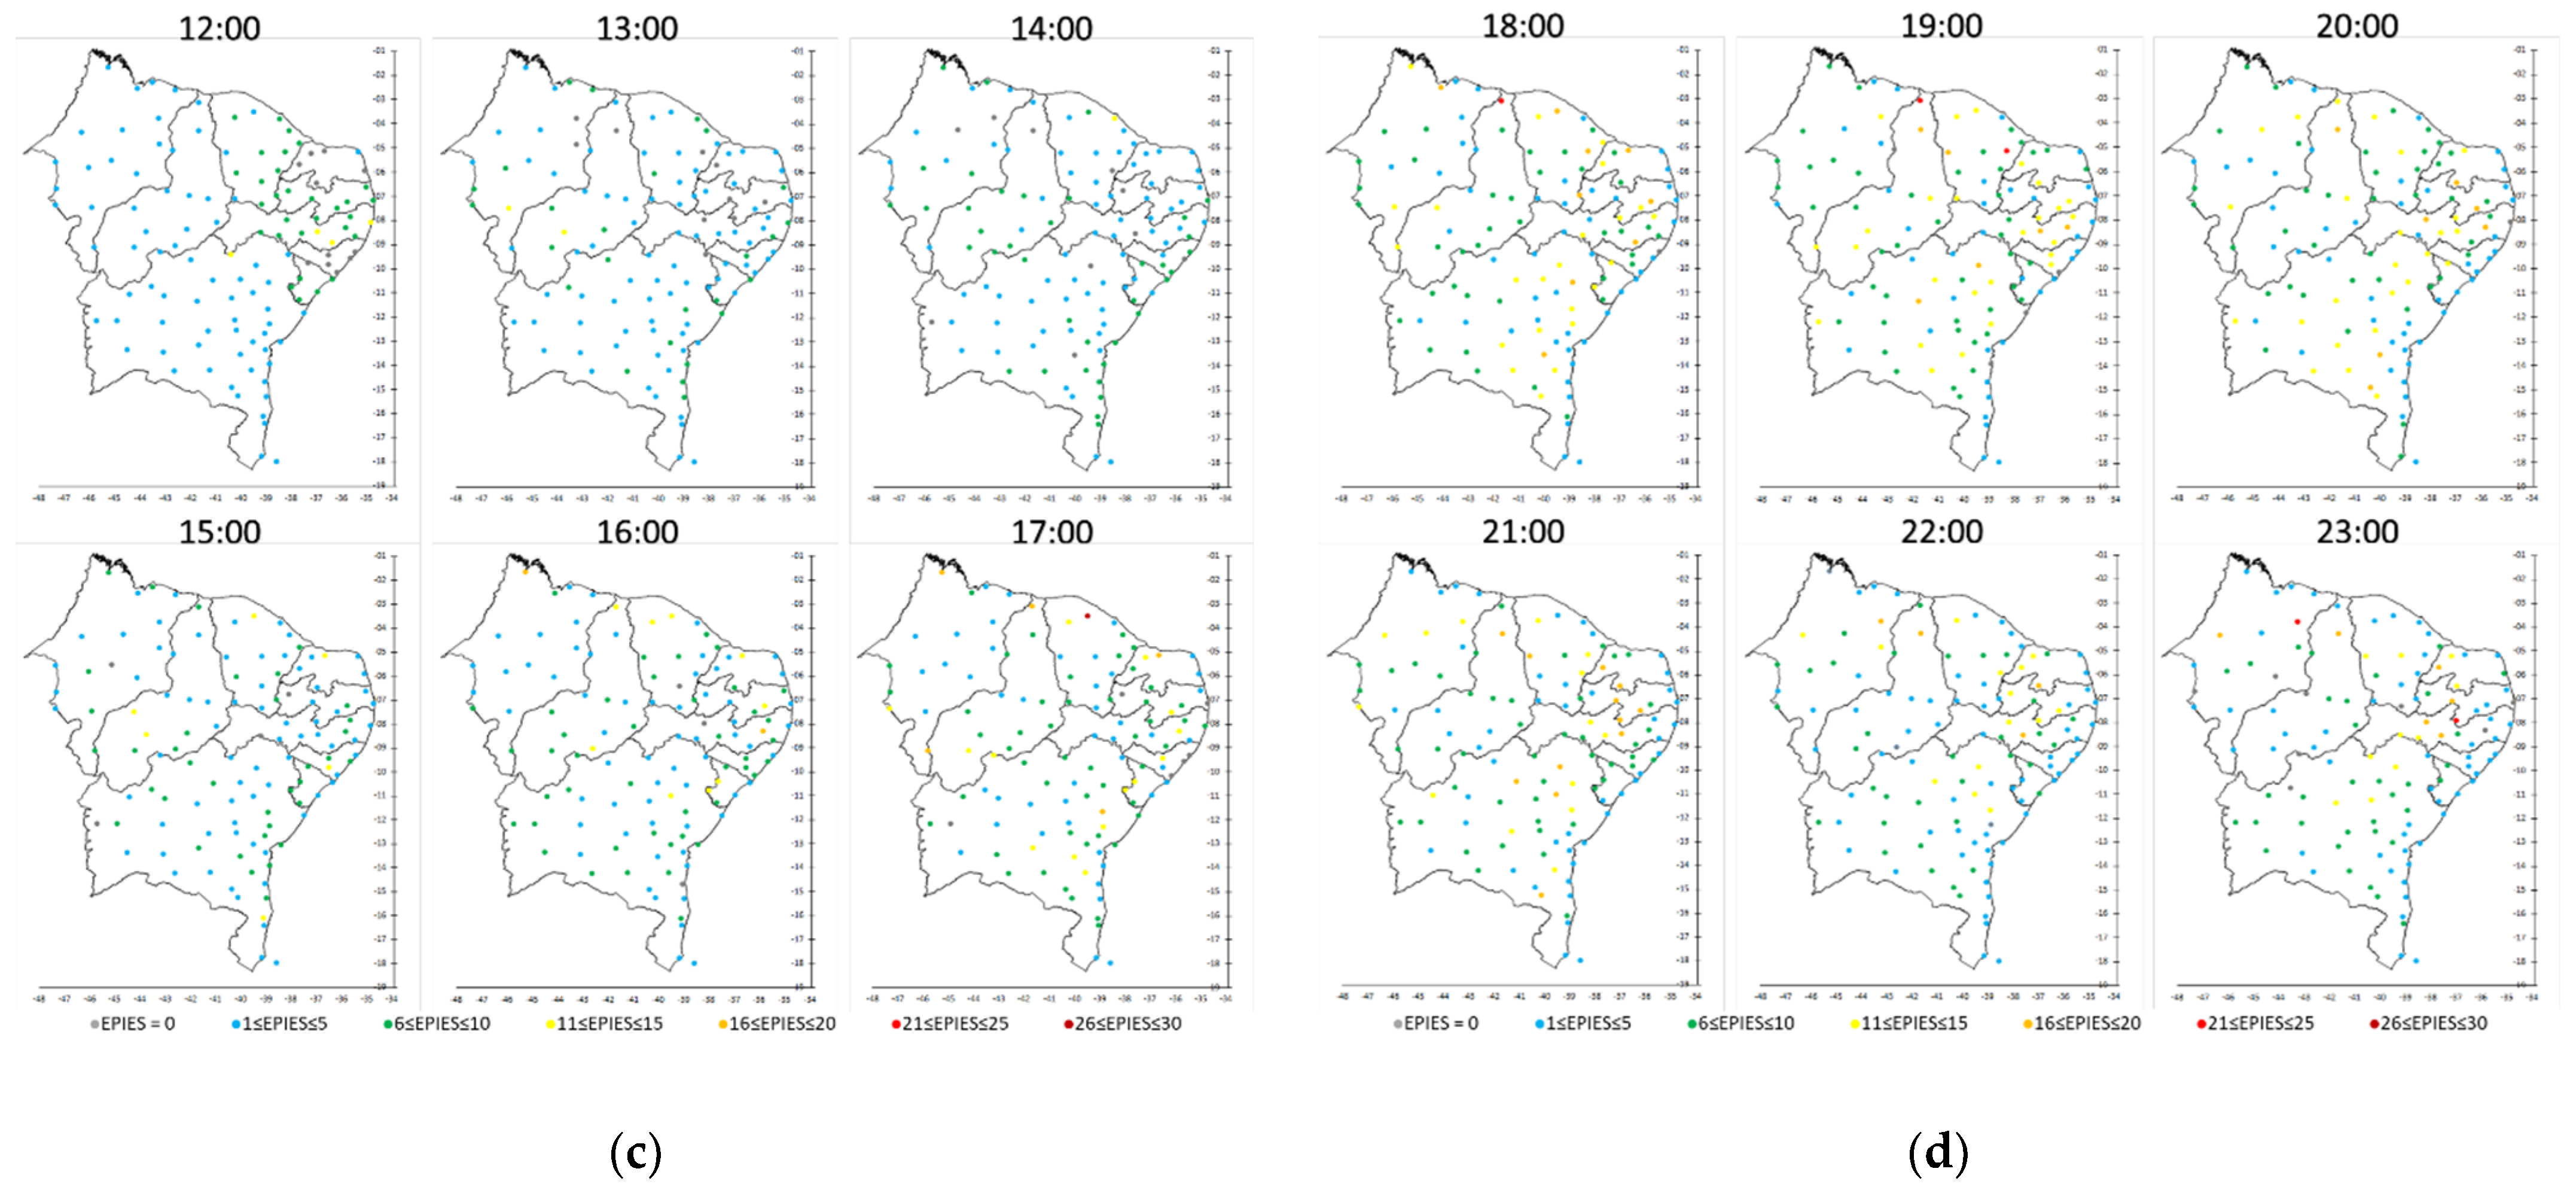
Graphs referring to the occurrence of EPIES on the hourly scale were generated using an x-y plane and geo-referenced in terms of latitude and longitude coordinates of the meteorological stations. The results are presented and divided into four-quarters of the day: between 00:00 h and 05:00 h (Figure 1a), between 06:00 h and 11:00 h (Figure 1b), between 12:00 h and 17:00 h (Figure 1c), and between 18:00 h and 23:00 h (Figure 1d). All the graphs were subject to the same categorization about the amount of EPIES occurrences. The quantity of occurrence was separated by color: the color gray belongs to the group without events, and the colors blue, green, yellow, orange, red, and burgundy belong to groups with a number of occurrences varying between 1 and 5, 6 and 10, 11 and 15, 16 and 20, 21 and 25, and between 26 and 30, respectively.
Analyzing Figure 1a, between 00:00 h and 02:00 h, the majority of meteorological stations showed a number of occurrences below or equal to five events. Patos/PB station stood out for presenting quantification of EPIES equal to or higher than 21 events during this time. At 04:00 h, there is an increase in the number of stations, with between 6 and 10 occurrences. Teresina/PI station stood out for presenting from 16 to 20 events in this subgroup.
In looking at Figure 1b, which refers to the range from 06:00 h and 11:00 h, the group composed of two stations that contained 11 to 15 events was the highest number of occurrences during the first hour of this category. At 07:00 h and 08:00 h, a vast quantity of stations composes the group from 1 to 5 events, being the subgroup with the largest quantity of stations, although the majority of the capitals of the states are more concentrated in the subgroup with 6 to 10 EPIES. At 09:00 h, the larger amount of registered occurrences was between 21 and 25 events. While at 10:00 h, the largest quantity was from 16 to 20 EPIES. With respect to 11:00 h, it was found that all Potiguar stations were located between 1 and 5 events. The subgroup from 16 to 20 EPIES was the occurrence limit in this interval.
According to the analyses in Figure 1c, at 12:00 h, the group with 1 to 5 events showed the larger number of stations, so all stations located in Maranhão, Piauí, and Bahia were found in this group. At 13:00 h, 10 stations without events were counted. Most of the capitals are in the subgroup, referring to the number of 1 to 5 events. During 14:00 h, only the Fortaleza/CE station had more than 10 occurrences of EPIES. At 15:00 h, the largest number of occurrences identified was limited to the corresponding subgroup between 11 and 15 events. While at 17:00 h, the station located in Itapipoca/CE presented more than 25 EPIES, reporting the maximum observed value.
In the analysis of Figure 1d, during 18:00 h, a significant part of the capitals presented from 1 to 5 EPIES. The highest number of occurrences of EPIES did not exceed 25 events. At 19:00 h and 20:00 h, the group with from 11 to 15 events, as so as 16 and 20, even though they are not composed of capitals, presented significant numbers of stations. However, at 19:00 h, the largest quantity of EPIES was in the subgroup with values greater than 20 events. With respect to 21:00 h, all stations had at least one occurrence during this time since no stations with no events were observed. Most of the stations in the capitals presented from 1 to 5 EPIES. The subgroups between 11 and 15 events and between 16 and 20 events contain significant numbers of meteorological stations. In analysis at 22:00 h, as well as the previous time, there is a large number of stations in the subgroups between 11 and 15 and between 16 and 20, although both do not present capitals in their compositions. Concluding the analysis of Figure 1d, at 23:00 h, stations composing the subgroup of occurrences between 21 to 25 EPIES were observed.
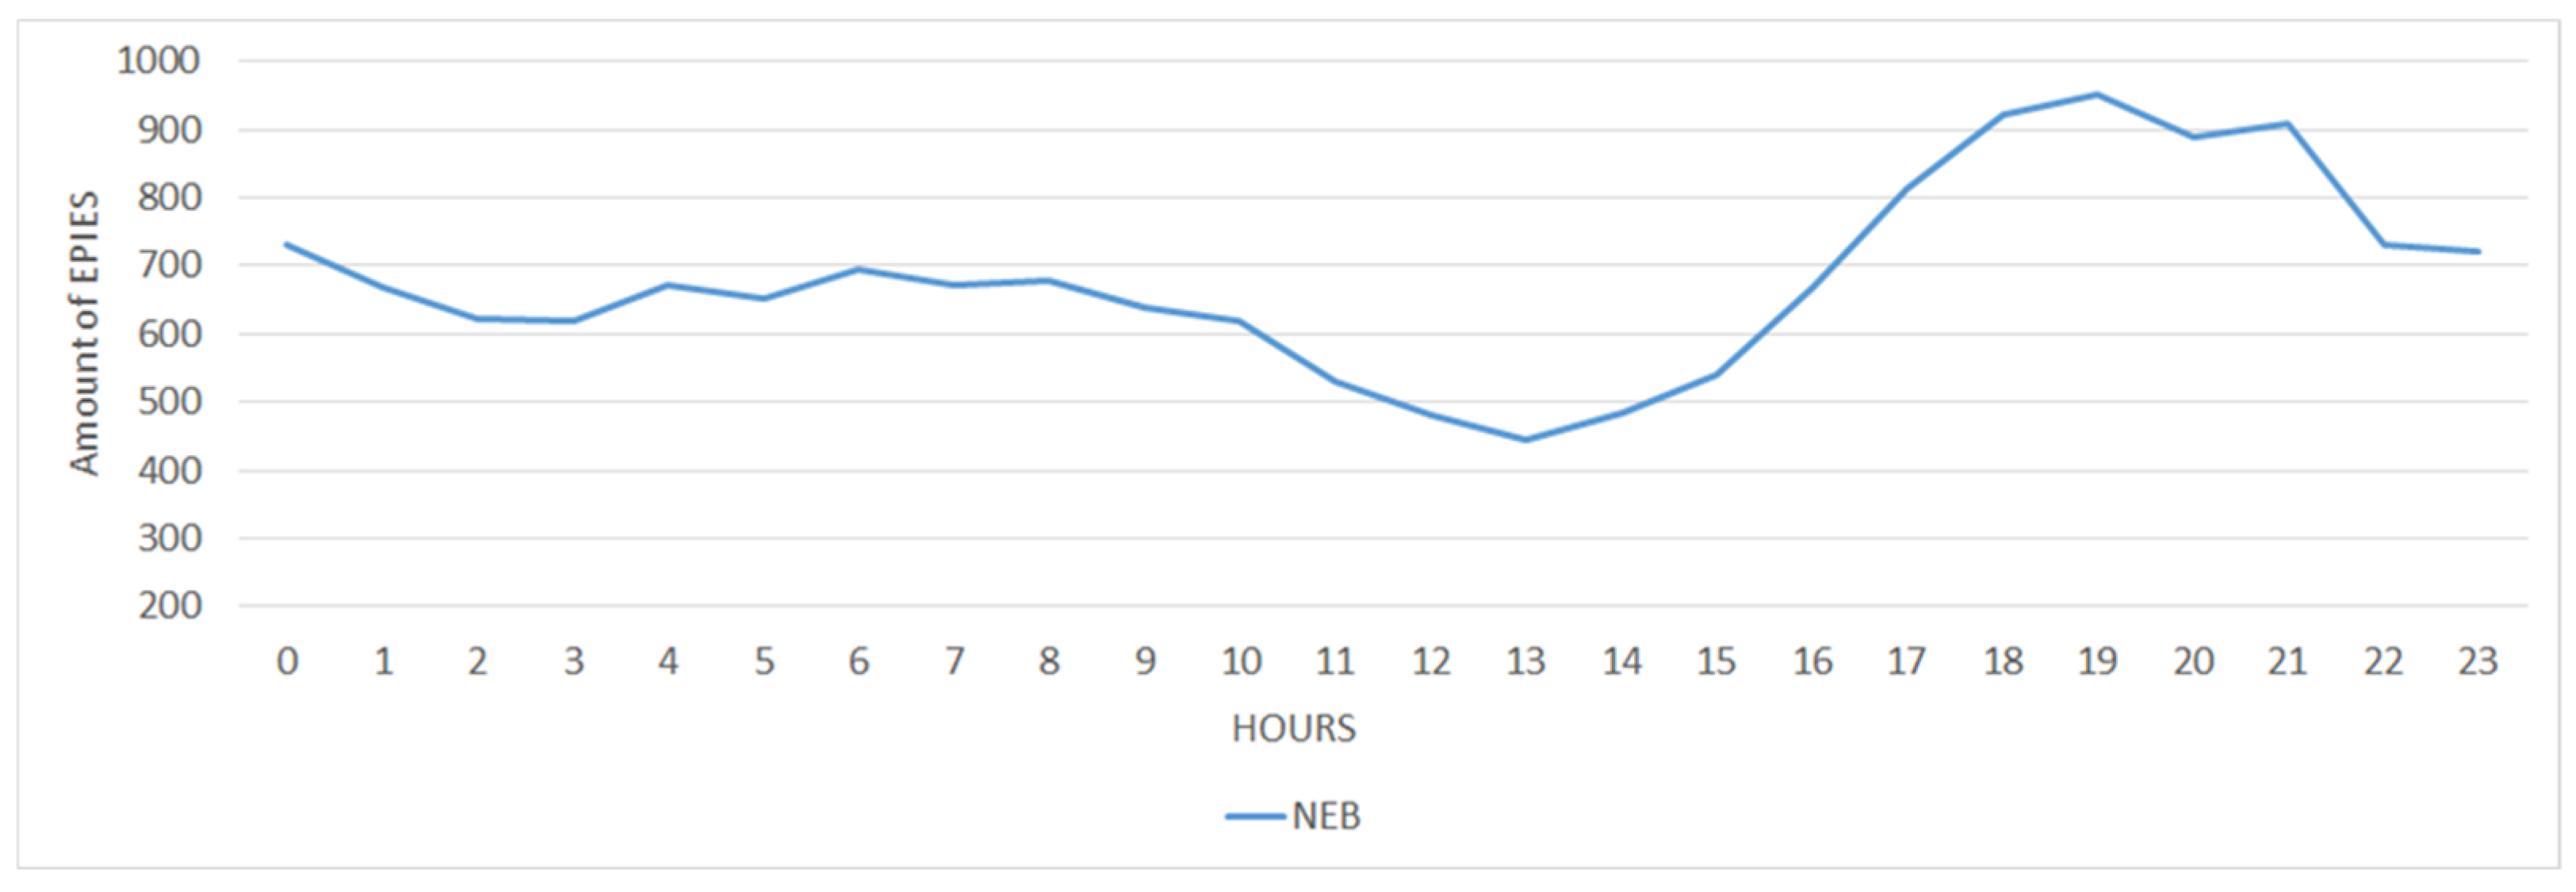
Performing the sum of occurrences per hour, we have the quantities of EPIES in the Northeast hourly. Therefore, it was possible to plot such information in a line graph described in Figure 2, to analyze the subsidiary periods that presented the highest and lowest numbers of occurrences of EPIES in the NEB. At night, the highest number of EPIES was presented. While at 13:00 h, the least amount of events was observed.
Still carrying out the sum of the observed values, it is possible to order the five stations that presented the highest and lowest quantity of occurrence. Therefore, the meteorological stations of Ibimirim/PE, Delfino/BA, Cabrobó/PE, Oeiras/PI e Tauá/CE had the highest numbers of EPIES in this exact order. At the same time, Ilhéus/BA, João Pessoa/PB, Palmares/PE, Abrolhos/PE, and Valença/BA were the stations that presented the lowest number of events, respectively.
Implementing the same analysis to the states’ capitals, we have the quantification of EPIES in descending order: Teresina/PI, São Luis/MA, Aracaju/SE, Salvador/BA, Fortaleza/CE, Natal/RN, Maceió/AL, Recife/PE, and João Pessoa/PB. Aracaju and Salvador had the same number of events.
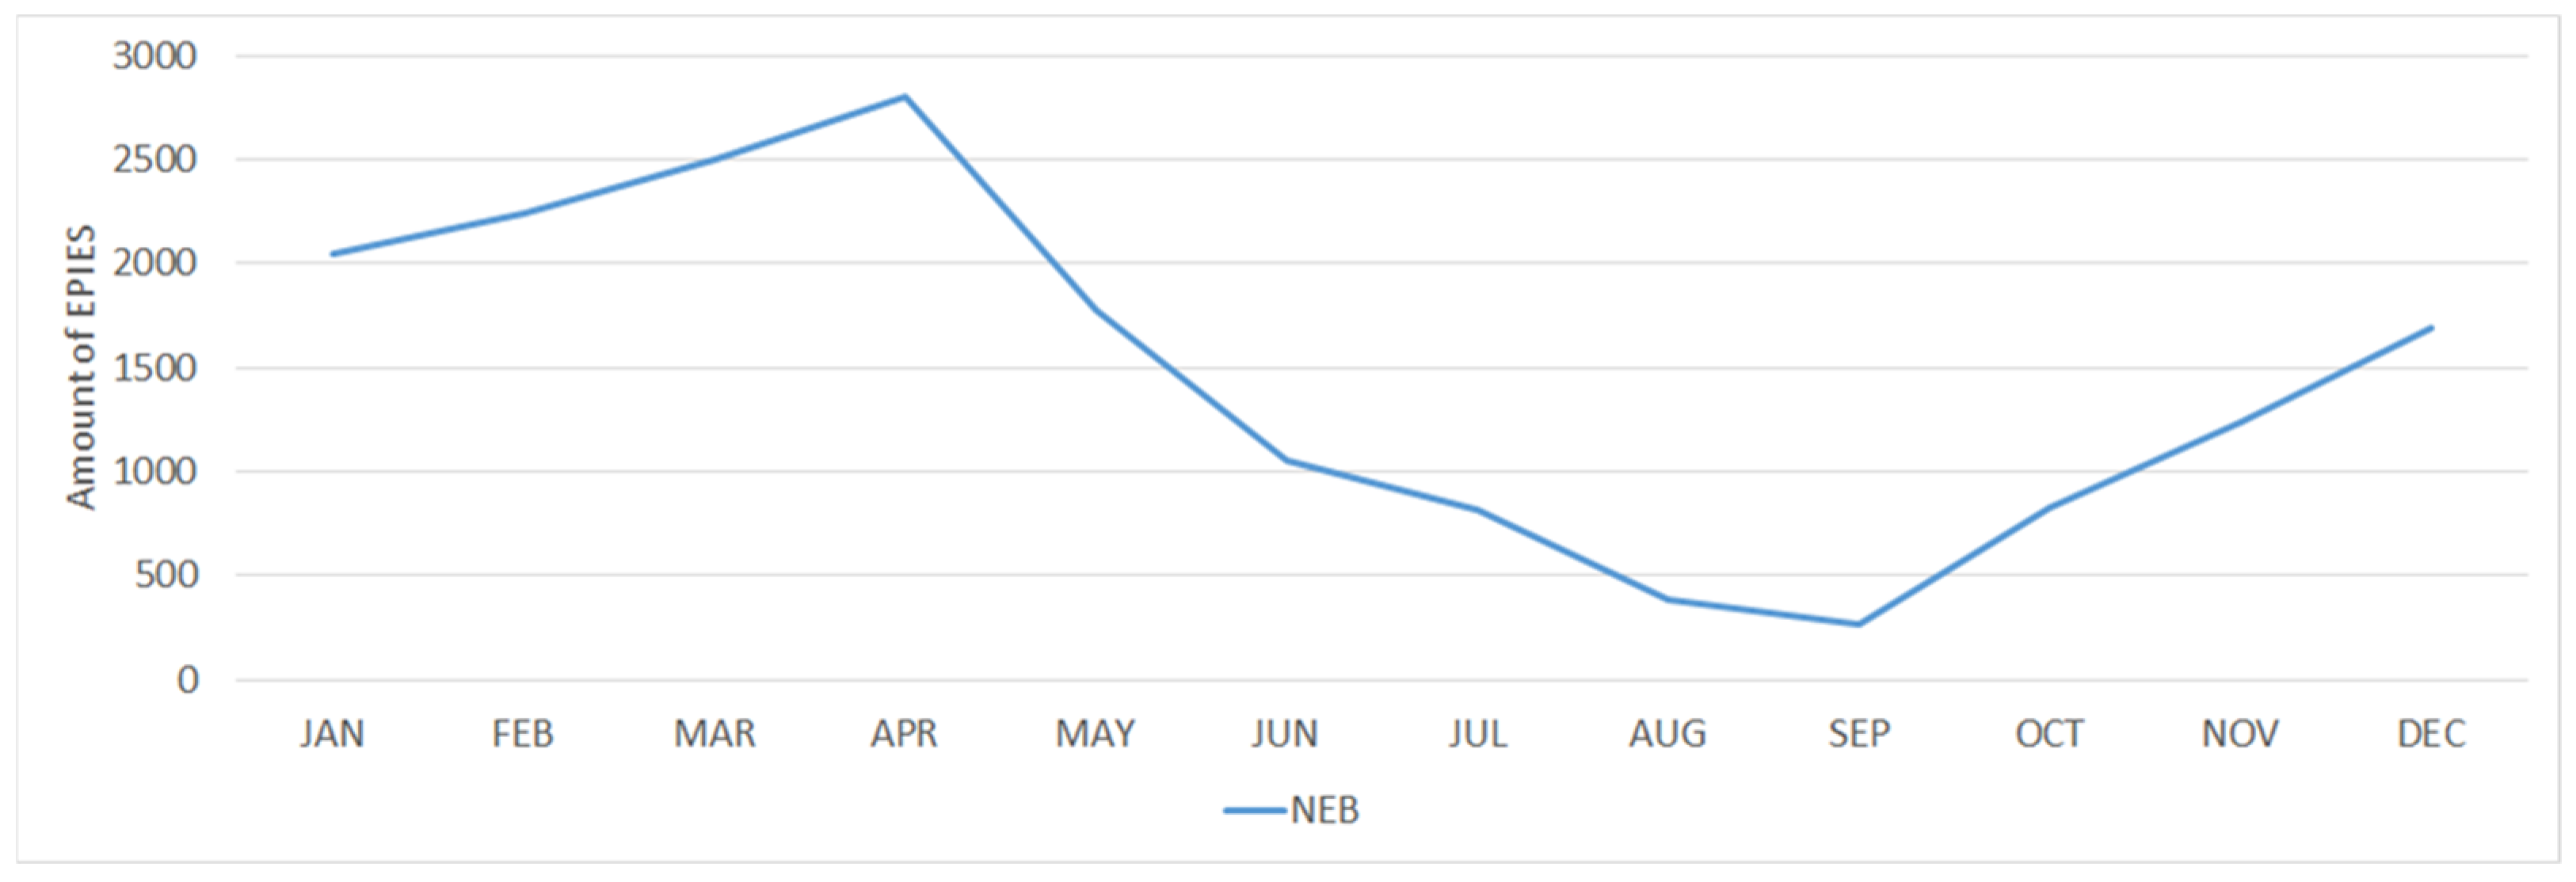
Considering the monthly occurrences of all years, through the sum of all occurrences in the Northeast, Figure 3 shows a graphic of this information. Therefore, analyzing the line graph, it is notable that the largest amounts of EPIES occurred during the month of April, while the smallest are presented between August and September.
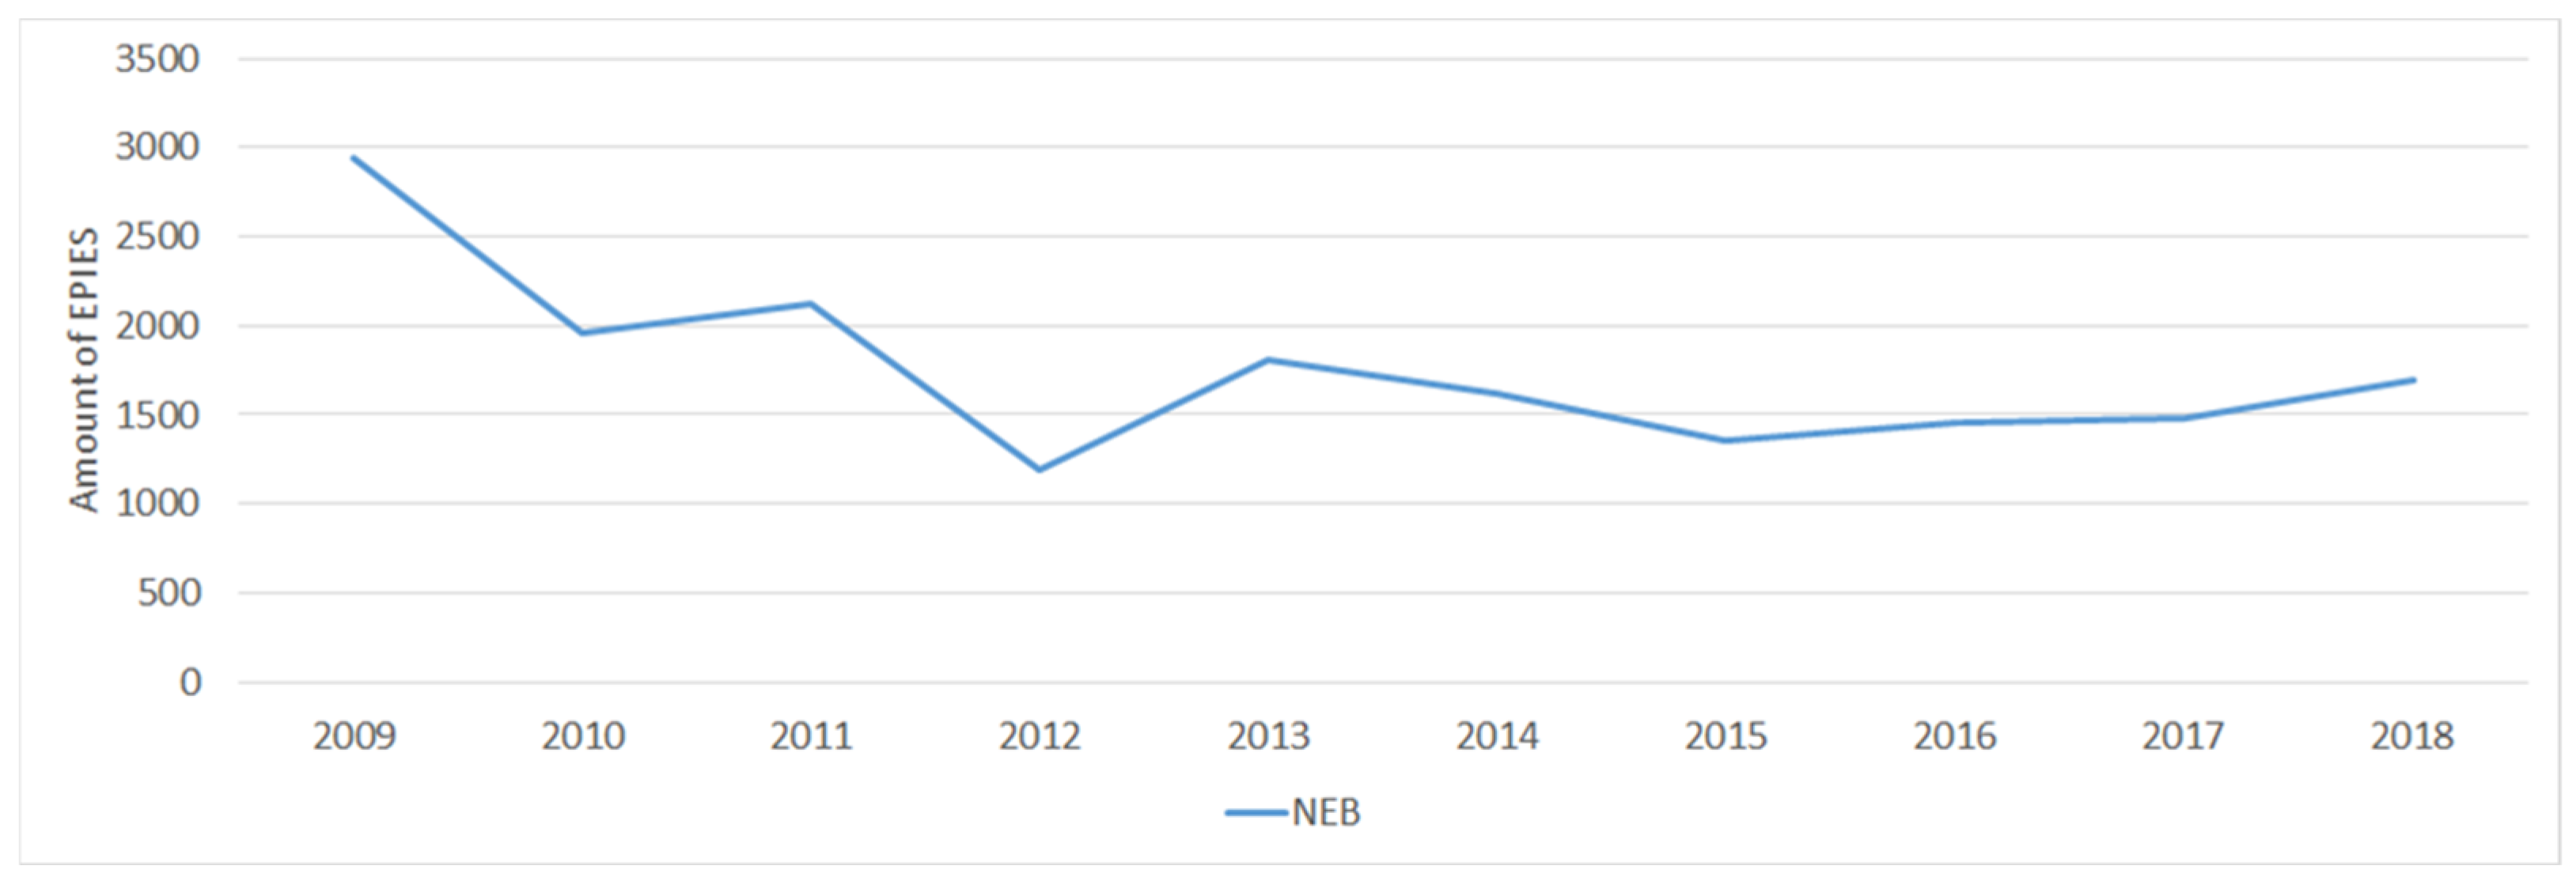
With the same objective, a graphic was made with the annual sum of the number of EPIES (Figure 4). The year with the highest amount of events was reported as 2009, while the one with the lowest amount was 2012.
4. Conclusions
Aiming to characterize the spatial and temporal distribution of EPIES on the NEB from hourly data in order to analyze the seasonality of events and the influence of interannual variability on the occurrence of EPIES, the present study demonstrated that the night period presented greater amounts of occurrences of this type of event. Ibimirim/PE meteorological station had the biggest number of events, and Ilhéus/BA had the smallest during the interval studied. It was shown that Q values varied between 3.4 mm and 28.6 mm, referring to the Petrolina/PE and São Luís/MA stations, respectively. Among the capitals, Teresina/PI presented the highest number of occurrences, as well as João Pessoa/PB the lowest number of EPIES, not only among the capitals but also proved to be the second meteorological station with the lowest amounts of events among all of the Northeast. It was observed that during the year 2009, the events occurred more frequently, while in 2012, they were less frequent. It is proposed for future work an increase in the period of study and ways to ease the failures present in the databases, increasing the reliability of the results. However, given the conditions of data availability, the present work proved to be competent in terms of the objective presented.
Author Contributions
Conceptualization, P.A.A.d.A. and C.M.S.e.S.; methodology, P.A.A.d.A.; software D.T.R.; validation, P.A.A.d.A., C.M.S.e.S. and D.T.R.; formal analysis, D.T.R.; investigation, A.M.V.; data curation, D.T.R. and A.M.V.; writing-original draft preparation, P.A.A.d.A.; writing-restew and editing, P.A.A.d.A.; visualization, C.M.S.e.S.; supervision, C.M.S.e.S.; project administration, C.M.S.e.S.; funding acquisition, C.M.S.e.S. All authors have read and agreed to the published version of the manuscript.
Funding
This research was funded by National Council for Research and Development (CNPq) grant number PIB14178-2017.
Institutional Review Board Statement
Not applicable.
Informed Consent Statement
Not applicable.
Data Availability Statement
The data can be obtained from the meteorological database of the National Institute of Meteorology. https://portal.inmet.gov.br/ (accessed on 30 September 2020).
Conflicts of Interest
The authors declare no conflict of interest.
References
- Teixeira, R.F.B. O fenômeno da brisa e sua relação com a chuva sobre Fortaleza-CE. Rev. Bras. De Meteorol. 2008, 23, 282–291. [Google Scholar] [CrossRef]
- Coutinho, M.D.L.; Gan, M.A.; Rao, V.B. Método objetivo de identificação dos vórtices ciclônicos de altos níveis na região Tropical Sul: Validação. Rev. Bras. De Meteorol. 2010, 25, 311–323. [Google Scholar] [CrossRef]
- Torres, R.R.; Ferreira, N.J. Case Studies of Easterly Wave Disturbances over Northeast Brazil Using the Eta Model. Weather. Forecast. 2011, 26, 225–235. [Google Scholar] [CrossRef]
- Reboita, M.S.; Gan, M.A.; Rocha, R.P.; Ambrizzi, T. Regimes de precipitação na América do Sul: Uma revisão bibliográfica. Rev. Bras. De Meteorol. 2010, 25, 185–204. [Google Scholar] [CrossRef]
- Knutti, R. IPCC Working Group I AR5 snapshot: The rcp45 experiment. World Data Cent. Clim. (WDCC) DKRZ 2014. [Google Scholar] [CrossRef]
- Bezerra, B.G.; Silva, L.L.; Santos e Silva, C.M.; De Carvalho, G.G. Changes of precipitation extremes indices in São Francisco River Basin, Brazil from 1947 to 2012. Theor. Appl. Climatol. 2019, 135, 565–576. [Google Scholar] [CrossRef]
- Instituto Brasileiro De Geografia E Estatística. Instituto Brasileiro de Geografia e Estatística; 2010. Available online: https://www.ibge.gov.br/ (accessed on 10 January 2023).
- Martins, M.E.G. Percentis. Rev. De Ciência Elem. 2014, 2, 3. [Google Scholar]
Figure 1.
Graphs referring to the amounts of EPIES separated into subgroups: (a) between 00:00 and 05:00 h; (b) between 06:00 h and 11:00 h; (c) between 12:00 h and 17:00 h; (d) between 18:00 h and 23:00 h.
Figure 1.
Graphs referring to the amounts of EPIES separated into subgroups: (a) between 00:00 and 05:00 h; (b) between 06:00 h and 11:00 h; (c) between 12:00 h and 17:00 h; (d) between 18:00 h and 23:00 h.


Figure 2.
Line graph of the distribution of EPIES occurrences in the Northeast, hourly.

Figure 3.
Line graph of the distribution of EPIES occurrences in the Northeast, monthly.

Figure 4.
Line graph of the distribution of EPIES occurrences in the Northeast, annually.

Disclaimer/Publisher’s Note: The statements, opinions and data contained in all publications are solely those of the individual author(s) and contributor(s) and not of MDPI and/or the editor(s). MDPI and/or the editor(s) disclaim responsibility for any injury to people or property resulting from any ideas, methods, instructions or products referred to in the content. |
© 2023 by the authors. Licensee MDPI, Basel, Switzerland. This article is an open access article distributed under the terms and conditions of the Creative Commons Attribution (CC BY) license (https://creativecommons.org/licenses/by/4.0/).
Share and Cite
MDPI and ACS Style
de Araújo, P.A.A.; Silva, C.M.S.e.; Rodrigues, D.T.; Valentim, A.M. Analysis of Extreme Rainfall Events on a Sub-Daily Scale in Northeast. Environ. Sci. Proc. 2023, 25, 97. https://doi.org/10.3390/ECWS-7-14299
AMA Style
de Araújo PAA, Silva CMSe, Rodrigues DT, Valentim AM. Analysis of Extreme Rainfall Events on a Sub-Daily Scale in Northeast. Environmental Sciences Proceedings. 2023; 25(1):97. https://doi.org/10.3390/ECWS-7-14299
Chicago/Turabian Stylede Araújo, Paula Andressa Alves, Cláudio Moisés Santos e Silva, Daniele Tôrres Rodrigues, and Aléxia Monteiro Valentim. 2023. "Analysis of Extreme Rainfall Events on a Sub-Daily Scale in Northeast" Environmental Sciences Proceedings 25, no. 1: 97. https://doi.org/10.3390/ECWS-7-14299