1. Introduction
Flood has become an annual disaster that is probably the most destructive, boundless, and causes significant losses in many countries [
1]. This inundation phenomenon usually inundates areas which are normally dry, and causes significant losses physically, socially, and environmentally [
2].
Lima Puluh Kota Regency is a regency in West Sumatera Province Indonesia that is located in sub-catchment Batang Sinamar River Basin, and is part of the upstream of Indragiri catchment area with a total area about 1330.65 km2. This regency is located on the hillside of the Sago Mountain that has experienced floods from Batang Sinamar River Basin every year in the last decade, from 2010 to 2019. The annual floods cause significant losses in agriculture and public facilities; therefore, a flood prediction model is needed to evaluate this phenomenon.
Hydrodynamic and hydrological models are widely applied to represent flood assessment. Hydrological models such as HEC-HMS, SWAT, and MIKE 11 are usually applied to reproduce the precipitation-runoff process. Hydrodynamic models such as MIKE 21, HECRAS, and DELFT 2D can simulate flow along rivers and floodplains [
3,
4]. The selection of the model is considered on the purpose of the model and availability of time, funds, and data.
Availability and quality of hydrometeorological data are the main problems in developing countries. The lack of long-term hydro-meteorological observation data and river’s topography affects the result of the hydraulic and hydrological model. However, over the last decades, a large number of satellites have been developed by international agencies. Even though the qualities and resolution of these data are not as detailed and accurate as observation data, they provide sufficient results for this phenomenon [
5,
6].
Common model practitioners run their flood model in two different models, one for hydrological process for the input in the upstream boundary condition, and another for hydrodynamics for the flood inundation. These methods are quite difficult to identify in larger basins if many floods happen. Therefore, the Rainfall-Runoff-Inundation (RRI) model was developed with fully two-dimensional distributed rainfall-runoff inundation [
7]. This model is widely applied in flood risk mapping [
8,
9] and flood damage assessment and management [
10,
11,
12].
In this paper, the flood inundation model using the Rainfall-Runoff-Inundation model is presented. The model is calibrated with a 2019 flood event and simulated with 10- and 25-years’ time return to see the performance and the maximum inundation area.
2. Methods and Materials
2.1. Rainfall-Runoff-Inundation Model
The Rainfall-Runoff-Inundation model is a two-dimensional-based model that can simulate rainfall runoff and inundation processes simultaneously [
7,
13,
14]. This model is able to simulate the water that flows on slopes using 2D diffusion wave equations, and the discharge in rivers using 1D diffusion wave equations. For more realistic results from rainfall-runoff simulation processes, this model also takes consideration of lateral subsurface flow, vertical infiltration, and surface flow. The infiltration process is calculated using the Green-Ampt method [
13] with parameters including saturated hydraulic conductivity (K) [mm/hour], soil surface porosity (
, suction head (Sf) [mm], and depth of saturated soil (d) [mm]. The river geometry parameter that is the input of the model can be obtained using Equations (1) and (2) as a function of catchment area
A [km
2]. The river geometry is considered as a rectangle with
W [m] as the width of the river and
D [m] as the depth of the river.
2.2. Target Flood Event
Batang Sinamar River Basin is a sub-catchment of Indragiri River’s catchment area. The area of Batang Sinamar River Basin catchment is 1330.65 km2. This river is used to irrigate 7766 Ha agriculture areas. It is on average 1246 m at the upstream and 486 m at the downstream above mean sea level.
In December 2019, there uncommon flood events happened at two adjacent times. The rainfall high is within the average, but the volume increased because of the length of the rain event. It affected six districts and damaged residents, public facilities, and agriculture. Besides the flood event in 2019, the model is performed for the flood event in 2013.
2.3. Data Used and Preparation
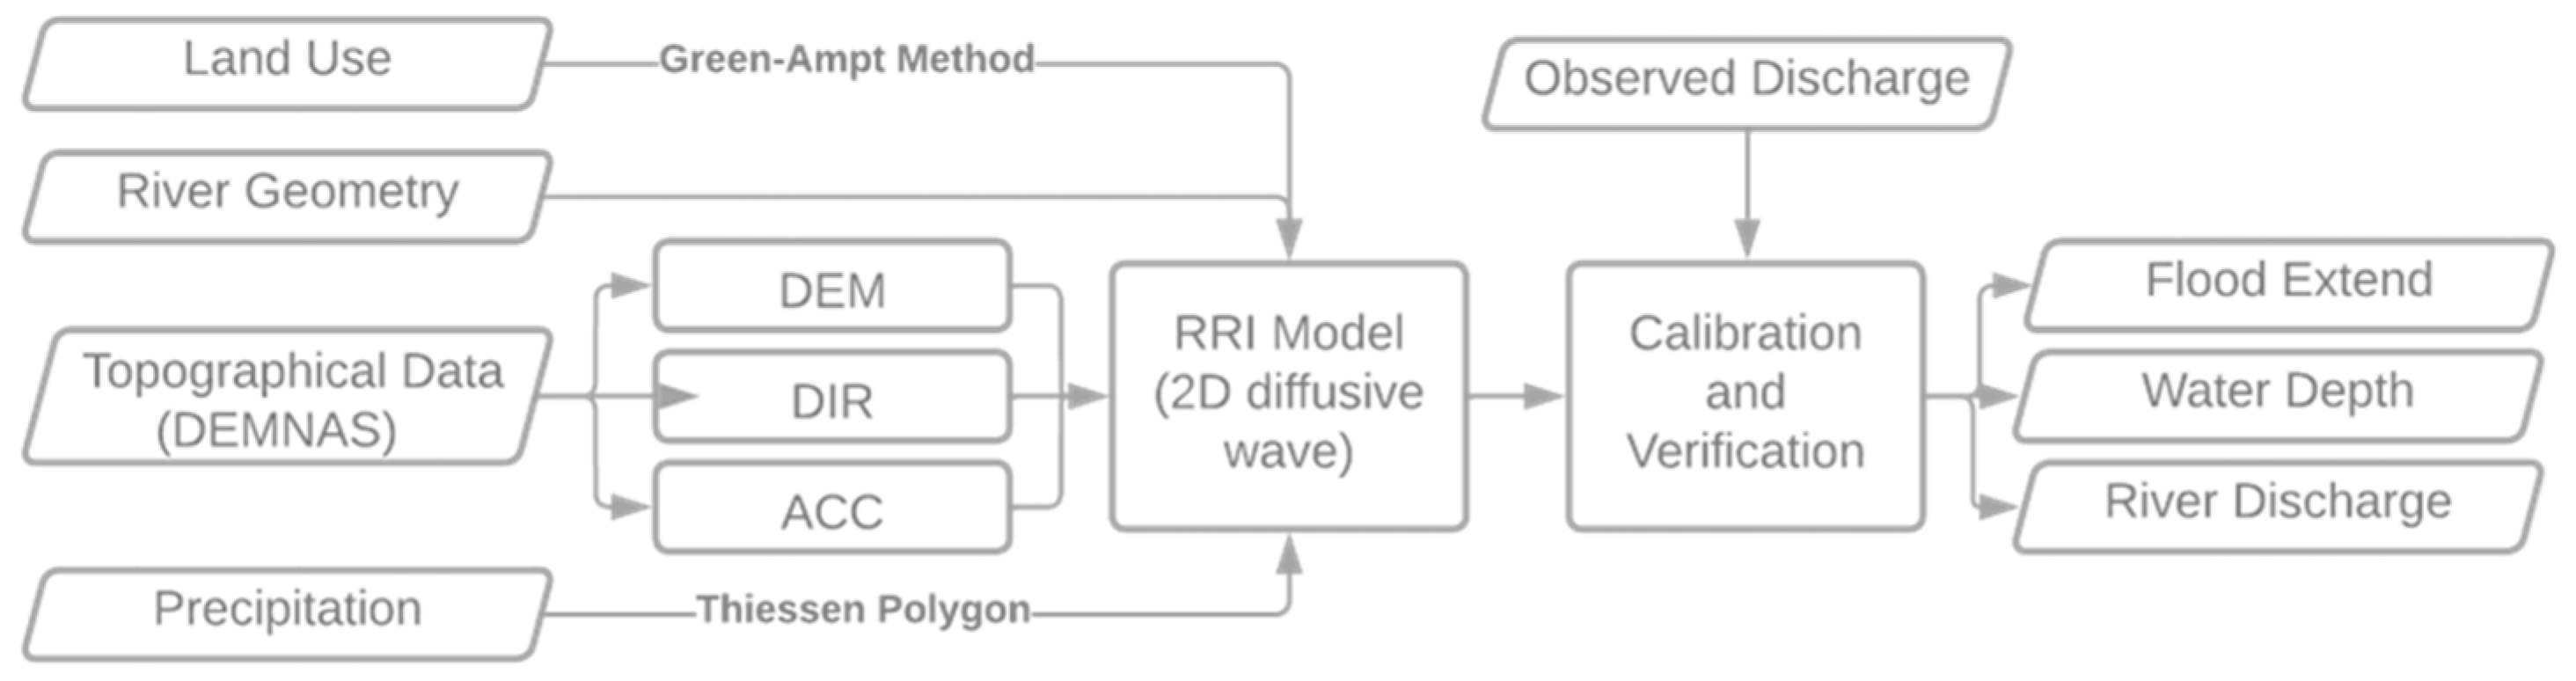
The general workflow of this study is shown in
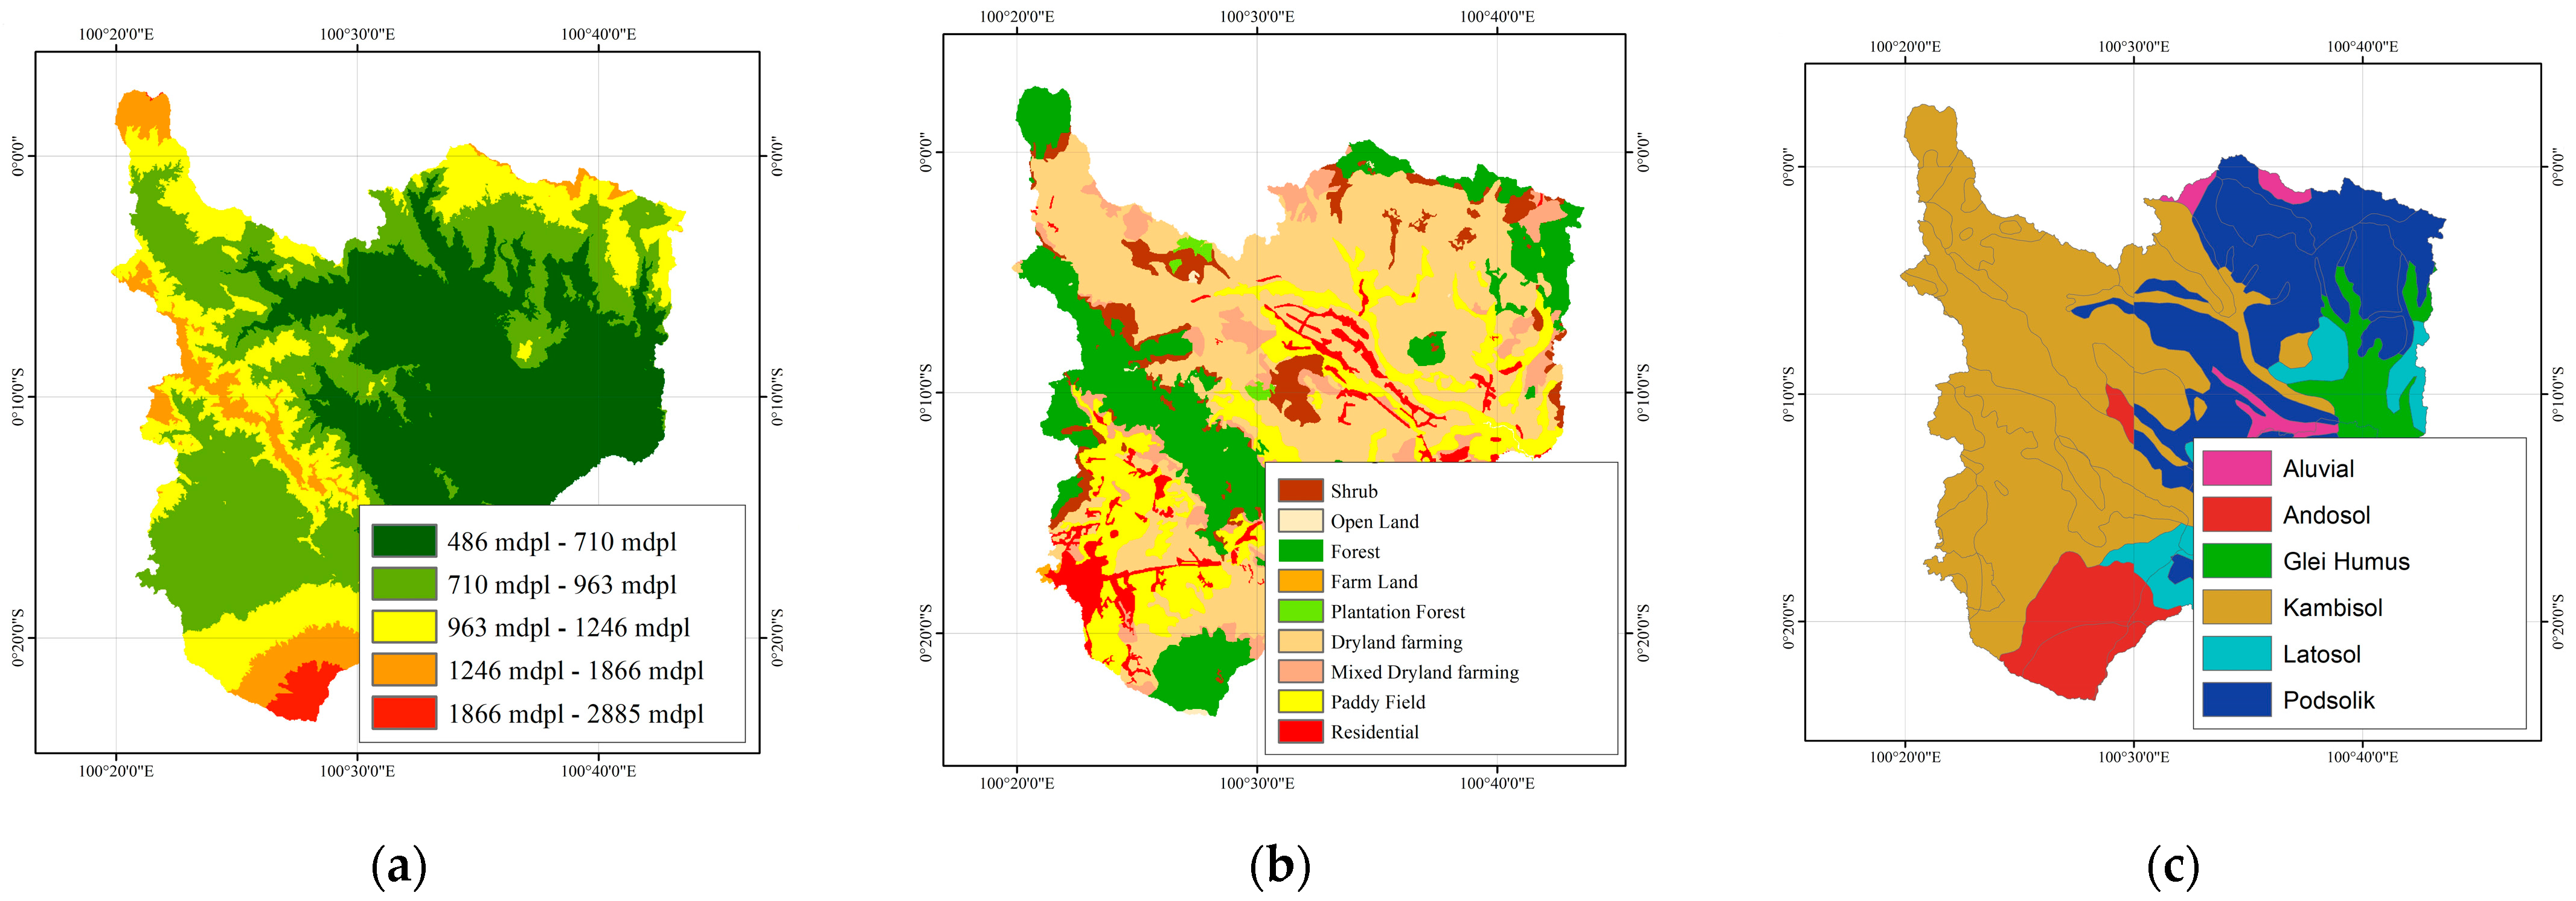
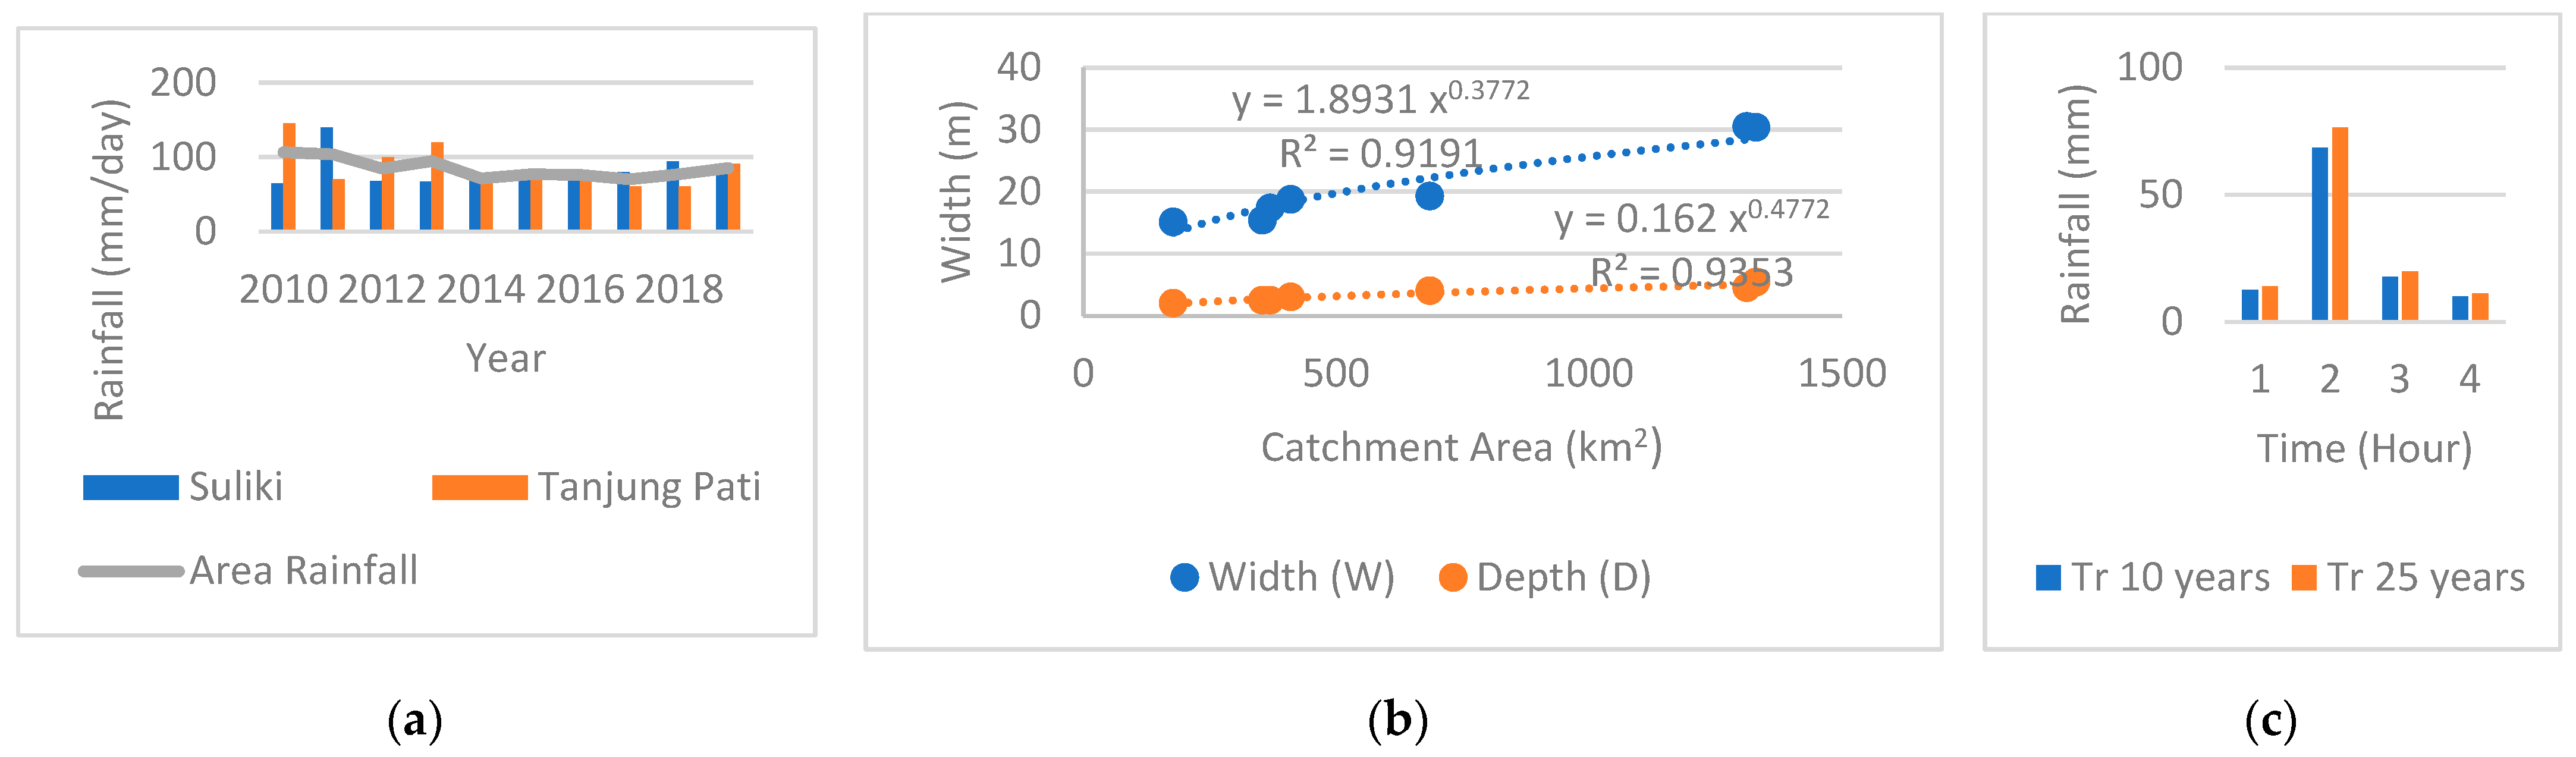
Figure 1, and the required input data gathered for this study include high daily rainfall in Suliki and Tanjung Pati Station for ten years, and Batang Sinamar Water Surface Elevation Station by Water Resources Agency of West Sumatera, digital elevation model (dem) by DEMNAS Indonesia (you can access it here: DEMNAS (indonesia.go.id)), and land use and soil type by Indonesia Geospatial Agency as shown in
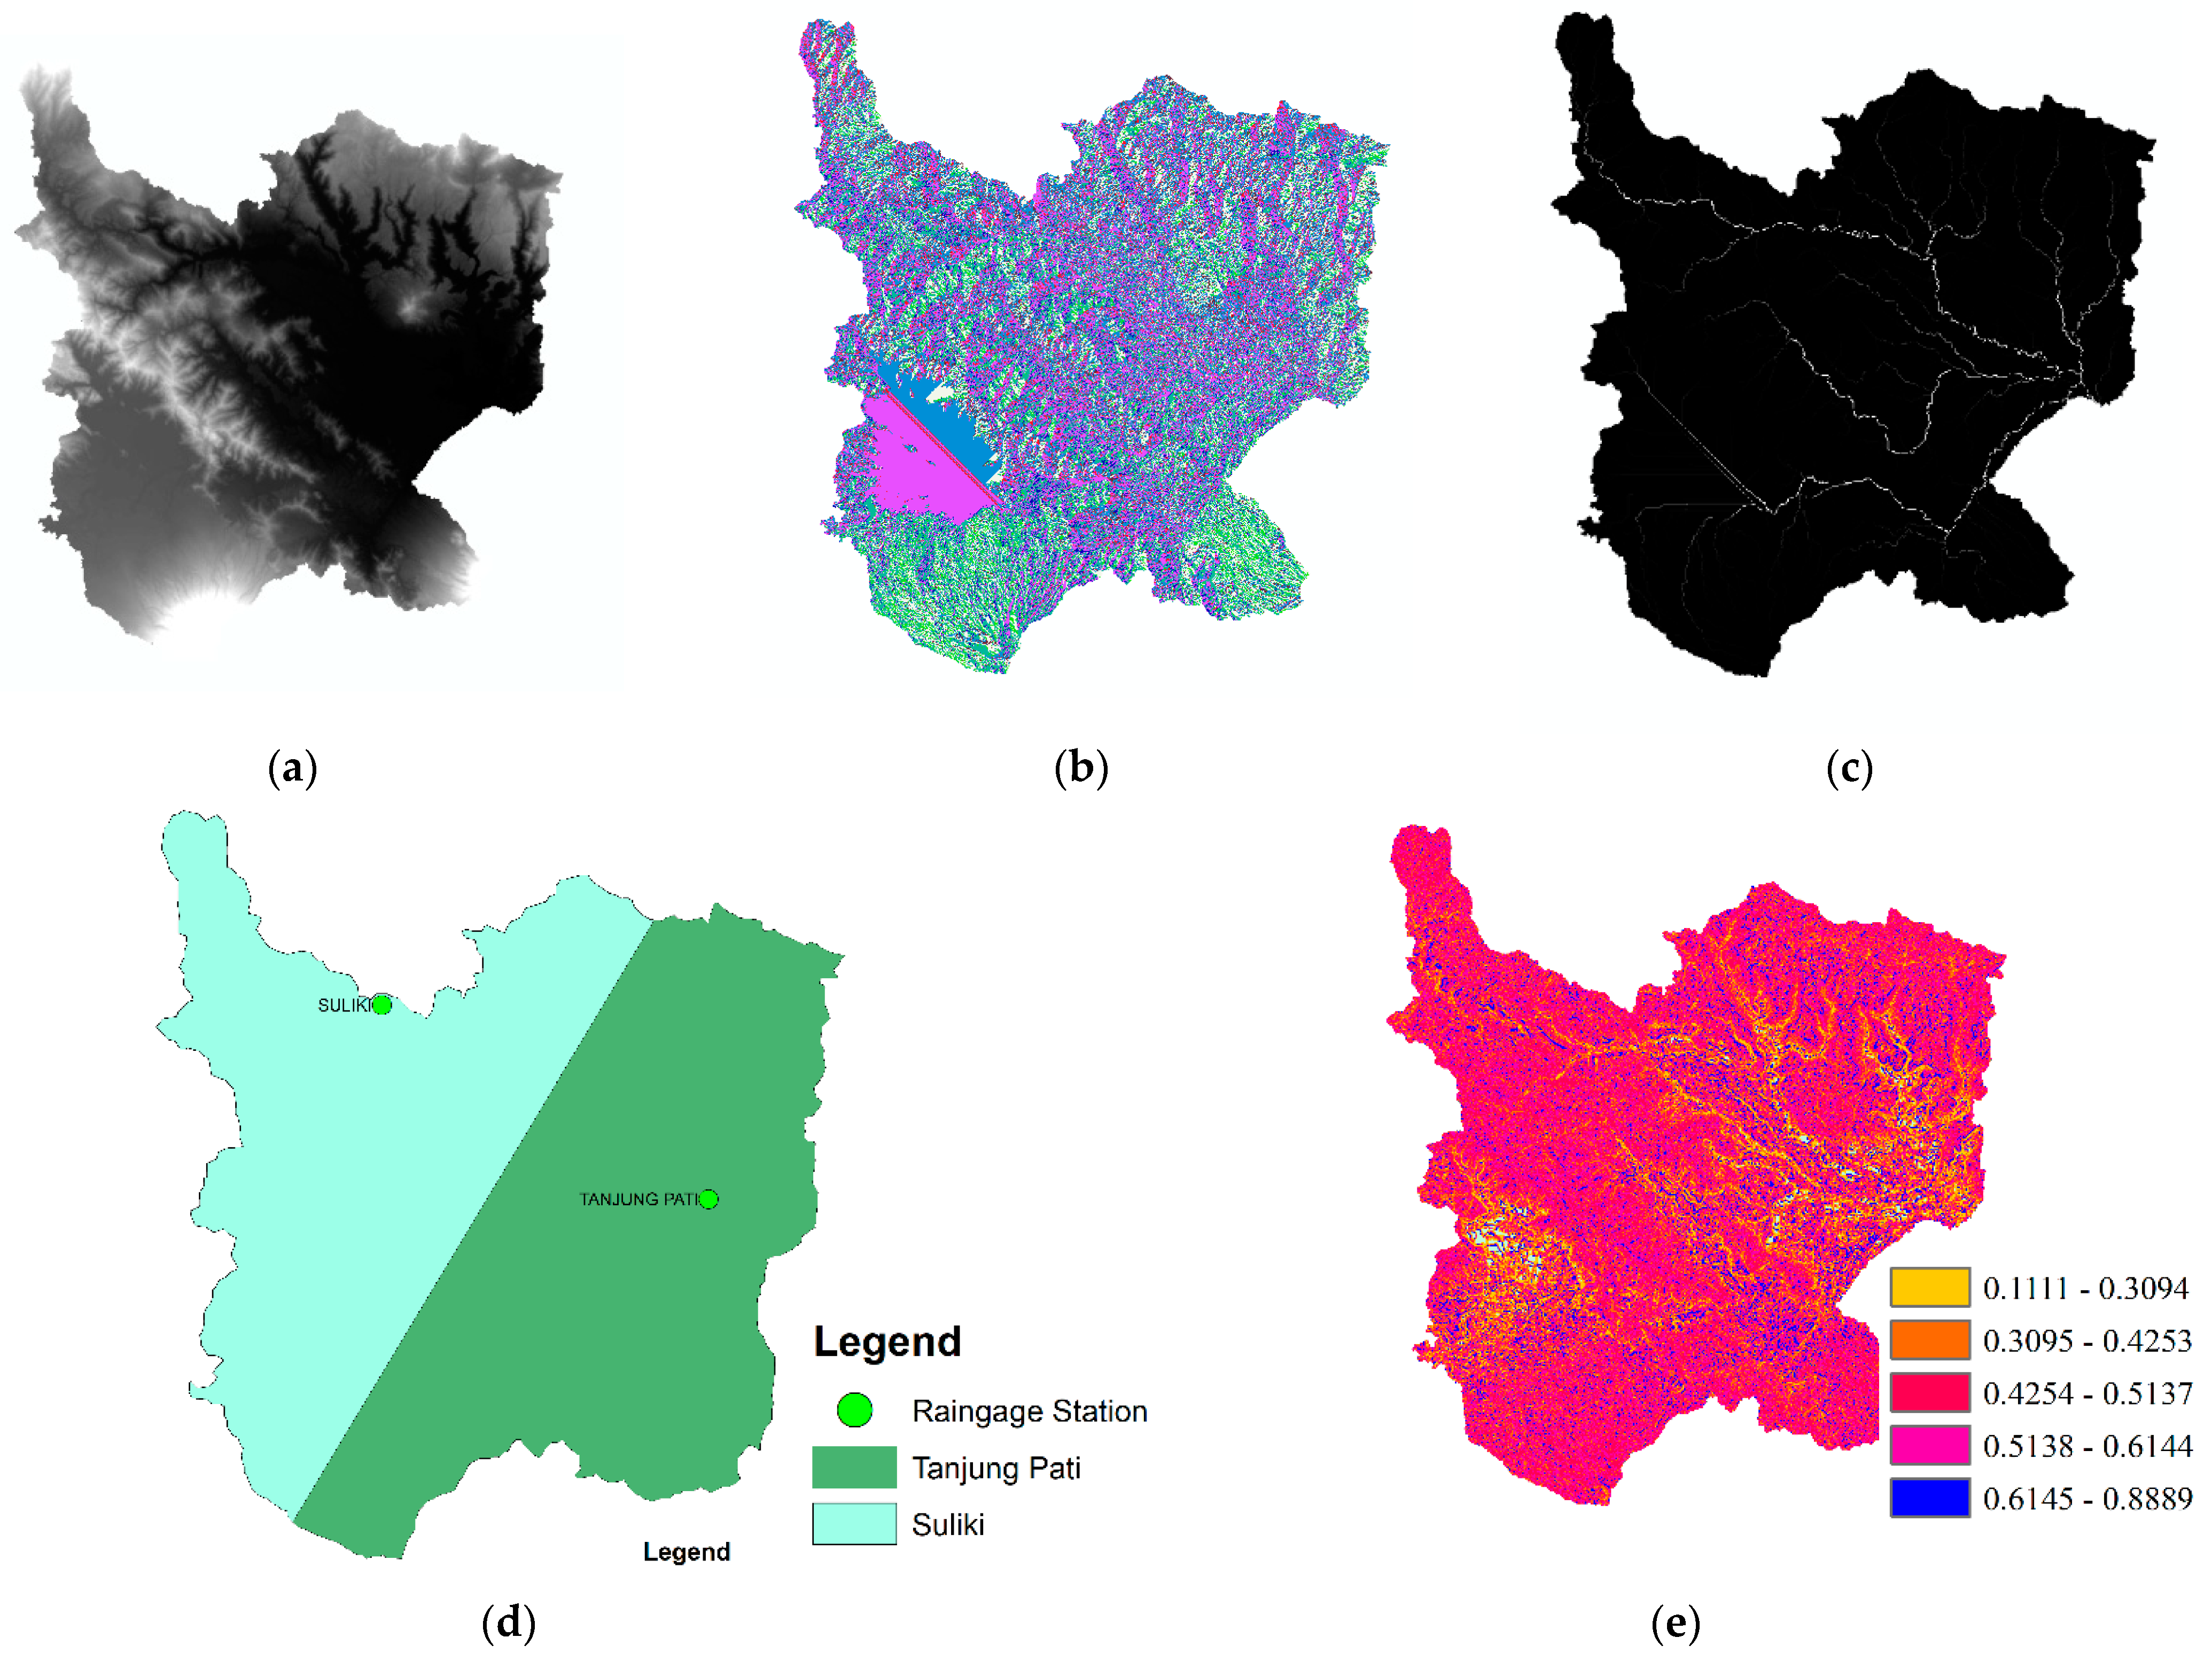
Figure 2. The surface raster is processed to obtain the flow characteristic raster data of the area as shown in
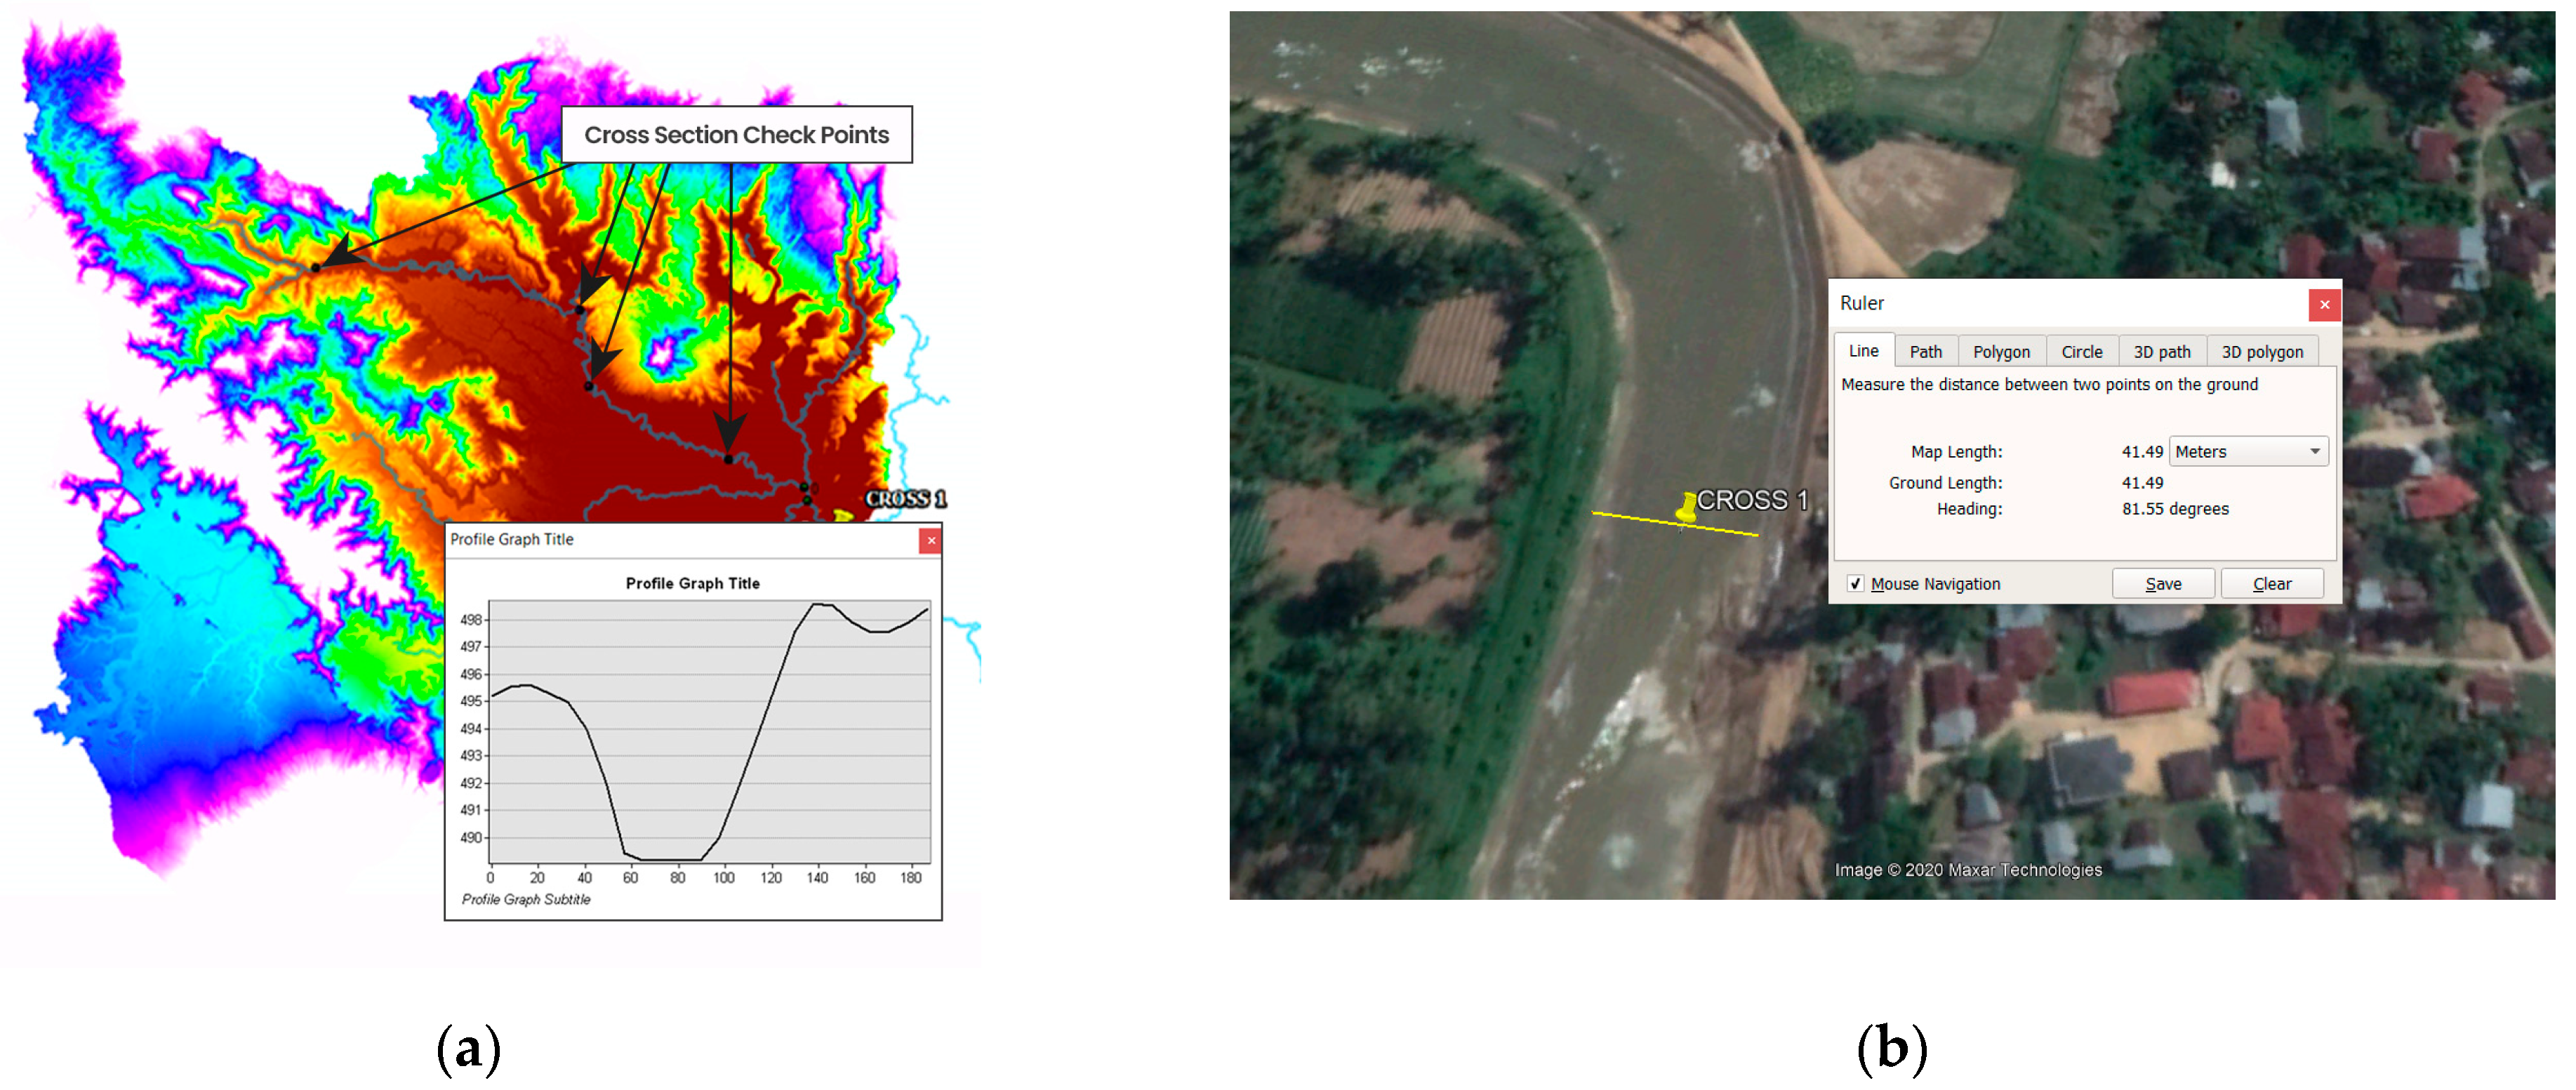
Figure 3. The river’s geometry, which are scarce data, is digitally measured using satellite images and dem shown in
Figure 4. Digital measurements are applied in several cross sections along the river to obtain geometry coefficients
Cw, Sw, Cd, and S
d with the result values of 1.8931, 0.3772, 0.162, and 0.4772, respectively. Rainfall data are processed using the polygon Thiessen method to obtain high rainfall design with 10- and 25-years as shown in
Figure 5.
2.4. Performance Assessment
The RRI model input parameter is sensitive especially for the roughness and infiltration, which need a calibration for approach real events [
14]. The model is compared and calibrated with real discharge observation data. Furthermore, the performance of the model is evaluated using Nash–Sutcliffe Efficiency (NSE) [
15] and its correlation value is checked with the following equation.
where
is observed discharge at time
t,
is simulated discharge value at time
t, and
n is number of available discharge value.
3. Result and Discussion
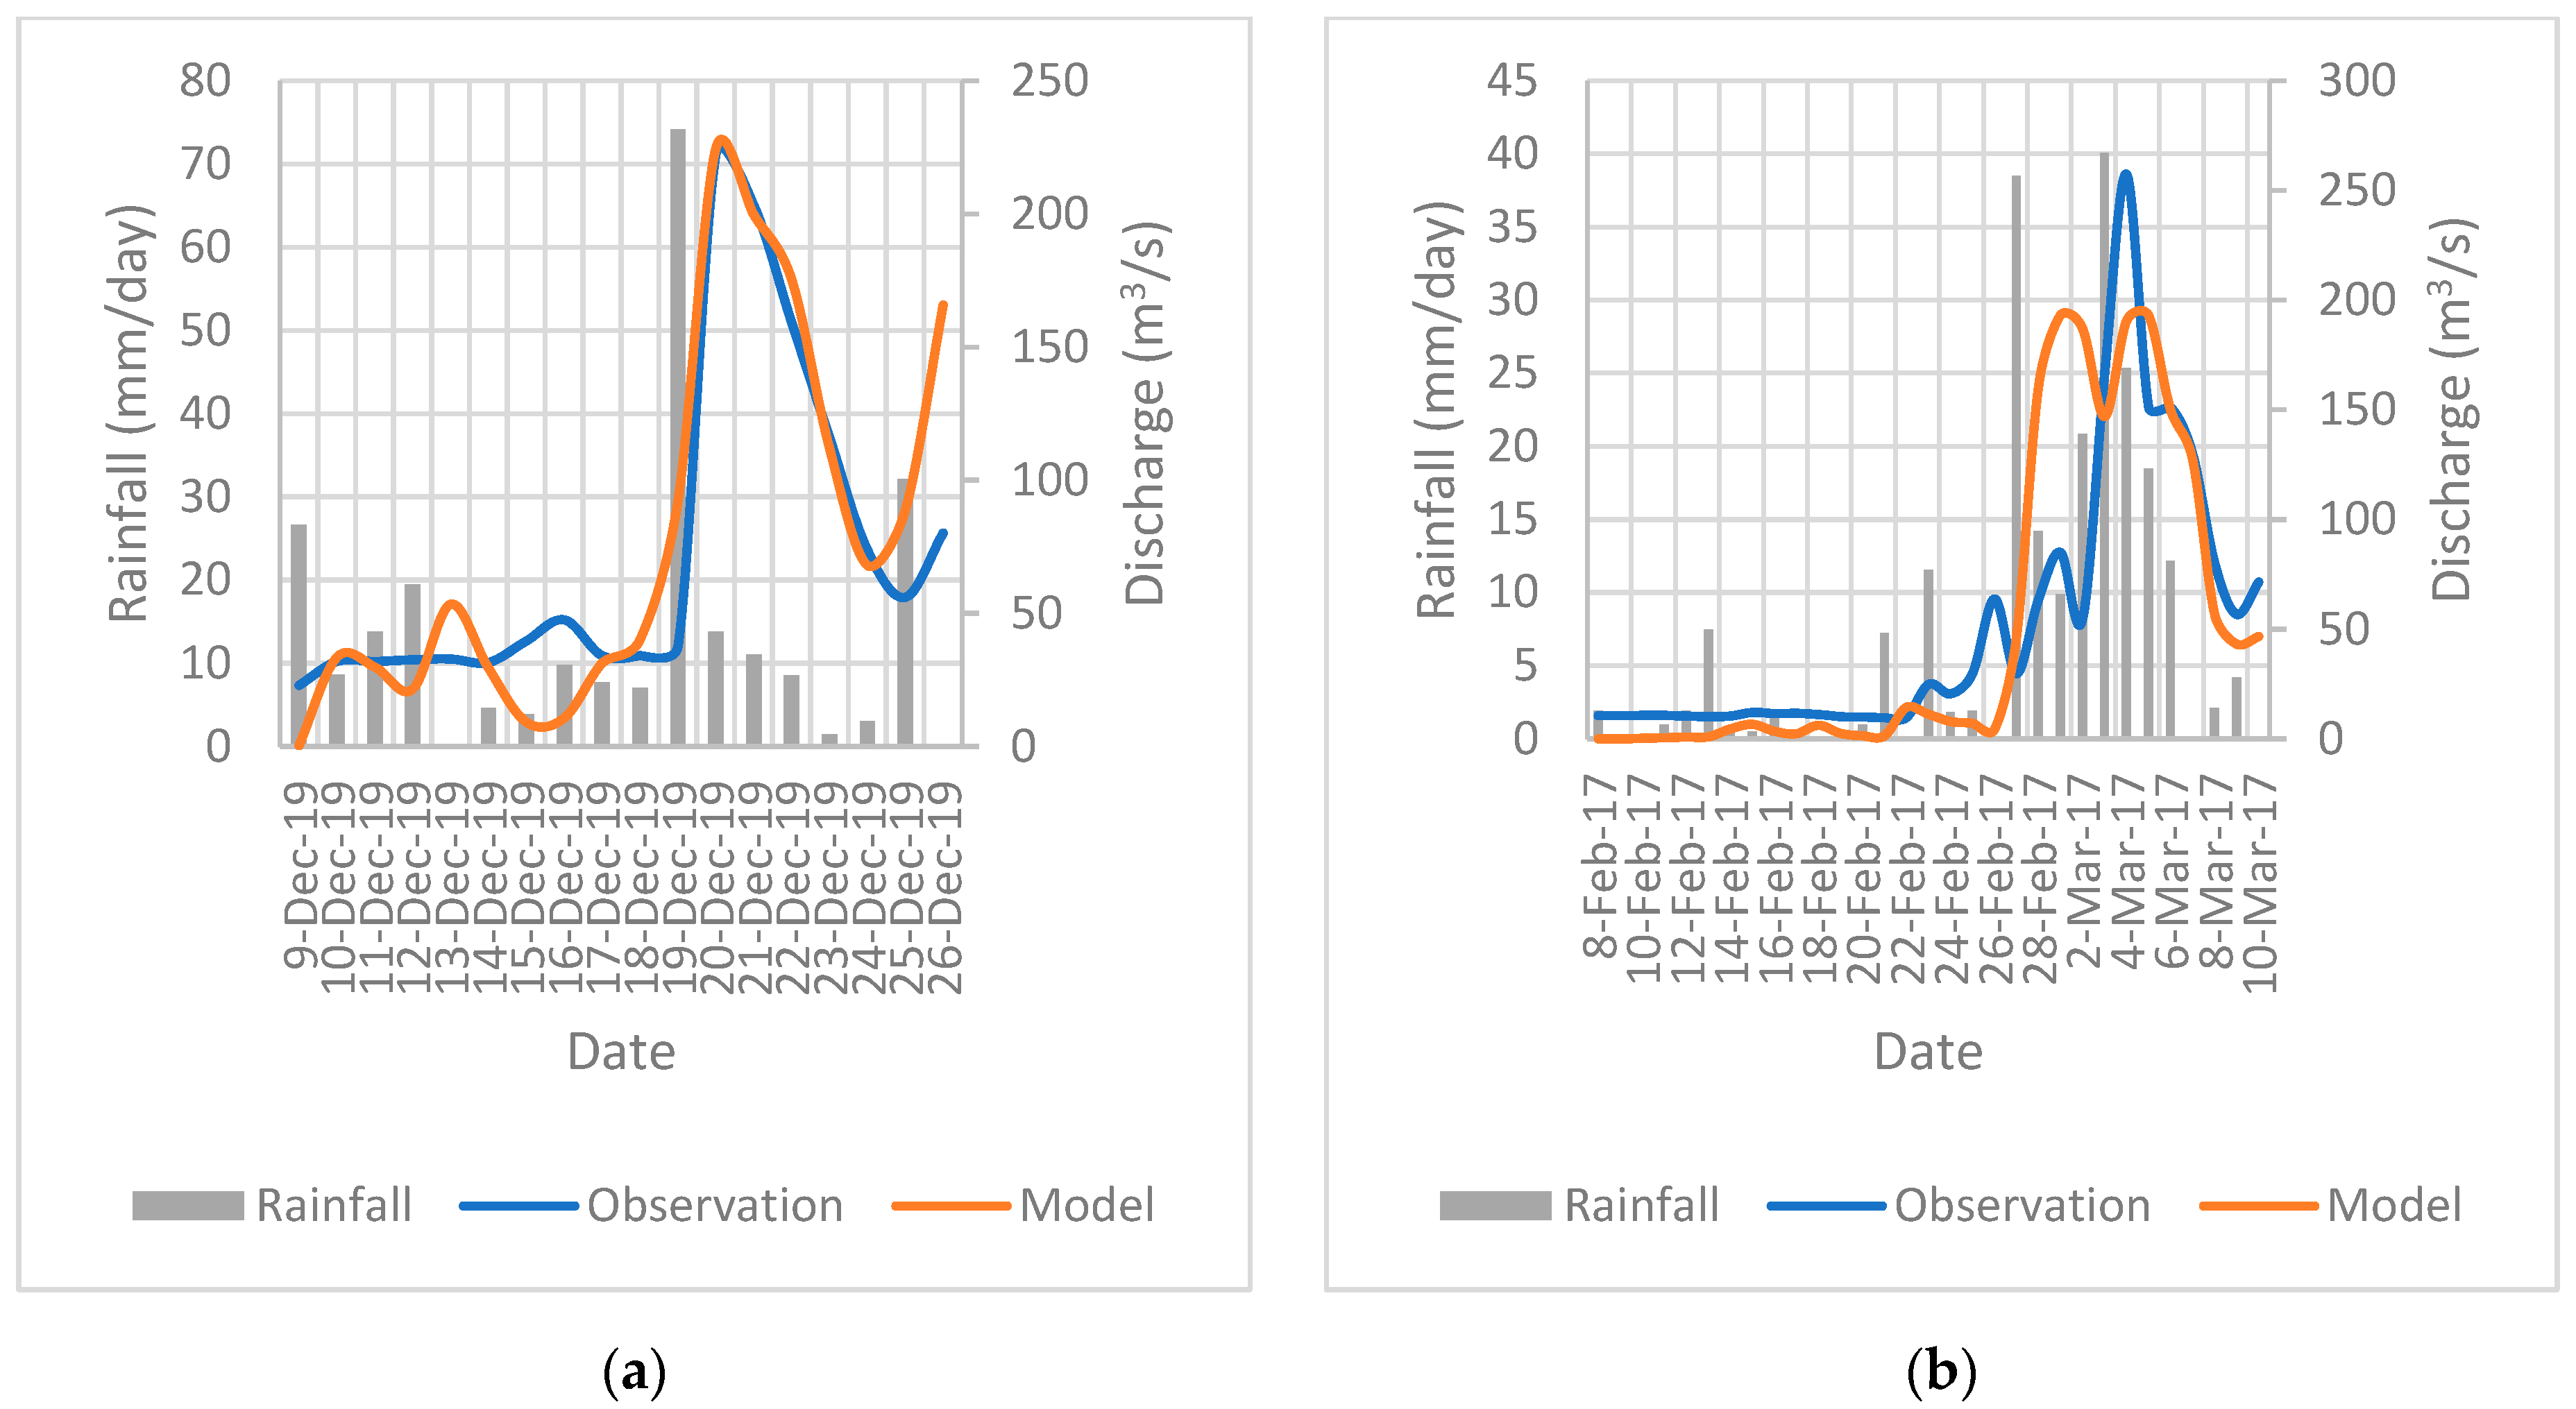
The RRI model is applied to simulate two scenarios in the Batang Sinamar River Basin in two scenarios; the first scenario is the flood event on 20 December 2019 and the second is 3 March 2017 as shown in
Figure 6. The results of the model were calibrated with flow observation station data and the NSE and correlation value were checked. The simulation for the first scenario used rainfall for 17 days from 9 to 26 December 2019, with the peak on 20 December 2019. Meanwhile the second was simulated for 31 days from 8 February to 10 March 2017. Based on observed and simulated result, the highest discharges of the hydrograph on 20 December are 222.20 m
3/s and 224.65 m
3/s, respectively, and on 3 March are 257.50 m
3/s and 190.48 m
3/s, respectively. The model provides satisfactory results with the NSE and correlation value for the first scenario as 0.768 and 0.908, respectively, and for the second scenario, 0.531 and 0.828, respectively.
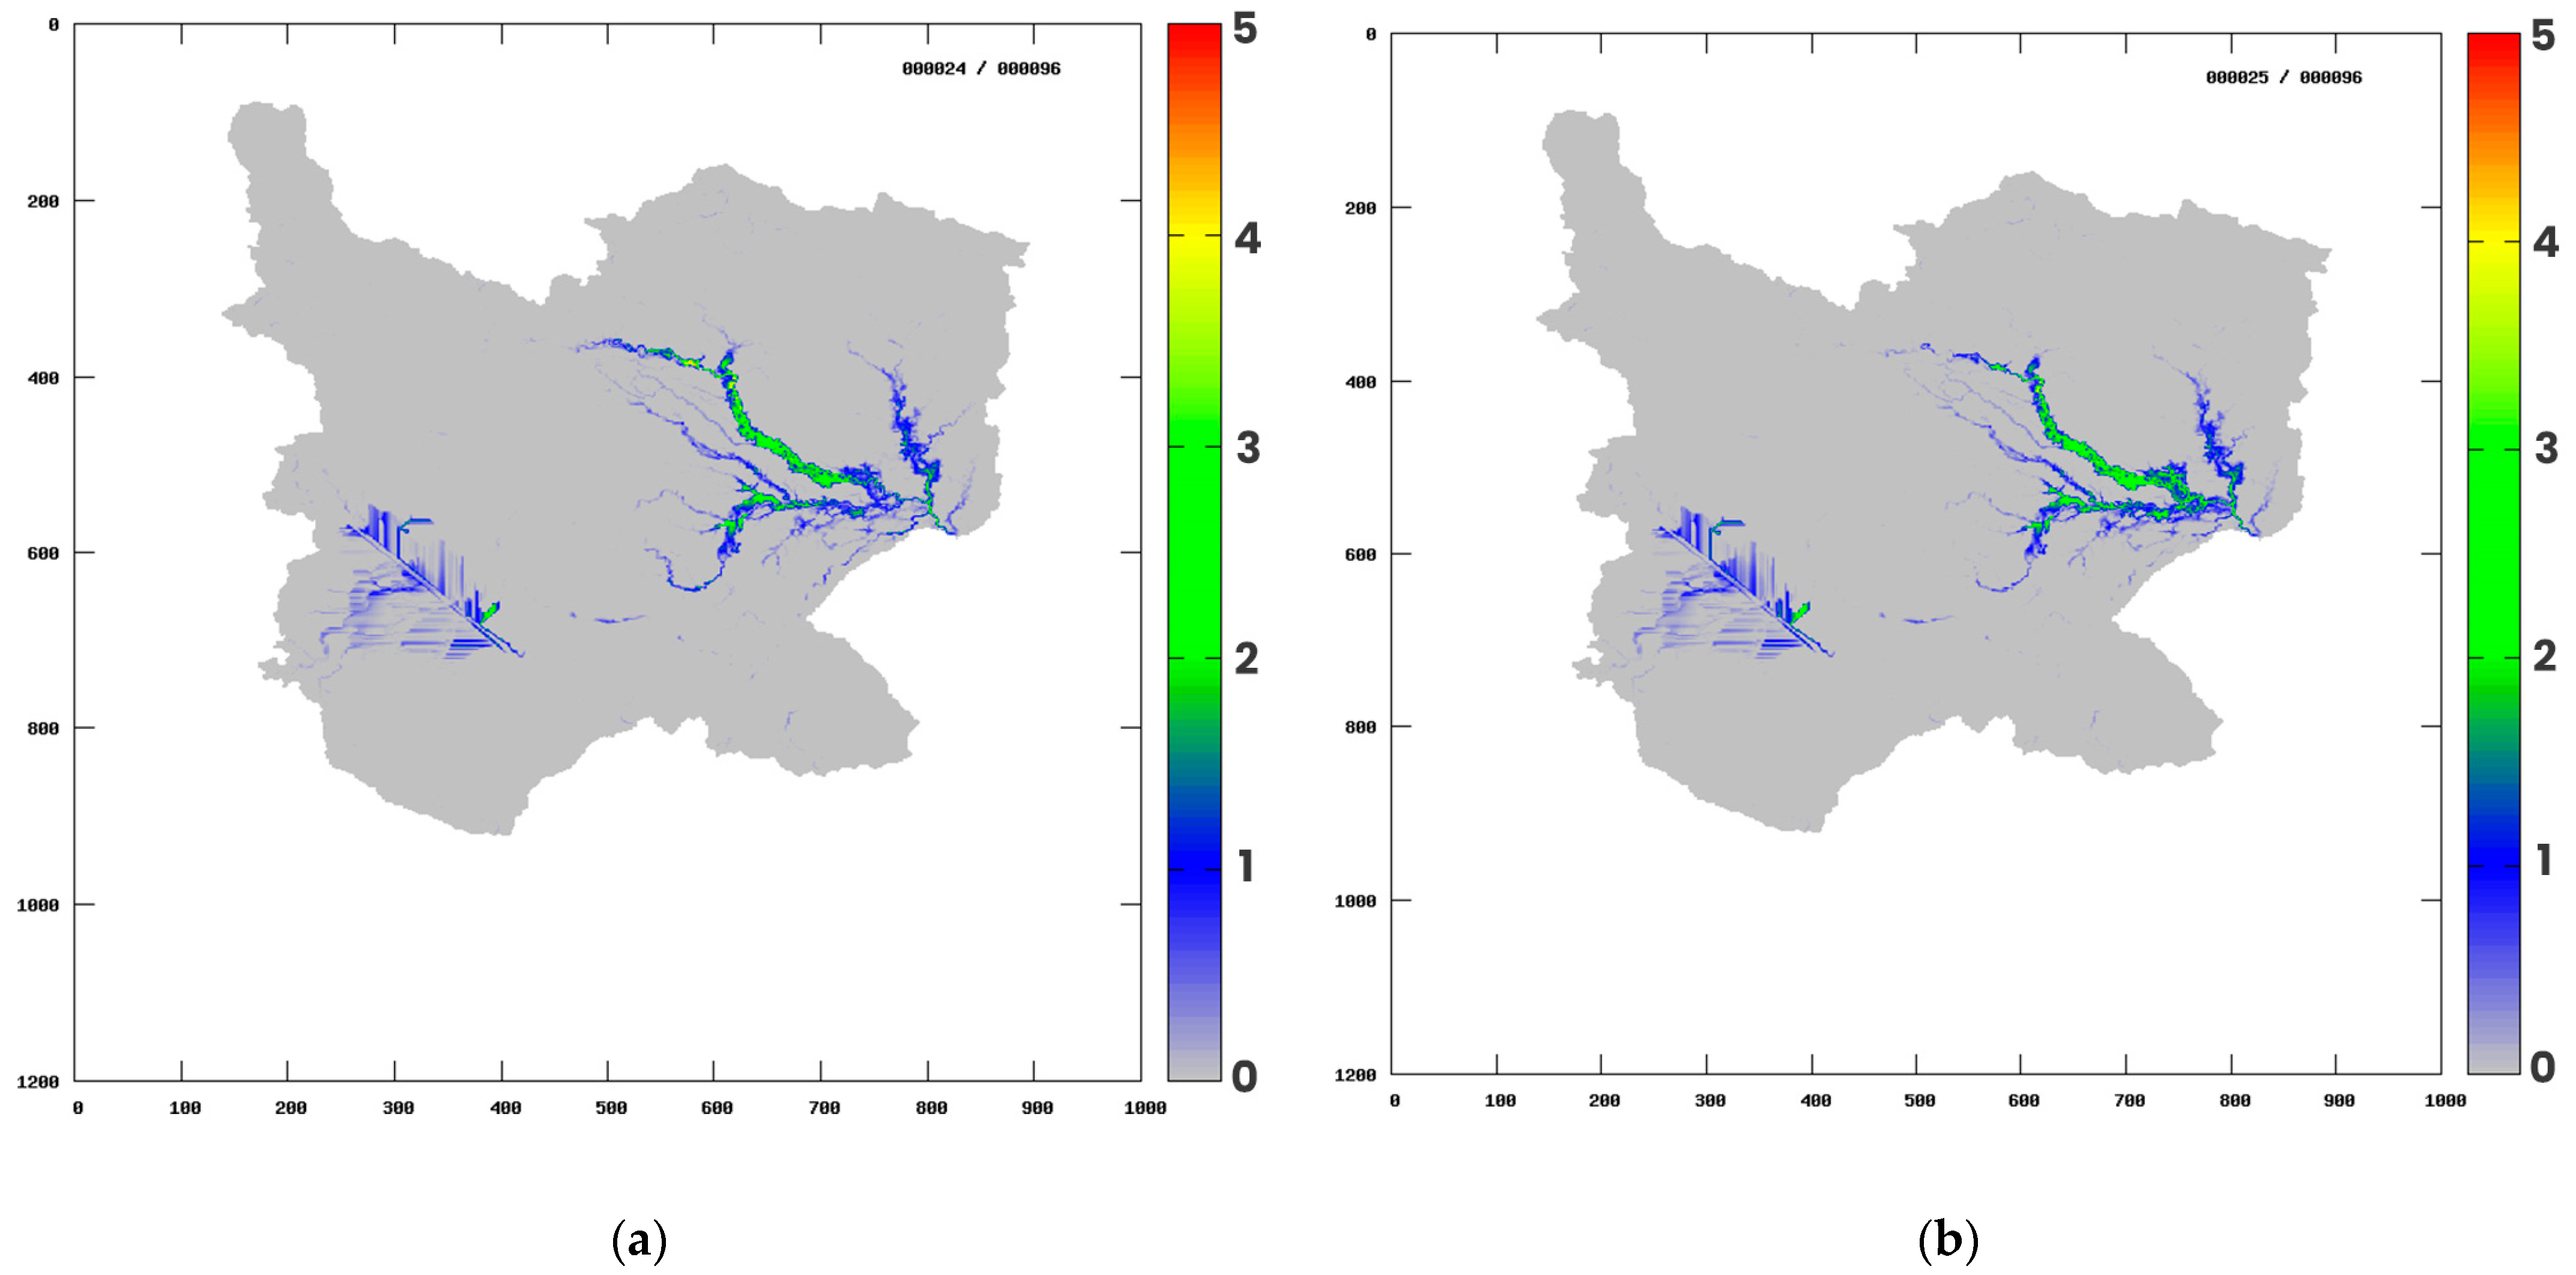
The evaluation of flood inundation used 10-year and 25-year design rainfall. These threshold rainfalls are used in the Indonesia standard flood modelling. The result provides a similar pattern between design rainfall as shown in
Figure 7. The flooding area increase by about 12.6% from 59.963 km
2 using 10-year design rainfall, and 68.592 km
2 using 25-year design. The highest hydrograph discharge from the simulation is also increased by about 13.6% from 406.72 m
3/s using 10-year design to be 470.74 m
3/s.
4. Conclusions
In this study is observed the application of rainfall-runoff and the inundation model in Batang Sinamar River Basin. The lack of the river’s geometry survey data, which are the main input for the model, can be replaced by digital measurement using satellite images. Surprisingly, this provides a good agreement result when it is compared with discharge observation data in two flood events. In the first scenario the model is able to catch the peak of the flow, even though in the second scenario the model is underestimated. It is proven that the NSE values for both scenarios are 0.768 and 0.531, respectively, and the correlation about 0.908 and 0.828, respectively. The result of flooding with 10-year return period has 59.963 km2 inundated area and 406.72 m3/s as the highest discharge. Furthermore, in 25-year return period, the inundated area increases by about 13% or becomes 68.592 km2, and the peak flow grows to 470.74 m3/s.
This application can be a good alternative when money and time are a limited resource in the process. However, in higher decision making, surveys and field observation must be performed for the exact result.
Author Contributions
Conceptualization, M.F., Y.S. and A.A.K., methodology, M.F., Y.S. and A.A.K., software, A.P.A., validation, A.P.A., formal analysis, A.P.A., investigation, A.P.A., resources, M.F., data curation, A.P.A., writing-original draft preparation, A.P.A. and A.N.W., writing-review and editing, M.F., Y.S. and A.A.K., visualization, A.P.A. and A.N.W., supervision, M.F., Y.S. and A.A.K., project administration, M.F., funding acquisition, M.F. All authors have read and agreed to the published version of the manuscript.
Funding
This research was funded by the Institute for Research and Community Services of Institut Teknologi Bandung (LPPM ITB) through ITB Excellent Research 2023 and by the Indonesia Endowment Funds for Education (LPDP) through grant scheme PRJ-102/LPDP/2021.
Institutional Review Board Statement
Not applicable.
Informed Consent Statement
Not applicable.
Data Availability Statement
Digital elevation model, soil type and land use classification data downloaded freely from Indonesia Geospatial Information Agency site in Indonesia Geospatial Portal. Rainfall and discharge observation data received from West Sumatera Water Resources Agency.
Conflicts of Interest
The authors declare no conflict of interest.
References
- Teng, J.; Jakeman, A.J.; Vaze, J.; Croke, B.F.W.; Dutta, D.; Kim, S. Flood inundation modelling: A review of methods, recent advances and uncertainty analysis. Environ. Model. Softw. 2017, 90, 201–216. [Google Scholar] [CrossRef]
- Barus, L.; Tambunan, R.; Arif, V. Effect of Changes in Land Use in Flood Disasters in Baleendah District, Bandung Regency. J. Strateg. Glob. Stud. 2019, 2, 3. [Google Scholar] [CrossRef]
- AL-Hussein, A.A.M.; Khan, S.; Ncibi, K.; Hamdi, N.; Hamed, Y. Flood Analysis Using HEC-RAS and HEC-HMS: A Case Study of Khazir River (Middle East—Northern Iraq). Water 2022, 14, 3779. [Google Scholar] [CrossRef]
- Kadam, P.; Sen, D. Flood inundation simulation in Ajoy River using MIKE-FLOOD. ISH J. Hydraul. Eng. 2012, 18, 129–141. [Google Scholar] [CrossRef]
- Cea, L.; Álvarez, M.; Puertas, J. Estimation of flood-exposed population in data-scarce regions combining satellite imagery and high resolution hydrological-hydraulic modelling: A case study in the Licungo basin (Mozambique). J. Hydrol. Reg. Stud. 2022, 44, 101247. [Google Scholar] [CrossRef]
- Hurtado-Pidal, J.; Acero Triana, J.S.; Espitia-Sarmiento, E.; Jarrín-Pérez, F. Flood Hazard Assessment in Data-Scarce Watersheds Using Model Coupling, Event Sampling, and Survey Data. Water 2020, 12, 2768. [Google Scholar] [CrossRef]
- Sayama, T.; Tatebe, Y.; Iwami, Y.; Tanaka, S. Hydrologic sensitivity of flood runoff and inundation: 2011 Thailand floods in the Chao Phraya River basin. Nat. Hazards Earth Syst. Sci. 2015, 15, 1617–1630. [Google Scholar] [CrossRef]
- Zenkoji, S.; Oda, S.; Tebakari, T.; Archevarahuprok, B. Spatial Characteristics of Flooded Areas in the Mun and Chi River Basins in Northeastern Thailand. J. Disaster Res. 2019, 14, 1337–1345. [Google Scholar] [CrossRef]
- Nastiti, K.D.; Kim, Y.; Jung, K.; An, H. The Application of Rainfall-Runoff-inundation (RRI) Model for Inundation Case in Upper Citarum Watershed, West Java-Indonesia. Procedia Eng. 2015, 125, 166–172. [Google Scholar] [CrossRef]
- Sriariyawat, A.; Pakoksung, K.; Sayama, T.; Tanaka, S.; Koontanakulvong, S. Approach to Estimate the Flood Damage in Sukhothai Province Using Flood Simulation. J. Disaster Res. 2013, 8, 406–414. [Google Scholar] [CrossRef]
- Kuribayashi, D.; Ohara, M.; Sayama, T.; Konja, A.; Sawano, H. Utilization of the Flood Simulation Model for Disaster Management of Local Government. J. Disaster Res. 2016, 11, 1161–1175. [Google Scholar] [CrossRef]
- Try, S.; Lee, G.; Yu, W.; Oeurng, C.; Jang, C. Large-Scale Flood-Inundation Modeling in the Mekong River Basin. J. Hydrol. Eng. 2018, 23, 05018011. [Google Scholar] [CrossRef]
- Sayama, T.; Ozawa, G.; Kawakami, T.; Nabesaka, S.; Fukami, K. Rainfall–runoff–inundation analysis of the 2010 Pakistan flood in the Kabul River basin. Hydrol. Sci. J. 2012, 57, 298–312. [Google Scholar] [CrossRef]
- Sayama, T.; Tatebe, Y.; Tanaka, S. An emergency response-type rainfall-runoff-inundation simulation for 2011 Thailand floods. J. Flood Risk Manag. 2017, 10, 65–78. [Google Scholar] [CrossRef]
- Nash, J.E.; Sutcliffe, J.V. River flow forecasting through conceptual models part I—A discussion of principles. J. Hydrol. 1970, 10, 282–290. [Google Scholar] [CrossRef]
| Disclaimer/Publisher’s Note: The statements, opinions and data contained in all publications are solely those of the individual author(s) and contributor(s) and not of MDPI and/or the editor(s). MDPI and/or the editor(s) disclaim responsibility for any injury to people or property resulting from any ideas, methods, instructions or products referred to in the content. |
© 2023 by the authors. Licensee MDPI, Basel, Switzerland. This article is an open access article distributed under the terms and conditions of the Creative Commons Attribution (CC BY) license (https://creativecommons.org/licenses/by/4.0/).


 ,
, 


