
Determining the Critical Points of a Basin from the Point of View of Water Productivity and Water Consumption Using the WaPOR Database †


Abstract
:1. Introduction
2. Materials and Methods
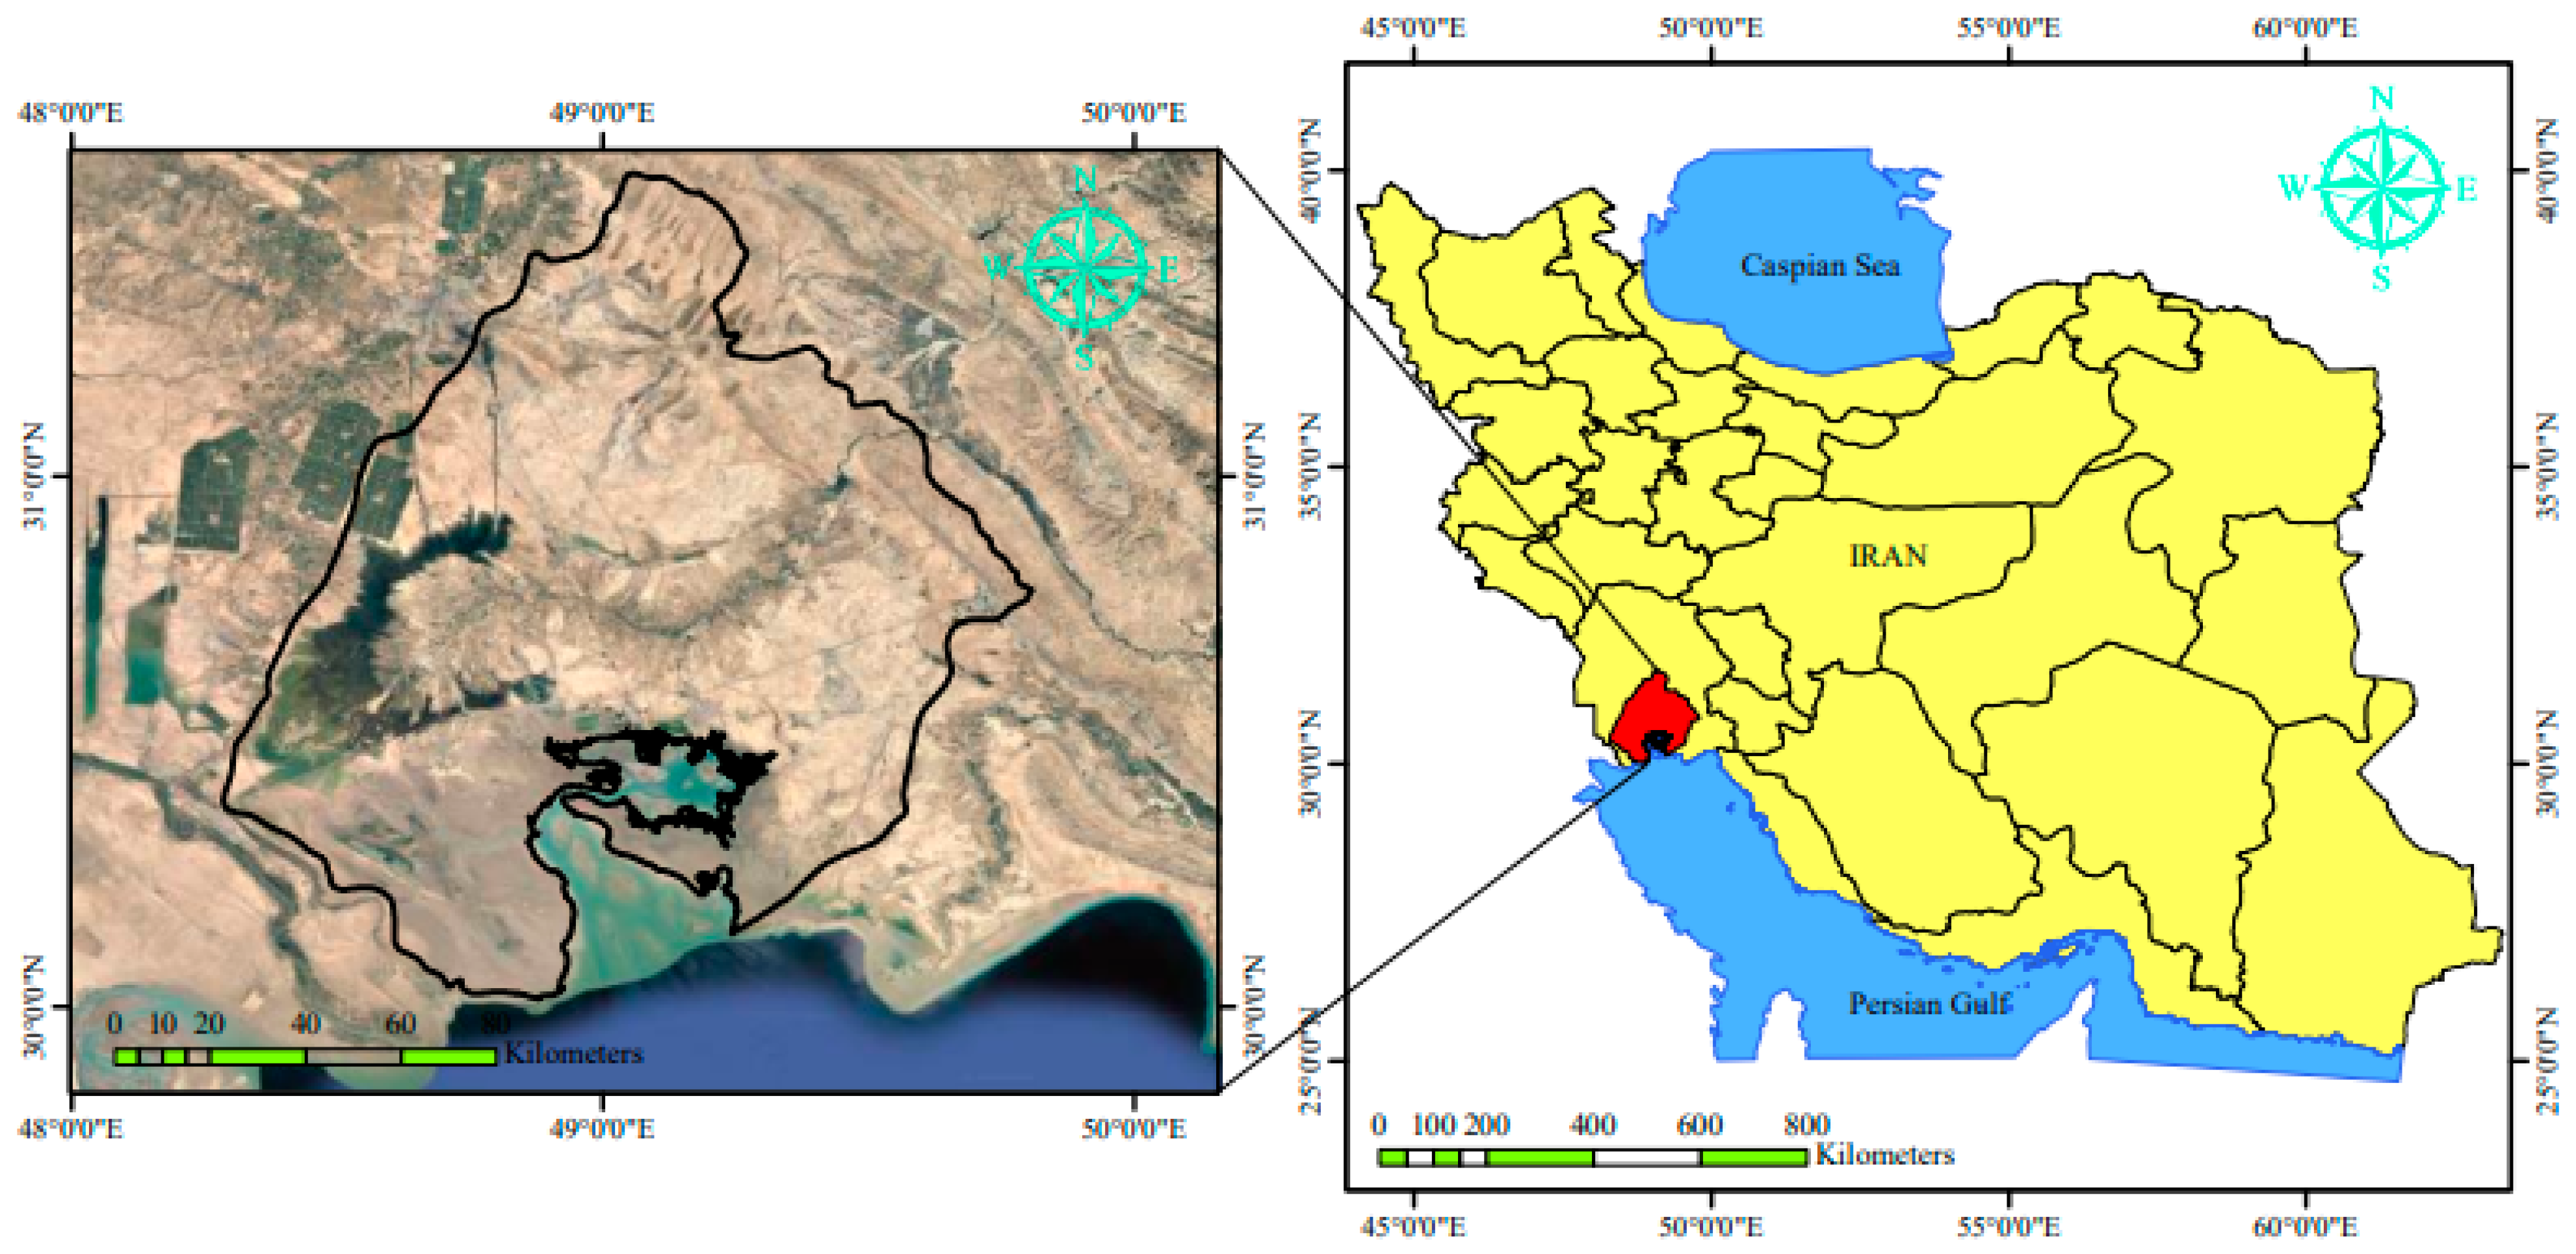
2.1. Area of Study
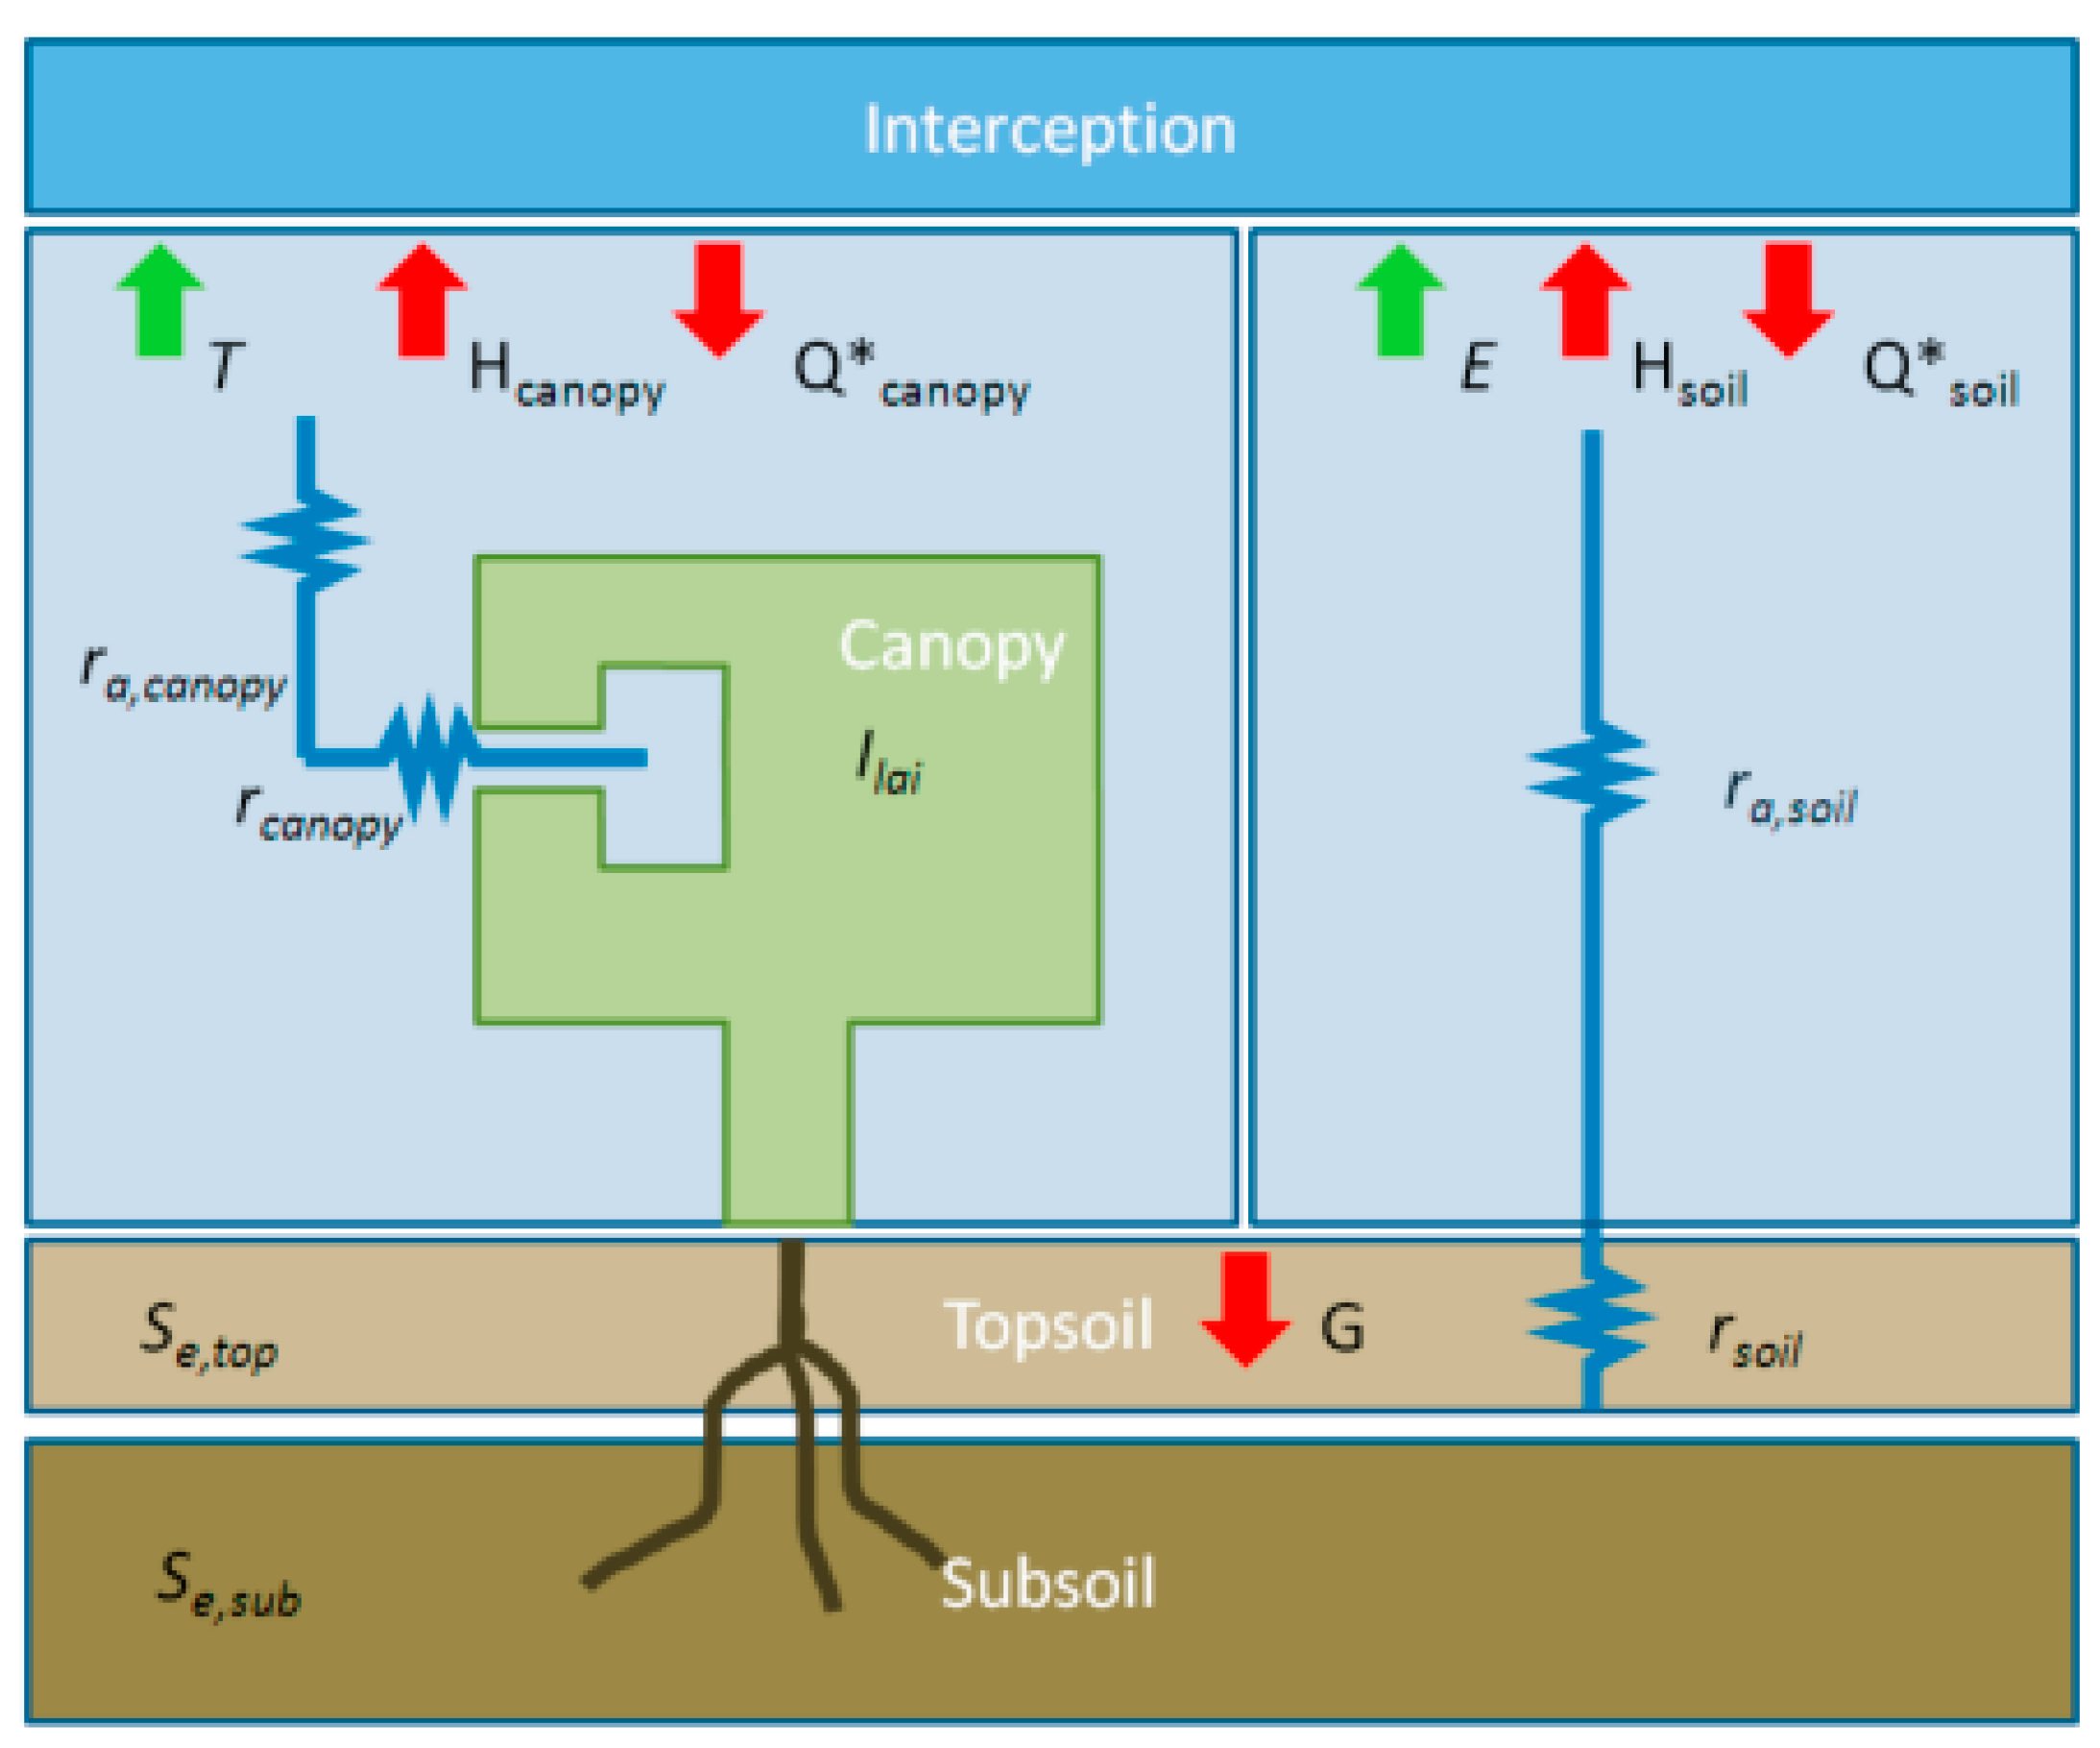
2.2. ETLook Model
2.3. Net Primary Production
2.4. Crop Water Productivity
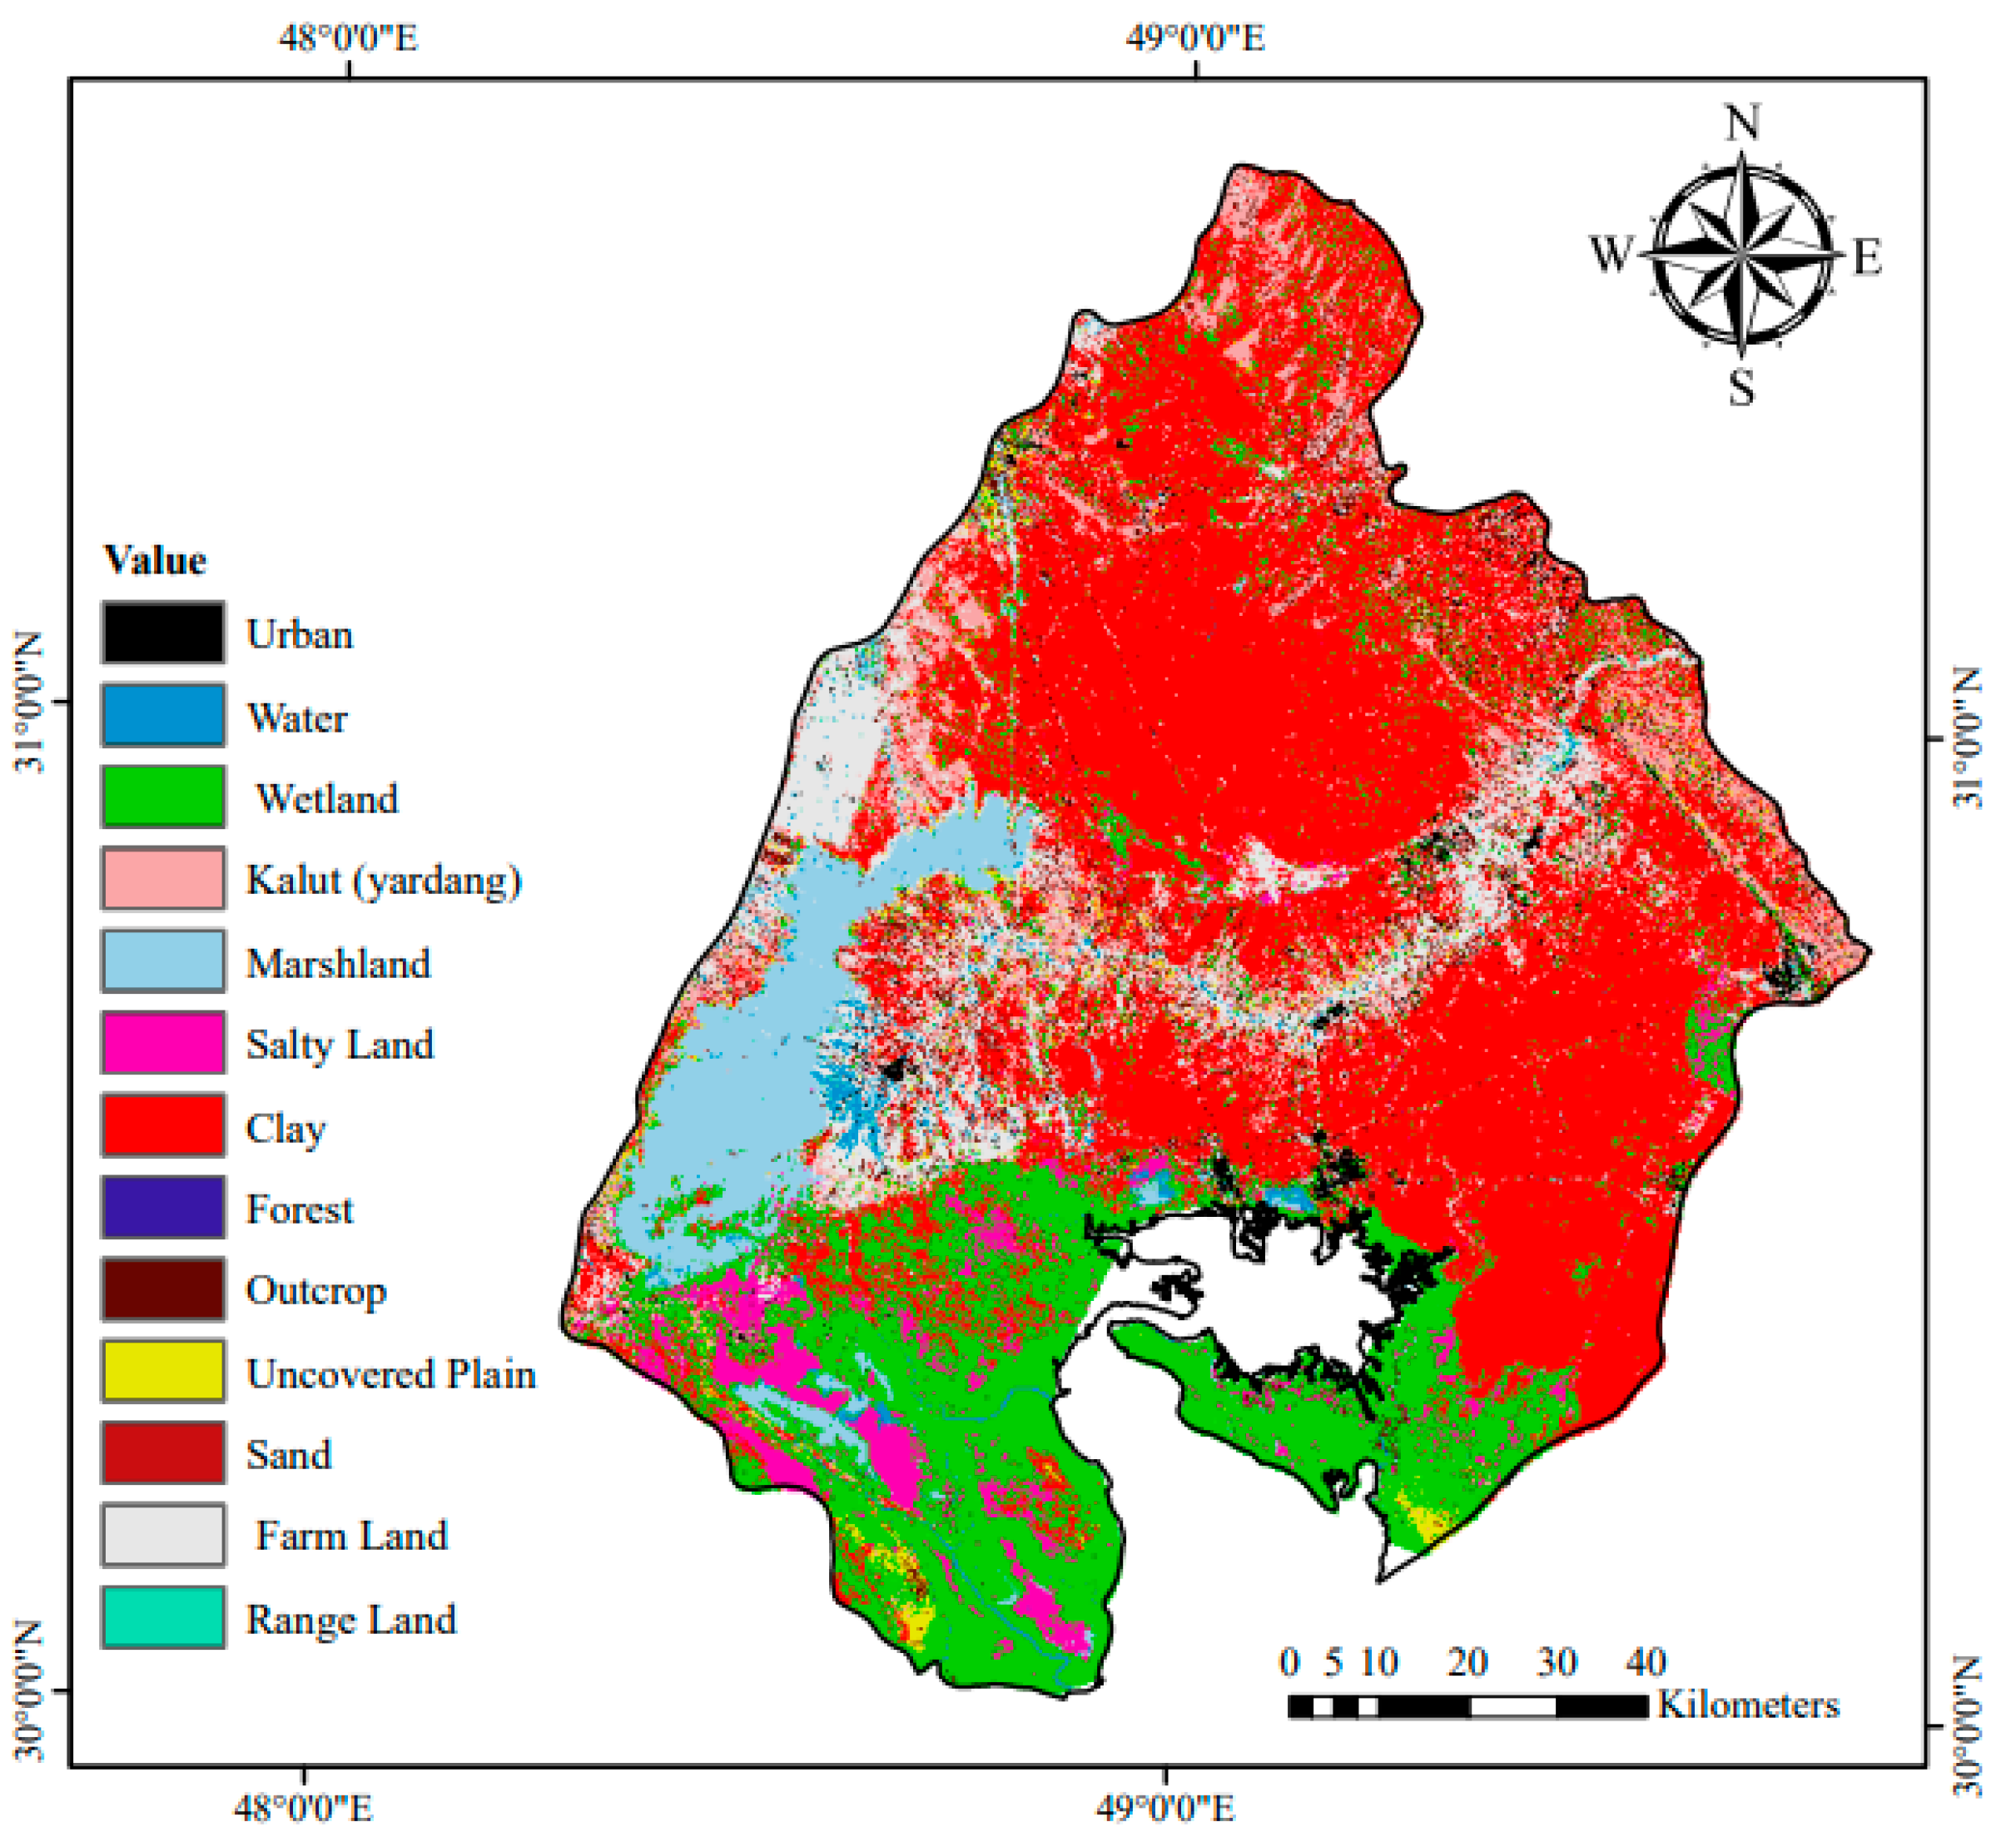
2.5. Land Use/Land Cover Map
3. Results and Discussion
3.1. Actual Evapotranspiration and Interception
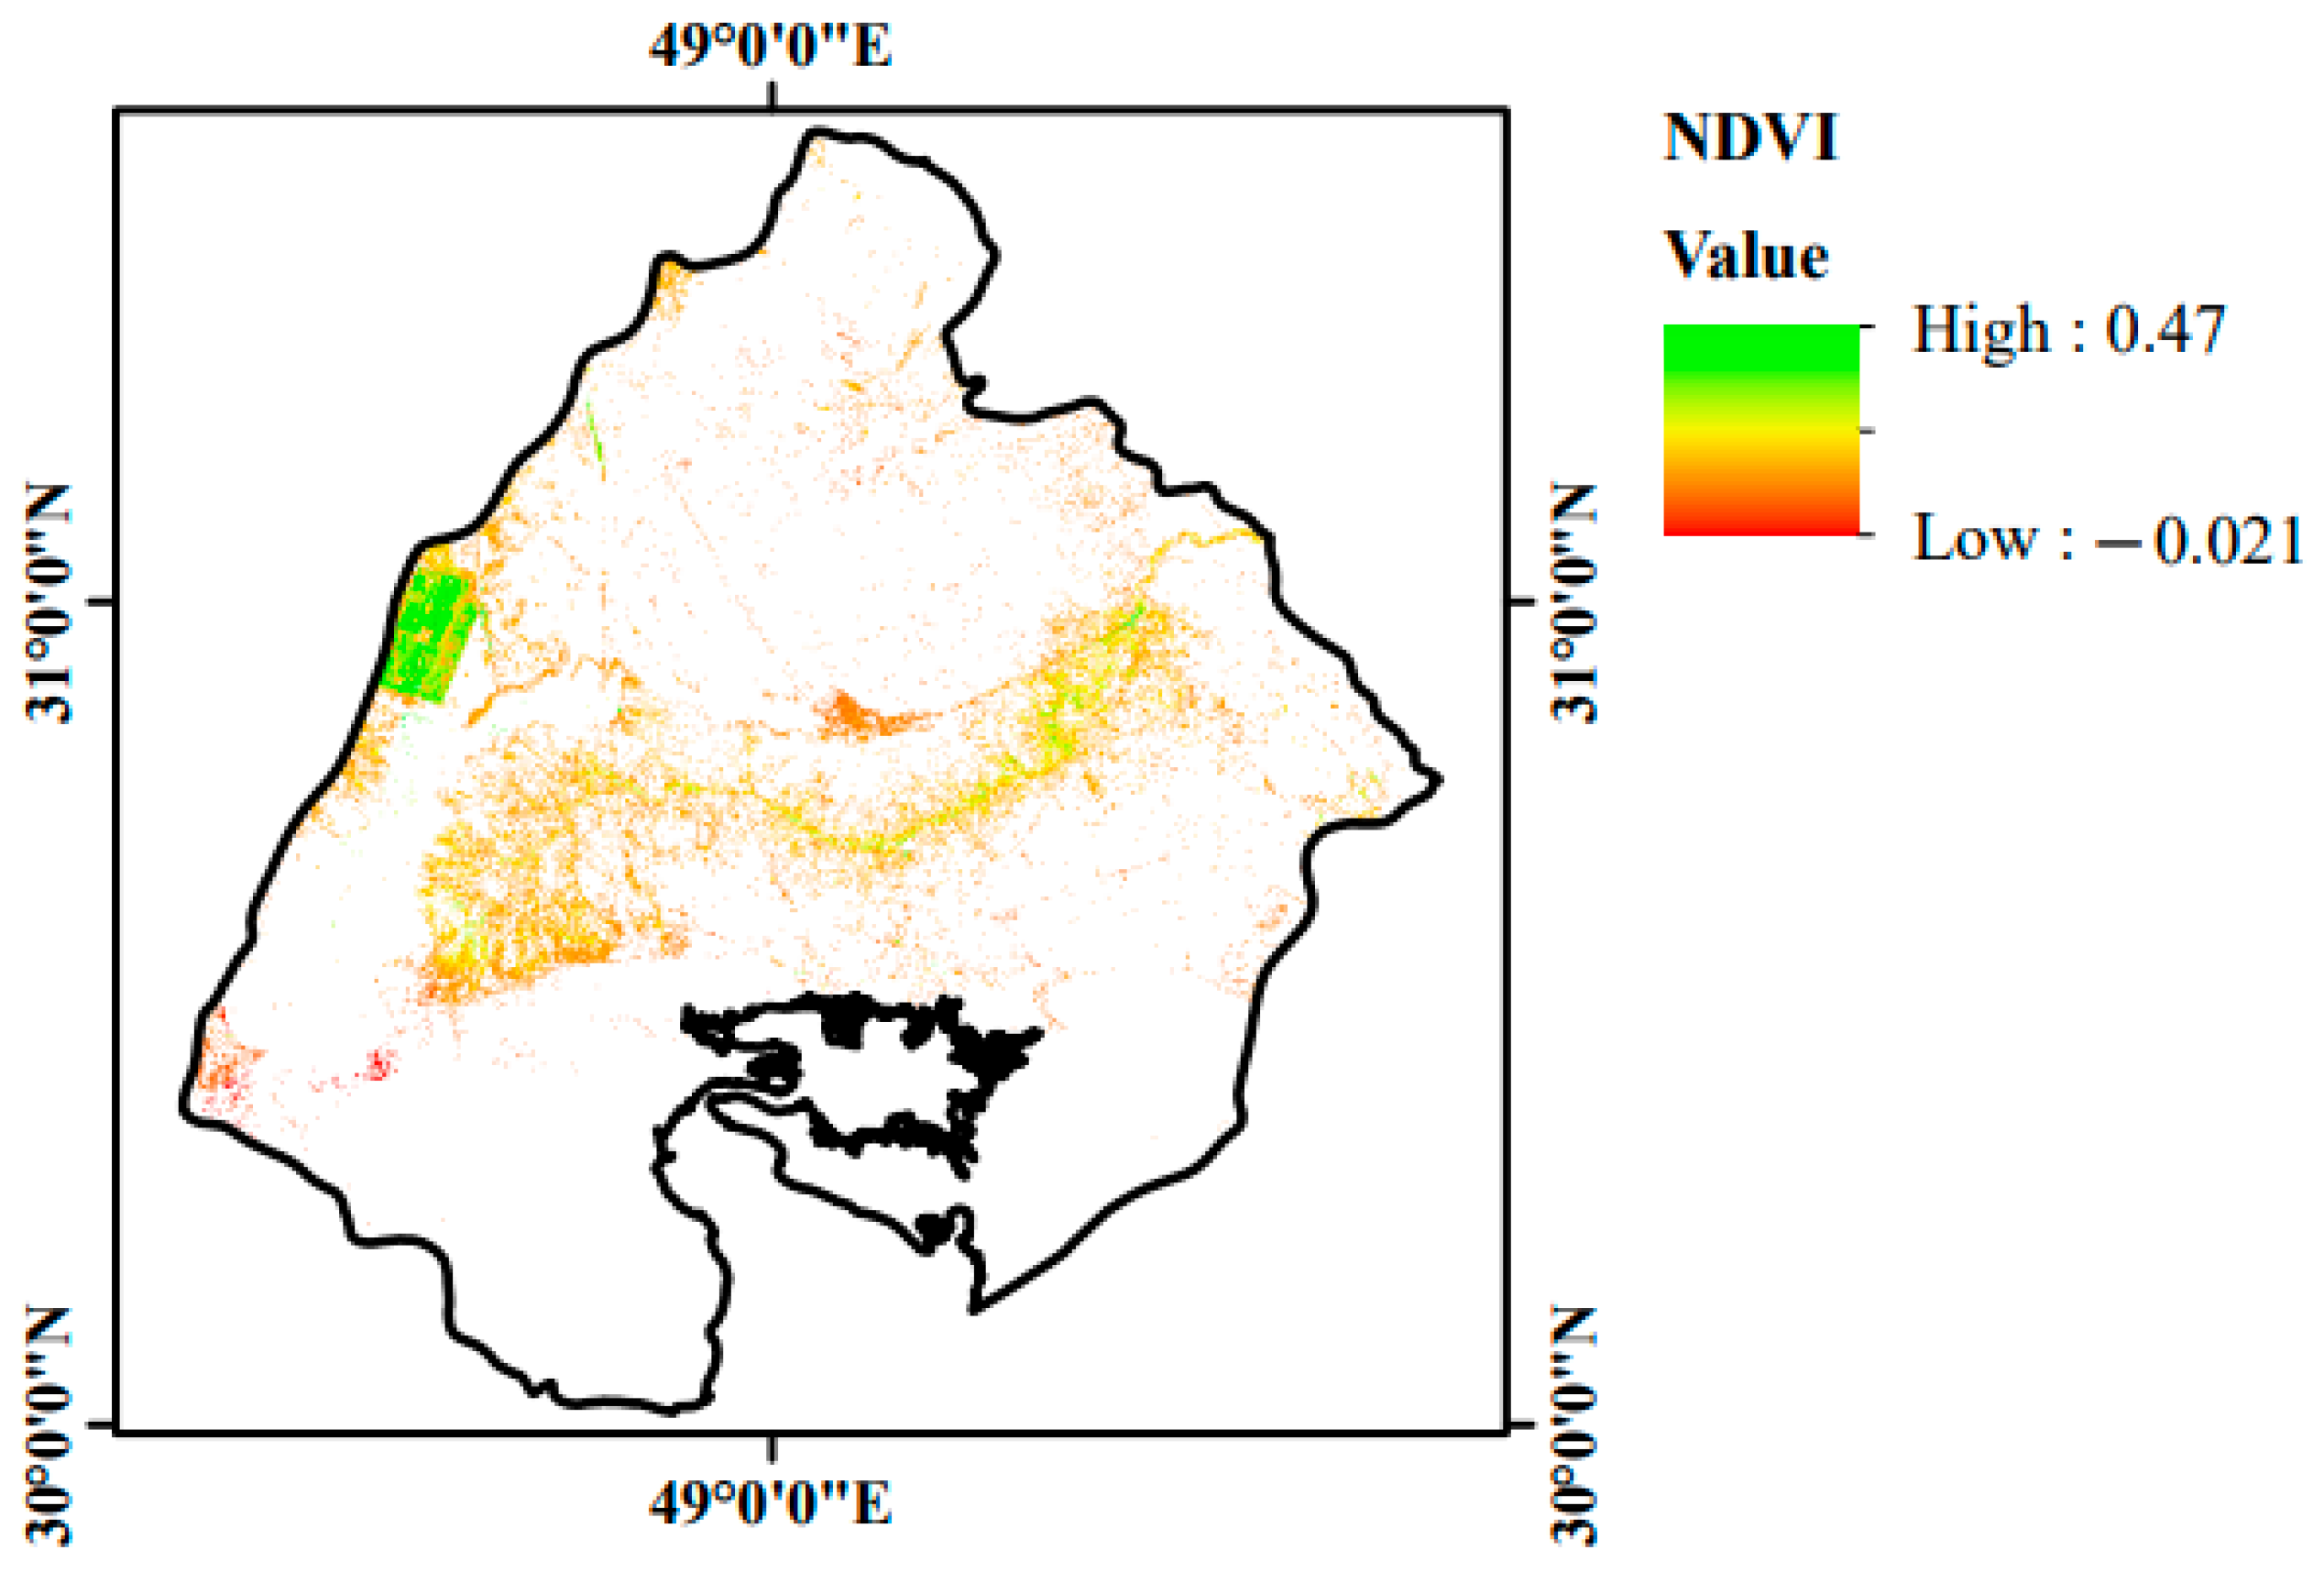
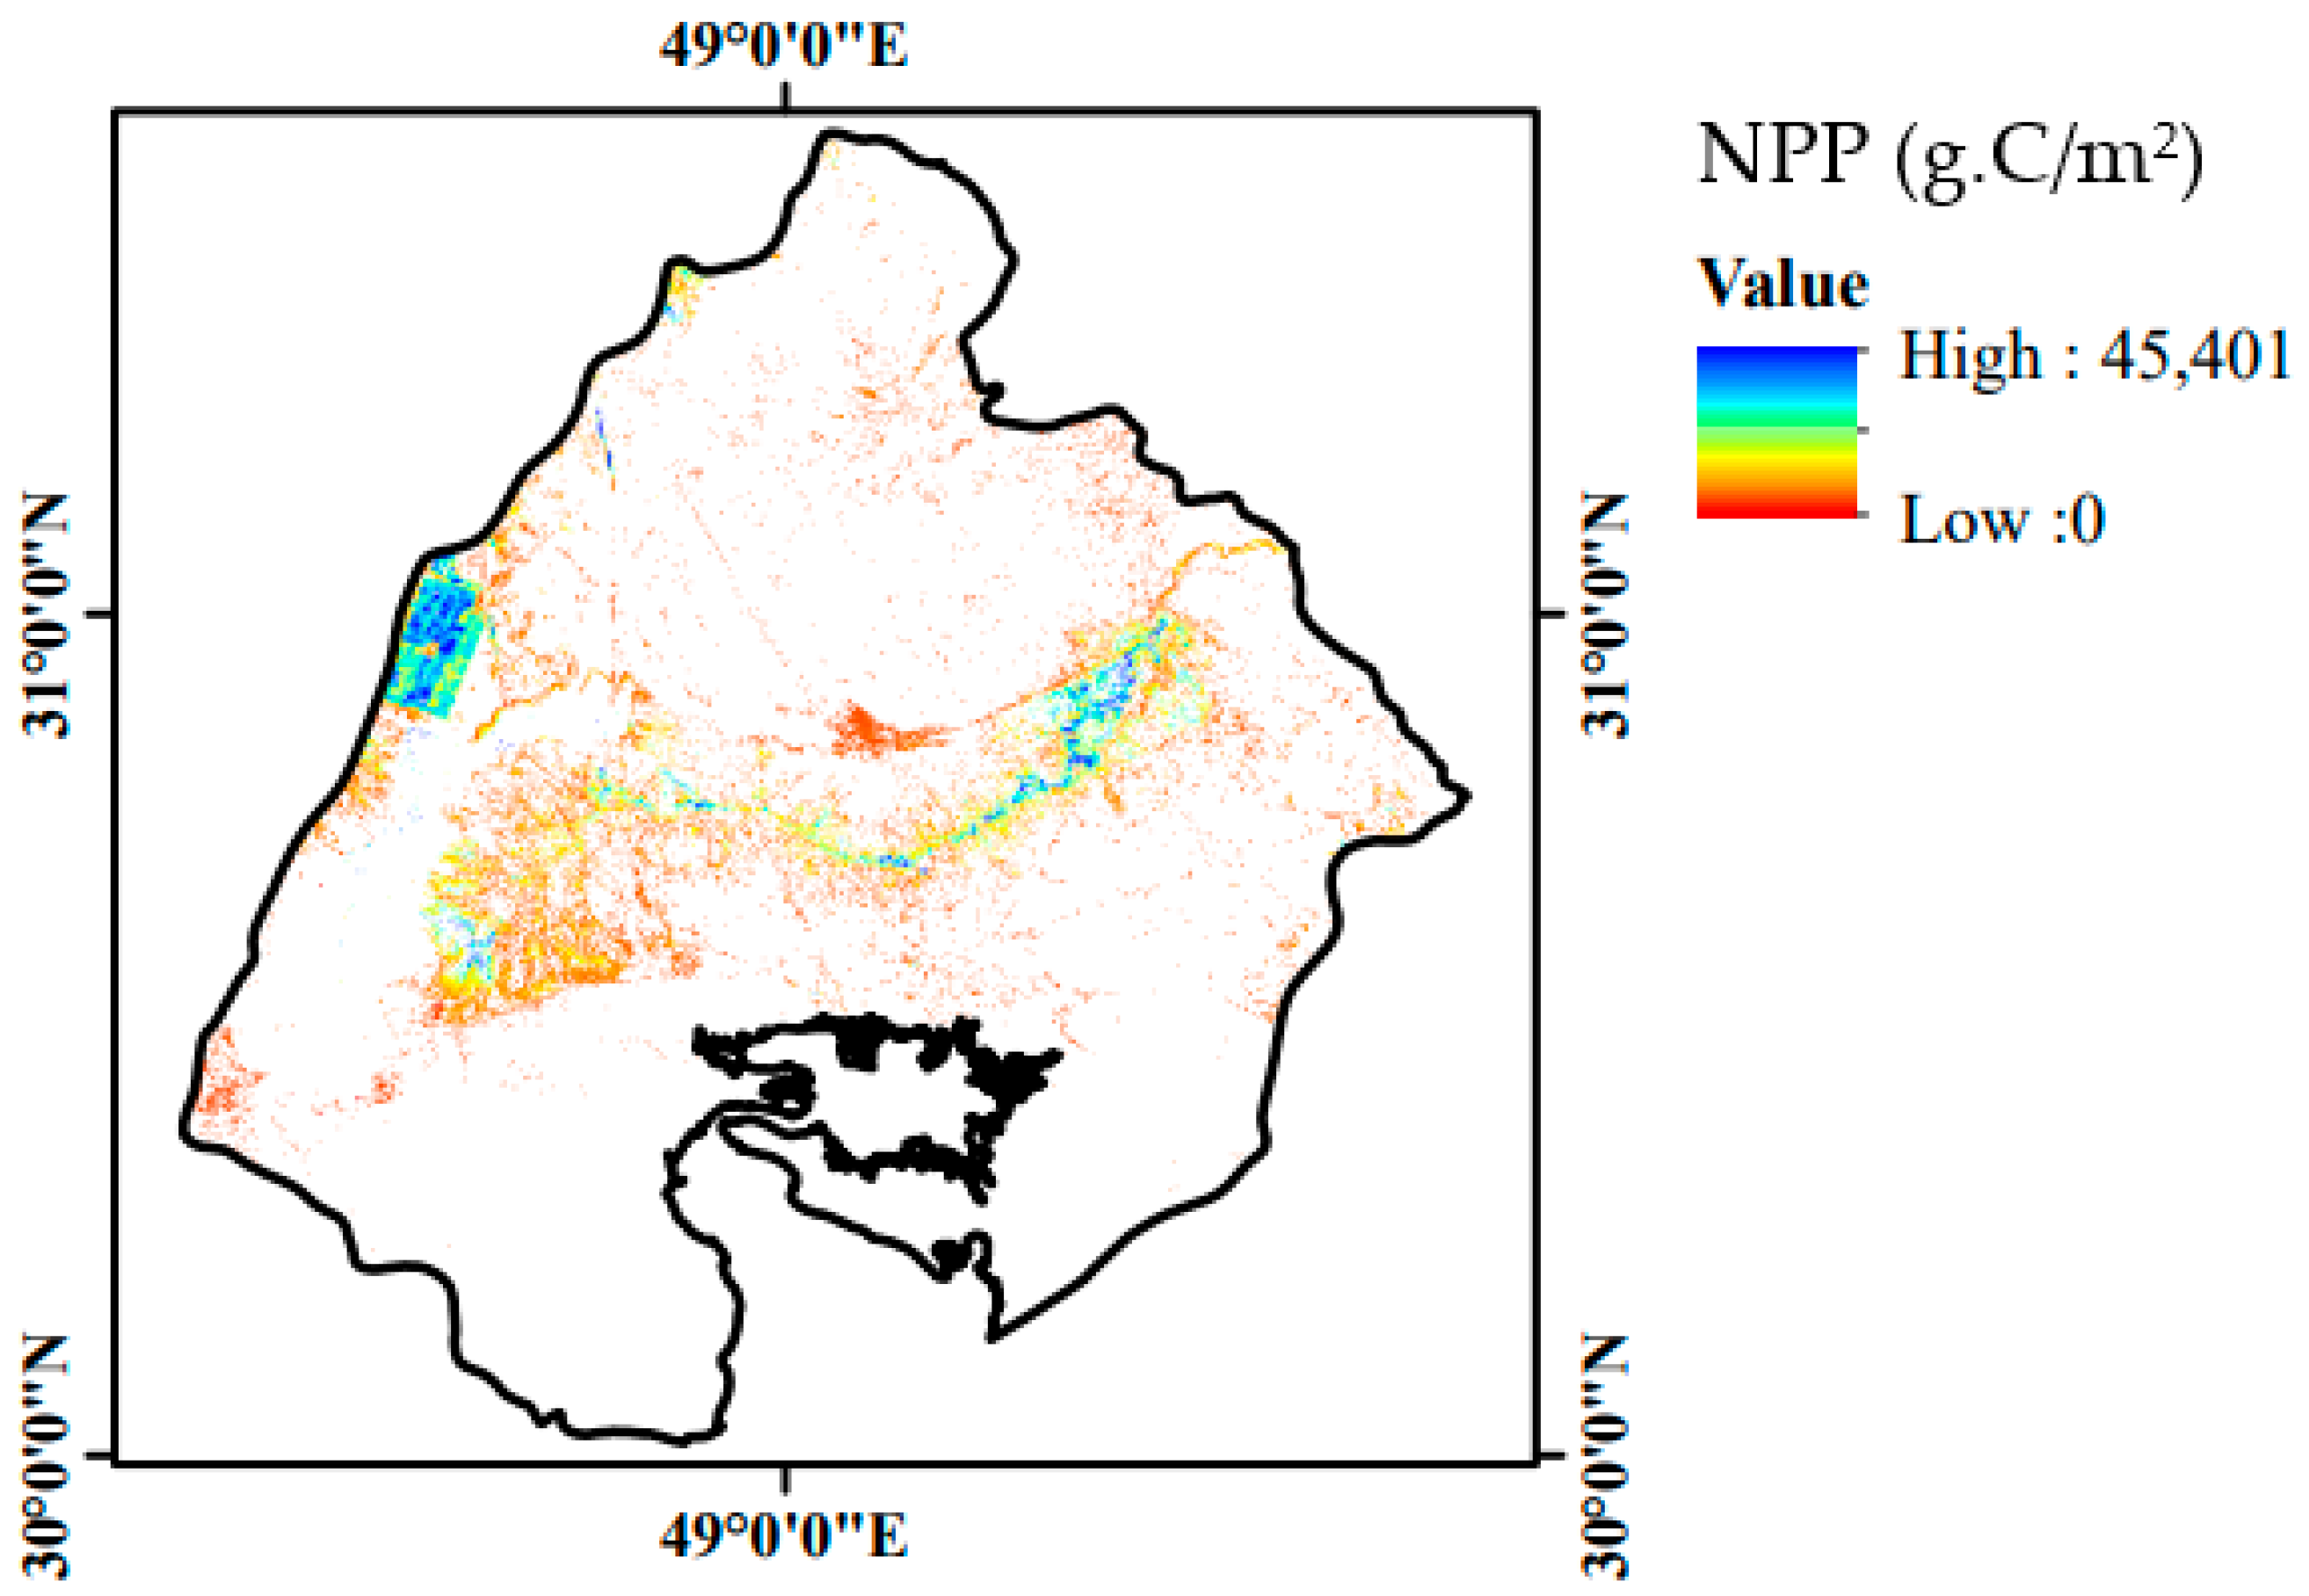
3.2. Net Primary Production
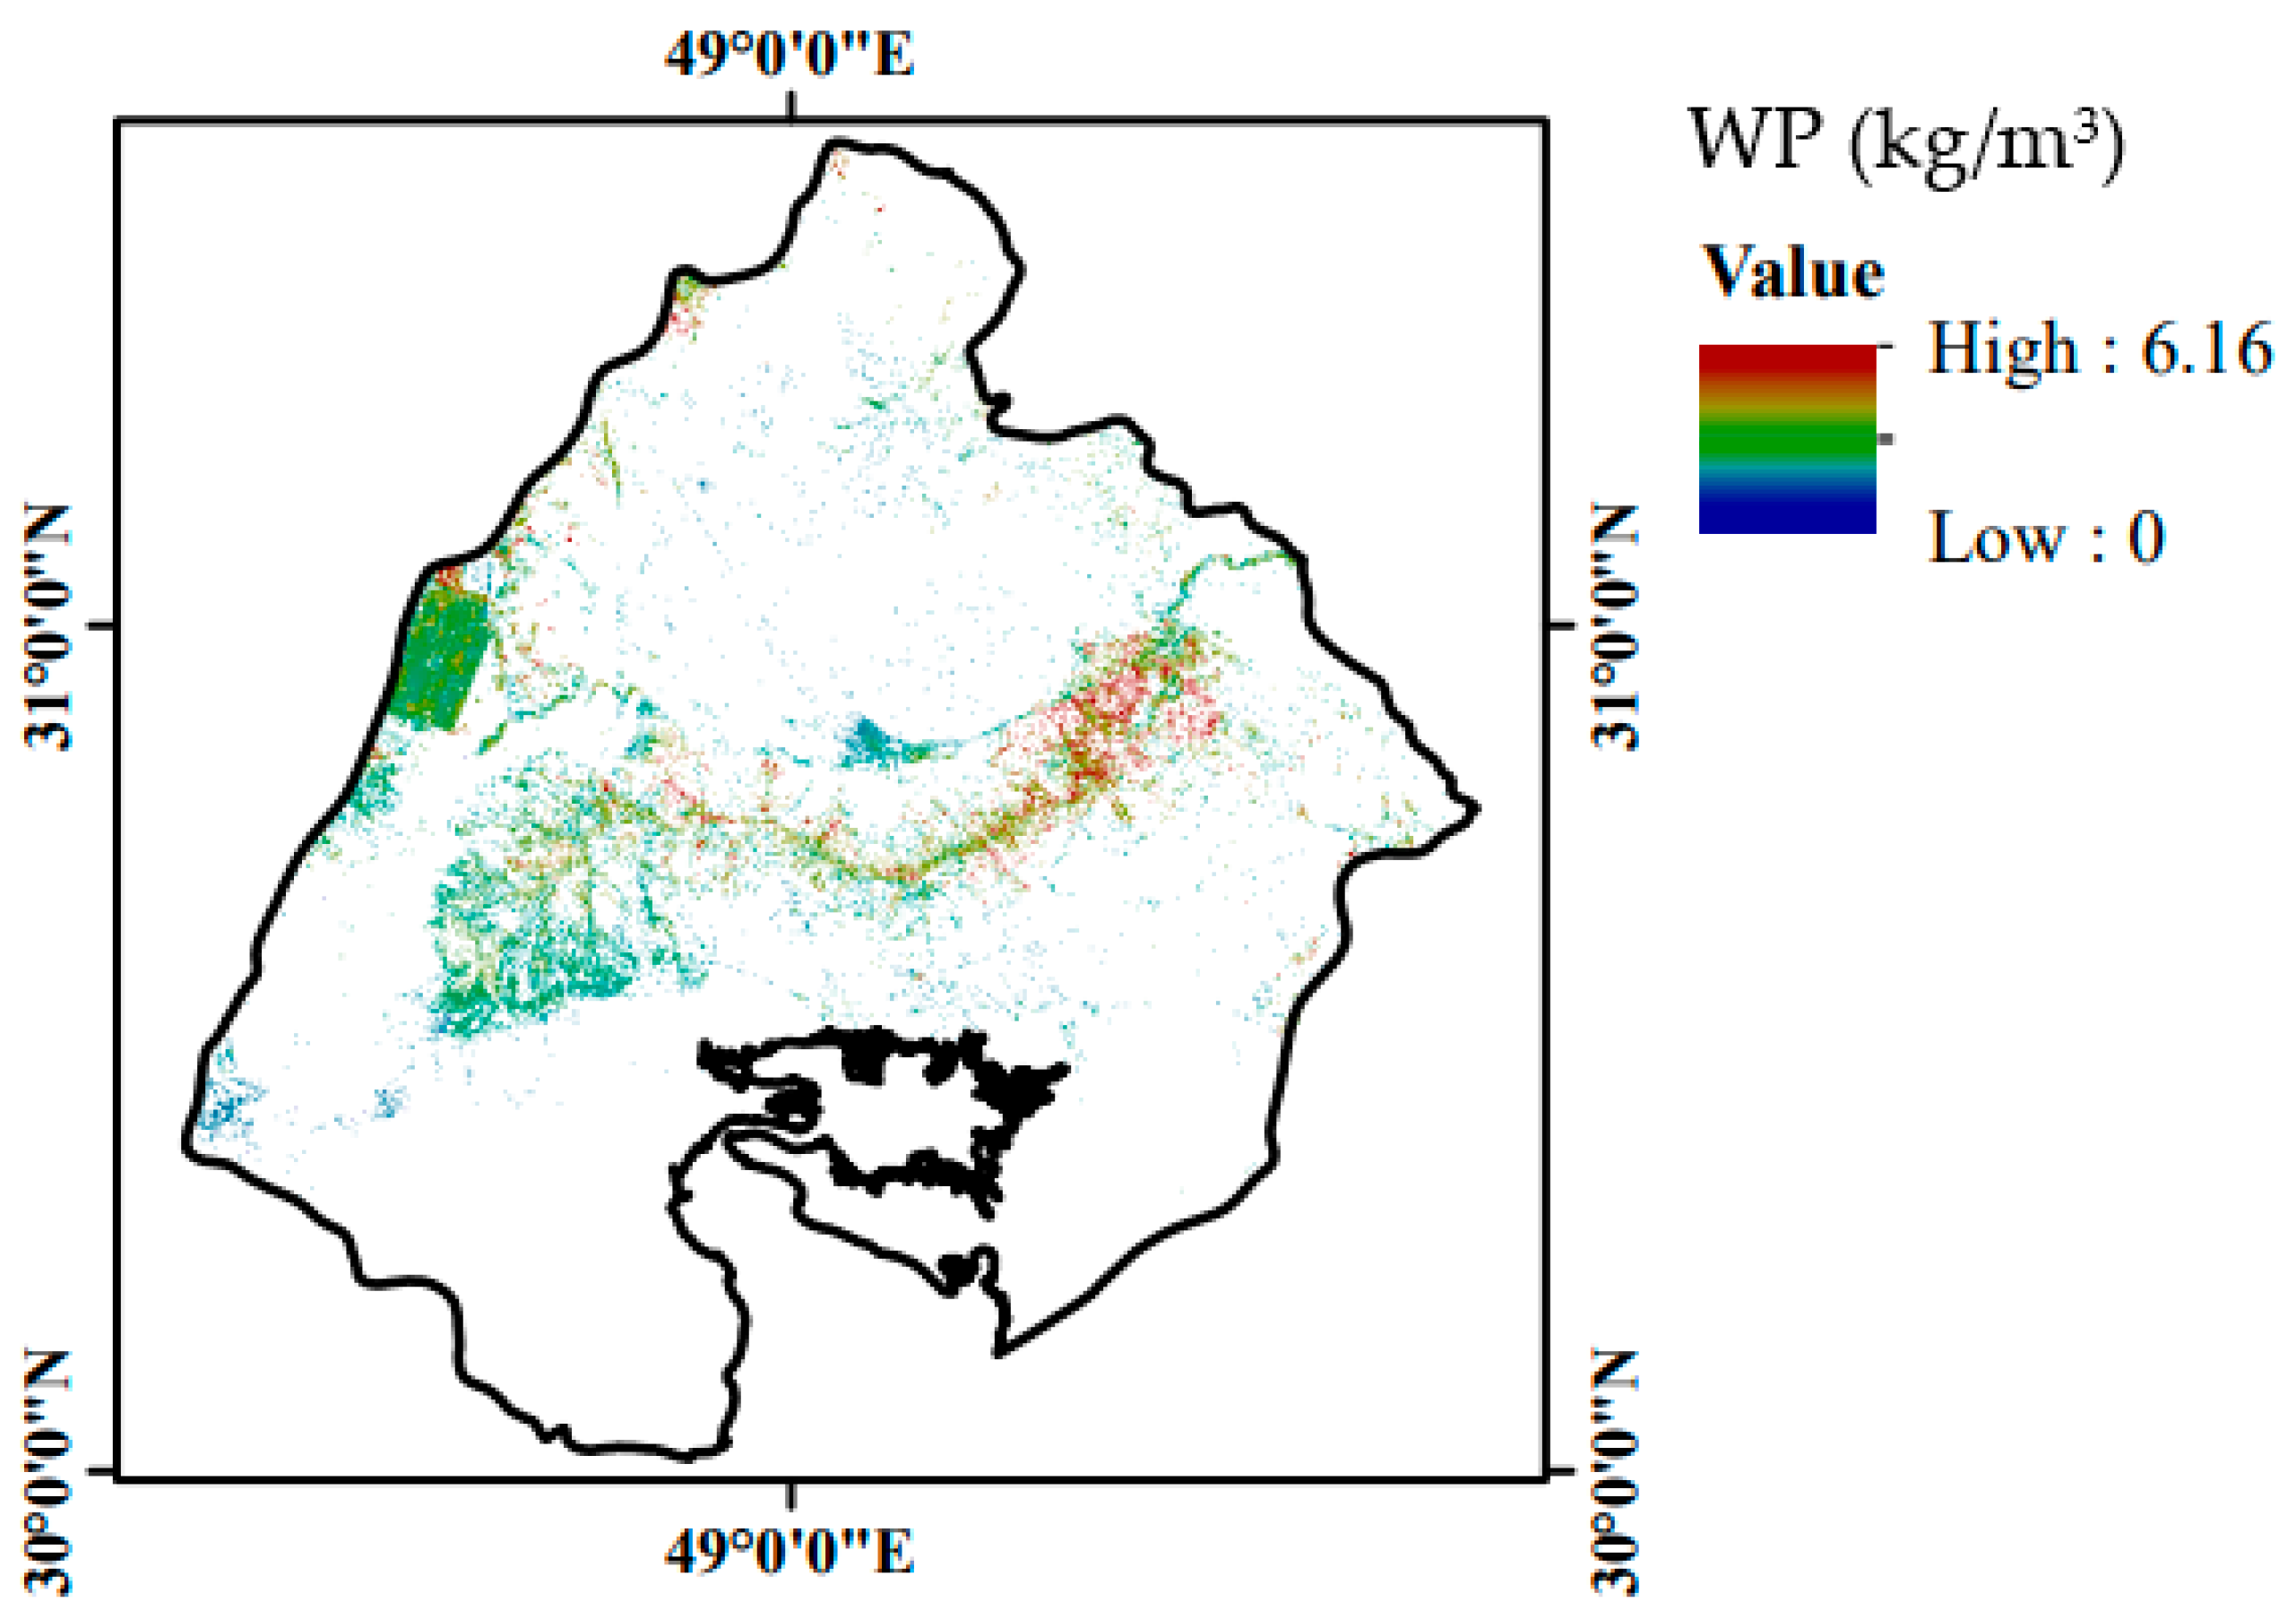
3.3. Crop Water Productivity Mapping
4. Conclusions
- Using different types of mulch to reduce evaporation;
- Using transplantation;
- Land leveling;
- Regulating deficit irrigation;
- Using subsurface drip irrigation.
Author Contributions
Funding
Institutional Review Board Statement
Informed Consent Statement
Data Availability Statement
Conflicts of Interest
References
- Ghorbanpour, A.K.; Kisekka, I.; Afshar, A.; Hessels, T.; Taraghi, M.; Hessari, B.; Duan, Z. Crop Water Productivity Mapping and Benchmarking Using Remote Sensing and Google Earth Engine Cloud Computing. Remote Sens. 2022, 14, 4934. [Google Scholar] [CrossRef]
- Bessembinder, J.J.E.; Leffelaar, P.A.; Dhindwal, A.S.; Ponsioen, T.C. Which crop and which drop, and the scope for improvement of water productivity. Agric. Water Manag. 2005, 73, 113–130. [Google Scholar] [CrossRef]
- Zwart, S.J.; Bastiaanssen, W.G.; de Fraiture, C.; Molden, D.J. A global benchmark map of water productivity for rainfed and irrigated wheat. Agric. Water Manag. 2010, 97, 1617–1627. [Google Scholar] [CrossRef]
- Marshall, M.; Aneece, I.; Foley, D.; Xueliang, C.; Biggs, T. Crop Water Productivity Estimation with Hyperspectral Remote Sensing. In Advanced Applications in Remote Sensing of Agricultural Crops and Natural Vegetation; CRC Press: Boca Raton, FL, USA, 2018; pp. 79–96. [Google Scholar]
- Javadian, M.; Behrangi, A.; Gholizadeh, M.; Tajrishy, M. METRIC and WaPOR estimates of evapotranspiration over the Lake Urmia Basin: Comparative analysis and composite assessment. Water 2019, 11, 1647. [Google Scholar] [CrossRef] [Green Version]
- Allen, R.G.; Tasumi, M.; Trezza, R. Satellite-based energy balance for mapping evapotranspiration with internalized calibration (METRIC)—Model. J. Irrig. Drain. Eng. 2007, 133, 380–394. [Google Scholar] [CrossRef]
- Bastiaanssen, W.G.M.; Menenti, M.; Feddes, R.; Holtslag, A.A. A remote sensing surface energy balance algorithm for land (SEBAL). 1. Formulation. J. Hydrol. 1998, 212–213, 198–212. [Google Scholar] [CrossRef]
- FAO. WaPOR Database Methodology: Level 1. Remote Sensing for Water Productivity Technical Report: Methodology Series; FAO: Rome, Italy, 2018; p. 72. [Google Scholar]
- Glenn, E.P.; Huete, A.R.; Nagler, P.L.; Nelson, S.G. Relationship between remotely-sensed vegetation indices, canopy attributes and plant physiological processes: What vegetation indices can and cannot tell us about the landscape. Sensors 2008, 8, 2136–2160. [Google Scholar] [CrossRef] [PubMed] [Green Version]
- Nagler, P.L.; Glenn, E.P.; Nguyen, U.; Scott, R.L.; Doody, T. Estimating riparian and agricultural actual evapotranspiration by reference evapotranspiration and MODIS enhanced vegetation index. Remote Sens. 2013, 5, 3849–3871. [Google Scholar] [CrossRef] [Green Version]
- Bastiaanssen, W.G.M.; Cheema, M.J.M.; Immerzeel, W.W.; Miltenburg, I.J.; Pelgrum, H. Surface energy balance and actual evapotranspiration of the transboundary Indus Basin estimated from satellite measurements and the ETLook model. Water Resour. Res. 2012, 48, W11512. [Google Scholar] [CrossRef] [Green Version]
- Allen, R.G.; Pereira, L.S.; Raes, D.; Smith, M. FAO Irrigation and Drainage Paper No. 56. Crop Evapotranspiration (Guidelines for Computing Crop Water Requirements); Food and Agriculture Organisation of the United Nations: Rome, Italy, 1998; p. 300. [Google Scholar]
- Veroustraete, F.; Sabbe, H.; Eerens, H. Estimation of carbon mass fluxes over Europe using the C-Fix model and Euroflux data. Remote Sens. Environ. 2002, 83, 376–399. [Google Scholar] [CrossRef]
- Richards, J.A. Remote Sensing Digital Image Analysis; Springer: New York, NY, USA, 2022. [Google Scholar]
- Poudel, U.; Stephen, H.; Ahmad, S. Evaluating Irrigation Performance and Water Productivity Using EEFlux ET and NDVI. Sustainability 2018, 13, 7967. [Google Scholar] [CrossRef]
- Ghorbanian, A.; Kakooei, M.; Amani, M.; Mahdavi, S.; Mohammadzadeh, A.; Hasanlou, M. Improved land cover map of Iran using Sentinel imagery within Google Earth Engine and a novel automatic workflow for land cover classification using migrated training samples. ISPRS J. Photogramm. Remote Sens. 2020, 167, 276–288. [Google Scholar] [CrossRef]


Disclaimer/Publisher’s Note: The statements, opinions and data contained in all publications are solely those of the individual author(s) and contributor(s) and not of MDPI and/or the editor(s). MDPI and/or the editor(s) disclaim responsibility for any injury to people or property resulting from any ideas, methods, instructions or products referred to in the content. |
© 2023 by the authors. Licensee MDPI, Basel, Switzerland. This article is an open access article distributed under the terms and conditions of the Creative Commons Attribution (CC BY) license (https://creativecommons.org/licenses/by/4.0/).
Share and Cite
Hajirad, I.; Mohammadi, S.; Dehghanisanij, H. Determining the Critical Points of a Basin from the Point of View of Water Productivity and Water Consumption Using the WaPOR Database. Environ. Sci. Proc. 2023, 25, 86. https://doi.org/10.3390/ECWS-7-14322
Hajirad I, Mohammadi S, Dehghanisanij H. Determining the Critical Points of a Basin from the Point of View of Water Productivity and Water Consumption Using the WaPOR Database. Environmental Sciences Proceedings. 2023; 25(1):86. https://doi.org/10.3390/ECWS-7-14322
Chicago/Turabian StyleHajirad, Iman, Sanaz Mohammadi, and Hossein Dehghanisanij. 2023. "Determining the Critical Points of a Basin from the Point of View of Water Productivity and Water Consumption Using the WaPOR Database" Environmental Sciences Proceedings 25, no. 1: 86. https://doi.org/10.3390/ECWS-7-14322