
Assessing the Economic Damage of Potential Flooding Zones by Combining Cadaster and Land Use Data in the Larnaca Region, Cyprus †


Department of Marine Sciences, School of Environment, University of the Aegean, 81100 Lesvos, Greece
*
Author to whom correspondence should be addressed.
†
Presented at the 7th International Electronic Conference on Water Sciences, 15–30 March 2023; Available online: https://ecws-7.sciforum.net/ .
Environ. Sci. Proc. 2023, 25(1), 76; https://doi.org/10.3390/ECWS-7-14323
Published: 12 April 2023
(This article belongs to the Proceedings of The 7th International Electronic Conference on Water Sciences)
Abstract
:Precipitation changes caused by climate change are a phenomenon that may have far more serious consequences in urban areas than previously thought. Preventing the flood extent in rural and urban areas is crucial for the protection of human well-being and private and public land, and for the prevention of human casualties. Modeling potential floods and studying historic ones are key parameters to prevent damages from this natural disaster. European Union Directive 2007/60/EK obligated Member States to compile flood risk maps, showing the potential flood’s extent and depth. Using Cyprus river flood risk maps of the region of Larnaca, Corine land cover data, and open-access cadaster data, this study attempts to assess the economic damage. Cadaster data of buildings such as floor number and basement existence are incorporated in the damage functions used for flood recurrence intervals of 20, 100, and 500 years return periods. The study found that in the 500 year return flood period, 562 buildings would be potentially affected. The flood risk areas in the region of Larnaca consist of mainly urban (48%) and cultivation zones (50%), both economically important. The results suggest that economic damage assessment based on the applied data, combined with flood risk maps, can provide valuable information to disaster responders.
1. Introduction
The gradual increase in the global temperature brings multiple problems which will significantly affect people’s lives, with problems that are directly related to people’s everyday life, but also ones that will appear unexpectedly [1]. The increase in precipitation phenomena globally [2] is one of the results of climate change that should particularly concern humanity. In Europe, precipitation trends differ depending on the latitude; the northern part receives a higher percentage of rain by 10–40%, while the southern part of the continent in some areas faces up to a 20% decrease [3]. Despite the fact of decreased rainfall in some areas, a growing number of studies show that there is evidence of an increase in extreme precipitation events [4,5,6]. Future precipitation extreme trends suggest that the sub-daily extreme rainfall of 50 year and 100 year return periods will triple under the Representative Concentration Pathway (RCP) 8.5 scenario [7]. With southern Europe’s extreme hot and dry days, extreme precipitation events will have much worse consequences [8], making flood events a greater risk than expected.
For the management and monitoring of floods in urban areas, the European Commission established the Flood Directive (2007/60/EC) [9]. The main scope of the framework is the reduction of adverse flood effects on the environment, human health, cultural heritage, and economic activities that are directly linked to society. The member states of the European Union were obligated to establish a River Basin Flood Risk Management Plan, identifying vulnerable areas considering long-term developments and future flood occurrence. The key objective of the flood risk assessment on a country’s level is flood hazard maps, which show, based on the flood probability, the flood extent, the depth, and the flow speed. In addition, the flood risk maps assess the potential adverse consequences for the economic activity of the area, as well as for potentially affected residents.
The Republic of Cyprus, as a member state of the European Union, had already incorporated the provisions of Directive 2007/60/EC into Cypriot law in 2010. With the main evaluation parameters being the size of the river basin area (greater than 10 km2), the proximity to urban developed areas, and the historical overflow of the river, 19 areas of potentially significant flood risk were defined. A key element in the flood risk assessment is the listing of important public elements that will be affected, as well as the economic activities of the area. An integrated coast damage assessment, however, is not analyzed in the flood management plans.
In the study of flood damage assessment for each continent, Huizinga et al. [10] created a methodology based on extensive literature reviews and surveys to assess the economic damage induced by flood depth. For the purpose of overcoming the barrier of comparing flood damage assessments from different countries, normalized damage functions at a national scale were utilized. Adapting the methodology followed by the above-mentioned study at a regional scale, the Cyprus depth damage curve (DDC), at a national scale, was updated based on the Gross Domestic Product of 2021. Furthermore, having one of the biggest cities of Cyprus, Larnaca, as a pilot study area, the methodology was applied within the extent of the potential flooding zones of 20, 100, and 500 year return periods. Adapting the methodology for the data of the residential buildings from Cyprus’s cadaster, the study aims to compare the differences in the damage assessment based on national- and local-based economic data.
2. Methods
Larnaca is the third largest city in Cyprus, with a population of 51.468. Located on the northeast coast of Cyprus, the city area covers an area of 32 km2 with a mean elevation of 26 m. The climate is typically Mediterranean, with rainfall levels reaching 320 mm. Based on assessments by the Water Development Department (WDD), there are 3 potentially high flood-risk zones in the province of Larnaca. In this study, the area of the biggest coverage will be used as an area of interest. The area is located in the central part of the city, Aradippou-Livadia. With a length of 11.2 km, the Archangelos-Kammitsis and Parapotamos rivers pass through the agricultural, residential, and industrial areas before ending up in the sea. Areas located in this potential hazard zone have been exposed to 7 floods in the past, according to the records of the Water Development Department (WDD), of which 5 were of low severity, one was moderate, and one was high.
A key element of this research is the flood risk maps obtained from the WDD of Cyprus, which visualize the potential flood extents of 50, 100 year, and 500 year return periods. The potential flood data contain flow velocity values as well as flood depth. In addition to flood data, building data were used. The buildings’ data were digitized by the open-access cadastral platform of Cyprus. The obtained data describe only residential buildings. The location of each building, the estimated value of the property, and their size (sqm) were collected. The gathered data were, furthermore, analyzed in GIS software and verified with field visits. In order to calculate the damage within the urban zone area, Corine’s Land Use data were used as a guide to locate the extent of the urban zone while obtaining the data.
To calculate the economic damage of the residential buildings in the potential flood area, the approach of the DDC was used based on the methodology of Huizinga et al. (2017). Their approach calculated the damage curves for each continent, differentiating them based on the maximum damage values per country. These maximum damage values were based on construction cost surveys by multinational construction companies, which provide a coherent set of detailed construction cost data in dozens of countries. A fixed set of maximum flood damage values was calculated for all countries, using statistical regressions with socioeconomic indicators of global development.
To calculate the construction price, the GDP of Cyprus in 2021 was used with residential construction estimation constants. The structure cost index was then used in the calculation of the maximum damage, which is expressed by Equation (1). The components of the equation are defined by a series of fixed values which, according to the study and case, can change the value adjusted to a scale of 0–1.
MaxDamage = StructureCost × DepreciatedValue × (1-Undamageable part) × MaterialUsed
To construct the DDC, the maximum damage cost is related to the normalized scale of the damage function, where the maximum value is matched to the damage scale value 1 and the other values are correspondingly calculated through Equation (2).
Damage = DamageFunction × MaxDamageCost/MaxDamage Function
To calculate the economic damage using the residential building data in the flood area of Larnaca, the flood height of each building, the estimated property value based on 2021, and the size of the building were used. Initially, the flood heights were calculated in relation to the height of each flooded building. The construction cost of the building was calculated based on the value of the property divided by its size, and consecutively the maximum cost was calculated using Equation (1). Beyond the difference in the calculation of the construction price, the Depreciated Value index was overlooked. Since the DDC represents the damage in 2021 and the residential value data from the Cyprus cadaster are estimated for the same year, the Depreciated Value Index was not taken into account. Lastly, to calculate the total damage, the residential buildings were grouped by flood depth, and their damage costs were calculated separately. In order to compare the total damage by flood scenario, the economic data of the Cyprus damage curve were used for the potential flood depths in the Larnaca area. The buildings’ point data were grouped based on the area of the urban fabric. The 562 buildings were grouped at 28 polygons of residential areas and the total damage was calculated based on the equation of Cyprus’ DDC.
3. Results and Discussion
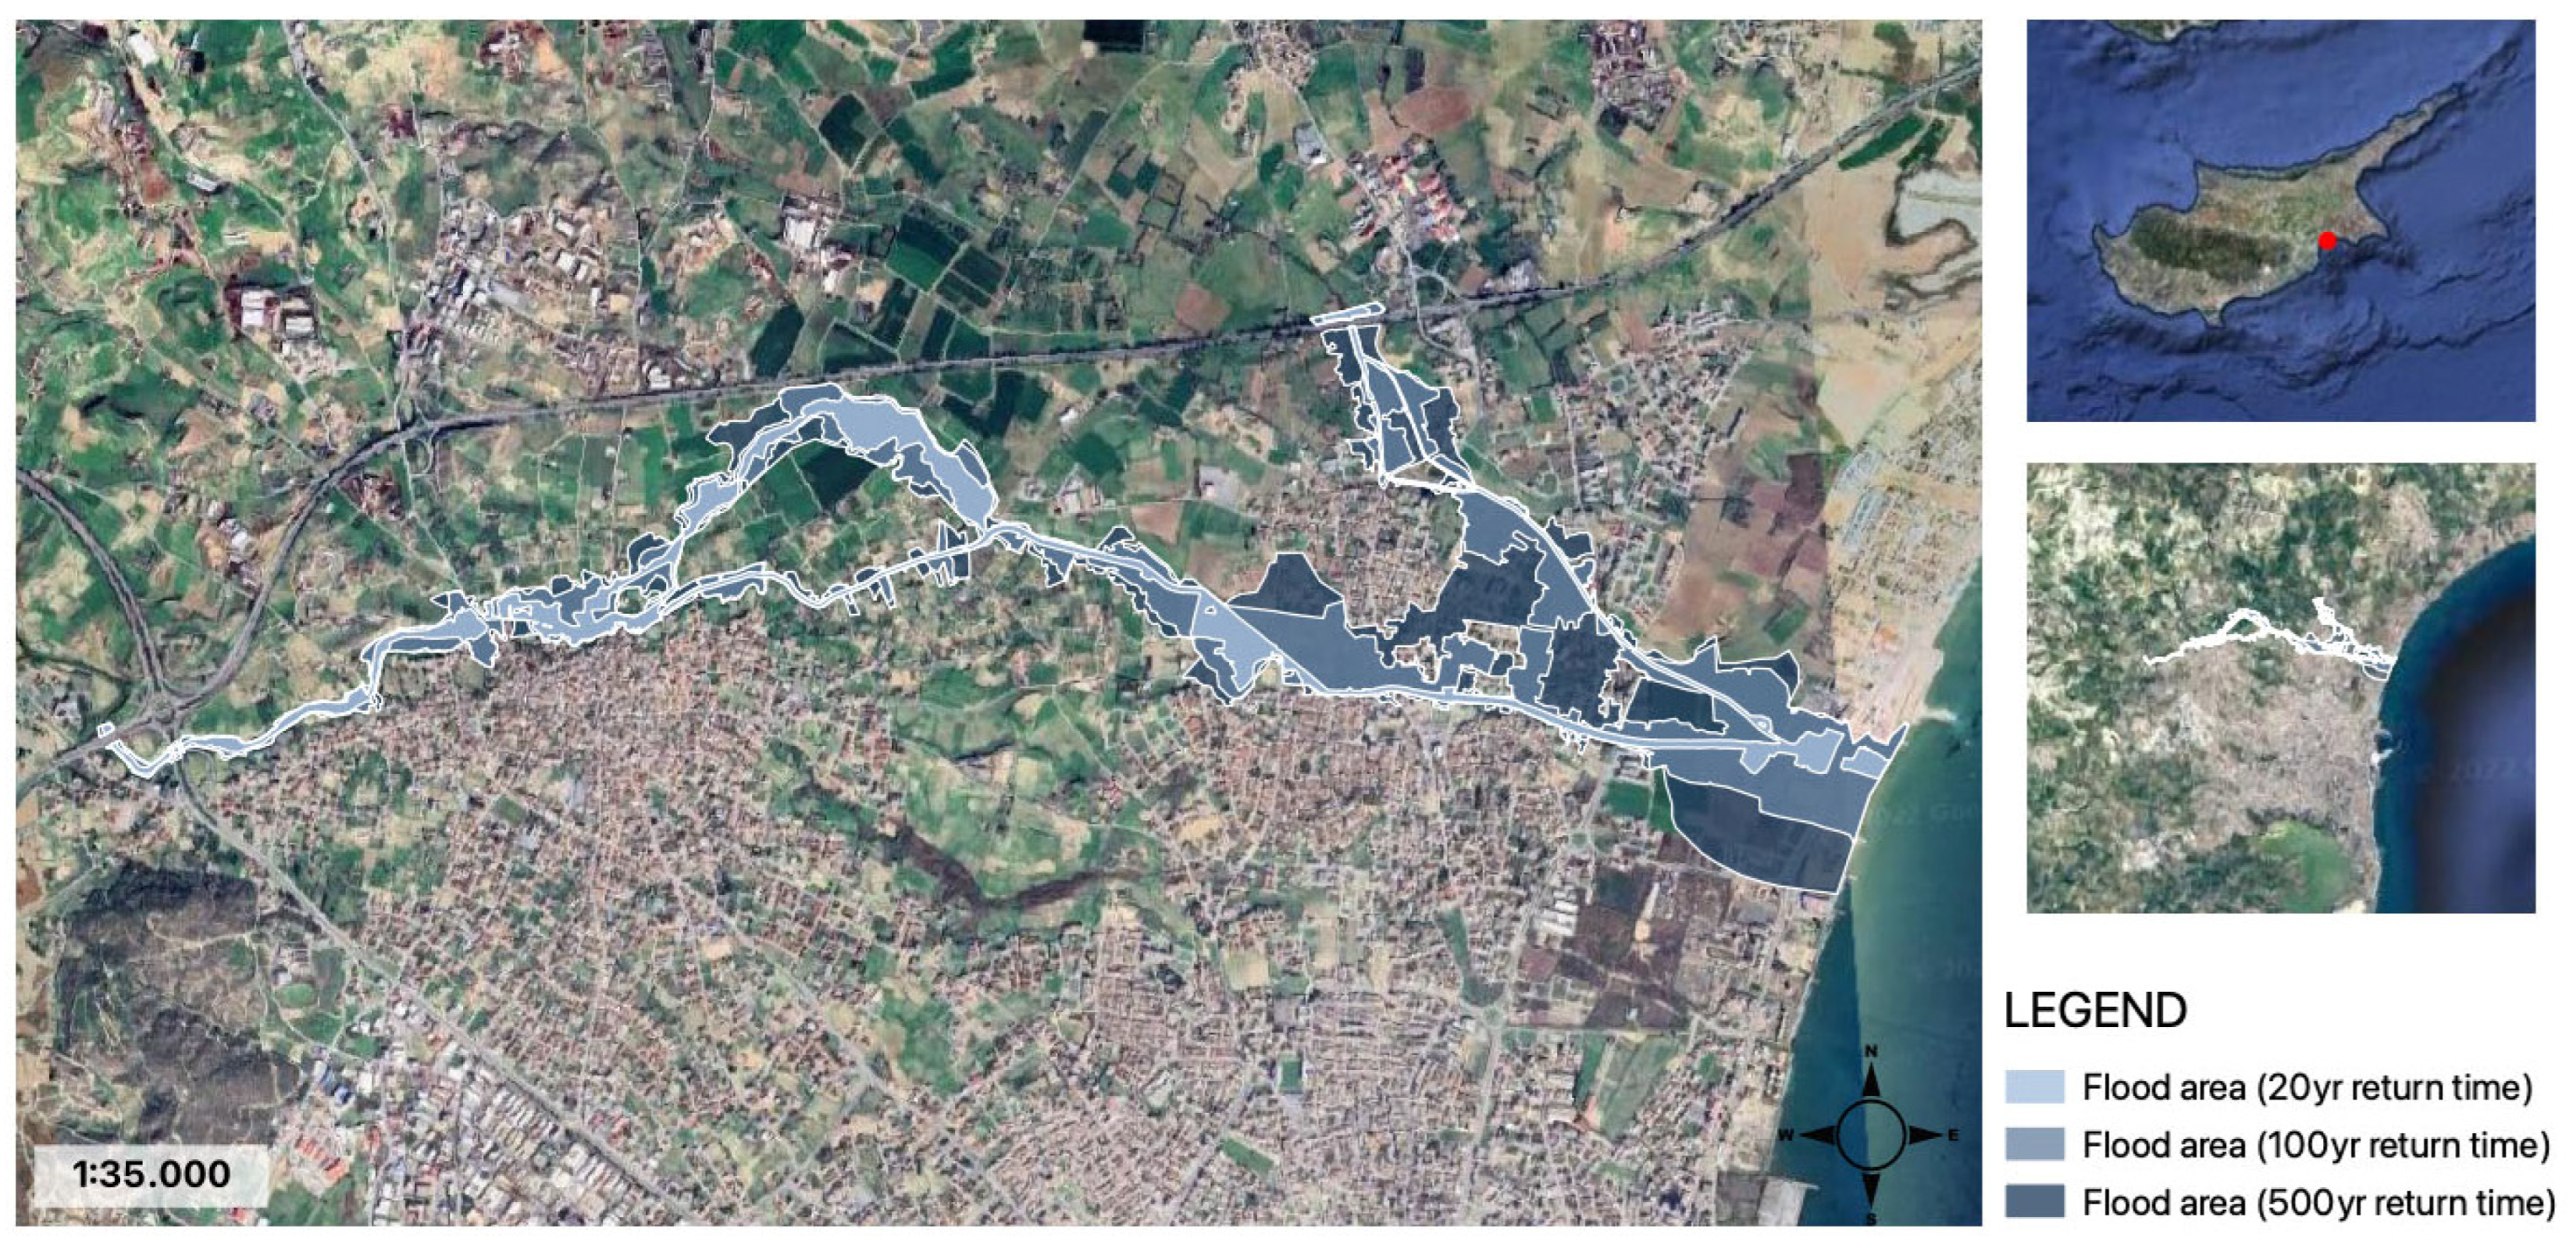
The potential flood zones in the northern part of Larnaca cover an area with a high density of urban fabric. Based on the data of the Water Development Department, the visualization of the potential flood areas is shown on the map below (Figure 1). Looking at the potential flood areas per scenario, it appears that the flood area increases significantly per flood return period. Specifically, from the 20-year return period to the 500-year, the extent of the flooding area is 85% larger, covering 2.5 square kilometers. The inundation depths were noted to range from 0 to 6.8 m maximum depth, with average depth values per scenario being 0.85 m at the 20-year return and 0.84 m at the 100- and 500-year returns. It is worth noting that values greater than 3 m were not recorded in any of the scenarios outside the river basin extent.
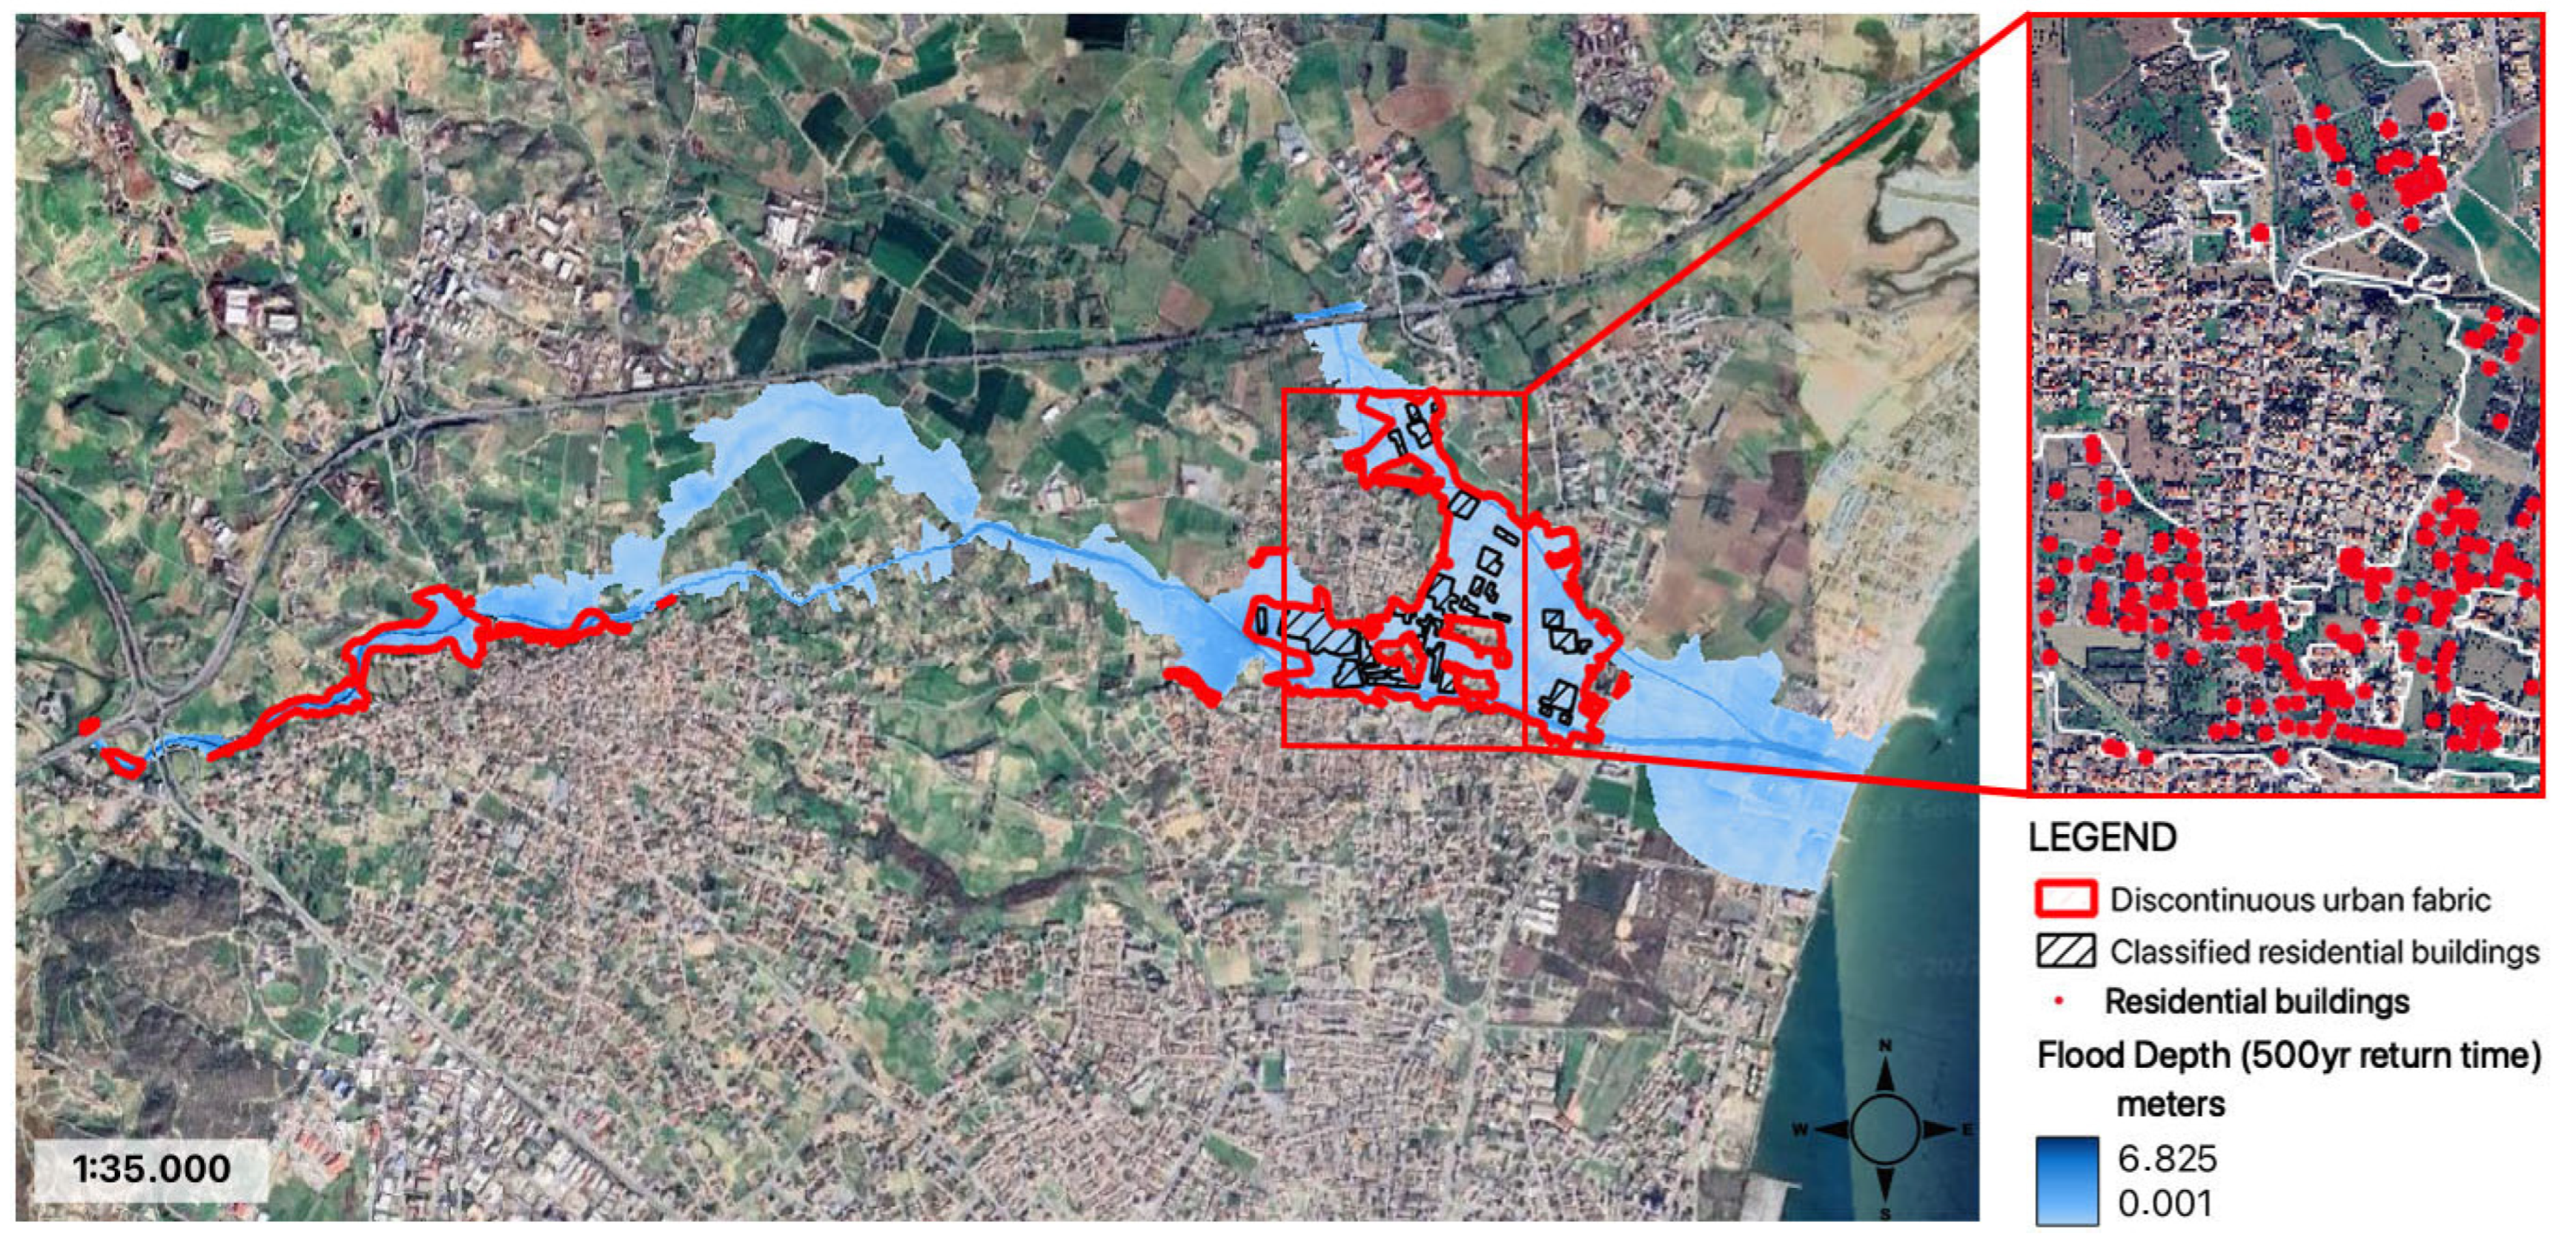
The extent of the urban fabric obtained from Corine (code 112) was used to make a targeted collection of residential data from the cadastral register of Cyprus. It was observed that, in the eastern urban fabric zone, no residential buildings were noted, only auxiliary industrial buildings (warehouses). For the research, only residential data were taken into account; therefore, the eastern area under urban fabric land was not taken into consideration. With the spatial extents of the maximum flood scenario of the 500-year return period (Figure 2), the residential buildings’ data were collected from the cadastral register of Cyprus. The locations for each building, the height, and the value of the building were collected for 562 buildings within the flood extent. For research purposes, parks, plots without the presence of buildings, and commercial buildings were not recorded in the database.
Since all buildings belonged to the same urban zoning code, the heights of the buildings had fixed values based on their floors, i.e., buildings with one floor were 5 m high, buildings with two floors were 10 m high and buildings with three floors were 13.5 m high. Of the 562 buildings, prices ranged from EUR 40,000 minimum to EUR 3,000,000 maximum, with an average price of EUR 590,000. Based on the number of floors, 33% of the buildings had one floor, 63% of the buildings had two floors, and 4% of the buildings had three floors.
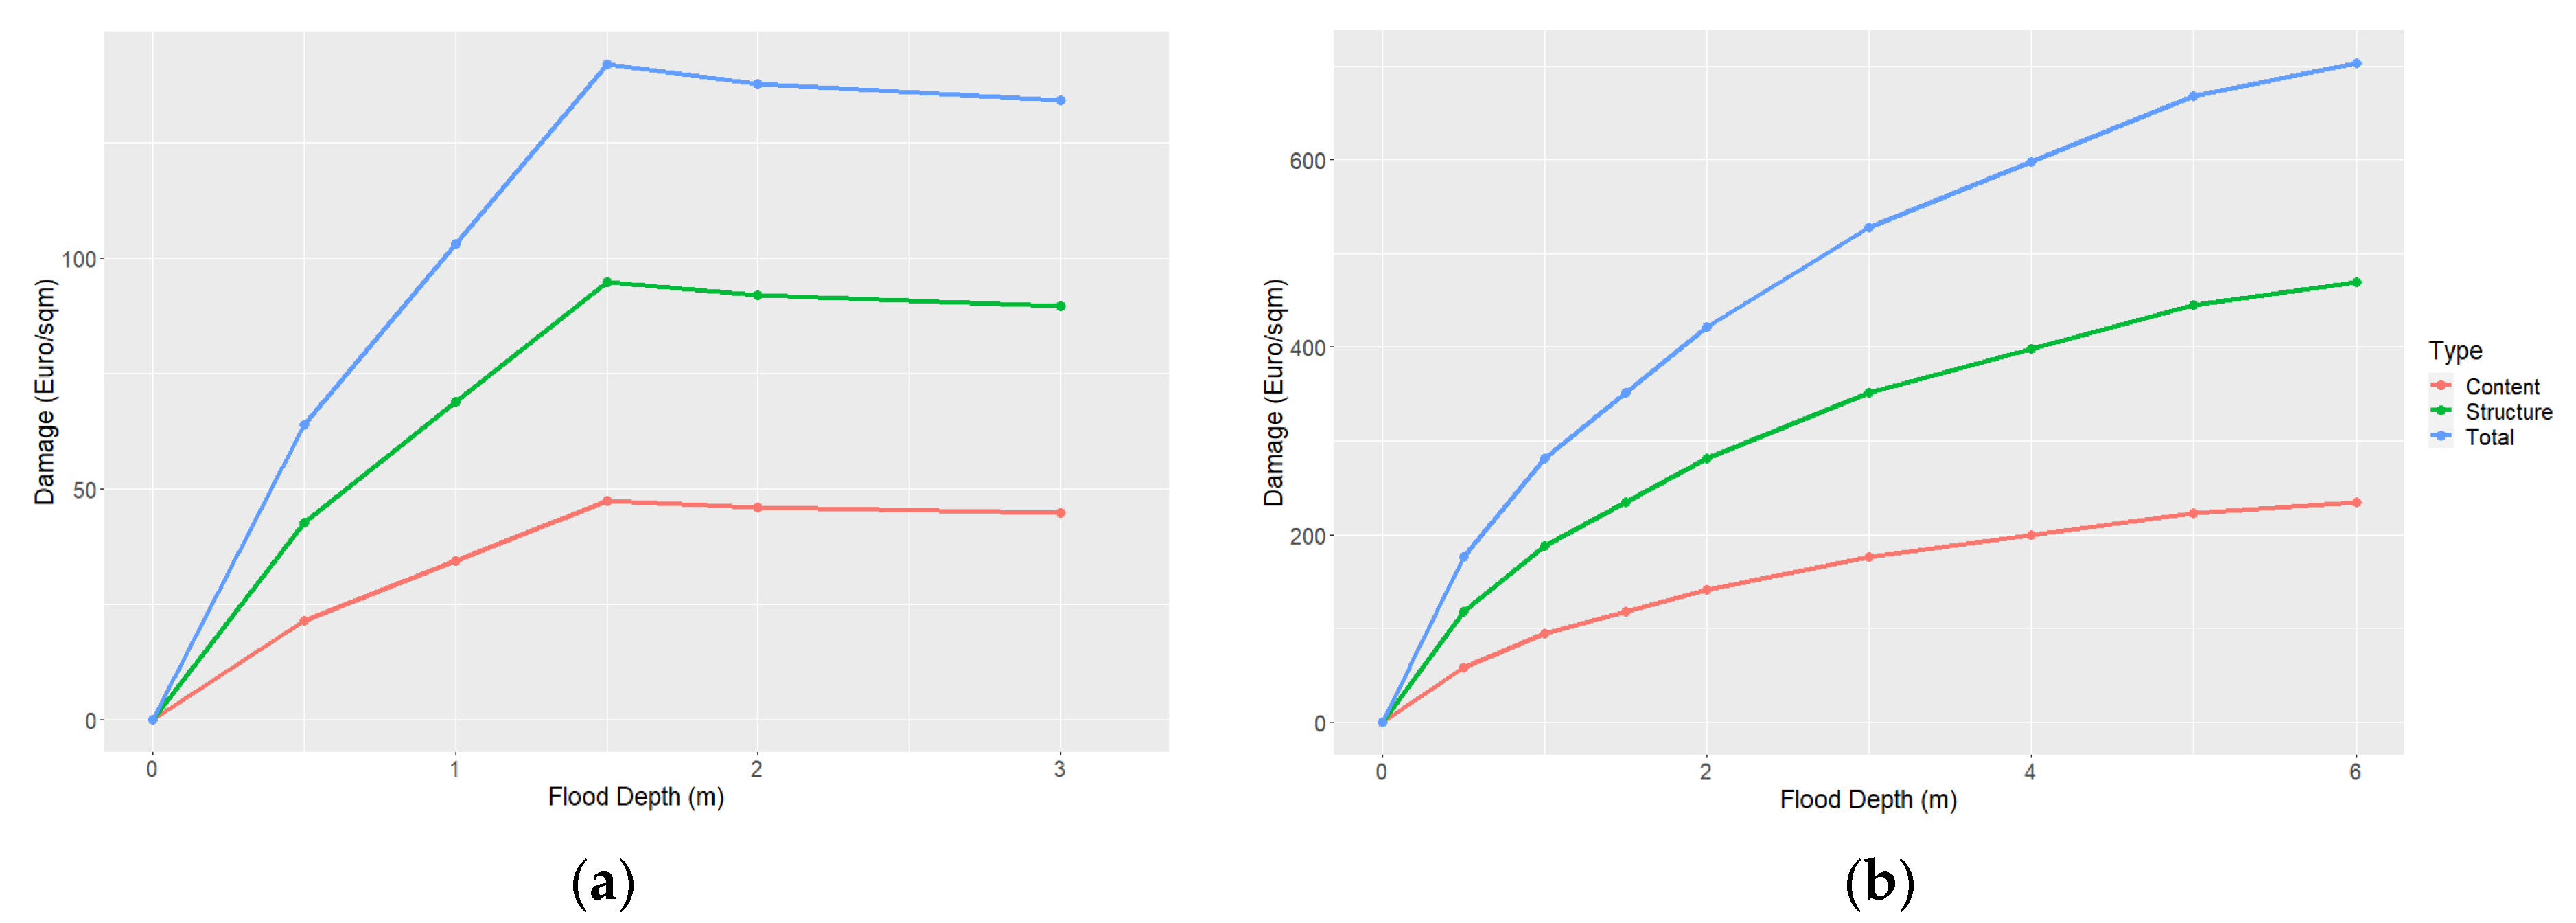
The damage curves below represent two different assessments: the DDC for Cyprus (Figure 3b), and the DDC for Larnaca’s sub-region (Figure 3a). Based on the revised financial data of 2021, on a country scale, Cyprus’ flood damage costs ranged from 50 euros/m2 to a maximum price of 700 euros/m2. Larnaca’s regional results for the potential flood area of a 500-year return period, however, showed that the damage values in the residential zone ranged from 25 euros/m2 to a maximum value of 200 euros/m2. Beyond the financial differences, the graphs show some other significant differences. In the horizontal axis of flood depth values, Figure 3b has a maximum value of 6 m flood depth, while Figure 3a has a maximum value of 3 m. In the case study of Larnaca, no buildings were noted in flood areas at water depths higher than 3 m. While the two figures have the same axis, their content is rather different. Figure 3b expresses the approximate damage cost of a mean building in Cyprus based on surveys and bibliography at all possible flood depths. In the case of Larnaca (Figure 3a), the DDC is based on the data of 562 buildings within the potential flood limits. Furthermore, the damage cost does not represent a single building’s damage per flood depth, but each one of the buildings’ flood depths per flood scenario.
The economic flood damage results for Larnacas area and Cyprus are presented in Table 1. The costs of total damage for all three potential flood scenarios, based on Larnacas residential data, showed that the damage is calculated at 32.6 EUR M in the 500-year return period, 16.8 EUR M in the 100-year return period, and 13.7 EUR M in the 20-year return period. Additionally, the states’ damage prices per flood scenario calculated a maximum cost of 69.2 EUR M in the 500-year return period, 27.7 EUR M for the 100-year return period, and 0.48 EUR M for the 20-year return period. The cost differences for the flood scenarios of 500- and 100-year return periods had a significant difference (37 and 11 EUR M), with the higher costs calculated by the county’s damage values; the first scenario seemed to have a negative difference, with the total damage in Larnaca estimated at 13 EUR M more. As mentioned above, this occurred due to the difference in the methodology of assessing the total cost, where the damage cost is based on the number of buildings.
4. Conclusions
Further investments and urban sprawl within the flood risk extent increases the risk of damage [11], and for this reason systematic coast damage evaluation is deemed necessary for management reasons. In the Cyprus flood risk management plans, cost damage is not analyzed in depth. Apart from the references to economic activities in the risk area, the economic damage is assessed at a qualitative level. Huizinga et al. (2017)’s technical report is a great tool for cost damage assessment based on the economy of the national extent. In this approach, a database of the endangered residential buildings and their values were used for the calculation of the flood damage. Even though many of the empirical parameters of the damage indices were used with their default values, the inclusion of damage costs of 562 buildings was an important addition to the local application methodology. Although, with the data available, other models for calculating total flood damage could be used [12], the above application was preferred since the pilot area belonged to an EU country. Due to the time-consuming manual process of gathering the building data, only residential buildings were assessed through the study. With the immediate and collective provision of cadastral data for the entire floodplain area, it would be possible to assess other building categories with the same methodology (e.g., parks and commercial buildings).
Author Contributions
Conceptualization, A.Ć. and O.T.; methodology, A.Ć.; software, A.Ć.; validation, O.T.; formal analysis, O.T.; investigation, A.Ć. and O.T.; resources, A.Ć.; data curation, O.T.; writing—original draft preparation, A.Ć.; writing—review and editing, O.T.; visualization, A.Ć.; supervision, O.T.; project administration, A.Ć. and O.T. All authors have read and agreed to the published version of the manuscript.
Funding
This research received no external funding.
Institutional Review Board Statement
Not applicable.
Informed Consent Statement
Not applicable.
Data Availability Statement
Restrictions apply to the availability of these data. Data was obtained from Cyprus cadastral platform, for policy reasons data can’t be shared.
Conflicts of Interest
The authors declare no conflict of interest.
References
- McMichael, A.J.; Woodruff, R.E.; Hales, S. Climate change and human health: Present and future risks. Lancet 2006, 367, 859–869. [Google Scholar] [CrossRef] [PubMed]
- Mohammed, H.I.D. Climate change and changes in global precipitation patterns: What do we know? Environ. Int. 2005, 31, 1167–1181. [Google Scholar]
- Dai, A.; Fung, I.Y.; Del Genio, A.D. Surface observed global land precipitation variations during 1900-88. J. Clim. 1997, 10, 2943–2962. [Google Scholar] [CrossRef]
- Klein Tank, A.; Wijngaard, J.; Können, G.; Böhm, R.; Demarée, G.; Gocheva, A.; Mileta, M.; Pashiardis, S.; Hejkrlik, L.; Kern Hansen, C.; et al. Daily dataset of 20th-century surface air temperature and precipitation series for the European Climate Assessment. Int. J. Climatol. 2002, 22, 1441–1453. [Google Scholar] [CrossRef]
- Zolina, O.; Simmer, C.; Belyaev, K.; Kapala, A.; Gulev, S. Improving Estimates of Heavy and Extreme Precipitation Using Daily Records from European Rain Gauges. J. Hydrometeorol. 2009, 10, 701–716. [Google Scholar] [CrossRef]
- Madsen, H.; Lawrence, D.; Lang, M.; Martinkova, M.; Kjeldsen, T.R. Review of trend analysis and climate change projections of extreme precipitation and floods in Europe. J. Hydrol. 2014, 519, 3634–3650. [Google Scholar] [CrossRef] [Green Version]
- Hosseinzadehtalaei, P.; Tabari, H.; Willems, P. Climate change impact on short-duration extreme precipitation and intensity–duration–frequency curves over Europe. J. Hydrol. 2020, 590, 125–249. [Google Scholar] [CrossRef]
- Zbigniew, K.W.; Radziejewski, M.; Pińskwar, I. Precipitation Extremes in the Changing Climate of Europe. Clim. Res. 2006, 31, 51–58. Available online: http://www.jstor.org/stable/24869262 (accessed on 20 February 2023).
- EUR-Lex, Access to European Union Law. Available online: https://eur-lex.europa.eu/eli/dir/2007/60/oj (accessed on 20 February 2023).
- Huizinga, J.; De Moel, H.; Szewczyk, W. Global Flood Depth-Damage Functions: Methodology and the Database with Guidelines; Publications Office of the European Union: Luxembourg, 2017. [Google Scholar] [CrossRef]
- Kundzewicz, Z.W.; Krysanova, V.; Benestad, R.E.; Hov, Ø.; Piniewski, M.; Otto, I.M. Uncertainty in climate change impacts on water resources. Environ. Sci. Policy 2018, 79, 1–8. [Google Scholar] [CrossRef]
- Hammond, M.J.; Chen, A.S.; Djordjevic, S.; Butler, D.; Khan, D.M.; Rahman, S.M.M.; Haque, A.K.E.; Mark, O. The development of a flood damage assessment tool for urban areas. In Proceedings of the 9th International Conference on Urban Drainage Modelling, Belgrade, Serbia, 3–6 September 2012. [Google Scholar]
Figure 1.
Larnaca city area of potential flooding area. The three different areas represent the different potential flood return periods.
Figure 1.
Larnaca city area of potential flooding area. The three different areas represent the different potential flood return periods.

Figure 2.
Residential building distribution in the spatial extent of the 500-year return period.

Figure 3.
Damage curve of residential buildings in the region in Larnaca city (a), Damage curve of Cyprus based on the GDP of 2021 (b).
Figure 3.
Damage curve of residential buildings in the region in Larnaca city (a), Damage curve of Cyprus based on the GDP of 2021 (b).


Table 1.
Total flood damage cost, based on the Larnaca residential database and Cyprus residential damage costs.
Table 1.
Total flood damage cost, based on the Larnaca residential database and Cyprus residential damage costs.
| Flood Damage Based on DDC of Larnaca | Flood Damage Based on DDC Data of Cyprus | |||||
|---|---|---|---|---|---|---|
| Return Period (yrs) | Structure EUR M | Content EUR M | Total EUR M | Structure EUR M | Content EUR M | Total EUR M |
| 500 | 21.7 | 10.89 | 32.6 | 46.1 | 23 | 69.2 |
| 100 | 11.2 | 5.6 | 16.8 | 18.5 | 9.2 | 27.7 |
| 20 | 9.1 | 4.6 | 13.7 | 0.32 | 0.16 | 0.48 |
Disclaimer/Publisher’s Note: The statements, opinions and data contained in all publications are solely those of the individual author(s) and contributor(s) and not of MDPI and/or the editor(s). MDPI and/or the editor(s) disclaim responsibility for any injury to people or property resulting from any ideas, methods, instructions or products referred to in the content. |
© 2023 by the authors. Licensee MDPI, Basel, Switzerland. This article is an open access article distributed under the terms and conditions of the Creative Commons Attribution (CC BY) license (https://creativecommons.org/licenses/by/4.0/).
Share and Cite
MDPI and ACS Style
Ćulibrk, A.; Tzoraki, O. Assessing the Economic Damage of Potential Flooding Zones by Combining Cadaster and Land Use Data in the Larnaca Region, Cyprus. Environ. Sci. Proc. 2023, 25, 76. https://doi.org/10.3390/ECWS-7-14323
AMA Style
Ćulibrk A, Tzoraki O. Assessing the Economic Damage of Potential Flooding Zones by Combining Cadaster and Land Use Data in the Larnaca Region, Cyprus. Environmental Sciences Proceedings. 2023; 25(1):76. https://doi.org/10.3390/ECWS-7-14323
Chicago/Turabian StyleĆulibrk, Alexandra, and Ourania Tzoraki. 2023. "Assessing the Economic Damage of Potential Flooding Zones by Combining Cadaster and Land Use Data in the Larnaca Region, Cyprus" Environmental Sciences Proceedings 25, no. 1: 76. https://doi.org/10.3390/ECWS-7-14323