Proceeding Paper

Air Pollution Derivatives Linked to Changes in Urban Mobility Patterns during COVID-19: The Cartagena Case Study †

by
Salvador García-Ayllón
Department of Mining and Civil Engineering, Technical University of Cartagena, Paseo Alfonso XIII, 52, 30203 Cartegena, Spain
Presented at the 4th International Electronic Conference on Environmental Research and Public Health–Climate Change and Health in a Broad Perspective, 15–30 October 2022; Available online: https://ecerph-4.sciforum.net/.
Environ. Sci. Proc. 2022, 24(1), 3; https://doi.org/10.3390/ECERPH-4-13108
Published: 27 October 2022

Abstract

:
The impact of the pandemic caused by COVID-19 on air pollution in our cities is a proven fact, although its mechanisms are not known in detail. The change in urban mobility patterns due to the restrictions imposed on the population during lockdown is a phenomenon that can be parameterized and studied from the perspective of spatial analysis. This study proposes an analysis of the guiding parameters of these changes from the perspective of spatial analysis. To do so, the case study of the city of Cartagena, a medium-sized city in Spain, has been analyzed throughout the period of mobility restrictions due to COVID-19. By means of a geostatistical analysis, changes in urban mobility patterns and the modal distribution of transport have been correlated with the evolution of environmental air quality indicators in the city. The results show that despite the positive effect of the pandemic in its beginnings on the environmental impact of urban mobility, the changes generated in the behavior patterns of current mobility users favor the most polluting modes of travel in cities.

1. Introduction

Air pollution in cities causes seven million premature deaths each year, with more than 400,000 in Europe alone [1,2]. In this context, transport accounts for 25% of greenhouse gases of the planet, with 70% of these gases produced by urban mobility in the form of cars, buses, vans, etc. [3,4]. Most experts agree that pollution from urban mobility is currently the greatest challenge in relation to the future of air quality in cities [5,6] and its analysis through the indicator PM 2.5 the most effective way for its investigation [7,8,9].
In the last two years, the pandemic caused by the SARS-CoV-2 virus has brought about a very profound change in our society’s way of life. One of the aspects on which the pandemic has had a greater impact was urban mobility, due to the restrictions imposed in many countries. This has caused a temporary transformation of mobility patterns in cities, the impact of which is only partially known. The first studies on the matter highlighted that, during the time of the greatest restrictions on mobility in cities, pollution levels fell by 50% in developed countries [10,11].
Nevertheless, these first figures are only part of the phenomenon, since the subsequent changes caused by the pandemic in the behavior patterns of urban mobility are not limited to the transitory impact of the initial reduction of polluting gases caused by people remaining at home due to lockdown. The capacity restrictions in public transport, the greater use of private vehicles because of the psychological effect of the possibility of contagion, or the change in the lifestyle habits of users throughout this past and present period have had effects that should also be analyzed from a broader perspective at the environmental level.
However, this issue is far from simple to analyze as it implies knowledge of the details of the COVID-19 pandemic’s impact in the areas related to the behavior patterns of urban mobility and application to the field of environmental impact. To address this, we have studied the urban mobility patterns in the city of Cartagena (southeast Spain) during the pandemic from the perspective of spatial statistical analysis. These patterns have been statistically correlated using geostatistical analysis tools to infer the evolution of the different environmental impacts caused by the pandemic.

2. Methodology

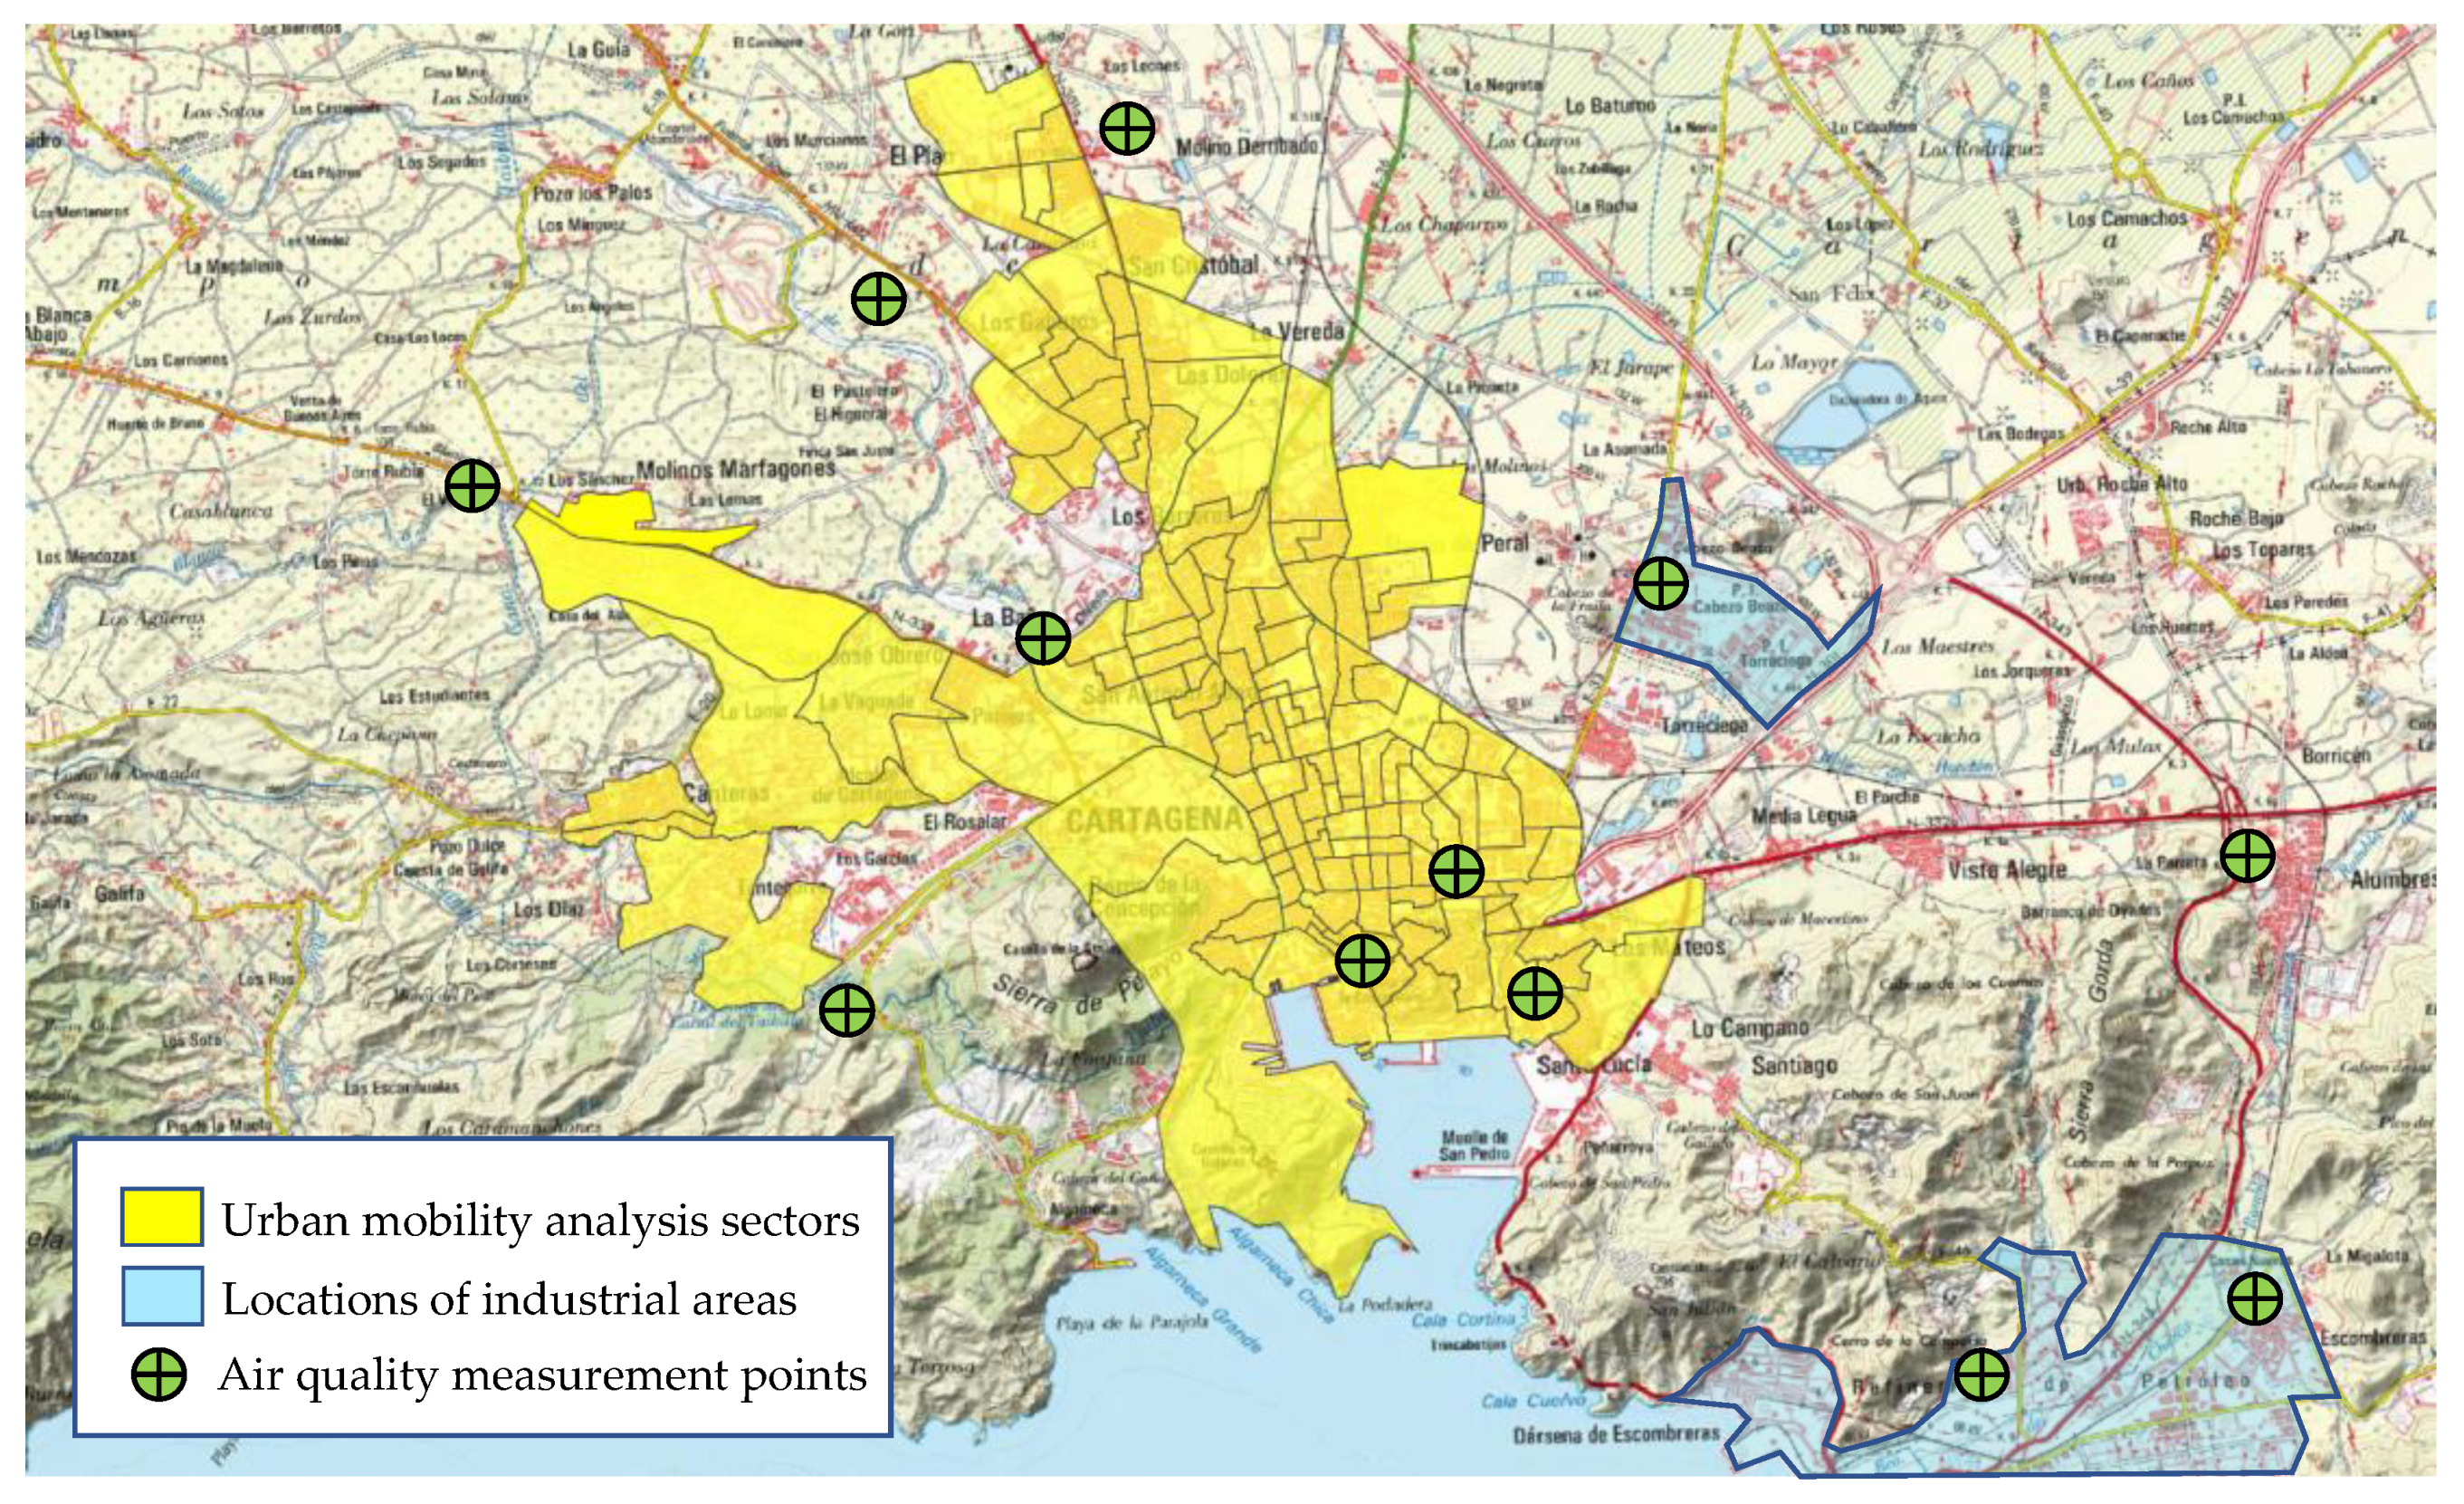
2.1. Area of Study and Data Source

The study area is located in Cartagena, a medium-sized city in the southeast of Spain. Assessment of this phenomenon in a city of this category is not a random decision. Cartagena is a city that, due to its size, allows access to a critical mass of data on key pertinent variables, thus enabling robust statistical analysis without having to address the difficulty of handling large numbers of variables and data that would surely be involved in the context of a similar analysis in major European or American capital cities [12]. The analysis focuses on the urban perimeter shown in Figure 1.

2.2. GIS Indicators of Urban Mobility Spatial Patterns and Environmental Impact Assessment

In the urban sectors generated in Figure 1, indicators related to the evolution of the different modal alternatives for urban mobility during the pandemic, as well as an indicator related to the air quality in the city, have been computed and spatially analyzed. The indicators used are described below.

2.2.1. Private Vehicle Use Density Index (PVUD)

This indicator assesses the evolution of the density of private vehicle use in a sector. Through the measurements and gauges of the City Council’s traffic control center in the different streets of the city, the level of traffic density in each of the sectors has been evaluated, comparing the existing values for the years 2019, 2020, and 2021, with this formula:
P V U D t 2 t 1 = n a i t 2 t 1 z d j t 2 t 1
with a i being the estimate of the number of daily trips in private vehicles in a sector during a period of time between t 1 and t 2 and d j the total set of z displacements produced in that sector between t 1 and t 2 .

2.2.2. Index of the Evolution of Public Transport Use (IPTU)

This indicator assesses the evolution of the density of public transport use in a sector. Through the measurements provided by the municipal public transport concession companies on the different lines and bus stops in the city, the level of density of public transport use in each of the sectors has been evaluated by comparing the existing values for the years 2019, 2020, and 2021. The indicator is formulated as follows:
I P T U t 2 t 1 = n b i t 2 t 1 z d j t 2 t 1
with b i being the estimate of the number of daily trips by public transport in a sector during a period of time between t 1 and t 2 and d j the total set of z displacements produced in that sector between t 1 and t 2 .

2.2.3. Healthy Mobility Density Index (HMD)

This indicator assesses the evolution of the density of use of mobility modalities classified as healthy (pedestrian movements and bicycle use) in a sector. By means of the data obtained from the surveys carried out through the municipal app, the level of density of use of these mobility modalities has been evaluated in each of the sectors, comparing the existing values for the years 2019, 2020, and 2021. The indicator is formulated as follows:
H M D t 2 t 1 = n c i t 2 t 1 z S j t 2 t 1
with c i being the estimate of the number of daily pedestrian or bicycle trips in a sector during a period of time between t 1 and t 2 and d j the total set of z displacements produced in that sector between t 1 and t 2 .

2.2.4. Evolution of Air Quality Index (EAQI)

In the urban area of Cartagena, twelve air quality measurement stations measure the Air Quality Index (AQI) parameters PM2.5, PM10, O3, NO2, and SO2. In this study, for the analysis of the air quality, the values of PM 2.5 have been taken as a reference for AQI. This parameter has been contrasted for the years 2019, 2020, and 2021 for a period of several days, to ensure that the readings were not merely due to weather phenomena, punctual pollution episodes, or anomalous measurements. Thus, an evolution indicator is established according to the following formula:
E A Q I t 2 t 1 = n A Q I i t 2 t 1 N
with A Q I i being the estimated AQI daily value for a sector during a period of time between t 1 and t 2 and N the total number of days measured between t 1 and t 2 . In this case, it would be the mean value of the PM2.5 parameter over a period of N days.

3. Results

The bivariate statistical correlation existing from a spatial point of view between the distribution pattern of each of the modal mobility indicators and the level of air quality have been analyzed using Anselin’s Local Moran’s I statistic (see Table 1). This analysis has been complemented in an aggregate way with a numerical OLS analysis and with a spatial analysis of hot spots with the Getis–Ord Gi * statistic to understand, in a two-dimensional way, the patterns of clustering behavior and the outliers of the existing relationship between the different modal alternatives for mobility and environmental pollution in the city (see Table 2 and Figure 2).
Based on the results, we can verify that there is a clear spatial correlation between the areas with the greatest increases in private vehicles and the areas of consolidation with a high level of environmental pollution. This is verified both at the numerical aggregate level in the analysis and in the spatial distribution of the behavior patterns of the modal alternatives linked to private vehicles (HH cases in Figure 2). We also note that the increase in walking and cycling due to the pandemic is not enough to compensate for the increase in the level of pollution derived from the decline of public transport in most sectors. In any case, as shown by the numerical analysis of the Akaike’s information criterion and the adjusted R2 value, the model behaves better in extreme situations (e.g., high or very low values of pollution levels in 2020) but is less reliable and robust in intermediate or transitional situations, such as in 2021, so these results cannot be taken as definitive.

4. Discussion and Conclusions

The results obtained reflect a more complex reality than that currently inferred on many occasions in relation to the effects of the pandemic in the context of urban mobility in cities, and consequently of the environmental impact of this phenomenon. It is evident that the general paralysis of economic activity, as a result of the inability of developed countries to cope with the spread of the SARS-CoV-2 virus during the first months after the declaration of the worldwide pandemic situation, led to a planet-wide reduction in greenhouse gas emissions, as confirmed by numerous studies [13].
In the case of transport, the reduction in its environmental impact has been prolonged over time in various sectors because of restrictions being maintained on international mobility between countries, as has happened, for example, in the sector of international aviation (which represents one of the most polluting means of transport). However, in the case of urban mobility, this analysis is more complex. The tougher restrictions on mobility in the initial phase of the pandemic led to a reduction in all trips in all modes of transport in cities, contributing to a global reduction in pollution in these areas, which usually represents a significant percentage (>70%) of all greenhouse gas emissions from transport. However, once this initial stage of confusion in the face of the virus that forced administrations to resort to more drastic measures had been overcome, the subsequent re-establishment of the usual activity of the cities has opened a new scenario that is possibly less favorable to the environment and human health.
In the case study presented in this work, maintaining certain mobility limitations, such as capacity restrictions in public transport, has led to an inevitable loss of modal share in the distribution of urban mobility alternatives, assuming a clear decrease in several of the most efficient alternatives at an environmental level. On the other hand, an increase in the use of private vehicles in municipal gauges once restrictions on mobility were relaxed has been found in the city of Cartagena. This growth is partially fueled by those users who have abandoned public transport due to the capacity restrictions imposed in this modality, but also by the changes in the behavioral habits of the users because of the psychological effect generated by the risk of contagion of the virus.
This therefore reflects a dual situation in which, after an initial phase of general reduction in mobility and thus its environmental impacts, the effects of the pandemic did not result in a reduction in greenhouse gases, but rather a change in the behavioral patterns of urban mobility that favors a trend of higher environmental impact (but still not higher in total numbers) than the one that existed before the pandemic.

Funding

This research received no external funding.

Institutional Review Board Statement

Not applicable.

Informed Consent Statement

Not applicable.

Data Availability Statement

Not applicable.

Acknowledgments

The authors acknowledge the collaboration and the data provided by the local authorities of the city of Cartagena to carry out this research.

Conflicts of Interest

The authors declare no conflict of interest.

References

  1. Zhang, H.; Ji, Y.; Wu, Z.; Peng, L.; Bao, J.; Peng, Z.; Li, H. Atmospheric volatile halogenated hydrocarbons in air pollution episodes in an urban area of Beijing: Characterization, health risk assessment and sources apportionment. Sci. Total Environ. 2022, 806, 150283. [Google Scholar] [CrossRef] [PubMed]
  2. Renzi, M.; Marchetti, S.; de’Donato, F.; Pappagallo, M.; Scortichini, M.; Davoli, M.; Frova, L.; Michelozzi, P.; Stafoggia, M. Acute Effects of Particulate Matter on All-Cause Mortality in Urban, Rural, and Suburban Areas, Italy. Int. J. Environ. Res. Public Health 2021, 18, 12895. [Google Scholar] [CrossRef] [PubMed]
  3. Gustafsson, M.; Svensson, N.; Eklund, M.; Dahl Öberg, J.; Vehabovic, A. Well-to-wheel greenhouse gas emissions of heavy-duty transports: Influence of electricity carbon intensity. Transp. Res. Part D Transp. Environ. 2021, 93, 102757. [Google Scholar] [CrossRef]
  4. Deenapanray, P.N.K.; Khadun, N.A. Land transport greenhouse gas mitigation scenarios for Mauritius based on modelling transport demand. Transp. Res. Interdiscip. Perspect. 2021, 9, 100299. [Google Scholar] [CrossRef]
  5. Guo, L.; Luo, J.; Yuan, M.; Huang, Y.; Shen, H.; Li, T. The influence of urban planning factors on PM2.5 pollution exposure and implications: A case study in China based on remote sensing, LBS, and GIS data. Sci. Total Environ. 2019, 659, 1585–1596. [Google Scholar] [CrossRef] [PubMed]
  6. Castells-Quintana, D.; Dienesch, E.; Krause, M. Air pollution in an urban world: A global view on density, cities and emissions. Ecol. Econ. 2021, 189, 107153. [Google Scholar] [CrossRef]
  7. Bächler, P.; Müller, T.K.; Warth, T.; Yildiz, T.; Dittler, A. Impact of ambient air filters on PM concentration levels at an urban traffic hotspot (Stuttgart, Am Neckartor). Atmos. Pollut. Res. 2021, 12, 101059. [Google Scholar] [CrossRef]
  8. Meng, M.-R.; Cao, S.-J.; Kumar, P.; Tang, X.; Feng, Z. Spatial distribution characteristics of PM2.5 concentration around residential buildings in urban traffic-intensive areas: From the perspectives of health and safety. Saf. Sci. 2021, 141, 105318. [Google Scholar] [CrossRef]
  9. Fachinger, F.; Drewnick, F.; Borrmann, S. How villages contribute to their local air quality—The influence of traffic- and biomass combustion-related emissions assessed by mobile mappings of PM and its components. Atmos. Environ. 2021, 263, 118648. [Google Scholar] [CrossRef]
  10. Kazancoglu, Y.; Ozbiltekin-Pala, M.; Ozkan-Ozen, Y.D. Prediction and evaluation of greenhouse gas emissions for sustainable road transport within Europe. Sustain. Cities Soc. 2021, 70, 102924. [Google Scholar] [CrossRef]
  11. Quintyne, K.I.; Kelly, C.; Sheridan, A.; Kenny, P.; O’Dwyer, M. COVID-19 transport restrictions in Ireland: Impact on air quality and respiratory hospital admissions. Public Health 2021, 198, 156–160. [Google Scholar] [CrossRef] [PubMed]
  12. Garcia-Ayllon, S.; Hontoria, E.; Munier, N. The Contribution of MCDM to SUMP: The Case of Spanish Cities during 2006–2021. Int. J. Environ. Res. Public Health 2022, 19, 294. [Google Scholar]
  13. Singh, V.; Mishra, V. Environmental impacts of coronavirus disease 2019 (COVID-19). Bioresour. Technol. Rep. 2021, 15, 100744. [Google Scholar] [CrossRef] [PubMed]
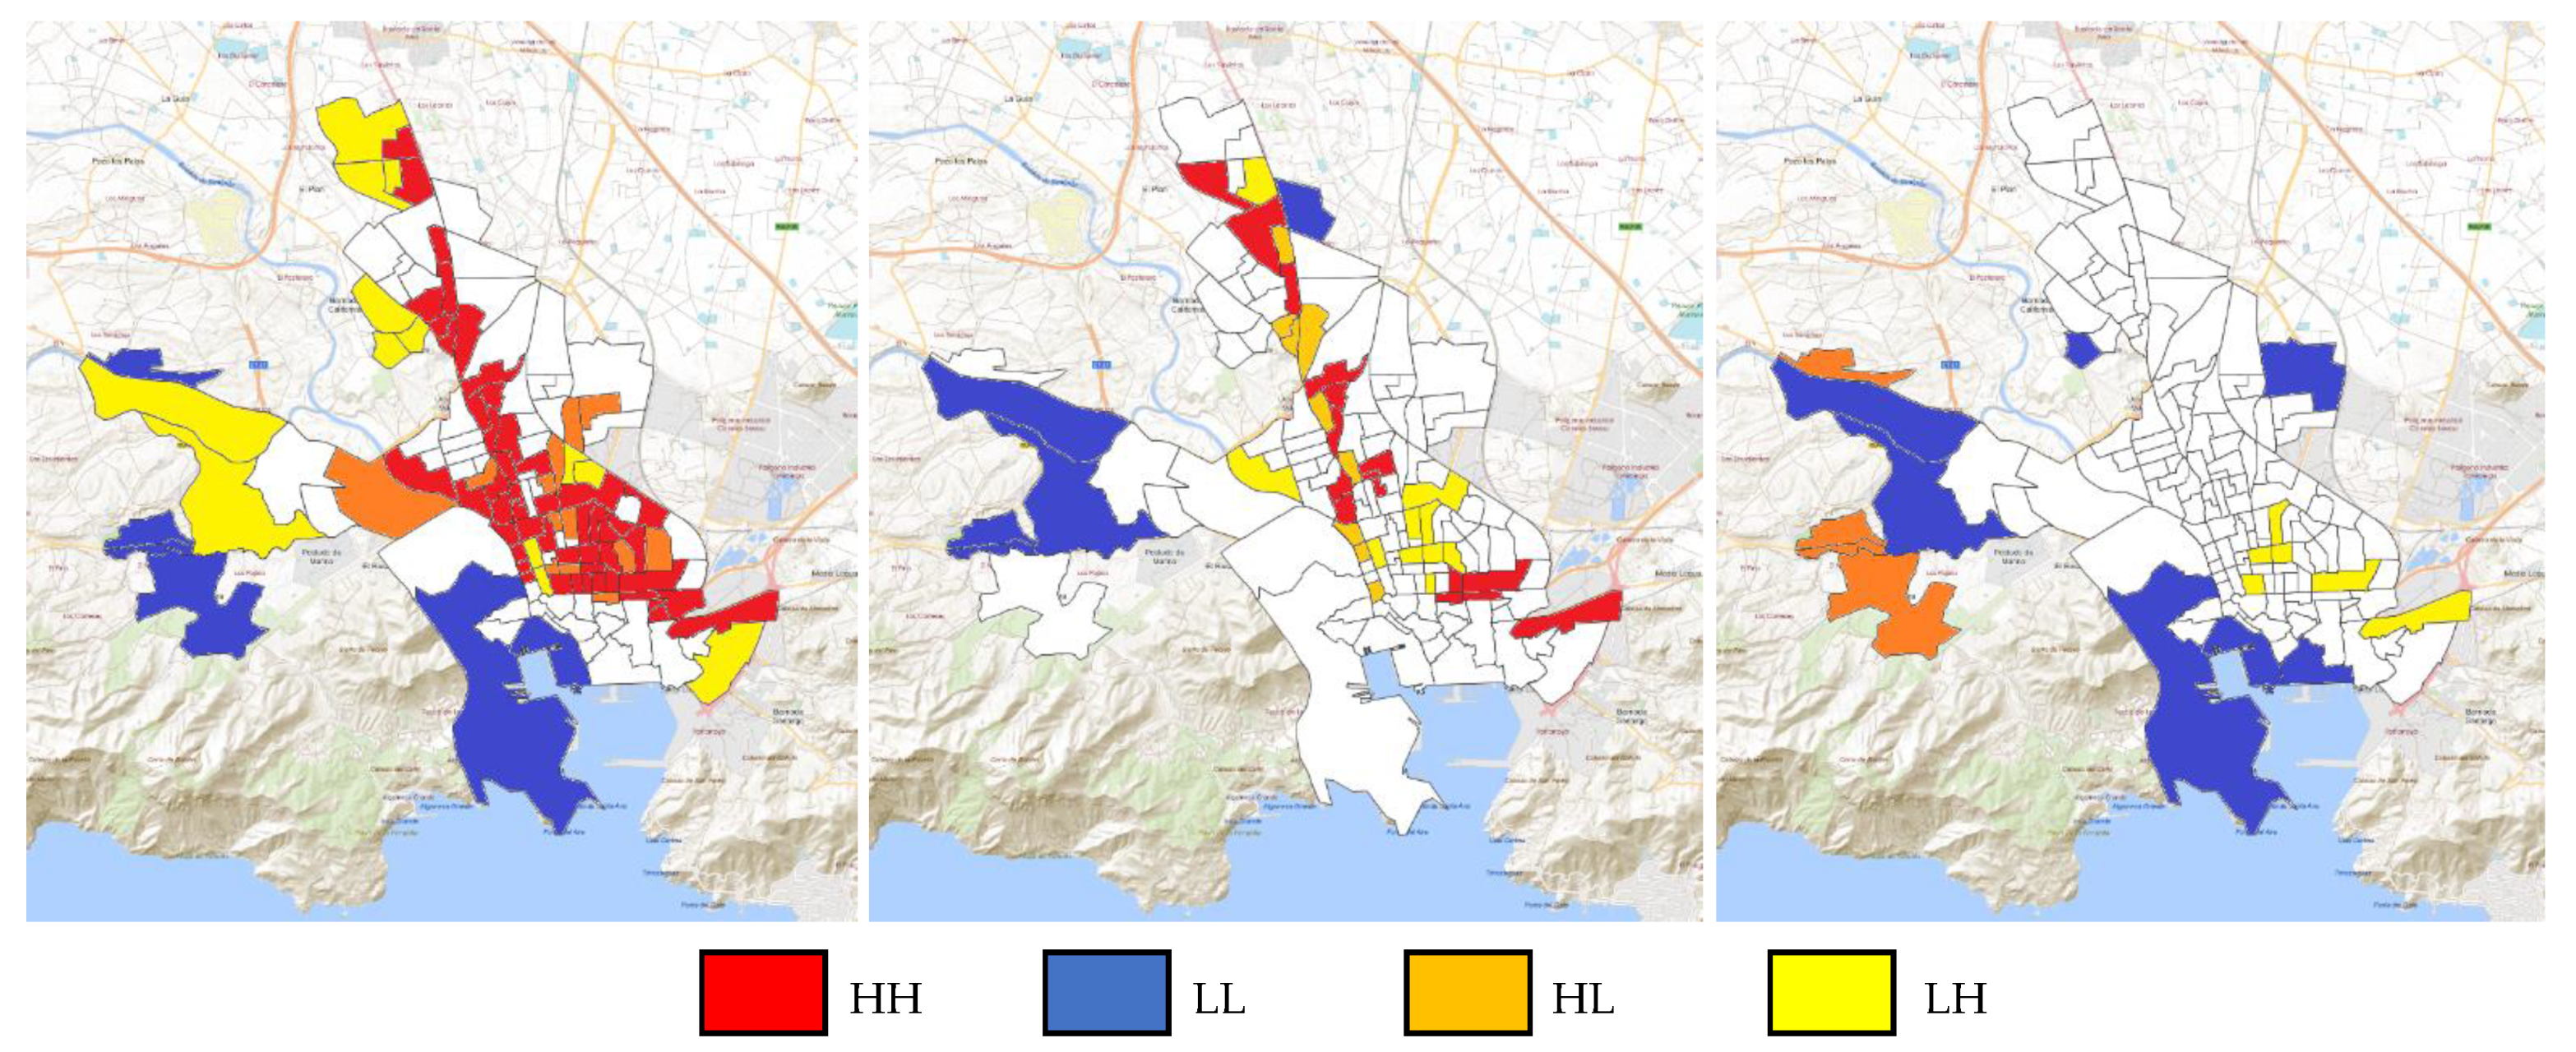
Figure 1. Air quality measurement points and division of the city of Cartagena into sectors for analysis.
Environsciproc 24 00003 g001
Figure 2. Current trend of LISA hot spots maps between mobility indicators and AQI for March and April 2021 (case order: PVUD-EAQI/IPTU-EAQI/HMD-EAQI).
Environsciproc 24 00003 g002
Table 1. Bivariate Global Moran’s I statistics for spatial correlation between mobility indicators and EQI index (data order: 2019/2020/2021).
GIS IndicatorsPUVD—EAQIIPTU—EAQIHMD—EAQI
Bivariate Global Moran’s I
Global Moran’s Index0.59/0.66/0.650.61/0.71/0.750.60/0.71/0.18
z-score55.2/68.7/70.137.0/44.6/43.538.8/60.2/15.5
p-value0.01/0.01/0.010.01/0.01/0.010.01/0.01/0.01
Table 2. Detailed multiple regression models (OLS) for LISA bidimensional analysis of the different levels of air quality index.
Mobility IndicatorsLow EAQI Values (<10)Low—Intermediate EAQI Values (11–25)
BStd. ErrortSign.BStd. ErrortSign.
P U V D   −0.2650.003−1.4540.000 *−0.1960.005−2.3160.000 *
I P T U   0.0670.0041.2550.000 *0.2600.0055.5210.000 *
  H D M   0.2490.0032.2860.000 *0.1170.0063.0900.000 *
Akaike’s information criterion (AIC): 25,287.6AIC: 20,180.9
Multiple R-squared: 0.43Multiple R-squared: 0.18
Adjusted R-squared: 0.42Adjusted R-squared: 0.17
F-statistic: 70.78 Prob (>F) (3,3) degrees of freedom: 0F-statistic: 126.32 Prob (>F) (3,3) DF: 0
Mobility indicatorsIntermediate—High EAQI values (26–40)High values EAQI values (>40)
BStd. errortSign.BStd. ErrortSign.
  P U V D   0.1760.0051.2180.000 *0.3370.0043.1200.000 *
  I P T U 0.1070.0062.1440.000 *−0.0530.003−4.6310.000 *
H D M   −0.1270.003−4.7130.000 *−0.3010.007−5.3550.000 *
Akaike’s information criterion (AIC): 19,573.0AIC: 24,745.6
Multiple R-squared: 0.19Multiple R-squared: 0.41
Adjusted R-squared: 0.18Adjusted R-squared: 0.41
F-statistic: 148.55 Prob (>F) (3,3) degrees of freedom: 0F-statistic: 66.71 Prob (>F) (3,3) DF: 0
* Significant at the 0.01 level.
Publisher’s Note: MDPI stays neutral with regard to jurisdictional claims in published maps and institutional affiliations.

