Technical Note

Application of the RAPS Method for Determining the Dependence of Nitrate Concentration in Groundwater on the Amount of Precipitation

1
Center for Advanced Computing and Modelling, University of Rijeka, Radmile Matejčić 2, 51000 Rijeka, Croatia
2
Department of Civil Engineering, University North, 42000 Varaždin, Croatia
3
Faculty of Civil Engineering, Architecture and Geodesy, University of Mostar, Matice Hrvatske b., 88000 Mostar, Bosnia and Herzegovina
4
Centre for Climate Change & Water Research, Suresh Gyan Vihar University, Jaipur 302017, India
*
Author to whom correspondence should be addressed.
Earth 2023, 4(2), 266-277; https://doi.org/10.3390/earth4020014
Submission received: 6 March 2023 / Revised: 30 March 2023 / Accepted: 4 April 2023 / Published: 6 April 2023

Abstract

:
Protecting groundwater from contamination is today’s most current environmental protection topic. What can man do in his environment to reduce the harmful impact of contamination on the environment, and thus the immediate effect on groundwater? Agricultural production is an ongoing source of groundwater contamination due to the increasingly frequent use of nitrates in fertilizers, which are washed out from the soil into groundwater due to precipitation. This paper investigates three wellfields in the north of the Republic of Croatia near the town of Varaždin. With the application of the RAPS method, the dependence of nitrate concentration in groundwater on the amount of precipitation was established. The analysis results show the connection of the observed parameters, especially in the upper aquifer layer. In this layer, the coefficients of correlation are greater than 0.80 at all locations, which shows a strong positive connection between the parameters. In the lower aquifer, the values of the coefficients of correlation are lower, and the results mostly indicate a weak correlation. The obtained results will serve as a starting point for future studies, which will aim to precisely determine the factors that influence groundwater quality in the observed area.

1. Introduction

A high-quality water supply is one of the necessary prerequisites for sustainable development. Still, in the last few decades, due to increasingly intense anthropogenic influences, there has been a significant strain on the water supply system. Agricultural production is recognized worldwide as one of the primary sources of groundwater contamination, primarily due to nitrates, an important component of mineral fertilizers. Plant growth, development, and stable yields are only possible with sufficient nitrogen. However, the nitrates that the plant does not receive are easily and quickly washed out from the soil into the groundwater by rainwater. Nitrates introduced into the soil with mineral or organic fertilizers are easily soluble; they do not bind to the colloidal complex of the soil and can be washed into the surface or groundwater. Under favorable conditions, nitrates in groundwater can be accumulated for an extended period and transported over long distances, thereby risking the contamination of intake structures.
Over the past years, when the negative impacts of industrial and agricultural development and urban areas on the environment have been increasingly apparent, groundwater quality and its changes in space and time have become the subject of numerous scientific investigations. Madison and Brunett (1985), in a study on nitrates in groundwater, determined indicative limits of nitrate concentrations in groundwater based on which it is possible to identify anthropogenic influence [1]. The results of the study show that nitrate concentrations less than 1 mg/L NO3 can be attributed to natural nitrates in the aquifer, concentrations in the interval 1–13 mg/L NO3 mark the transitional area, i.e., concentrations that may or may not indicate anthropogenic influence; and nitrate concentrations above 13 mg/L NO3 prove anthropogenic influence. Addiscott et al. (1991) monitored the increase in nitrate concentration over time on a global scale. They concluded that the increase in nitrate concentration positively correlates with the increase in agricultural production [2]. A high concentration of nitrates in groundwater originating from agriculture is also reported by Obeidat et al. (2007), who stated that because nitrates are highly mobile and present in agricultural and industrial waste as well as household waste, they can be considered to be an indicator of groundwater contamination [3]. Nemčić-Jurec et al. (2007) indicated the impact of agriculture as a diffuse and point source of contamination with drinking water nitrates in northwestern Croatia [4]. Three different locations were investigated for potential contamination. At a place where no contamination was expected, which was used as a control group, a low nitrate concentration of 4.6 mg/L NO3 was found. In the other two locations, an area of intensive agriculture and a suburban area, it was shown that the concentration of nitrates was statistically significantly different and amounted to 28.7 and 26.5 mg/L NO3, which indicates that the application of mineral and organic fertilizers and sewage are primary in sources of contamination. Recent research shows that a regression analysis of aggregated data can efficiently estimate an average contribution of point and diffuse contamination sources to the nitrate concentration in the groundwater at Varaždin wellfield [5]. In recent times, numerical models are often used to manage water resources. Šrajbek et al. (2022), using numerical simulations, located and quantified the sources of nitrate contamination in the influential area of the Varaždin wellfield, which was put into a state of rest due to the constant high concentration of nitrates [6].
The research area in this paper includes three wellfields located in the area of very intensive agricultural production. Earlier research has shown that agricultural production near the wellfields has a negative effect on groundwater quality, primarily by increasing the concentration of nitrates. As nitrates are washed out of the soil by precipitation and transported into the groundwater, this work aims to establish the connection between the concentration of nitrates in the groundwater at the observed wellfields and the amount of precipitation. Of course, groundwater quality depends on many factors, such as geology and soil properties, relief, and slopes determining surface runoff and seepage. Additionally, it depends on the quality of precipitation, sediments in the ground, and the duration of contact between the water and the rock. Given the above, it is clear that this question is extremely complex, and it demands detailed field and laboratory research. As such researches are very often long and expensive, the goal of this paper is to determine a connection between two basic parameters, namely, the amount of precipitation and the concentration of nitrates in groundwater. The results will serve as a basis for further research.

2. Materials and Methods
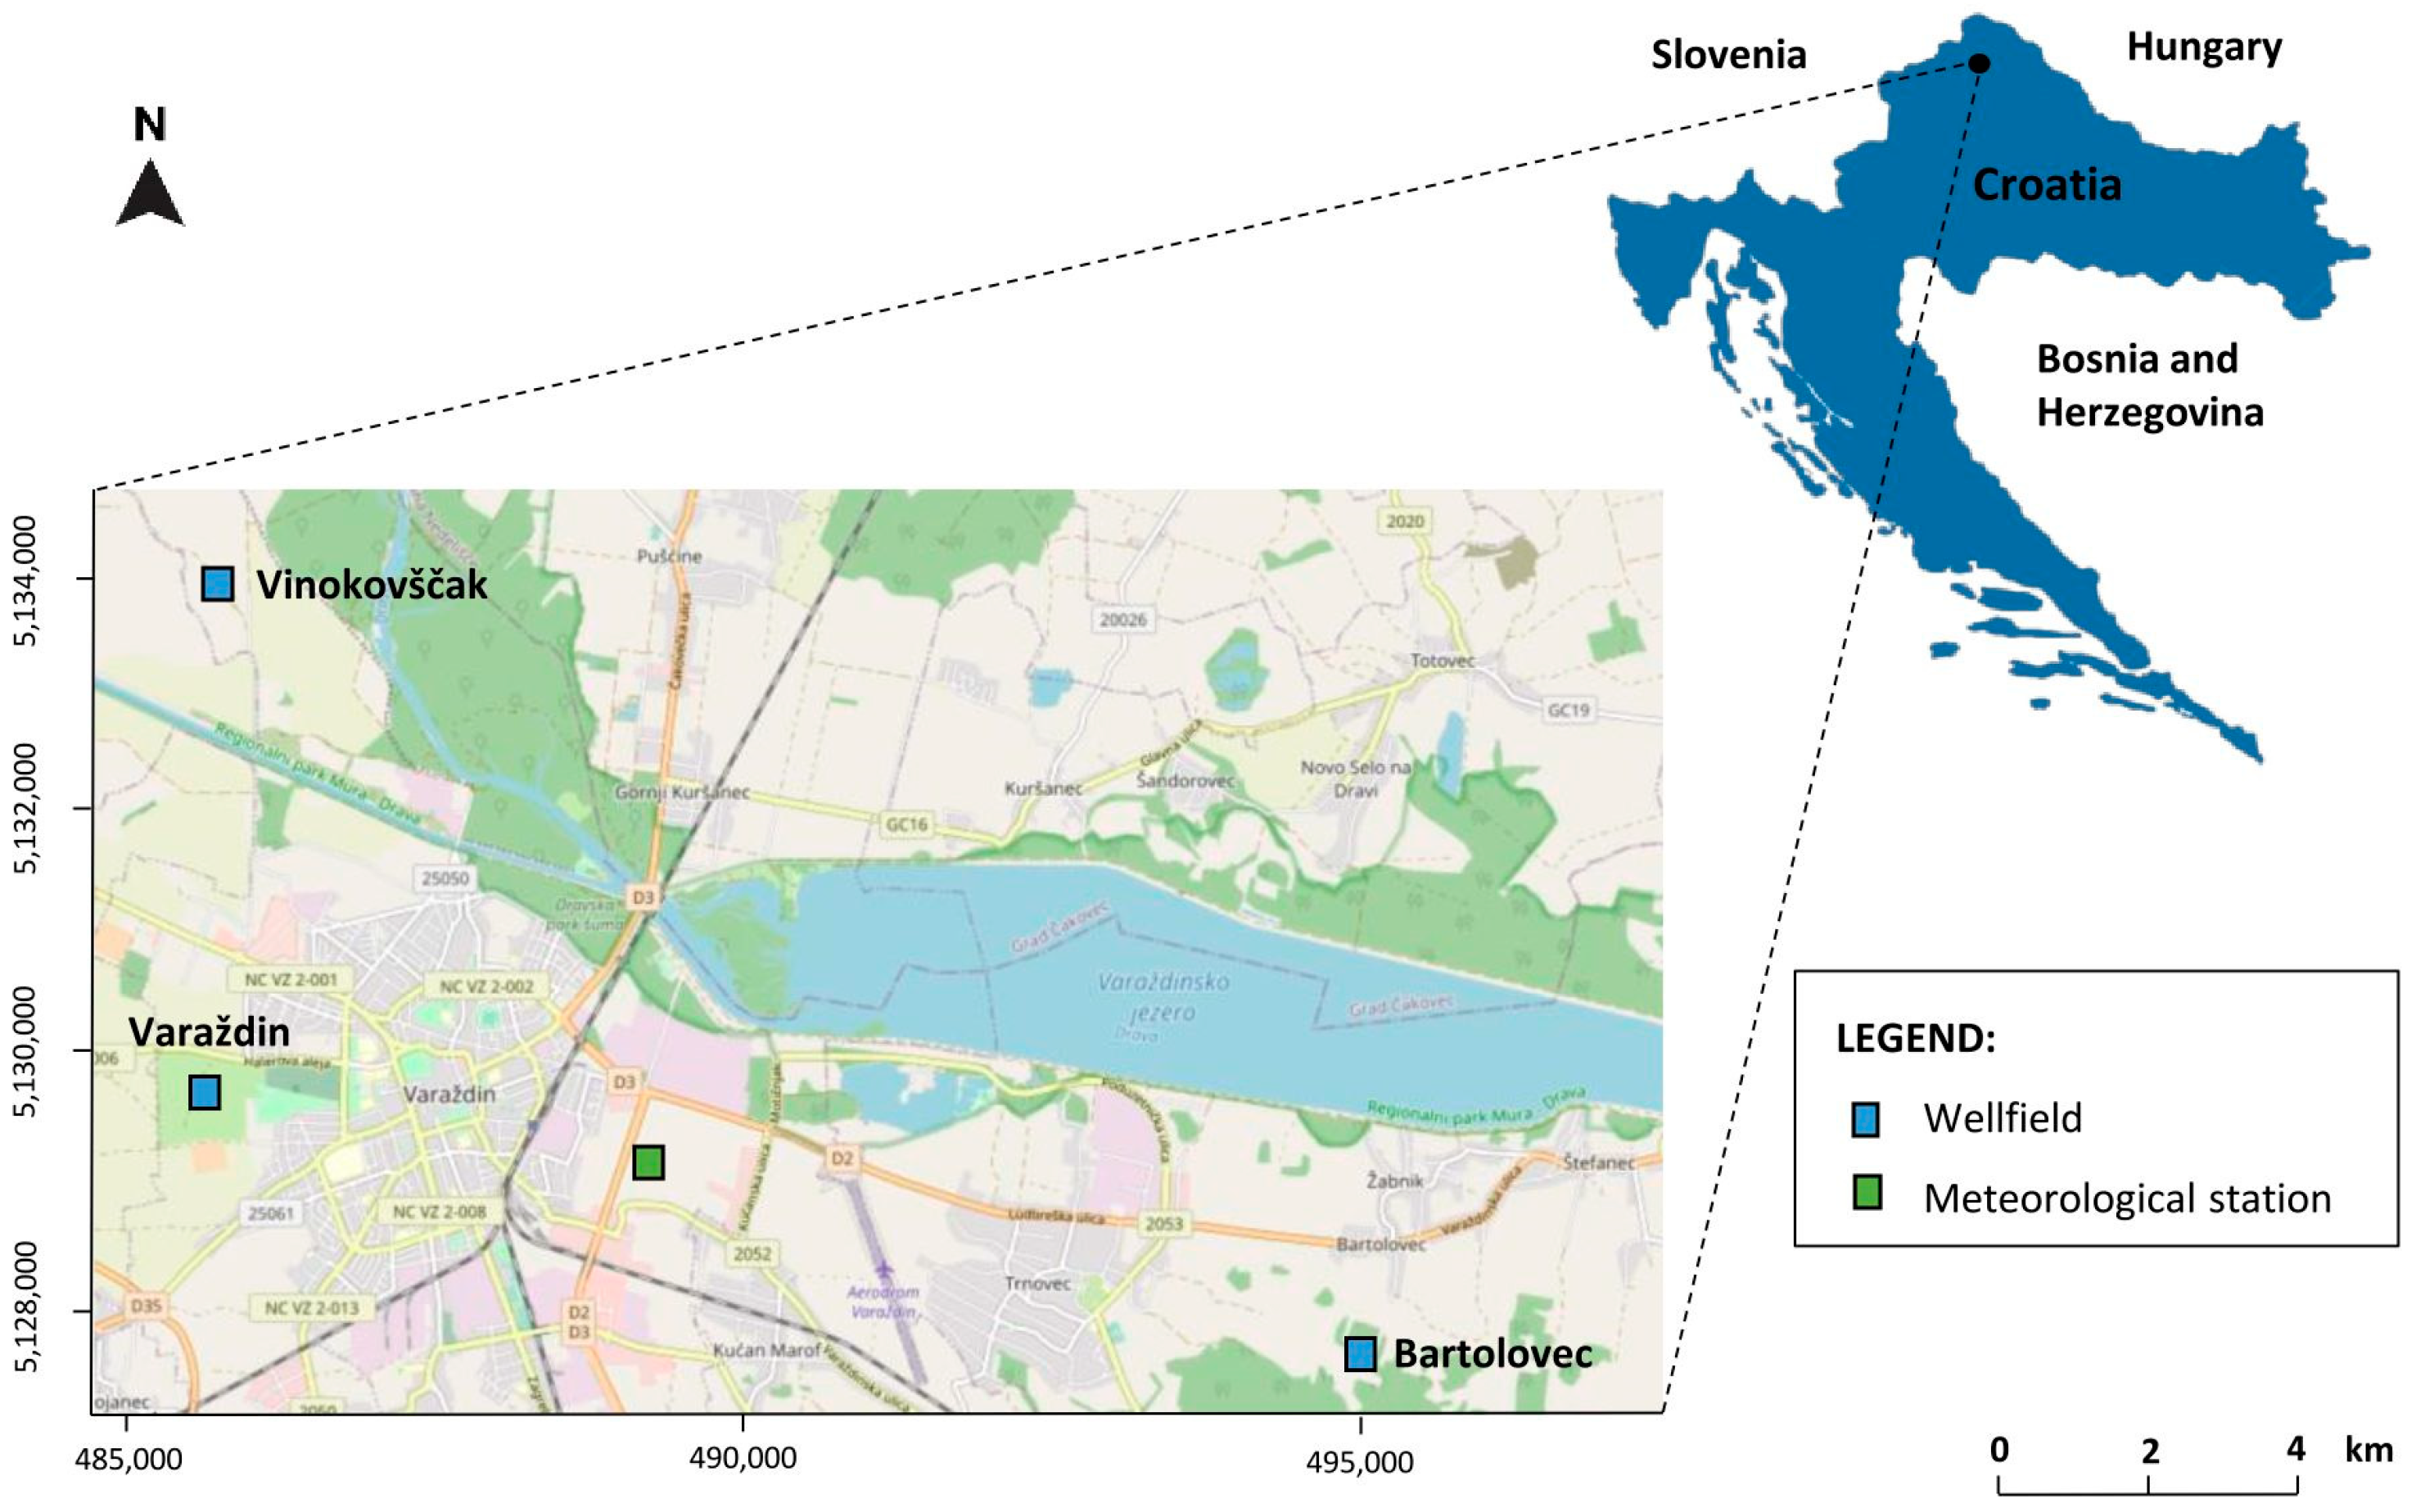
2.1. Research Area

The research area is located in the north of the Republic of Croatia and includes the space of three wellfields in the vicinity of the town of Varaždin (Figure 1). The groundwater quality is good, and the quality parameters are generally uniform at all observed wellfields, except for the concentration of nitrates, which varies significantly in time and space. Earlier research has shown that groundwater quality in the lower aquifer is considerably higher than in the upper aquifer [7,8] (Table 1). In addition, a statistically significant difference in nitrate concentration in aquifers at the observed wellfields was found [9]. In the regional water supply network, nitrate concentration was reduced by increasing pumping at wellfields where the values were below the minimum allowed concentration [10]. Due to the constantly high concentration of nitrates, the Varaždin wellfield has not been in operation since 2004.

2.2. Geological and Hydrogeological Conditions of the Varaždin Aquifer

The geological structures consist of coarse-grained sediments of gravel and sand (middle and upper Pliocene age), whereas the underlying deposits are composed of silt and clay (upper Miocene age) [11].
The flow direction in the aquifer is parallel to the course of the Drava River, and its thickness increases from the west to the east. At the far west end, the thickness is 5 m, whereas in the town of Varaždin, it is about 75 m. In the eastern part, the thickness of the aquifer increases to its maximum value of 148 m and then decreases gradually. The aquifer is composed of two permeable gravel and sand layers divided mainly by a semipermeable silty and clay aquitard [12] (Figure 2). The aquifer’s upper layer is formed of coarse-grained gravel and sand, whereas the lower part is mainly finer-grained gravel with sand. The groundwater flow is in the west-east direction, parallel to the Drava river.
The hydraulic conductivity values change slightly in the plan from 100 to 300 m/day, so it is higher in the west and lower in the east, resulting from the size drop of the granulometric fractions in the west–east direction. At the location of the Varaždin wellfield, the hydraulic conductivity values were measured to be in the range of 185–241 m/day for the upper and 92.6 m/day for the lower layer [13].

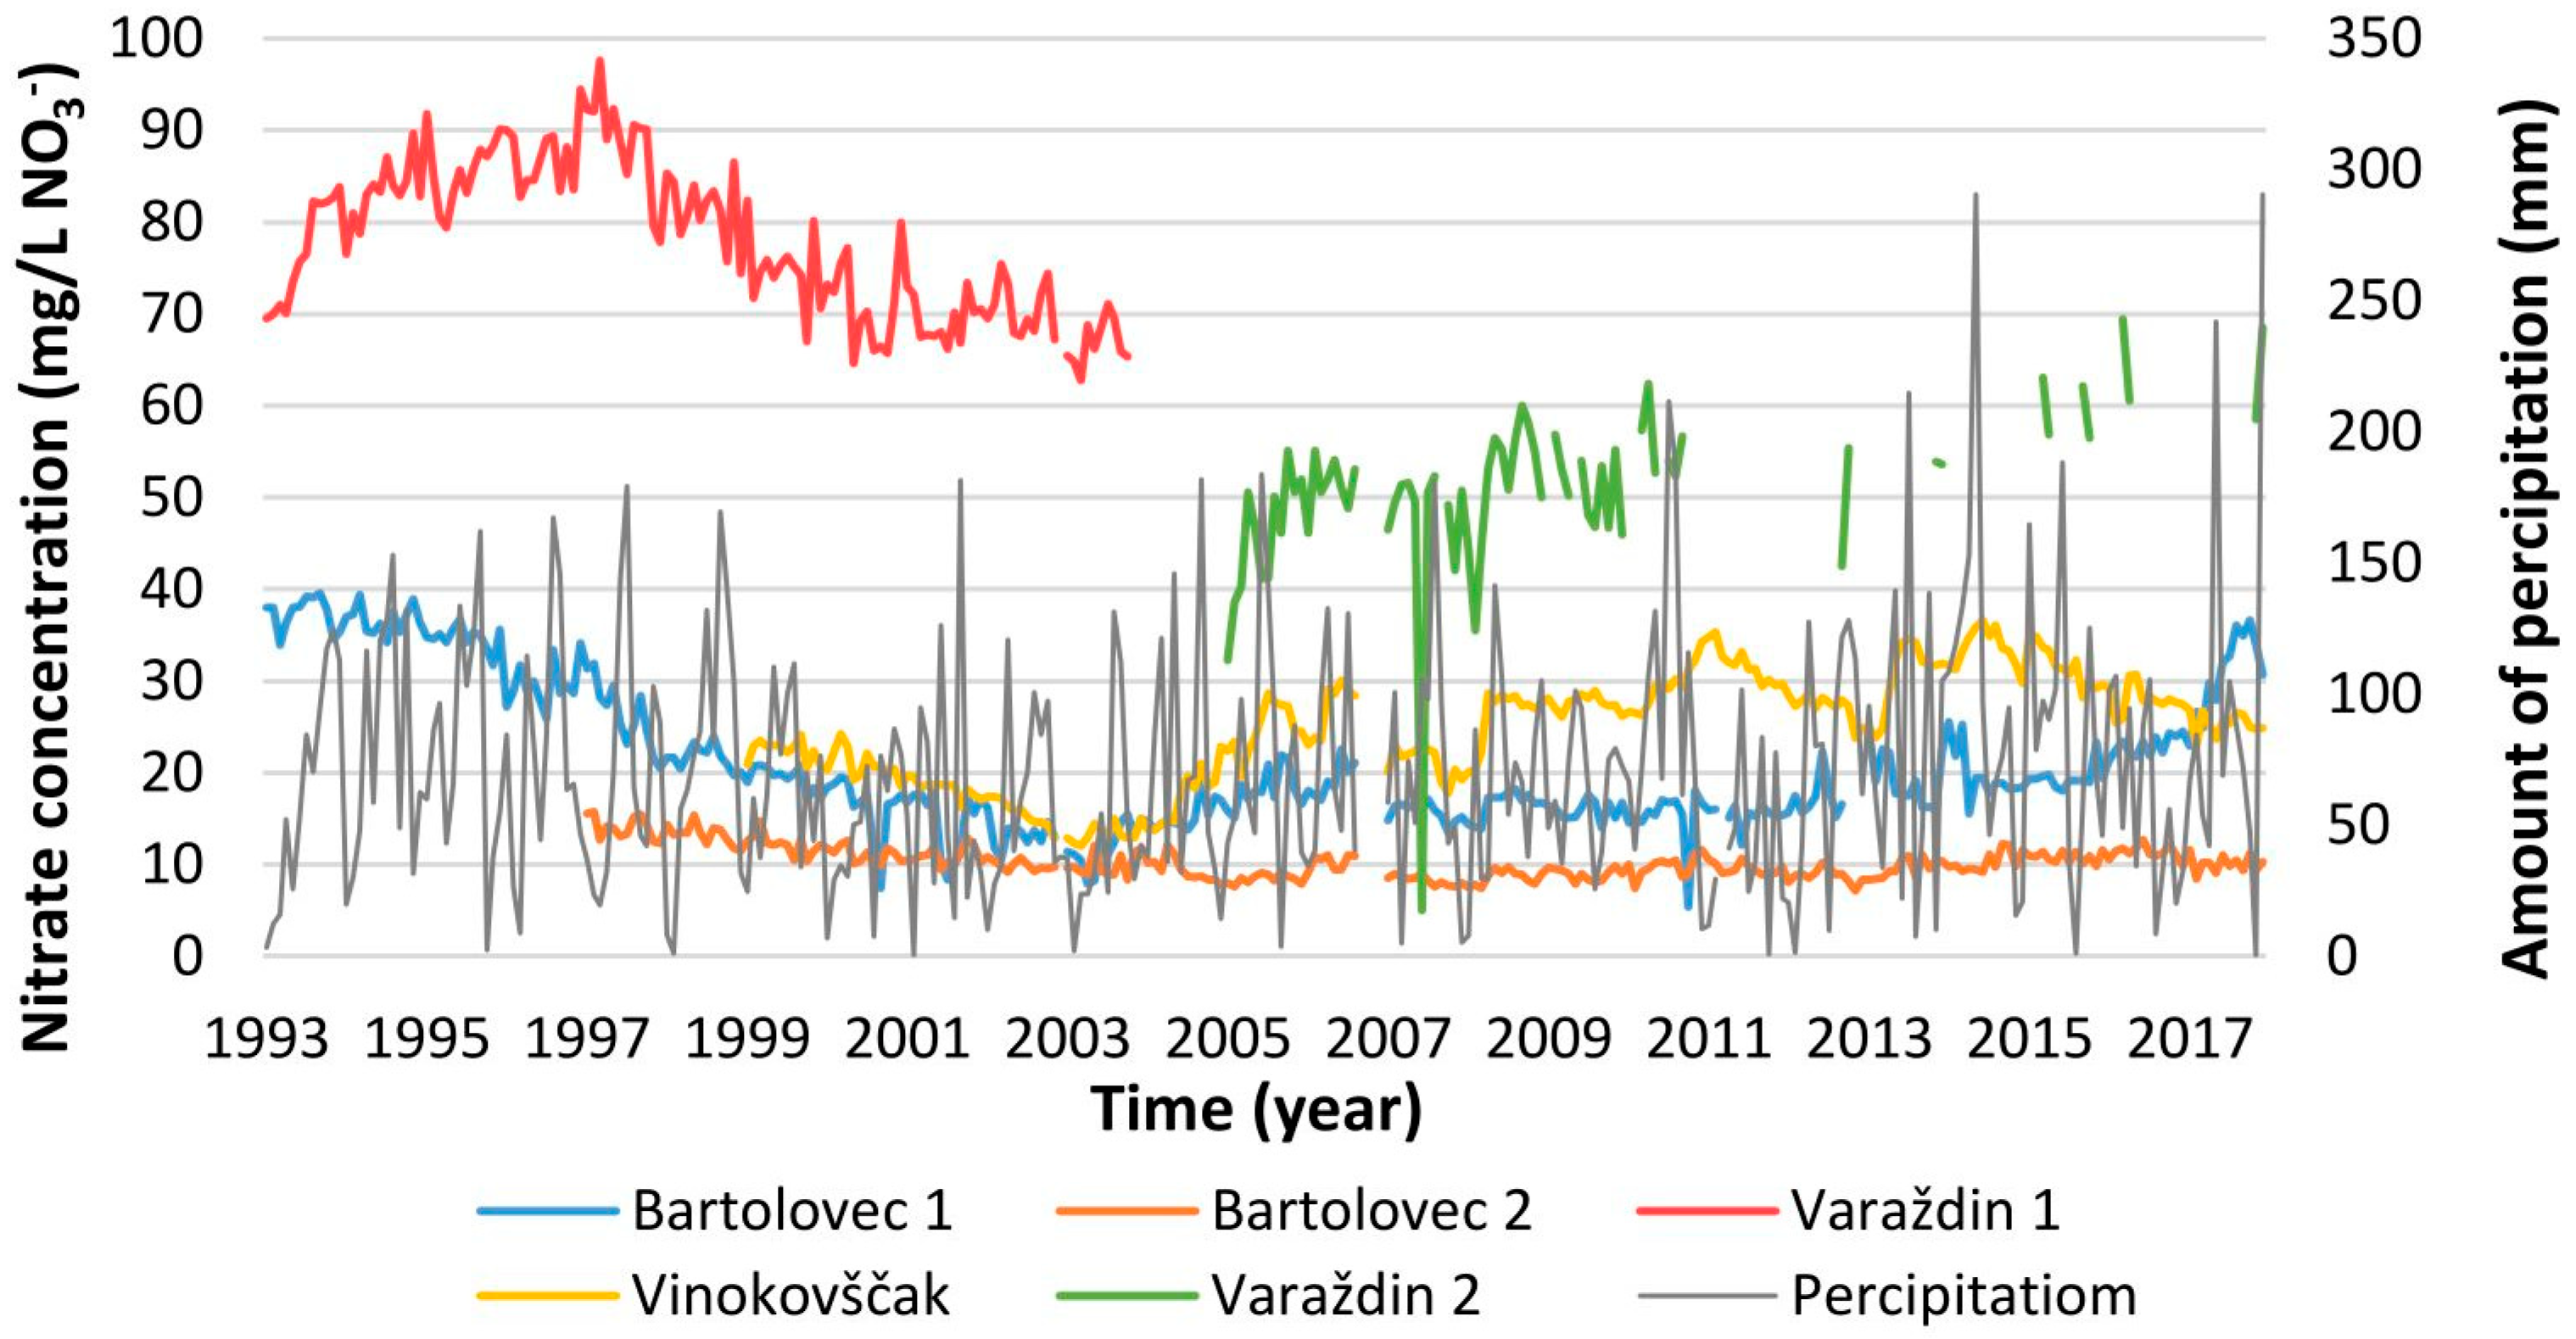
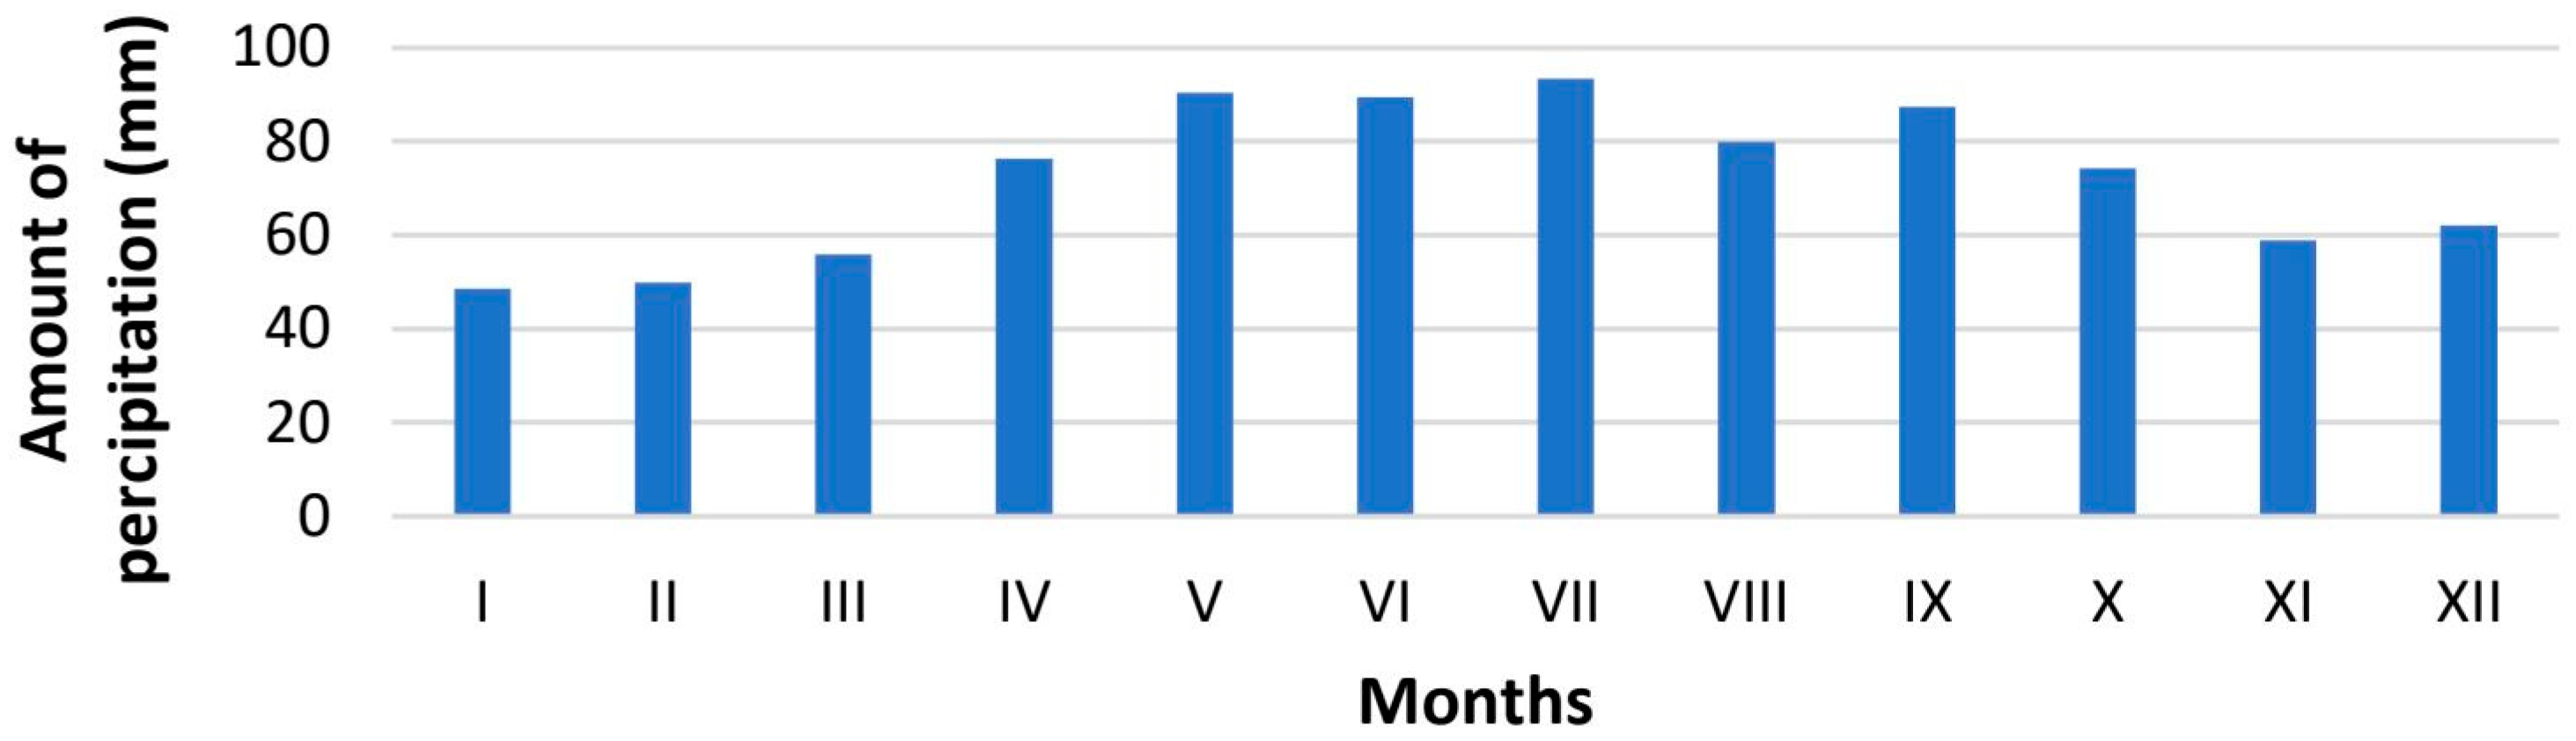
2.3. Experimental Data

Groundwater at all three observed wellfields is drawn from the same alluvial aquifer from the upper and lower aquifers. As prescribed by the current ordinance [14], water was sampled at least once a week in active wells from 1993 to 2017. In the observed period, four wells from the upper and four from the lower aquifer were active at the Bartolovec wellfield. Eight wells from the upper and one well from the lower aquifer were active at the Varaždin wellfield. In comparison, three wells were active at the Vinokovščak wellfield, which, due to the wedging out of the poorly permeable layer at that location, captured water from a single aquifer.
Based on the chemical analysis of the groundwater quality at the three observed water wellfields, databases were formed, and further studies were conducted based on those databases. As water is pumped separately from both aquifers at the Bartolovec and Varaždin wellfields, analyses were carried out separately for each layer at these wellfields. The results related to the upper aquifer are labeled Bartolovec 1 and Varaždin 1, and the results related to the lower aquifer are marked Bartolovec 2 and Varaždin 2. At the Vinokovščak wellfield, the poorly permeable clay layer that divides the aquifer into two parts wedges out, and there is a unique aquifer layer at that location.
Based on the results of nitrate concentration measurements at all wells, at all three observed wellfields, in both aquifers separately, average monthly values of nitrate concentration in the period from 1993 to 2017 were calculated. Additionally, based on the daily results of measuring the amount of precipitation in the same period, the monthly precipitation amounts were calculated (Figure 3).
Monthly amounts of precipitation represent the optimal time measure because they include the entire annual course of precipitation amounts. Therefore, the basic characteristic of the yearly revolution of monthly precipitation amounts in the observed area is a maximum in July, whereas the minor monthly precipitation amounts fall in January and February, which is a characteristic of the continental precipitation regime (Figure 4).

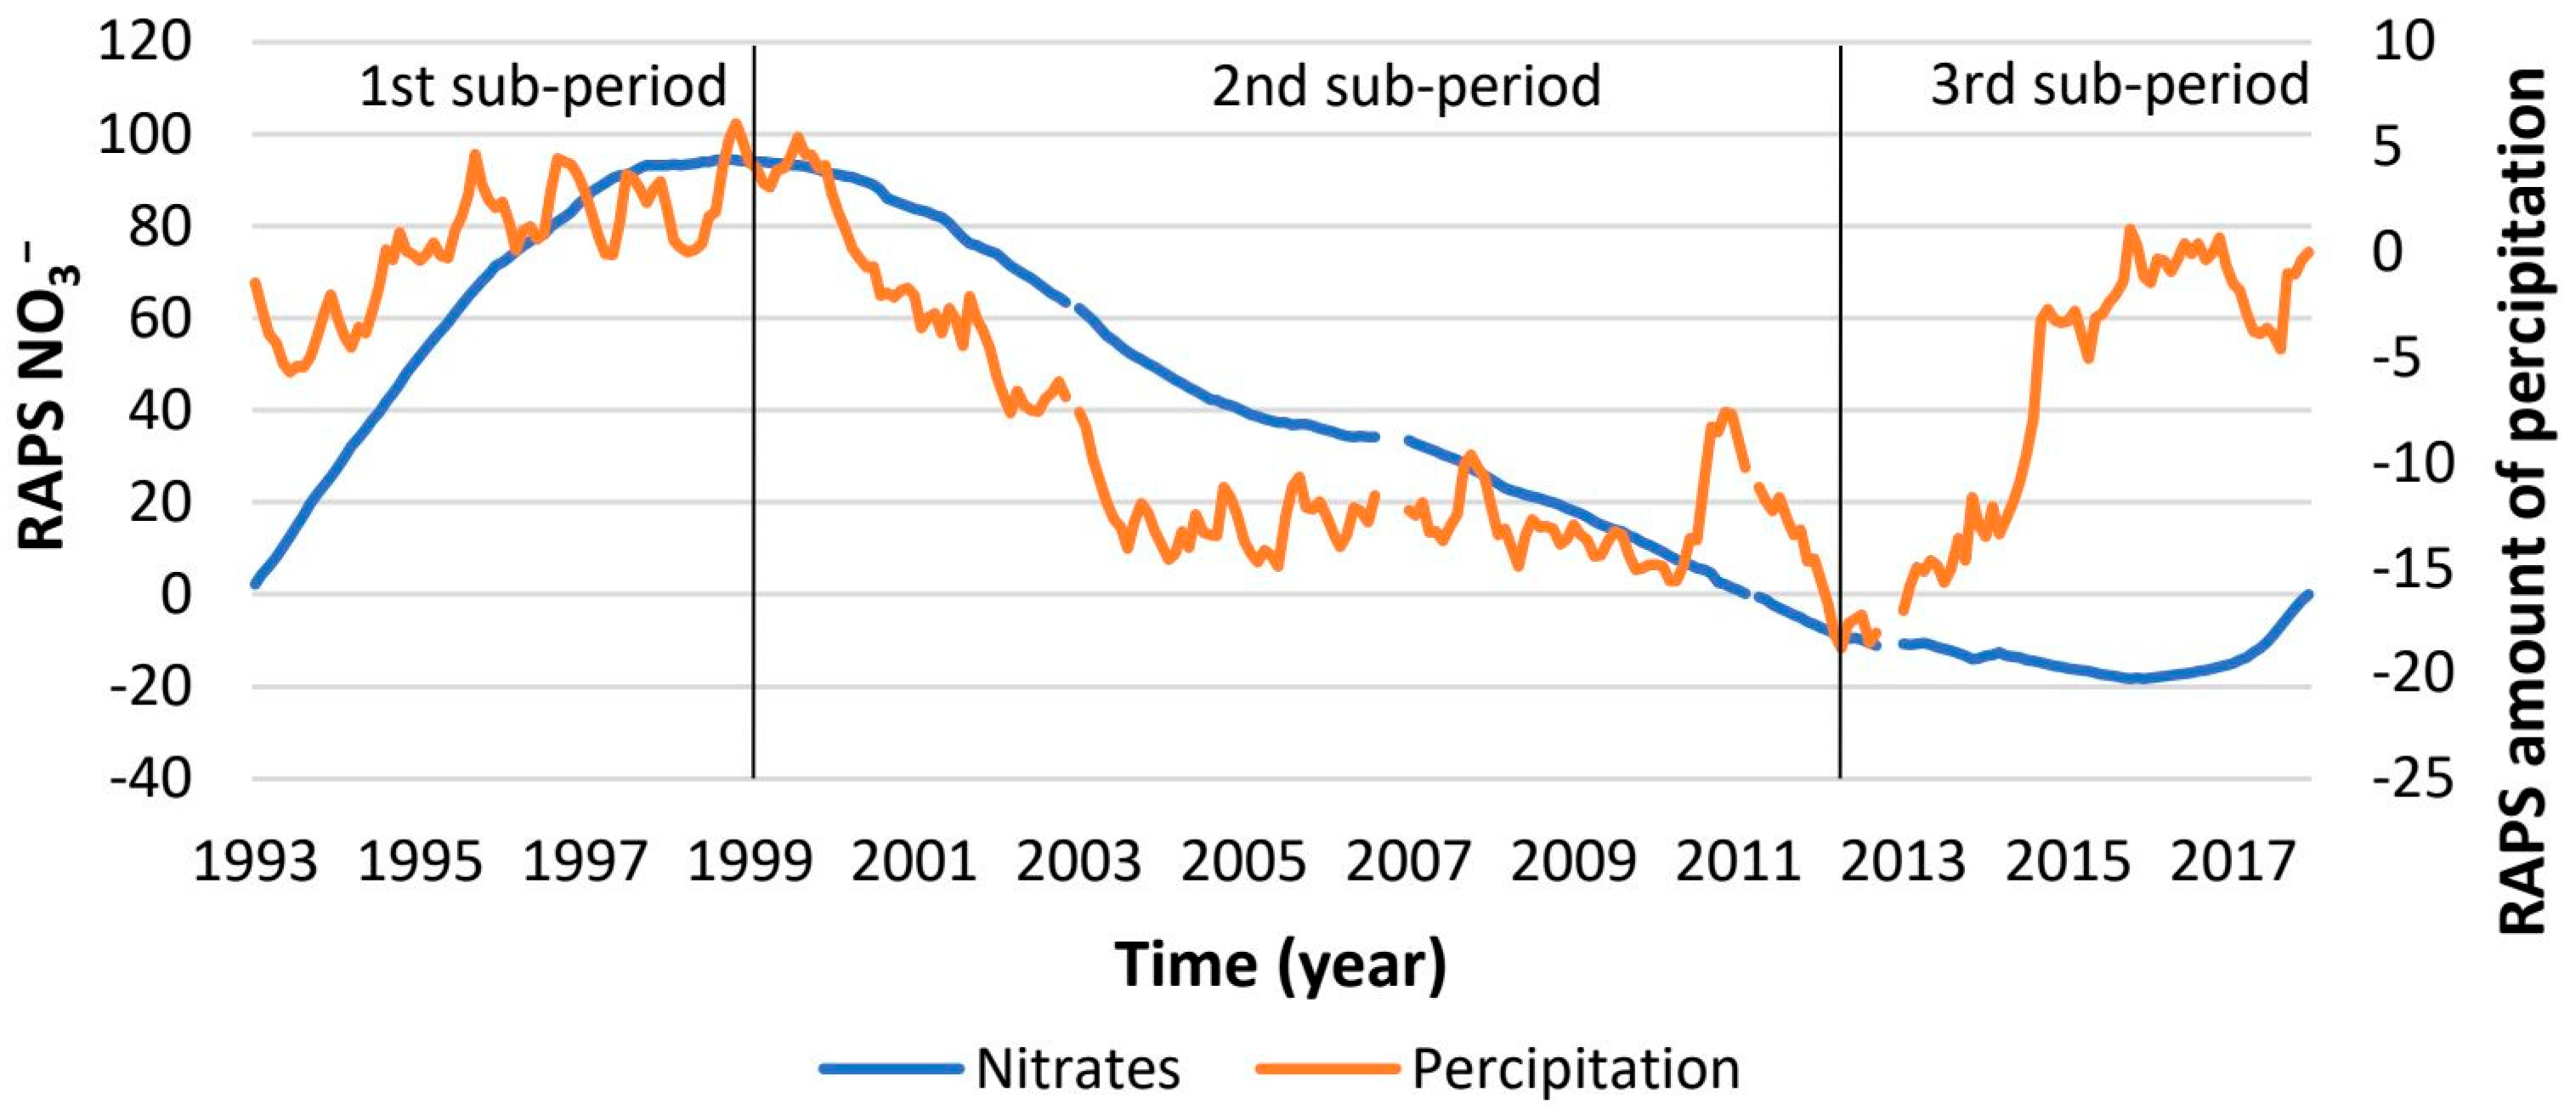
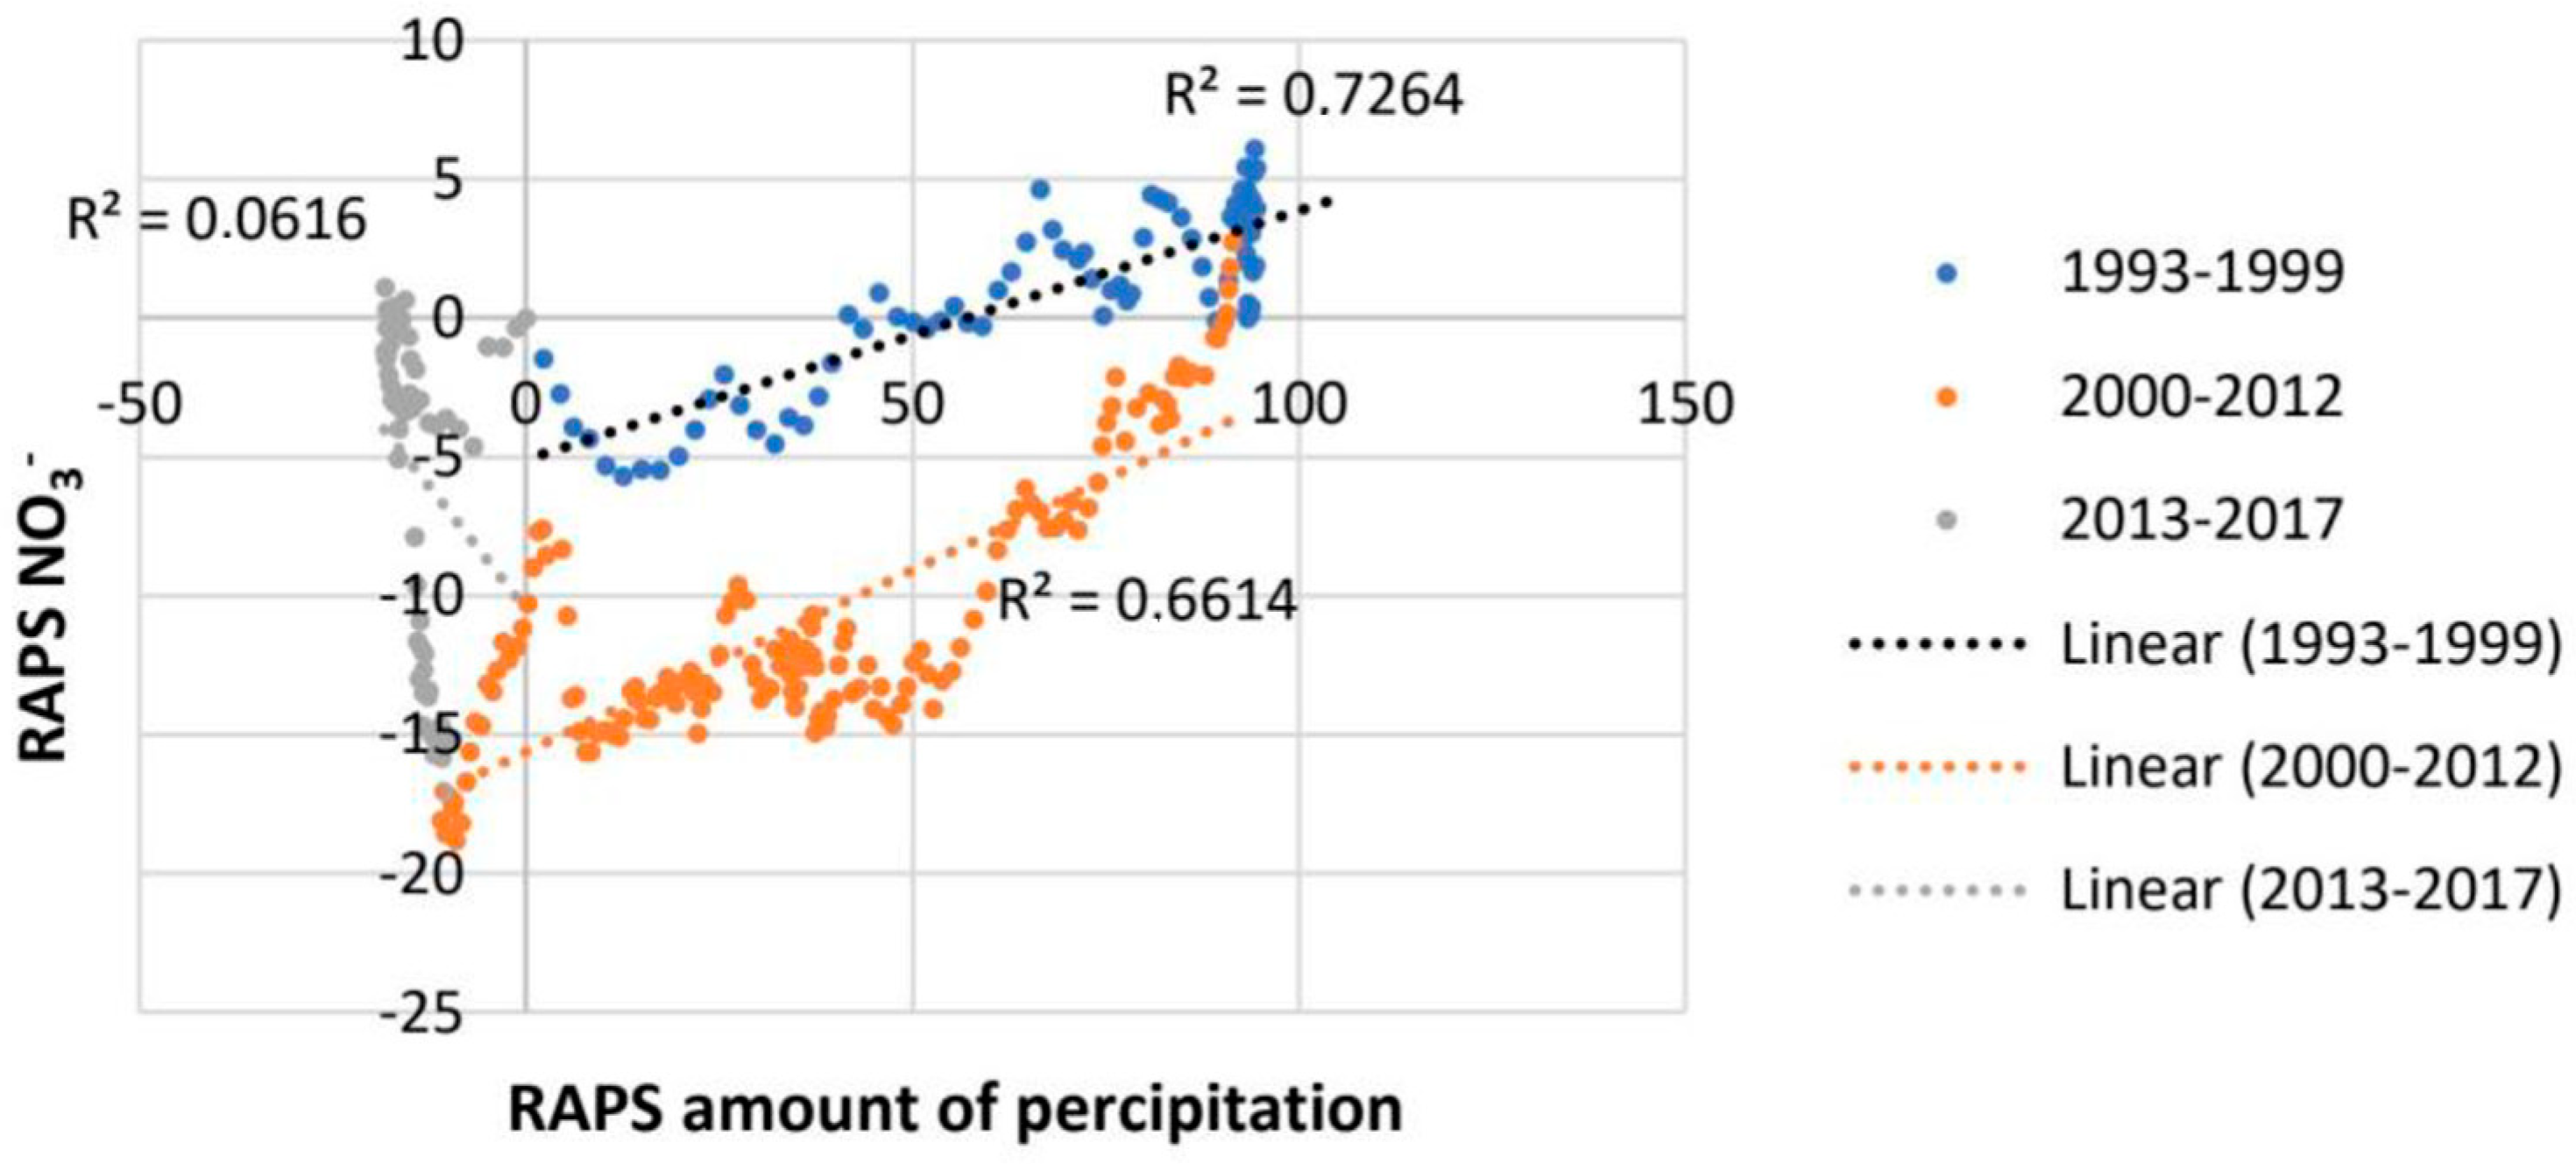
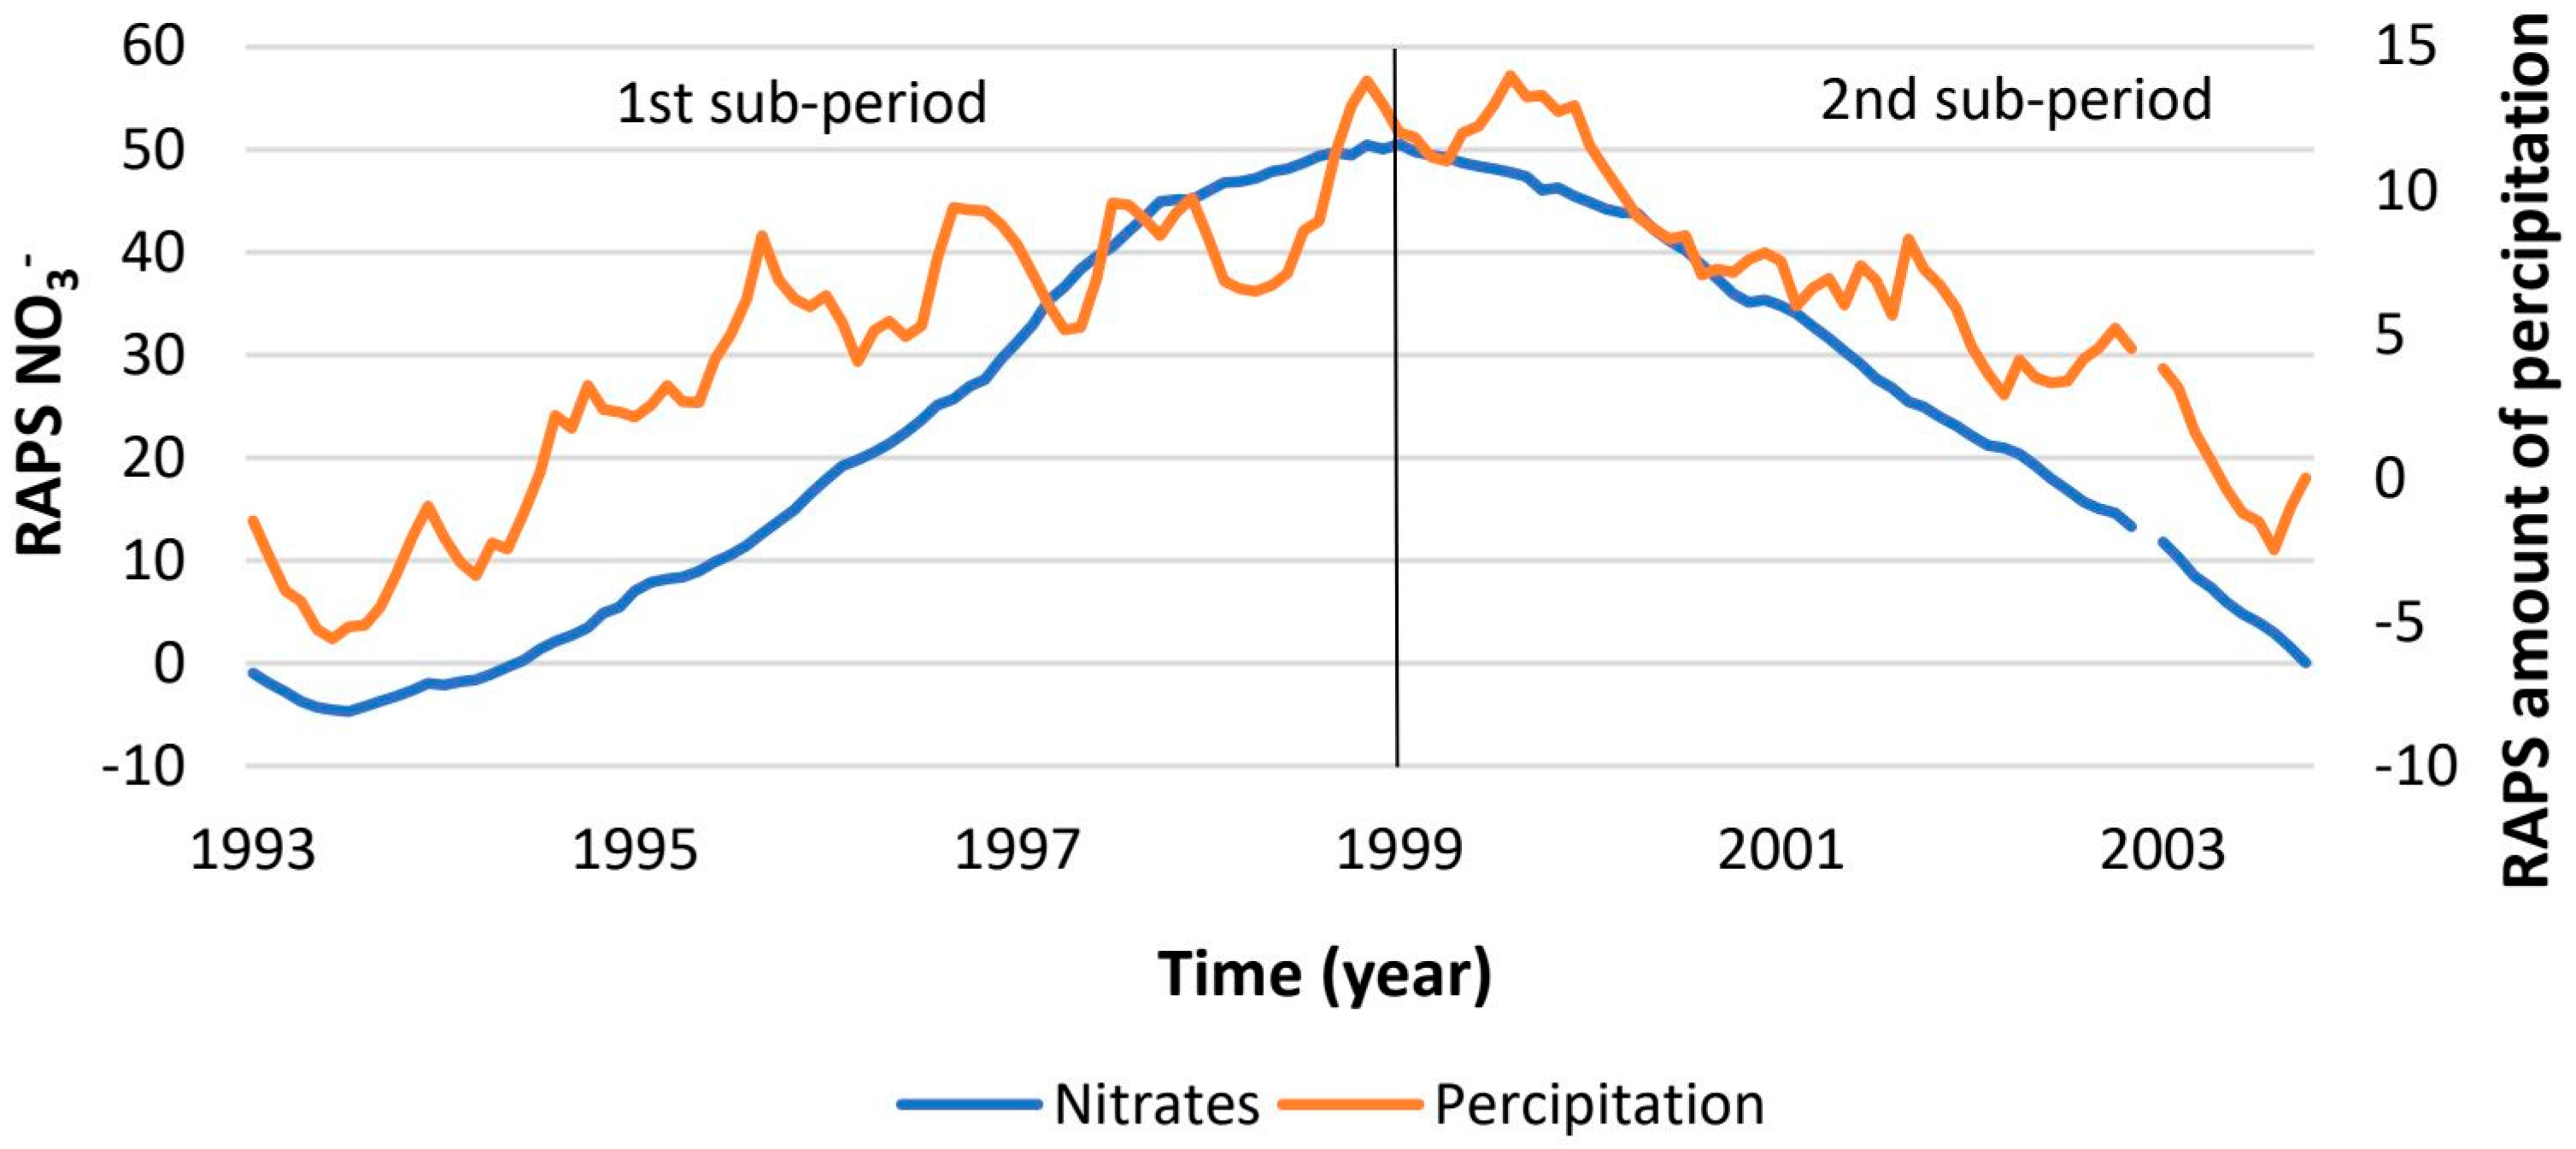
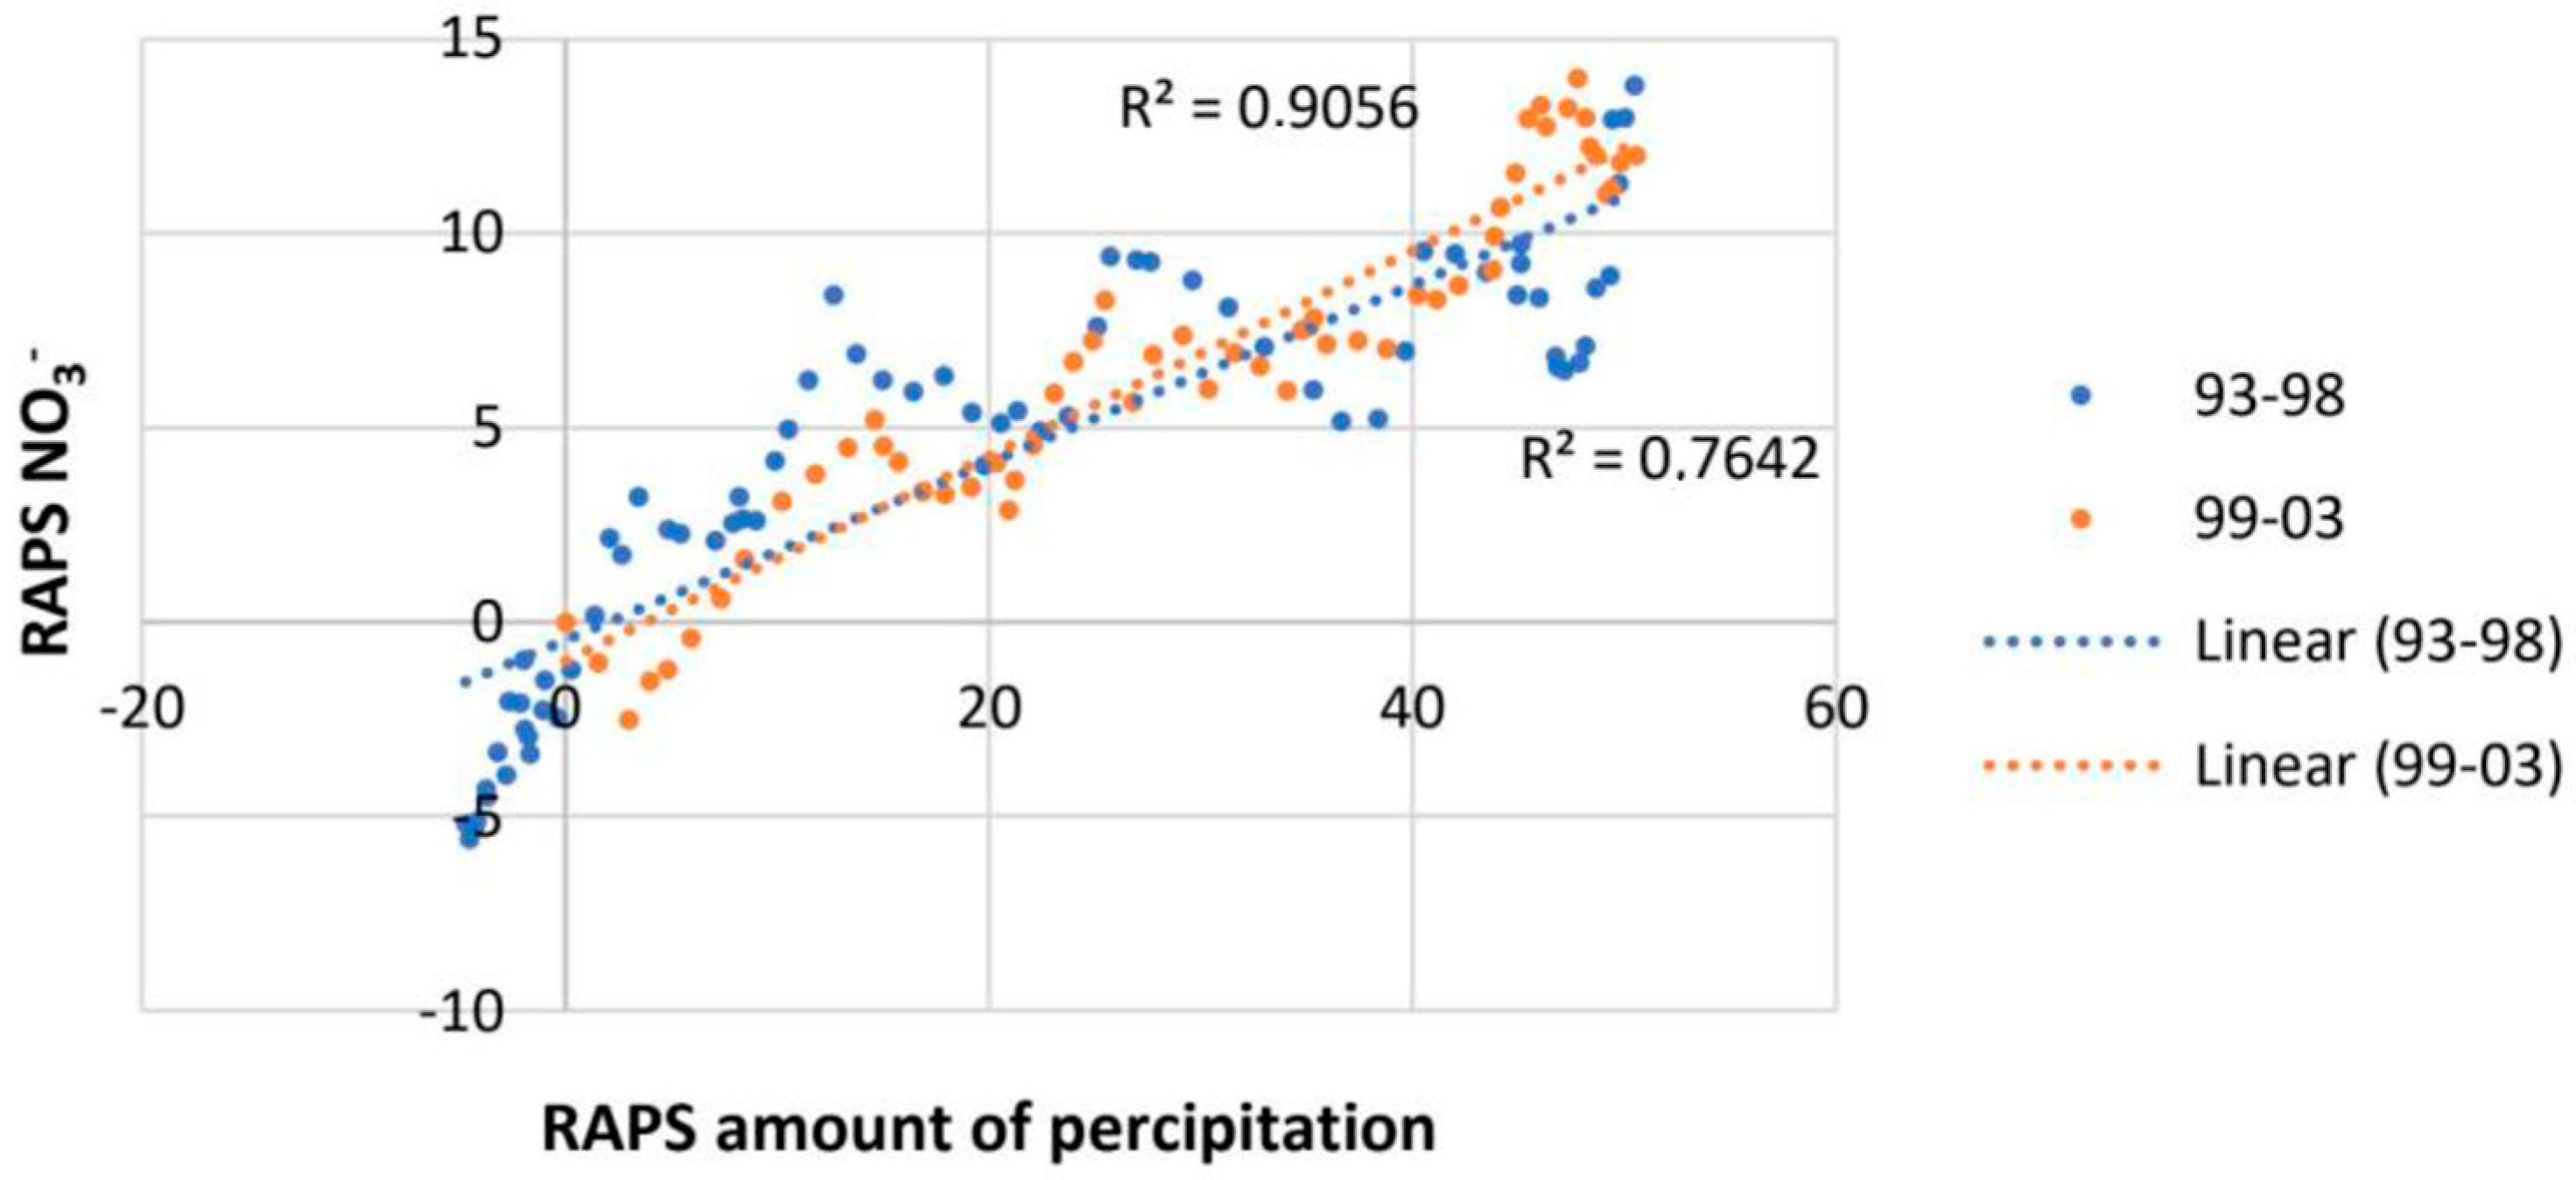
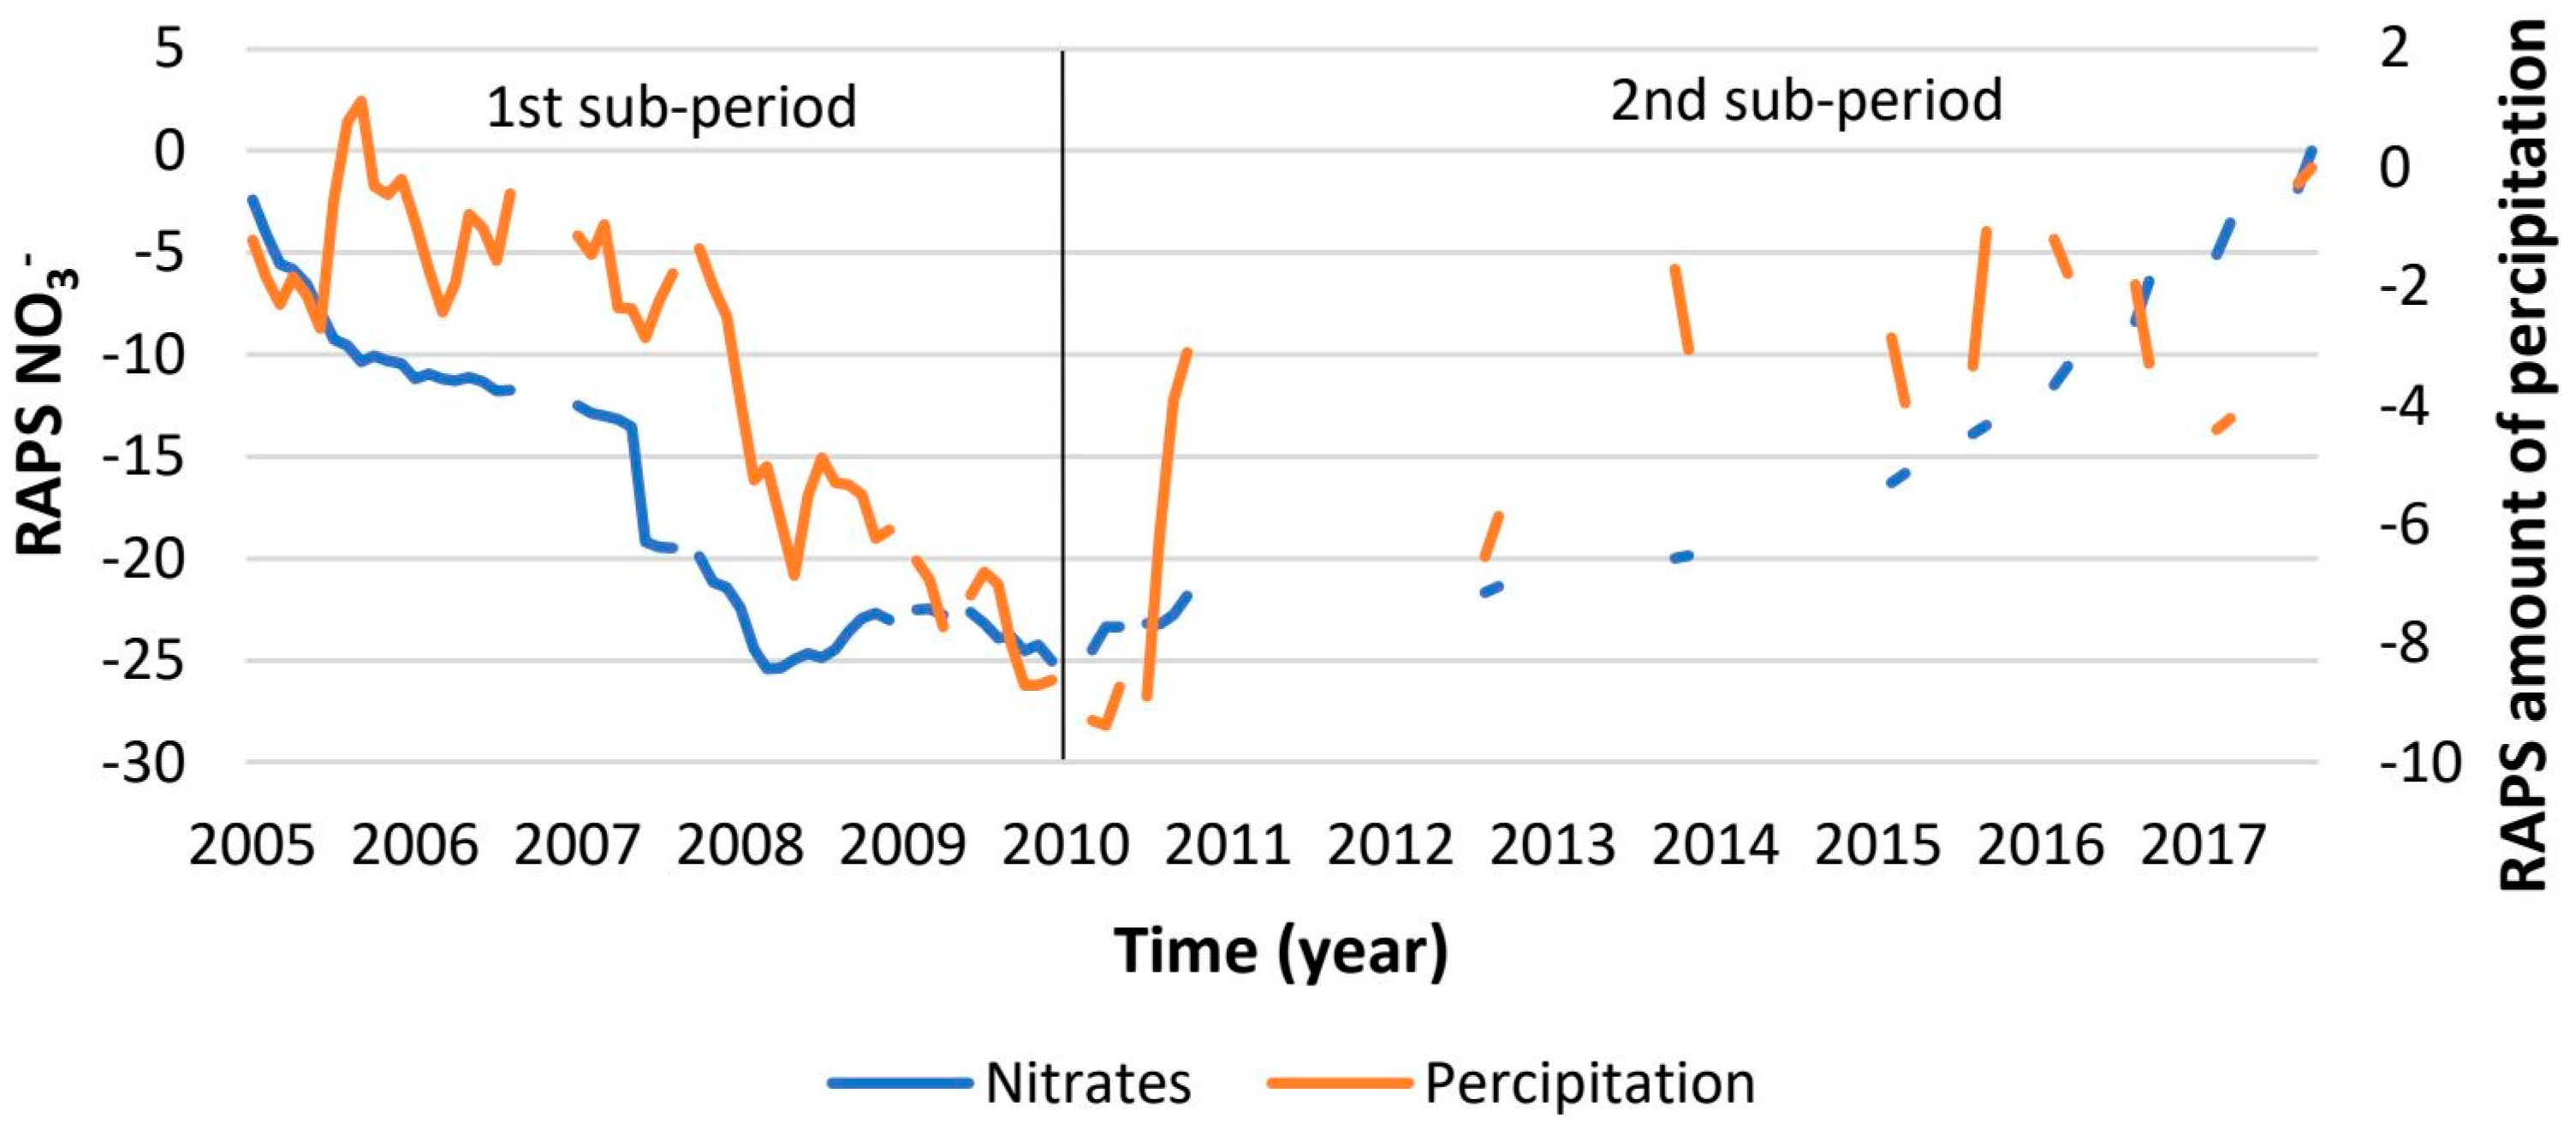
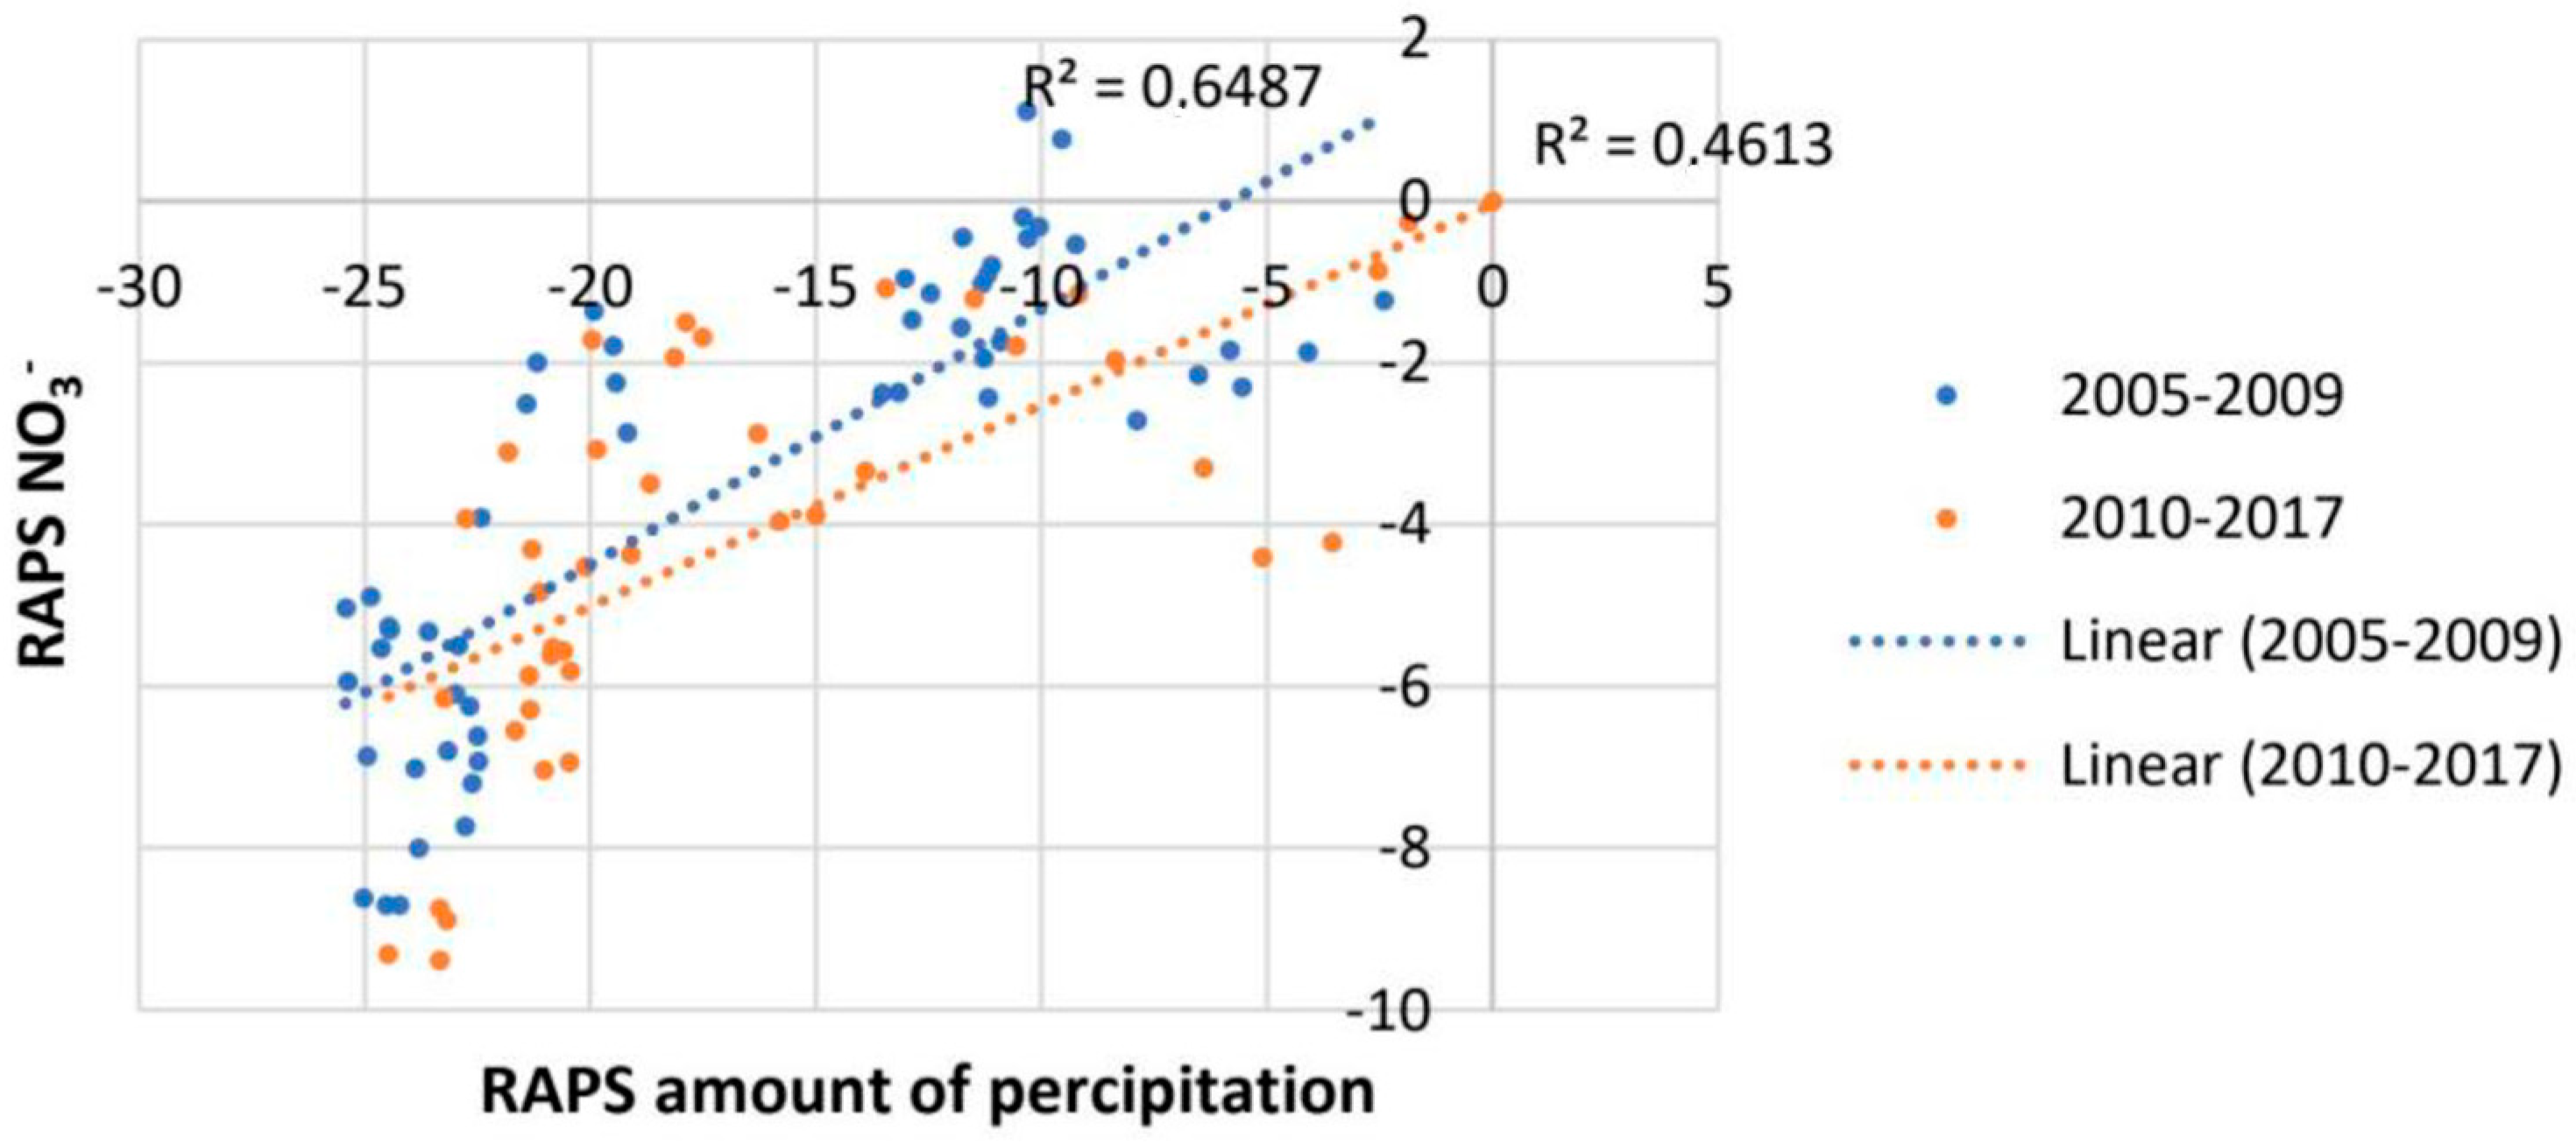
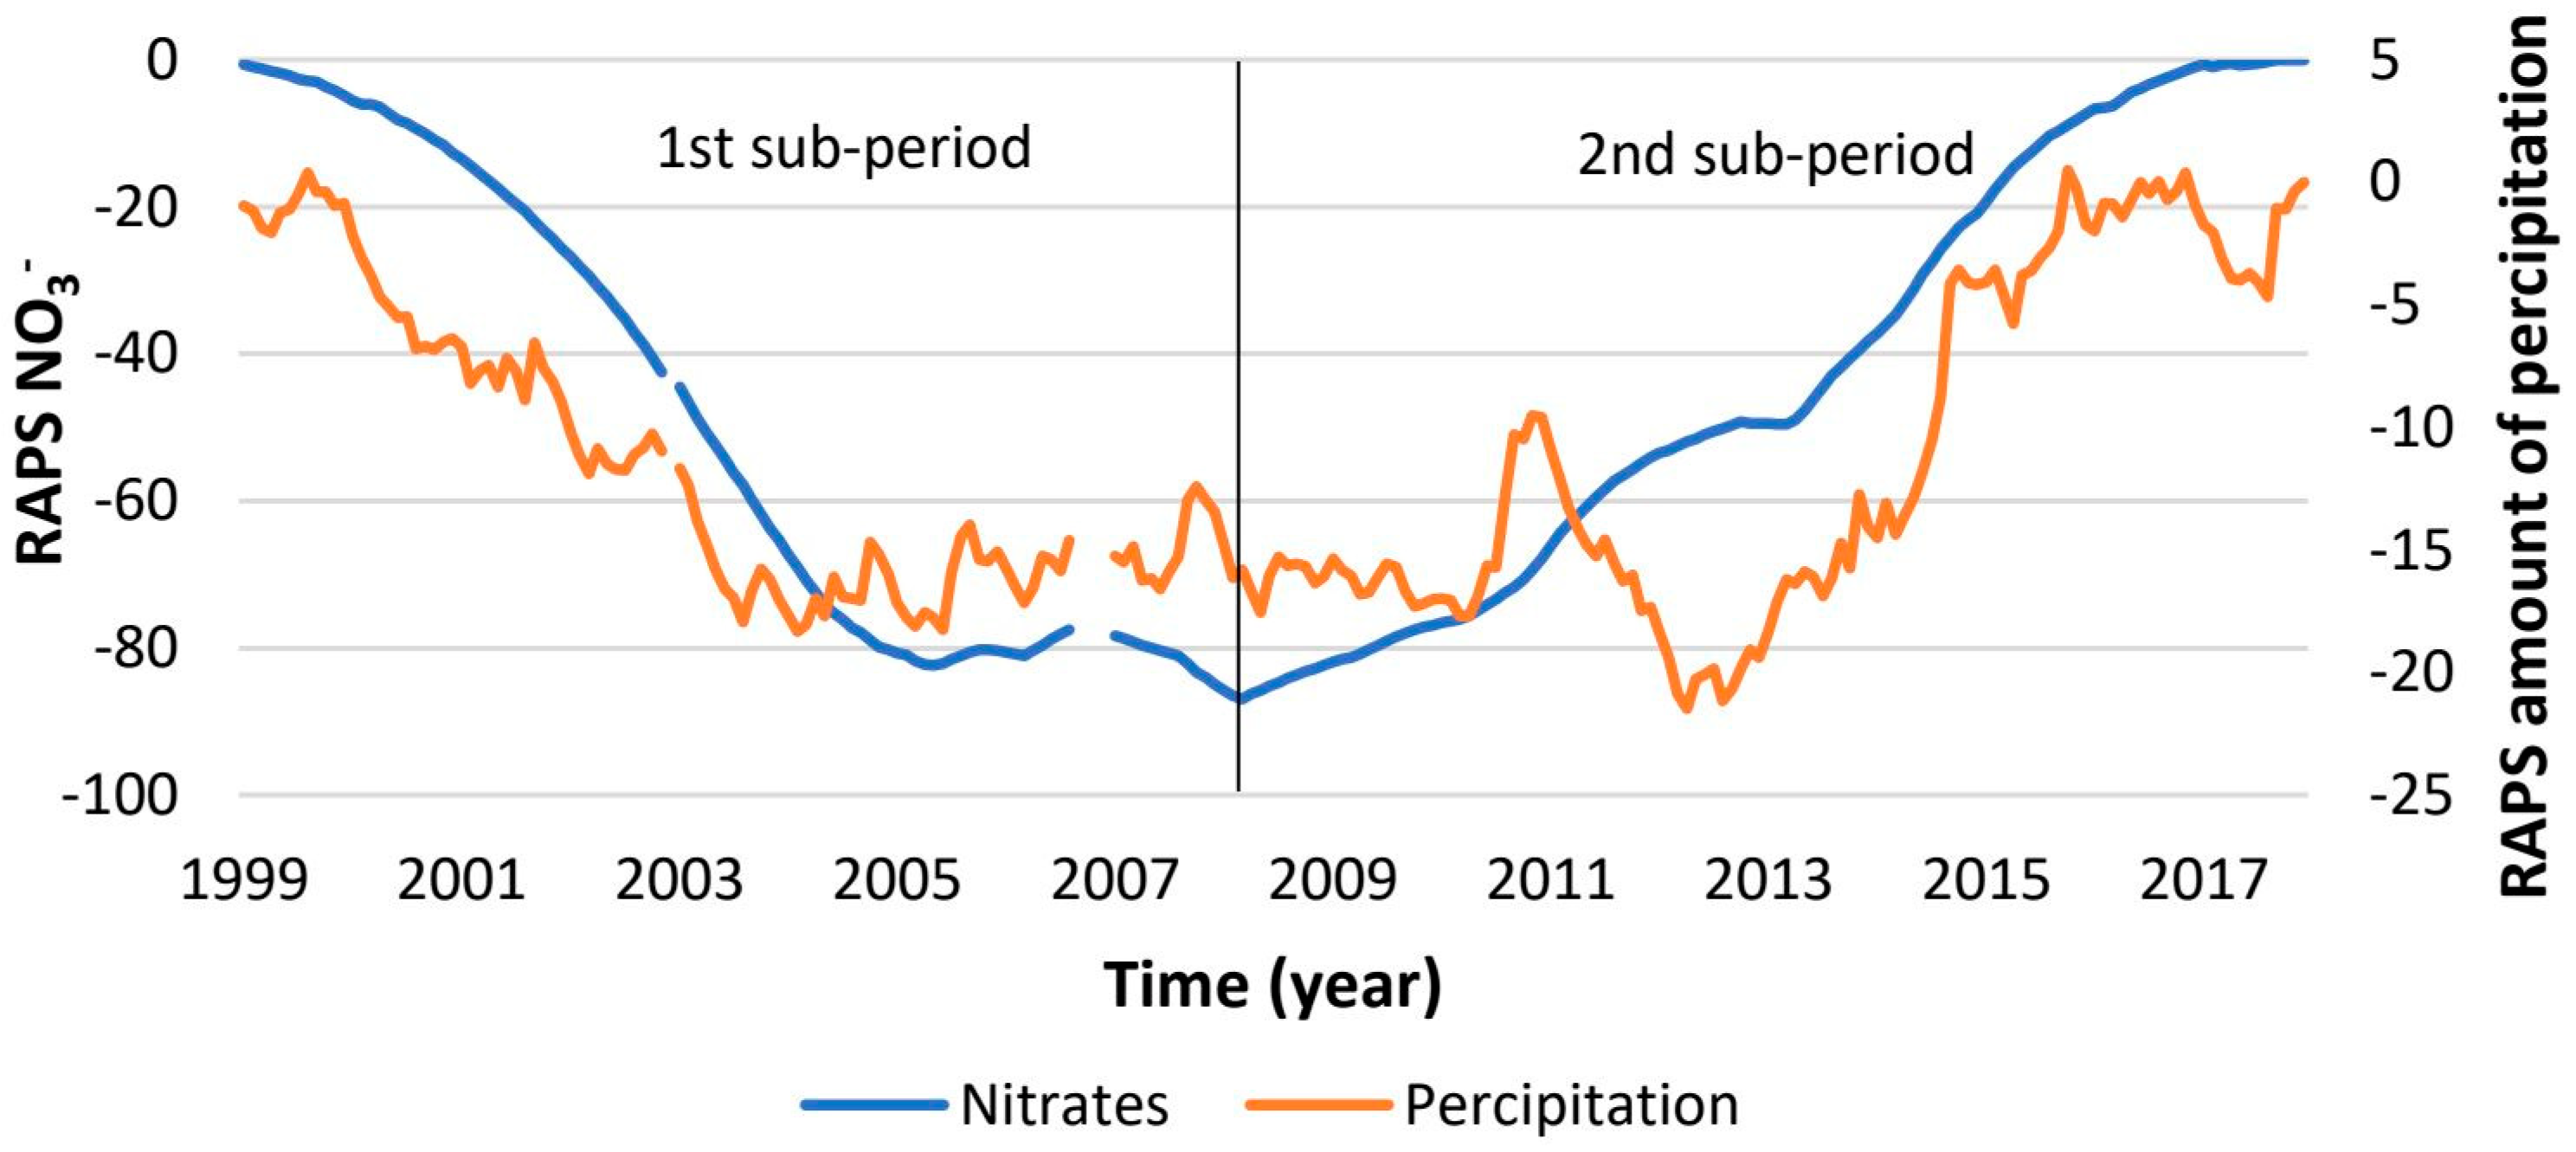
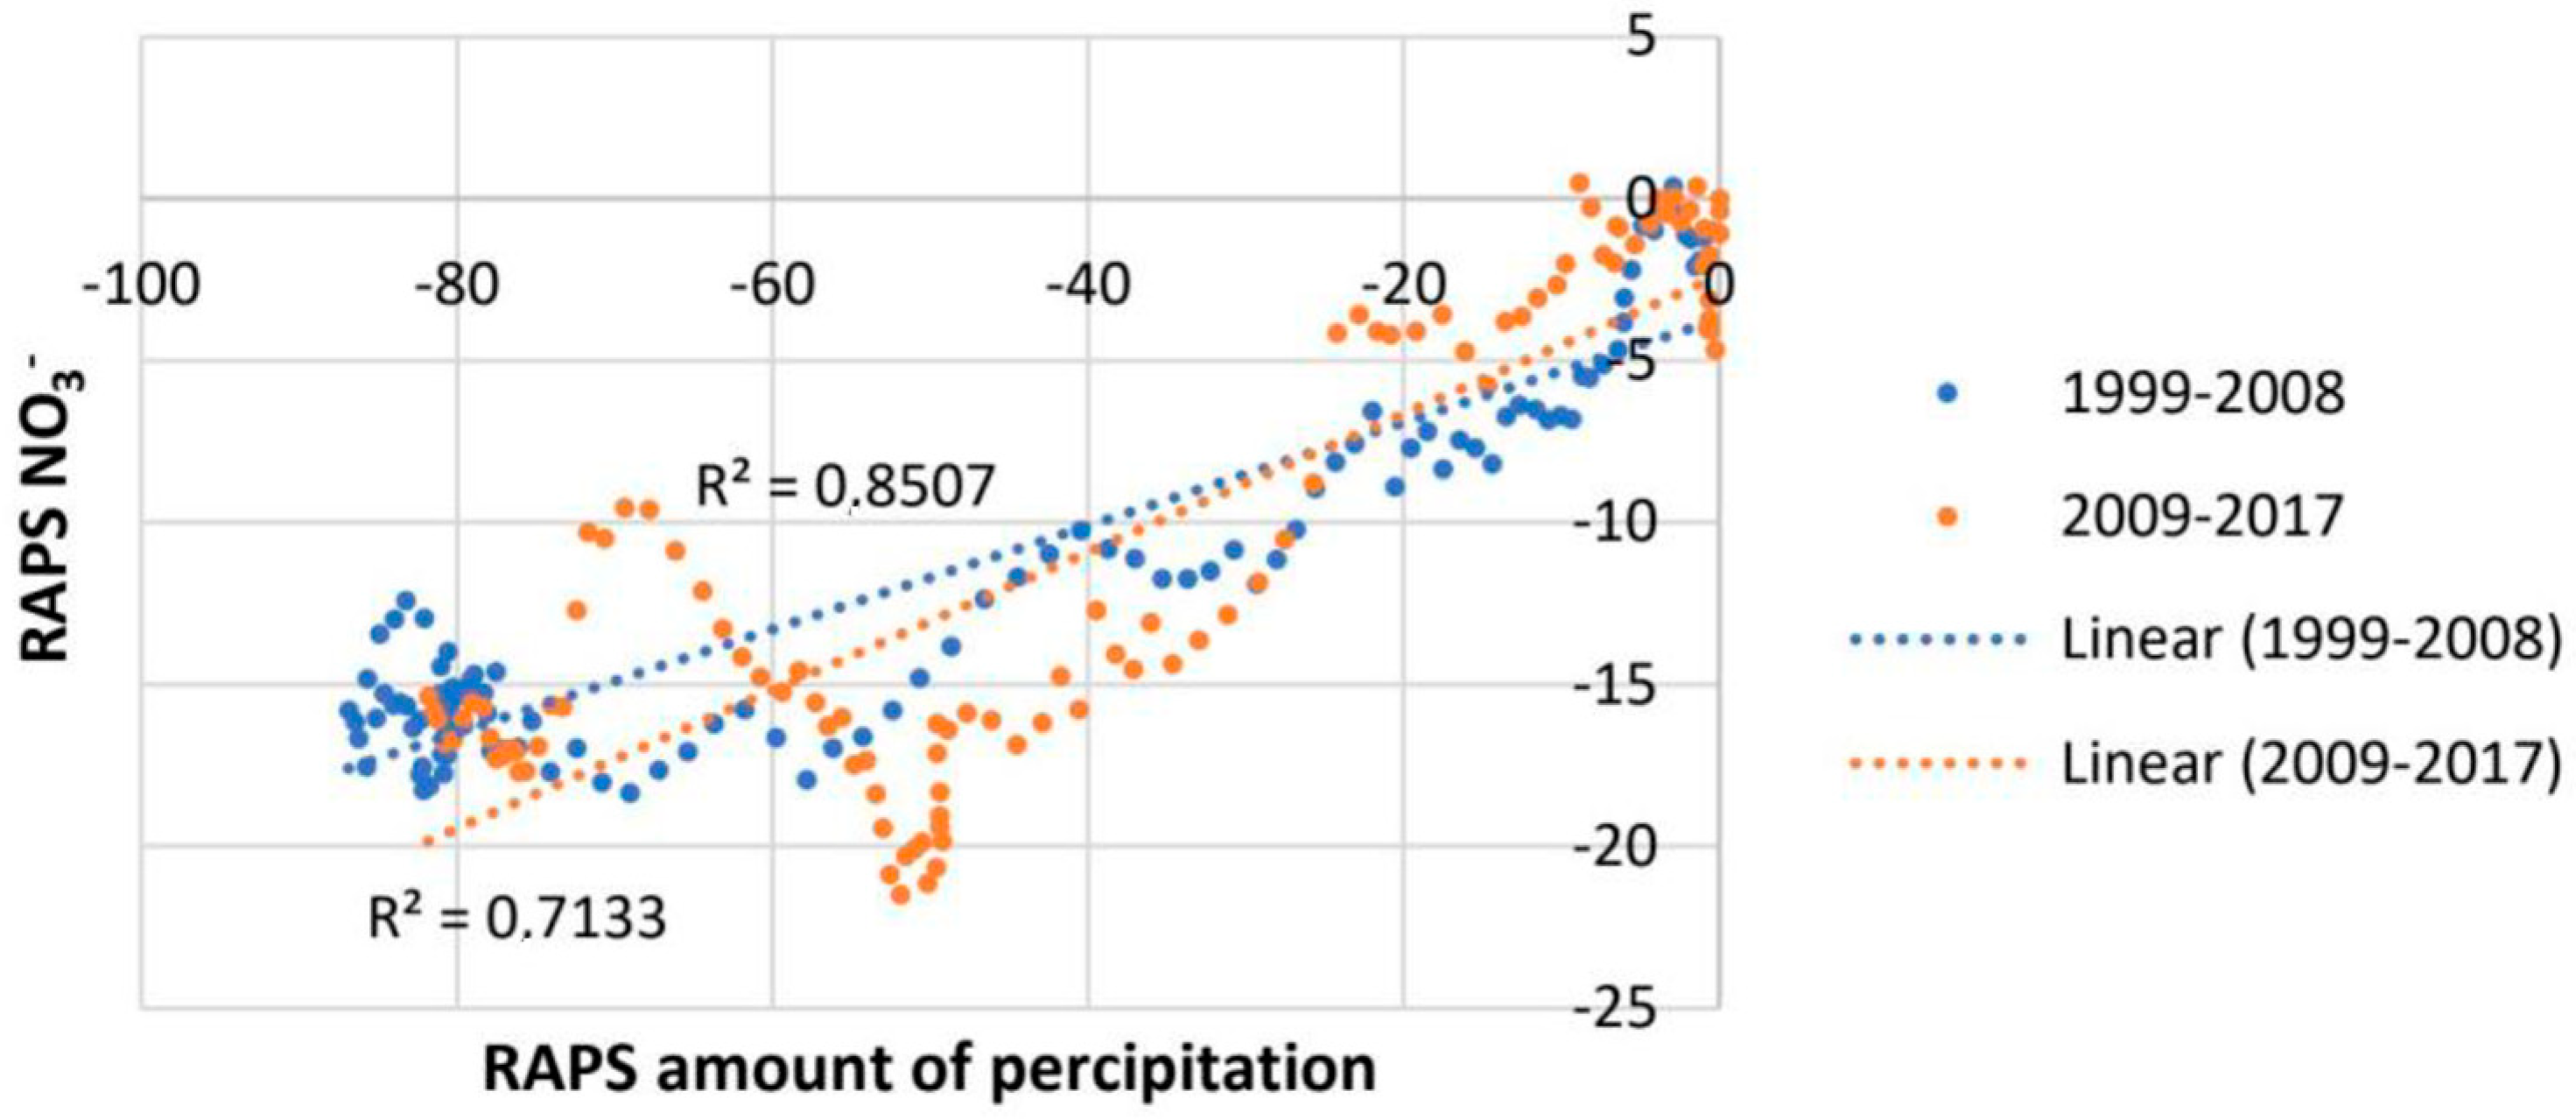
2.4. RAPS Method and Correlation Intensity

As can be seen from Figure 2, large oscillations were observed in the monthly amounts of precipitation, which is understandable considering the nature of that parameter, i.e., the annual trend in the amounts of precipitation shown but also the deviations from the average monthly quantities in specific years. However, there were years when there was no precipitation at all in certain months as well as years when the amount of precipitation exceeded a month’s average many times over. Therefore, the RAPS method described below was used for further analysis due to large data oscillations.
The RAPS (rescaled adjusted partial sums) method uses the sum deviation curve to analyze the observed quantities’ time distribution. It enables overcoming small systematic and random changes, errors, and variability in the researched time series. The graphic display points to several sub-periods and trends, sudden jumps and declines in value, irregular fluctuations, periodicity, and others [15,16]. So far, this method has been used to analyze the series of connections of hydrological and meteorological indicators and determine hydrological regimes of watercourses [17,18,19,20]. It was also used to analyze the interconnection between wastewater quality indicators and temperature and precipitation [21], and this method was used to research nitrates’ impact on groundwater resources [22].
The following equation defines the expression for the calculation of the RAPS method:
RAPS N = i = 1 N Y i Y ¯ S Y ,
whereas:
Yi—the value of an individual sample i = 1,2,…, N,
Y ¯ —average value of the observed sample,
SY—the value of the standard deviation of the time series,
N—the amount of data in the time series.
The RAPS method was used to analyze monthly precipitation and average monthly nitrate concentrations at all locations in 1993–2017, and an attempt was made to establish their interrelationship. For this purpose, correlation coefficients were calculated. Correlation describes the degree of connection between two variables, where the correlation coefficient takes a value between −1 and 1. The positive value of the correlation coefficient indicates the proportionality of the observed variables; that is, the growth of the value of both variables. A negative correlation coefficient indicates an increase in the value of one and a decrease in the value of the other variable. The closer the correlation coefficient value is to 0, the weaker the connection, and the closer to 1, whether positive or negative, the stronger the relationship. The correlation’s intensity is defined based on the correlation coefficients’ value (Table 2) [23].

3. Results and Discussion

At the Bartolovec 1 wellfield, a connection between the observed data sets was observed, and three sub-periods can be discerned from the RAPS data time series diagram: the first from the beginning of the observed period to 1999, the second from 1999 to 2012, and the third after that year (Figure 5). The value of the correlation coefficient for the entire period is 0.51. However, as the analysis of the time series of RAPS data indicated the existence of three sub-periods, the linear correlations were analyzed separately for each sub-period. The first sub-period is characterized by an upward trend, and the value of the correlation coefficient is 0.85, which indicates a strong connection (Figure 6). In the second sub-period, the trend is downward, and the correlation coefficient value is 0.81, showing a strong relationship. The third sub-period is characterized by separating the RAPS data curves of the observed variables, which confirms the value of the correlation coefficient of −0.24. Based on the obtained results, it can be concluded that at this location, the amount of precipitation affects the nitrate concentration in the groundwater in the first and second sub-periods. At the same time, such a connection was absent in the third sub-period.
Three sub-periods can also be discerned from the curve diagram of the time series of RAPS data at the Bartolovec 2 wellfield: the first until 2002, the second from 2002 to 2012, and the third after that year (Figure 7). The correlation analysis did not show a significant connection between the observed data sets in any sub-period, so the correlation coefficients in the first and second sub-periods are −0.35 and 0.42, indicating a weak correlation. In the third sub-period, the value of the correlation coefficient is −0.66, which means a negative correlation (Figure 8). The analysis results indicate that in this location, the amount of precipitation does not affect or weakly affect the concentration of nitrates in the groundwater.
Since the Varaždin 1 wellfield was put into a state of rest in 2004, groundwater has not been pumped at that location. Following that, the number of samplings is practically negligible and the analysis is only possible until that year. The curves of the time series of RAPS data are well aligned during the entire observed period, and considering the trend, two sub-periods can be discerned: the first until 1999 and the second after that year (Figure 9). The first sub-period is characterized by an upward trend, and the second by a downward trend. The values of the correlation coefficients in both sub-periods are high and amount to 0.87 for the first and 0.95 for the second sub-period (Figure 10). Because the points on the dispersion diagram do not discern two data sets, the correlation coefficient for the entire period was calculated and amounted to 0.91. This analysis confirms the high correlation between the two variables, i.e., it shows that the amount of precipitation significantly affects the nitrate concentration value in the groundwater at the location of the Varaždin 1 wellfield.
The Varaždin 2 wellfield was put into operation in 2005, and until 2010, water was continuously pumped at that location. Due to the high concentration of nitrates, this location was also put into a state of rest in 2011, after which it is only occasionally included in the water supply system. Although after 2011, the number of groundwater samplings is slightly lower, this analysis was also carried out for the wellfield’s passive operation period. The time series diagram of the RAPS data of monthly precipitation amount and monthly average nitrate concentration shows two sub-periods: the first until 2010 and the second after that year (Figure 11). There is a downward trend in the first sub-period and an upward trend in the second, and the RAPS data curves are well aligned with each other throughout the observed period. The value of the correlation coefficient in the first subperiod is 0.80, and in the second, 0.68 indicates a strong or good correlation (Figure 12). Because the points on the dispersion diagram do not discern two data sets, the correlation coefficient for the entire period was calculated and amounted to 0.74. From the obtained results, it can be concluded that the amount of precipitation affects the concentration of nitrates in the groundwater at this location as well.
At the Vinokovščak wellfield, the analysis was carried out from 1999, when the wellfield was put into operation, until 2017. The time series of RAPS data throughout the observed period is well aligned, and two sub-periods are discerned: the first until 2008 and the second after that year. The first sub-period is characterized by a downward trend, and the second by an upward trend (Figure 13). The value of the correlation coefficient in the first sub-period is 0.92; in the second, this value is slightly lower and is 0.84, indicating a strong correlation (Figure 14). Because two data sets cannot be discerned from the points on the dispersion diagram, the correlation coefficient for the entire period was calculated and amounted to 0.86. Thus, the results of this analysis show that at the location of the Vinokovščak wellfield, the amount of precipitation significantly affects the nitrate concentration in the groundwater.

4. Conclusions

This paper used the RAPS method to establish the connection between the nitrate concentration in the groundwater at the observed wellfields and the amount of precipitation. The analysis results show that the amount of precipitation affects the concentration of nitrates in almost all observed wellfields. However, only at the Bartolovec 2 wellfield was no connection observed between the observed data sets. Based on the regression analysis, a positive relationship between the two data groups was established, which means that the nitrate concentration in the groundwater increases with precipitation. The values of the correlation coefficients in almost all observed locations show a good or strong correlation, so in the upper aquifer, the values are in the interval of 0.81–0.95. A greater connection between the two sets of data was recorded in the upper aquifer layer compared to the lower one, which is understandable considering that this layer is under significantly greater influence of anthropogenic sources of contamination on the surface. Considering the long-standing problem in the water supply of the observed area, primarily the high concentration of nitrates, high-quality drinking water will be one of the main prerequisites for the region’s further development. To preserve or improve the quality of groundwater at the observed wellfields, it will be important to adhere to the principles that harmonize agricultural activity with ecological and economic principles, i.e., the way of land use, which can best achieve the goals of economic and environmental sustainability, i.e., the service of so-called good agricultural practices.

Author Contributions

Conceptualization, M.Š.; methodology, M.Š. and B.Đ.; software, M.Š.; validation, M.Š., B.Đ., P.S. and S.K.S.; formal analysis, M.Š. and B.Đ.; investigation, M.Š. and B.Đ.; resources, M.Š. and B.Đ.; data curation, M.Š. and B.Đ.; writing—original draft preparation, M.Š.; writing—review and editing, B.Đ., P.S. and S.K.S.; visualization, M.Š. and P.S.; supervision, B.Đ. and S.K.S. All authors have read and agreed to the published version of the manuscript.

Funding

This research received no external funding.

Institutional Review Board Statement

Not applicable.

Informed Consent Statement

Not applicable.

Data Availability Statement

The data presented in this study are available in this article. Additional data are available on request from the corresponding author.

Conflicts of Interest

The authors declare no conflict of interest.

References

  1. Madison, R.; Brunett, J. Overview of the occurrence of nitrate in ground water of the United States. In National Water Summary 1984—Hydrologic Events, Selected Water–Quality Trends and Ground-Water Resources; Water-Supply Paper 2275; United States Geological Survey: Reston, VA, USA, 1984; pp. 93–105. [Google Scholar]
  2. Addiscott, T.M.; Whitmore, A.P.; Powlson, D.S.; Farming, D.S. Fertilizers and the Nitrate Problem; CAB International: Wallingford, UK, 1991. [Google Scholar]
  3. Obeidat, M.M.; Massadeh, A.M.; Al-Ajlouni, A.M.; Athamneh, F.S. Analysis and evaluation of nitrate levels in groundwater at Al-Hashimiya area, Jordan. Environ. Monit. Assess. 2007, 135, 475–486. [Google Scholar] [CrossRef] [PubMed]
  4. Nemčić-Jurec, J.; Mesić, M.; Bašić, F.; Kisić, I.; Zgorelec, Ž. Nitrate concentration in drinking water from wells at three different locations in northwest Croatia. Cereal Res. Commun. 2007, 35, 845–848. [Google Scholar] [CrossRef]
  5. Šrajbek, M.; Kovač, I.; Novotni-Horčička, N.; Kranjčević, L. Assessment of average contributions of point and diffuse pollution sources to nitrate concentration in groundwater by nonlinear regression. Environ. Eng. Manag. J. 2020, 19, 95–104. [Google Scholar] [CrossRef]
  6. Šrajbek, M.; Kranjčević, L.; Kovač, I.; Biondić, R. Groundwater Nitrate Pollution Sources Assessment for Contaminated Wellfield. Water 2022, 14, 255. [Google Scholar] [CrossRef]
  7. Kovač, I. Statistical-Variographic Analysis of Ground Water Chemical Composition in Varaždin Region. Ph.D. Thesis, University of Zagreb, Faculty of Mining, Geology and Petroleum Engineering, Zagreb, Croatia, 2004; 124p. [Google Scholar]
  8. Šrajbek, M.; Kovač, I.; Mesec, J. Correlation Analysis of the Ground Water Quality at the Bartolovec Well Field, Water and Public Water Supply/Dadić; Hrvatski Zavod za Javno Zdravstvo: Zagreb, Croatia, 2010; pp. 113–122. [Google Scholar]
  9. Kovač, I.; Kovačev-Marinčić, B.; Novotni-Horčička, N.; Mesec, J.; Vugrinec, J. Comparative analysis of nitrate concentration in upper and lower aquifer of the varaždin system of aquifers. Rad. Zavoda Za Znan. Rad Varaždin 2017, 28, 41–57. [Google Scholar] [CrossRef] [Green Version]
  10. Novotni-Horčička, N.; Šrajbek, M.; Kovač, I. Nitrates in the Regional Water Supply System Varaždin. Water and Public Water Supply/Dadić; Hrvatski Zavod za Javno Zdravstvo: Zagreb, Croatia, 2010; pp. 123–131. [Google Scholar]
  11. Urumović, K. The quaternary aquifer complex in the Varaždin area (Croatian title: O kvartnom vodonosnom kompleksu u području Varaždina). Geološki Vjesn. 1971, 24, 109–118. [Google Scholar]
  12. Urumović, K.; Prelogović, E.; Hlevnjak, B.; Mayer, D. Hydrogeological relations of the Varaždin aquifer (Croatian title: Hidrogeološki odnosi varaždinskog vodonosnika). Geološki Vjesn. 1990, 43, 149–158. [Google Scholar]
  13. Larva, O. Aquifer Vulnerability at Catchment Area of Varaždin Pumping Sites (Croatian Title: Ranjivost Vodonosnika na Priljevnom Području Varaždinskih Crpilišta). Ph.D. Thesis, University of Zagreb, Faculty of Mining, Geology and Petroleum Engineering, Zagreb, Croatia, 2008; 198p. [Google Scholar]
  14. Official Gazette of the Republic of Croatia. Ordinance on Conformity Parameters and Analysis Methods, Monitoring and Water Safety Plans for Human Consumption; Official Gazette of the Republic of Croatia: Zagreb, Croatia, 2017; 125/2017.
  15. Garbrecht, J.; I Fernandez, G.P. Visualization of trends and fluctuations in climatic records. Water Resour. Bull. 1994, 30, 297–306. [Google Scholar] [CrossRef]
  16. Bonacci, O.; Trninić, D.; Roje-Bonacci, T. Analisys of the water temperature regime of the Danube and its tributaries in Croatia. Hydrogeol. Process. 2008, 22, 1014–1021. [Google Scholar] [CrossRef]
  17. Bonacci, O.; Pekarova, P.; Miklanek, P. Analysis of long-lasting time series of discharge and water temperature of Danube near Bratislava. Hrvat. Vode 2009, 17, 103–112. [Google Scholar]
  18. Lojken, S.; Trkov, A.; Ščančar, J.; Vasquez-Navarro, J.A.; Cukrov, N. Continous 60-year stable isotopic and earth-alkali elements records in a modern laminated tufa (Jaruga, river Krka, Croatia): Implications for climate reconstruction. Chem. Geol. 2009, 258, 242–250. [Google Scholar] [CrossRef]
  19. Bonacci, O. Analysis of mean annual air temperature series in Croatia. Građevinar 2010, 62, 781–791. [Google Scholar]
  20. Tadić, L. Criteria for Evaluation of Agricultural Land Suitability for Irrigation in Osijek County Croatia. Probl. Perspect. Chall. Agric. Water Manag. 2012, 2012, 311–332. [Google Scholar]
  21. Đurin, B.; Ptiček Siročić, A.; Muhar, A. Analysis of wastewater quality indicators in relation to wastewater temperature and precipitation by means of the RAPS method. Hrvat. Vode 2017, 25, 247–252. [Google Scholar]
  22. Šrajbek, M.; Đurin, B.; Sakač, N.; Ptiček Siročić, A. Effect of nitrates on underground water resources—Analysis by RAPS method. J. Agric. Anim. Prod. Sci. Rural. Dev. 2018, 8, 75–79. [Google Scholar]
  23. Udovičić, M.; Baždarić, K.; Bilić-Zulle, L.; i Petrovečki, M. What we need to know when calculating the coefficient of correlation? Biochem. Med. 2007, 17–11, 10–15. [Google Scholar] [CrossRef] [Green Version]
Figure 1. Locations of wellfields and a meteorological station.
Earth 04 00014 g001
Figure 2. Hydrogeologic profile of the Varaždin County region [11].
Earth 04 00014 g002
Figure 3. Time series of monthly averages of nitrate concentrations and precipitation amount.
Earth 04 00014 g003
Figure 4. Average monthly precipitation (in mm) at the meteorological station Varaždin from 1993–2017.
Earth 04 00014 g004
Figure 5. Time series of RAPS data of monthly precipitation amount and monthly averages of nitrate concentration at the Bartolovec 1 wellfield.
Earth 04 00014 g005
Figure 6. Dispersion diagram of RAPS data of precipitation amount and nitrate concentration at the Bartolovec 1 wellfield.
Earth 04 00014 g006
Figure 7. Time series of RAPS data of monthly precipitation amount and monthly averages of nitrate concentration at the Bartolovec 2 wellfield.
Earth 04 00014 g007
Figure 8. Dispersion diagram of RAPS data of precipitation amount and nitrate concentration at the Bartolovec 2 wellfield.
Earth 04 00014 g008
Figure 9. Time series of RAPS data of monthly precipitation amount and monthly averages of nitrate concentration at the Varaždin 1 wellfield.
Earth 04 00014 g009
Figure 10. Dispersion diagram of RAPS data of precipitation amount and nitrate concentration at the Varaždin 1 wellfield.
Earth 04 00014 g010
Figure 11. Time series of RAPS data of monthly precipitation amount and monthly averages of nitrate concentration at the Varaždin 2 wellfield.
Earth 04 00014 g011
Figure 12. Dispersion diagram of RAPS data on precipitation and nitrate concentration at the Varaždin 2 wellfield.
Earth 04 00014 g012
Figure 13. Time series of RAPS data of monthly precipitation amounts and monthly averages of nitrate concentration at the Vinokovščak wellfield.
Earth 04 00014 g013
Figure 14. Dispersion diagram of RAPS data of precipitation amount and nitrate concentration at the Vinokovščak wellfield.
Earth 04 00014 g014
Table 1. Arithmetic averages of specific groundwater quality parameters in the observed period.
ParameterUnitVaraždin 1Varaždin 2Bartolovec 1Bartolovec 2VinokovščakMAC *
pH 7.407.437.407.487.366.5–9.5
KMnO4 consumptionmg/L O20.750.620.610.610.605
Ammonium ionmg/L NH4+0.0080.0000.0070.0070.0110.5
Nitratesmg/L NO379.7454.6820.5511.0424.4550
Chloridesmg/L Cl19.2113.9622.948.5613.83250
* MAC—Maximum Allowable Concentration.
Table 2. Labels of correlation intensity and corresponding values of correlation coefficients [22].
r     0.25   0.25     r   <   0.50   0.50     r   <   0.75   0.75     r   <   0.1   r   =   1  
insignificant correlationweak
correlation
good
correlation
strong
correlation
functional connection
Disclaimer/Publisher’s Note: The statements, opinions and data contained in all publications are solely those of the individual author(s) and contributor(s) and not of MDPI and/or the editor(s). MDPI and/or the editor(s) disclaim responsibility for any injury to people or property resulting from any ideas, methods, instructions or products referred to in the content.

