Article

Maximizing Decarbonization Benefits of Transportation Electrification in the U.S.

1
Institute of Systems and Robotics, Department of Electrical and Computer Engineering, University of Coimbra, 3030-290 Coimbra, Portugal
2
Carnegie Institute of Technology, Carnegie Mellon University, Pittsburgh, PA 15213, USA
3
Civil, Architectural and Environmental Engineering Department, The University of Texas at Austin, Austin, TX 78712, USA
*
Author to whom correspondence should be addressed.
Electricity 2023, 4(1), 46-61; https://doi.org/10.3390/electricity4010004
Submission received: 25 November 2022 / Revised: 28 December 2022 / Accepted: 25 January 2023 / Published: 1 February 2023

Abstract

:
Transportation electrification can significantly reduce carbon footprint and accelerate the modernization of aging electric infrastructure. In the U.S., the growing adoption of electric vehicles (EVs) will significantly impact the electrical grid and associated greenhouse gas emissions, but with significant differences between the balancing regions due to the diverse characteristics of their electrical grids. This work assesses the impacts associated with the increasing penetration of EVs in the U.S., considering the characteristics of the grid in the different regions, in order to discuss the needed strategies to maximize the future decarbonization benefits. The assessment considers the variation in generation mix profiles during the day in each region, as well as different charging profiles associated with home, work, and public charging. The results show that more ambitious policies for the increasing share of carbon-free generation in the regions with the highest emissions are needed, emphasizing incentives for the use of work and public charging, and ensuring effective management of the charging flexibility.

1. Introduction

1.1. Motivation

The sharp growth in the electric vehicle (EV) market is driven by policies and technological developments (e.g., lower battery costs and improved performance). According to IEA, more than 10 million EVs were on the roads around the world in 2020 and it is projected that EVs will claim between 7 % and 12 % of the mobility fleets in 2030 [1]. With this new market comes the demand for EV charging. The number of private and publicly accessible chargers reached 9.5 million and 1.3 million in 2020, respectively, and these numbers are expected to grow to 140 and 50 million, respectively, by 2030 [1].
In the U.S., the federal income tax credit for purchasing new electric (and plug-in hybrid) cars and charging infrastructure has been the main governmental policy instrument to boost EV sales and address the need for charging infrastructures [2]. While these incentives directly impact EV adoption by reducing upfront cost barriers, their impact is felt in other sectors such as the electric industry and labor market. These impacts will be multiplied as a new target of 50 % EV sales share in 2030 has been established [3].
The reduction of greenhouse gas (GHG) emissions is the key driving factor for the electric mobility industry. However, the resulting emissions reduction highly depends on the average GHG emissions associated with the generation of energy used for charging EVs [4]. In the U.S., each balancing region of the power grid relies on different energy sources to generate electricity. Therefore, it is essential to assess the impact of transportation electrification in the context of the energy mix and GHG emissions of individual regions. Transportation electrification is poised to shape the future of the transportation sector and the energy supply chain. Hence, EV policy choices should be analyzed through the lens of both transportation and power systems and associated GHG emissions.
On the other hand, charging EVs at home, at work, or in public places results in different energy consumption patterns. Therefore, it is imperative to evaluate the impact of such patterns on the operation parameters of the regional electrical grid, e.g., the peak electric load, and overlap with the availability of renewable generation both at the bulk power and distribution system levels. The evaluation of the impacts of the uncoordinated charging profiles and the identification of charging coordination needs will be fundamental to defining future policy options. To this end, leveraging the inherent flexibility of EV charging enables integrating a higher level of renewable generation and is aligned with the climate goal and grid modernization plans.

1.2. Related Work

Many research efforts have focused on assessing EVs’ impacts in the U.S. These works range from analyzing market adoption, economic barriers, and required incentives to GHG emission impacts and grid integration. The adoption and market penetration of EVs is assessed in [5,6,7]. In [5] the correlation between social, economic, geographic, and policy factors related to EV adoption across the U.S. is assessed. The authors conclude that there is a strong relationship between energy prices, incentives, and the availability of charging infrastructure. By the same token, authors in [6] have shown a direct correlation between the adoption of EVs in different states and electricity prices and incentives. In [7], the EV markets in China and the U.S. are compared showing major inequality between EV adoption in the two regions with respect to incentive variations and infrastructure availability.
EV friendly policies and incentives are vital for EV adoption [8,9,10,11]. In this regard, ref. [8] evaluates the policies currently implemented across the U.S. and quantifies their potential to facilitate widespread EV diffusion. In [9], the authors processed data of (i) EV purchase subsidies, (ii) home charger incentives, (iii) annual EV fees, (iv) and the changes in EV policies to analyze economic, environmental, demographic, political, and ideological factors related to EV adoption. In [10], the information from 14 U.S. cities is used to compare the total cost of ownership for conventional, hybrid, and EVs. The study shows a high geo variation due to differences in state and local policies, highlighting the need for federal and state incentives. The effectiveness of EV incentives in the U.S. was studied in [11]; it was concluded that every $ 1000 of incentive as a rebate or tax credit increases average sales of EVs by 2.6 % . However, such works fall short of evaluating the impacts of EV sales on GHG emissions and the electrical grid.
The impacts of EV adoption on GHG emissions were estimated in works such as [12,13,14,15]. In order to determine the optimal blend of policy leavers in different U.S. regions, ref. [12] focuses on analyzing the life cycle environmental emissions of different vehicles. In [13], a life-cycle assessment of GHG emissions of EVs is presented and used for comparing China and three regions in the U.S. In [14], the environmental and economic impacts of EVs are calculated based on three generation mix scenarios. The authors in [15] present the net long-term emission implications of large-scale EV adoption in the U.S. in the context of different futures for the power grid. However, most works do not include the variation in generation mix between the different regions. The other shortcoming of the existing evaluations is their reliance on predefined decarbonization pathways rather than each region’s expected generation mix evolution. Most existing literature overlooks the daily and seasonal variations of generation mix and associated GHG emissions, limiting the assessment of EV charging profiles.
The influence of EVs on the electrical grid is assessed in works such as [16,17,18]. In [16], the market potential and challenges associated with enhancing grid resilience with the integration of EVs in the U.S. is discussed based on a survey. The benefits of EVs on the future electricity grid in the Midwestern U.S. are assessed in [17]. To minimize the negative impacts on the electrical grid and costs, other works, such as [19,20], assessed the charging load cost and the various management solutions for its management. The authors in [18] focus on the consequence of flexible charging for GHG emissions in California. However, these works do not evaluate the impact of charging profiles on the total load at the bulk power and distribution system levels. They also do not evaluate the matching between the availability of renewable generation and charging profiles at the grid level.

1.3. Contribution

The main contribution of this work is to evaluate the impacts of EV adoption on GHG emissions and the operation of the electrical grids across the U.S. while accounting for variations in generation resources. To this end, realistic scenarios for the future penetration of EVs based on federal targets were considered. The charging needs of each EV scenario were calculated for the different U.S. regions, considering typical EV charging profiles from such regions. In the next step, the GHG emissions associated with the different scenarios of EV penetration were assessed for the different realizations of the generation mix in the U.S. regions. Building on this assessment, the GHG emissions of each region were evaluated. In order to calculate the resulting emission, the average variation generation mix profiles during the day were considered and this accounted for a wide range of different EV charging profiles.
The future EV penetration scenarios were also studied in the context of characteristics associated with regional electrical grids. This study considers different charging profiles (associated with home, work, and public charging), total electricity demand, and generation mix in each region. The evaluation was based on the correlation between the charging options and total electricity demand and renewable generation profiles (at bulk power and distributed generation levels), as well as on the contribution to increasing the peak load. Finally, the achieved results were leveraged to derive policy recommendations to increase the positive impacts associated with the integration of EVs. The recommendations range from revising the generation mix to deploying intelligent EV charge management solutions.

1.4. Paper Organization

The remainder of the paper is structured as follows. Section 2 presents the data collected and the methods used. The effects of EV adoption on electricity demand, GHG emissions, and electrical grid operation are studied in Section 3. Section 4 discusses the results and presents policy recommendations. Finally, Section 5 presents the conclusions of this work.

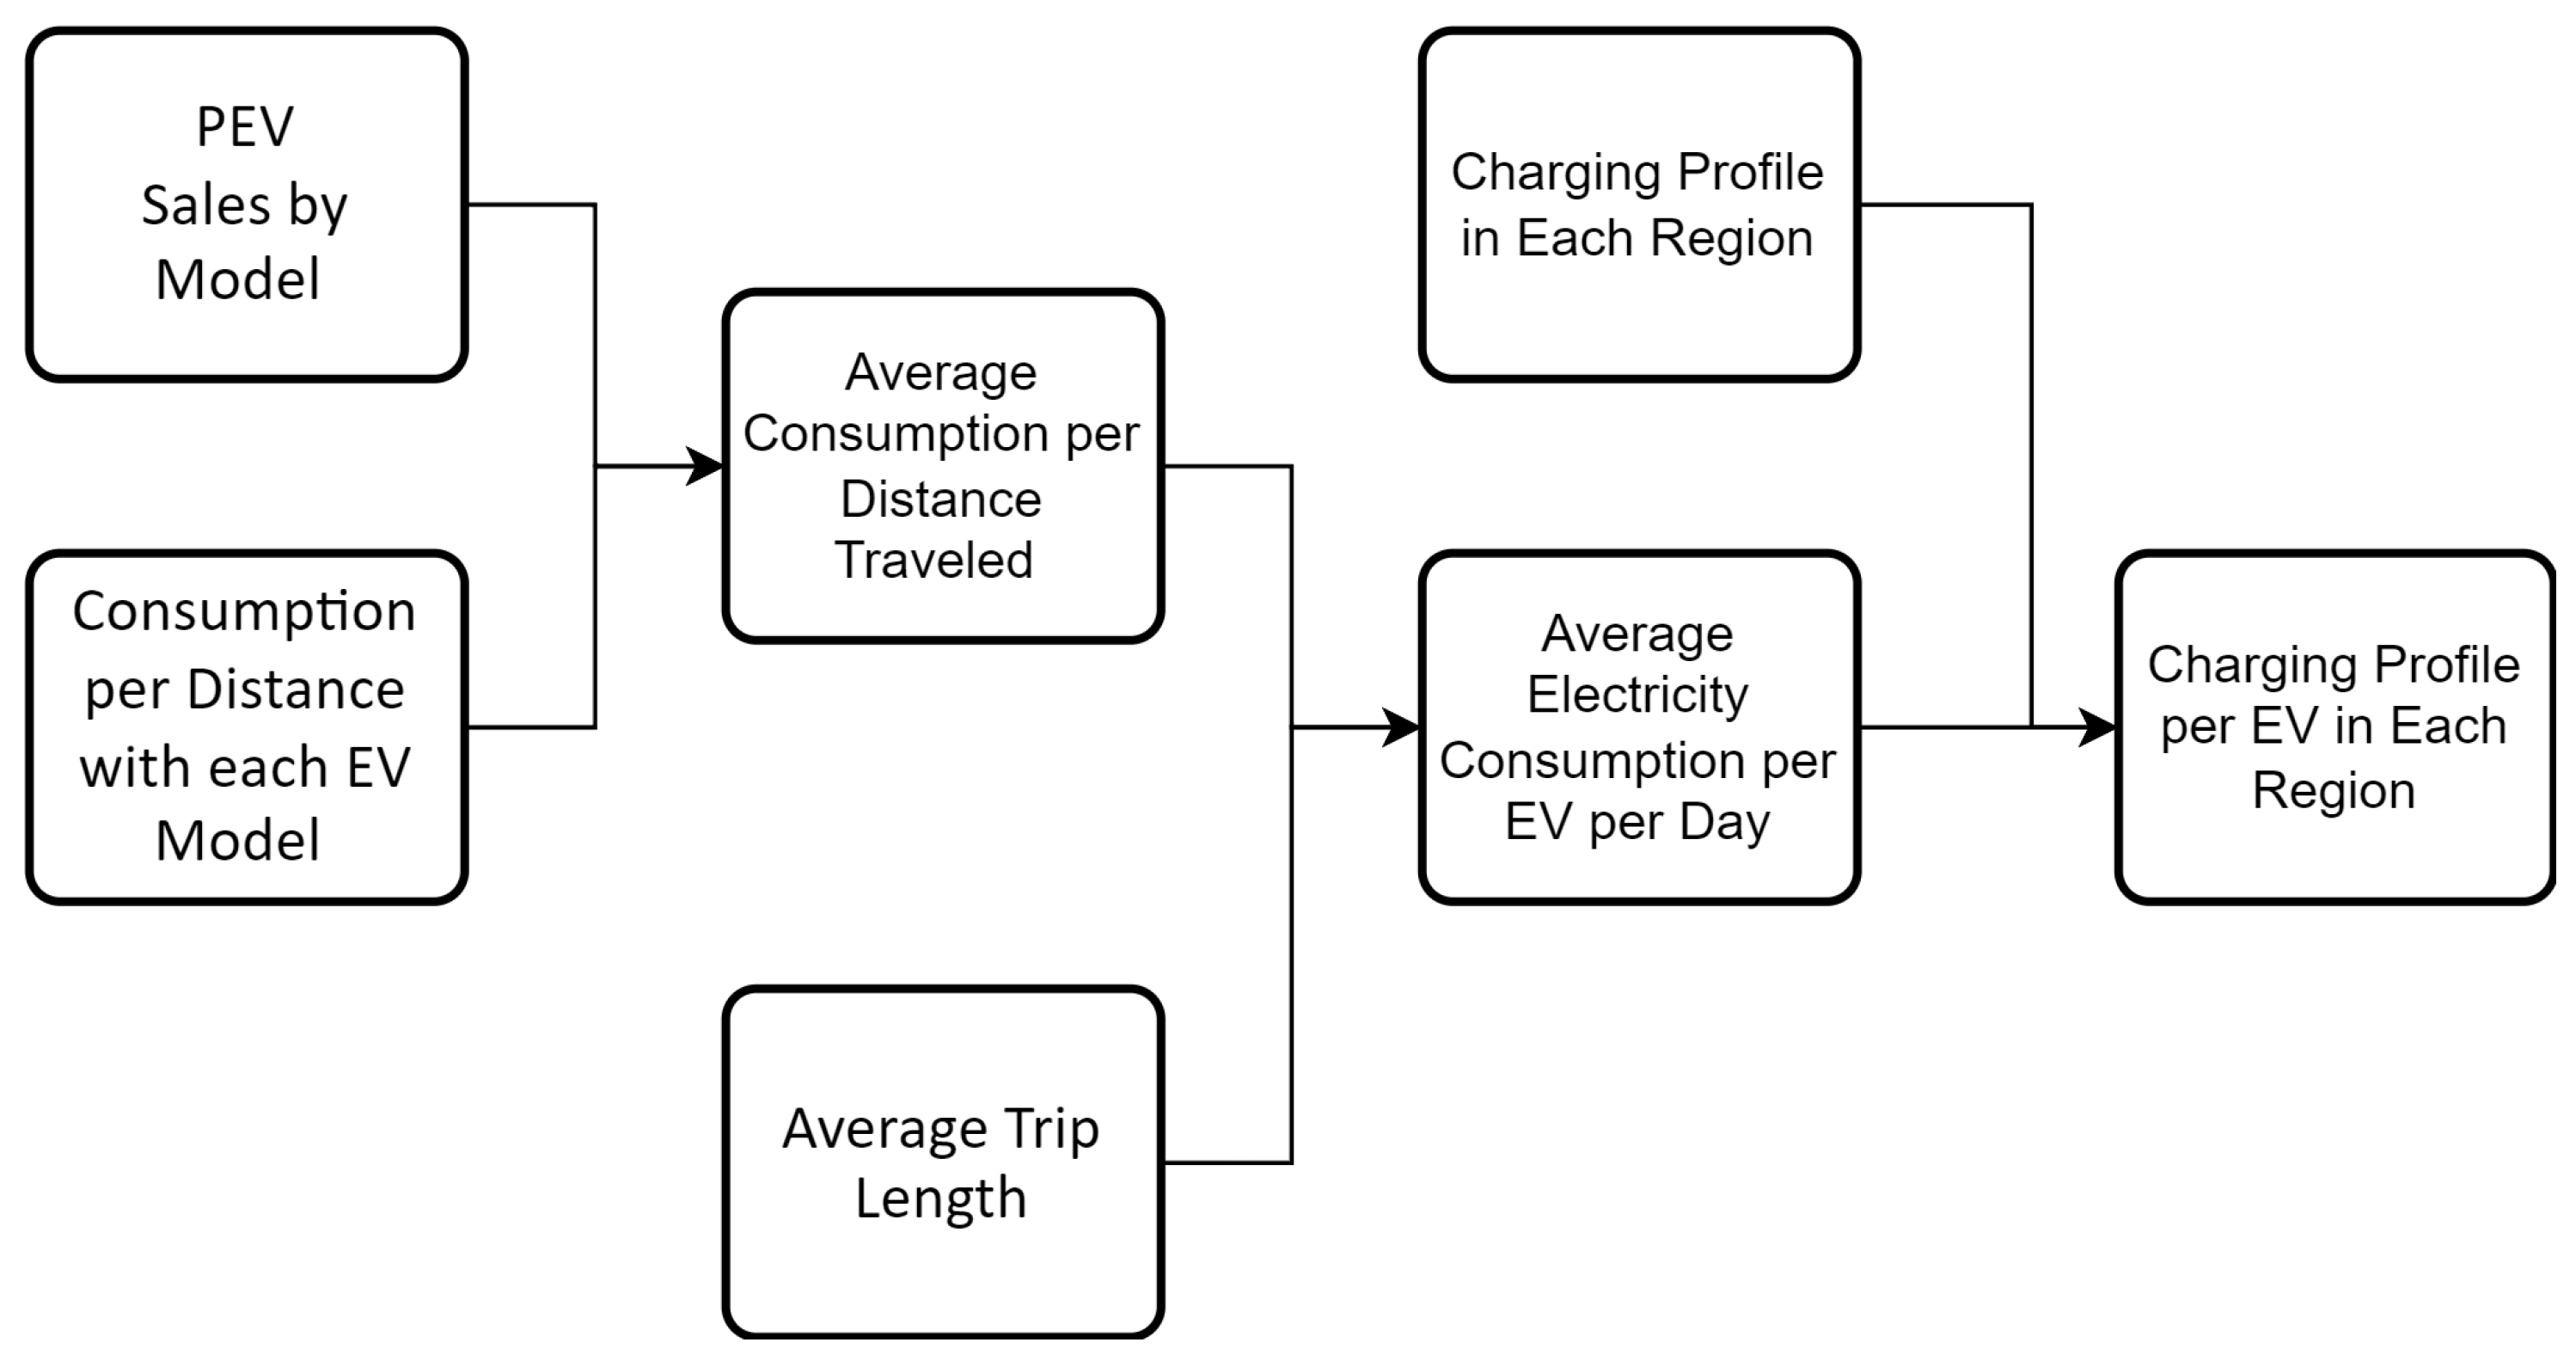
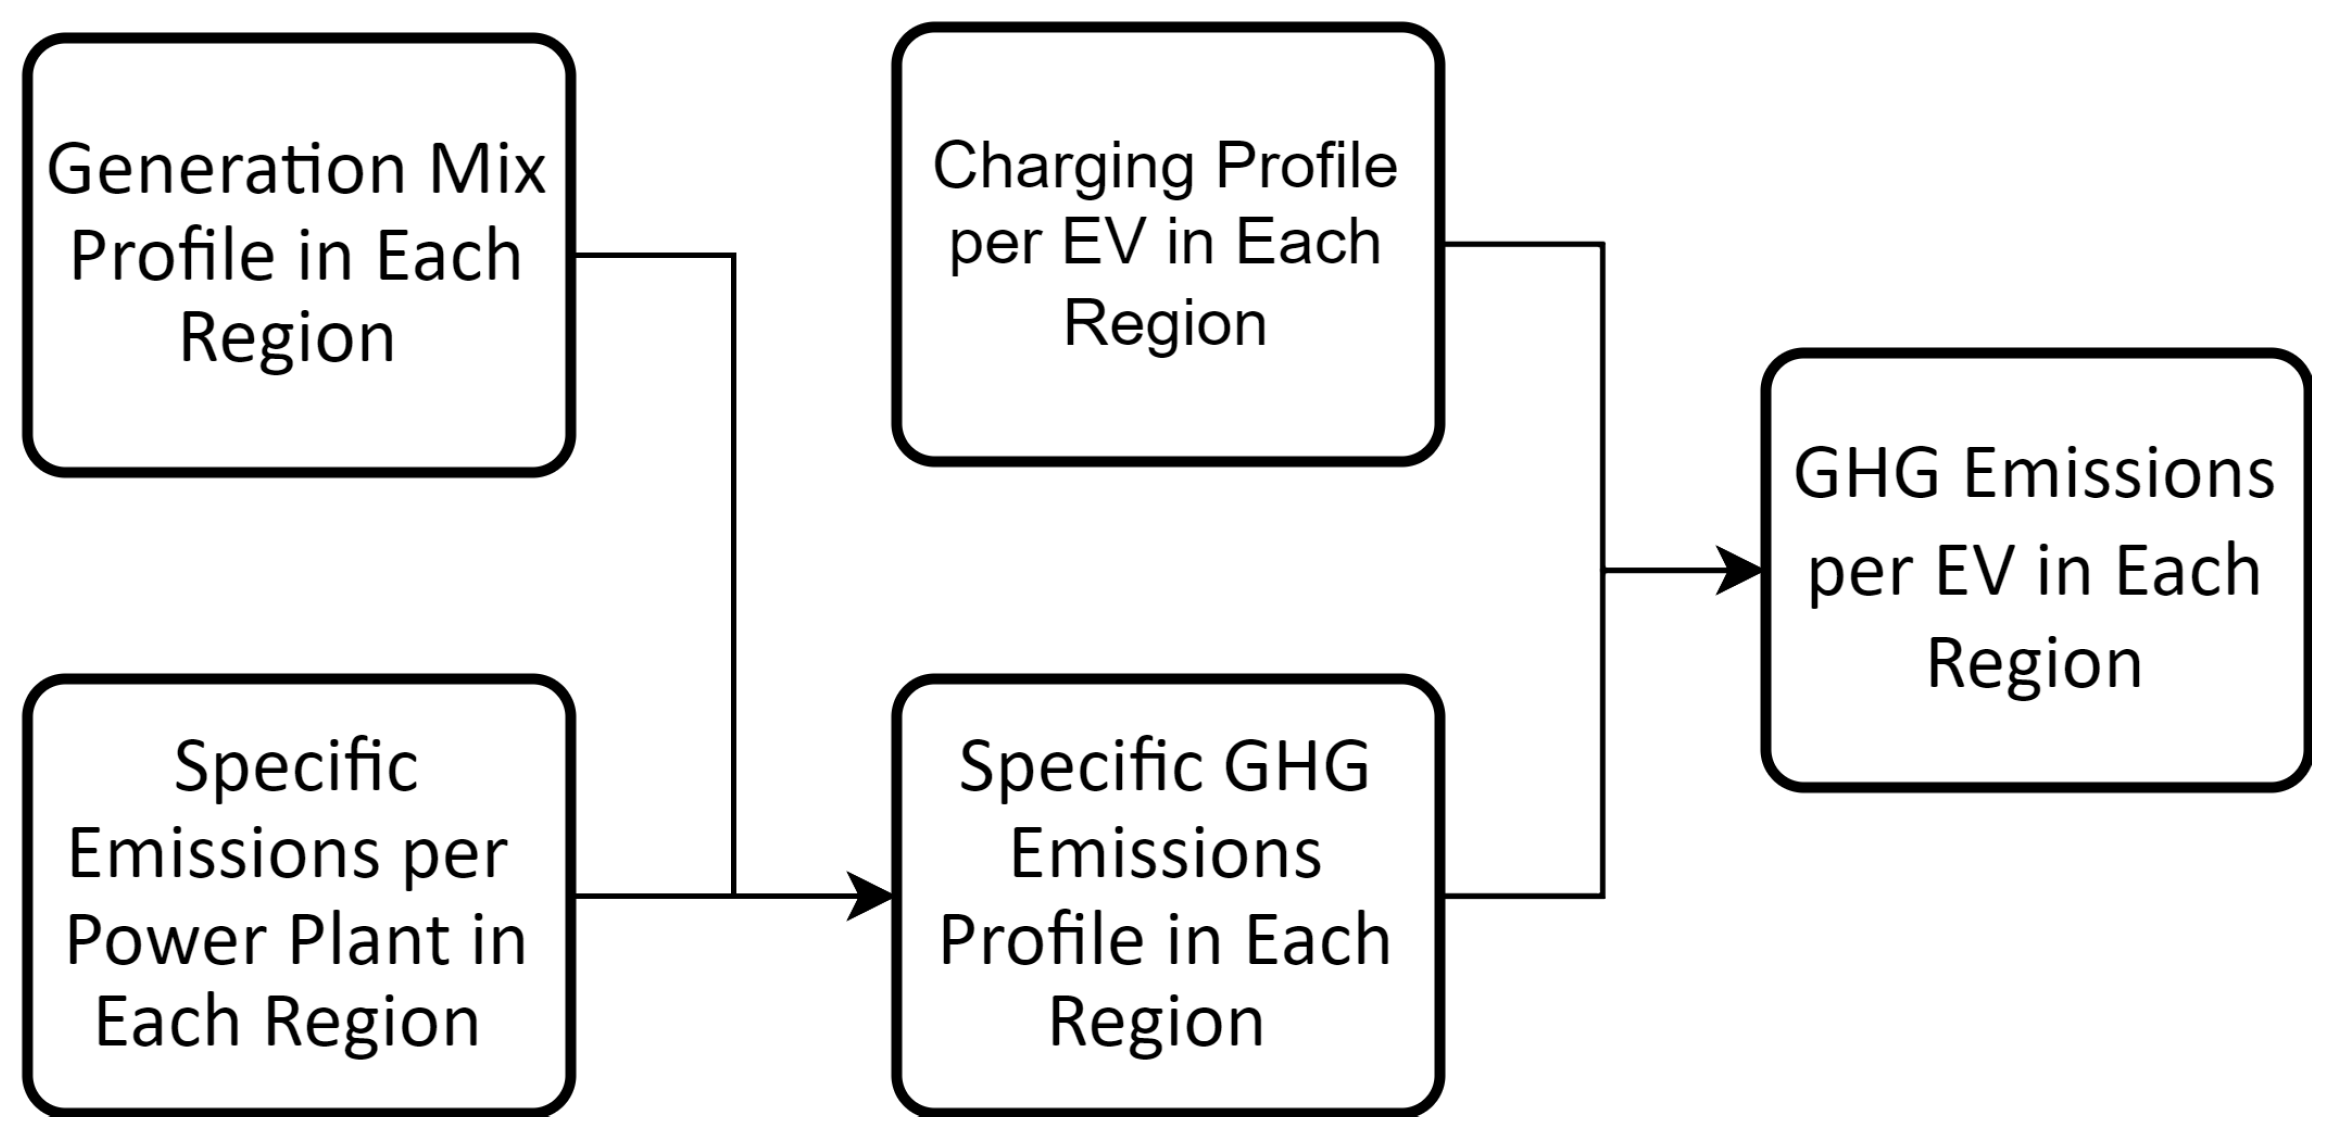
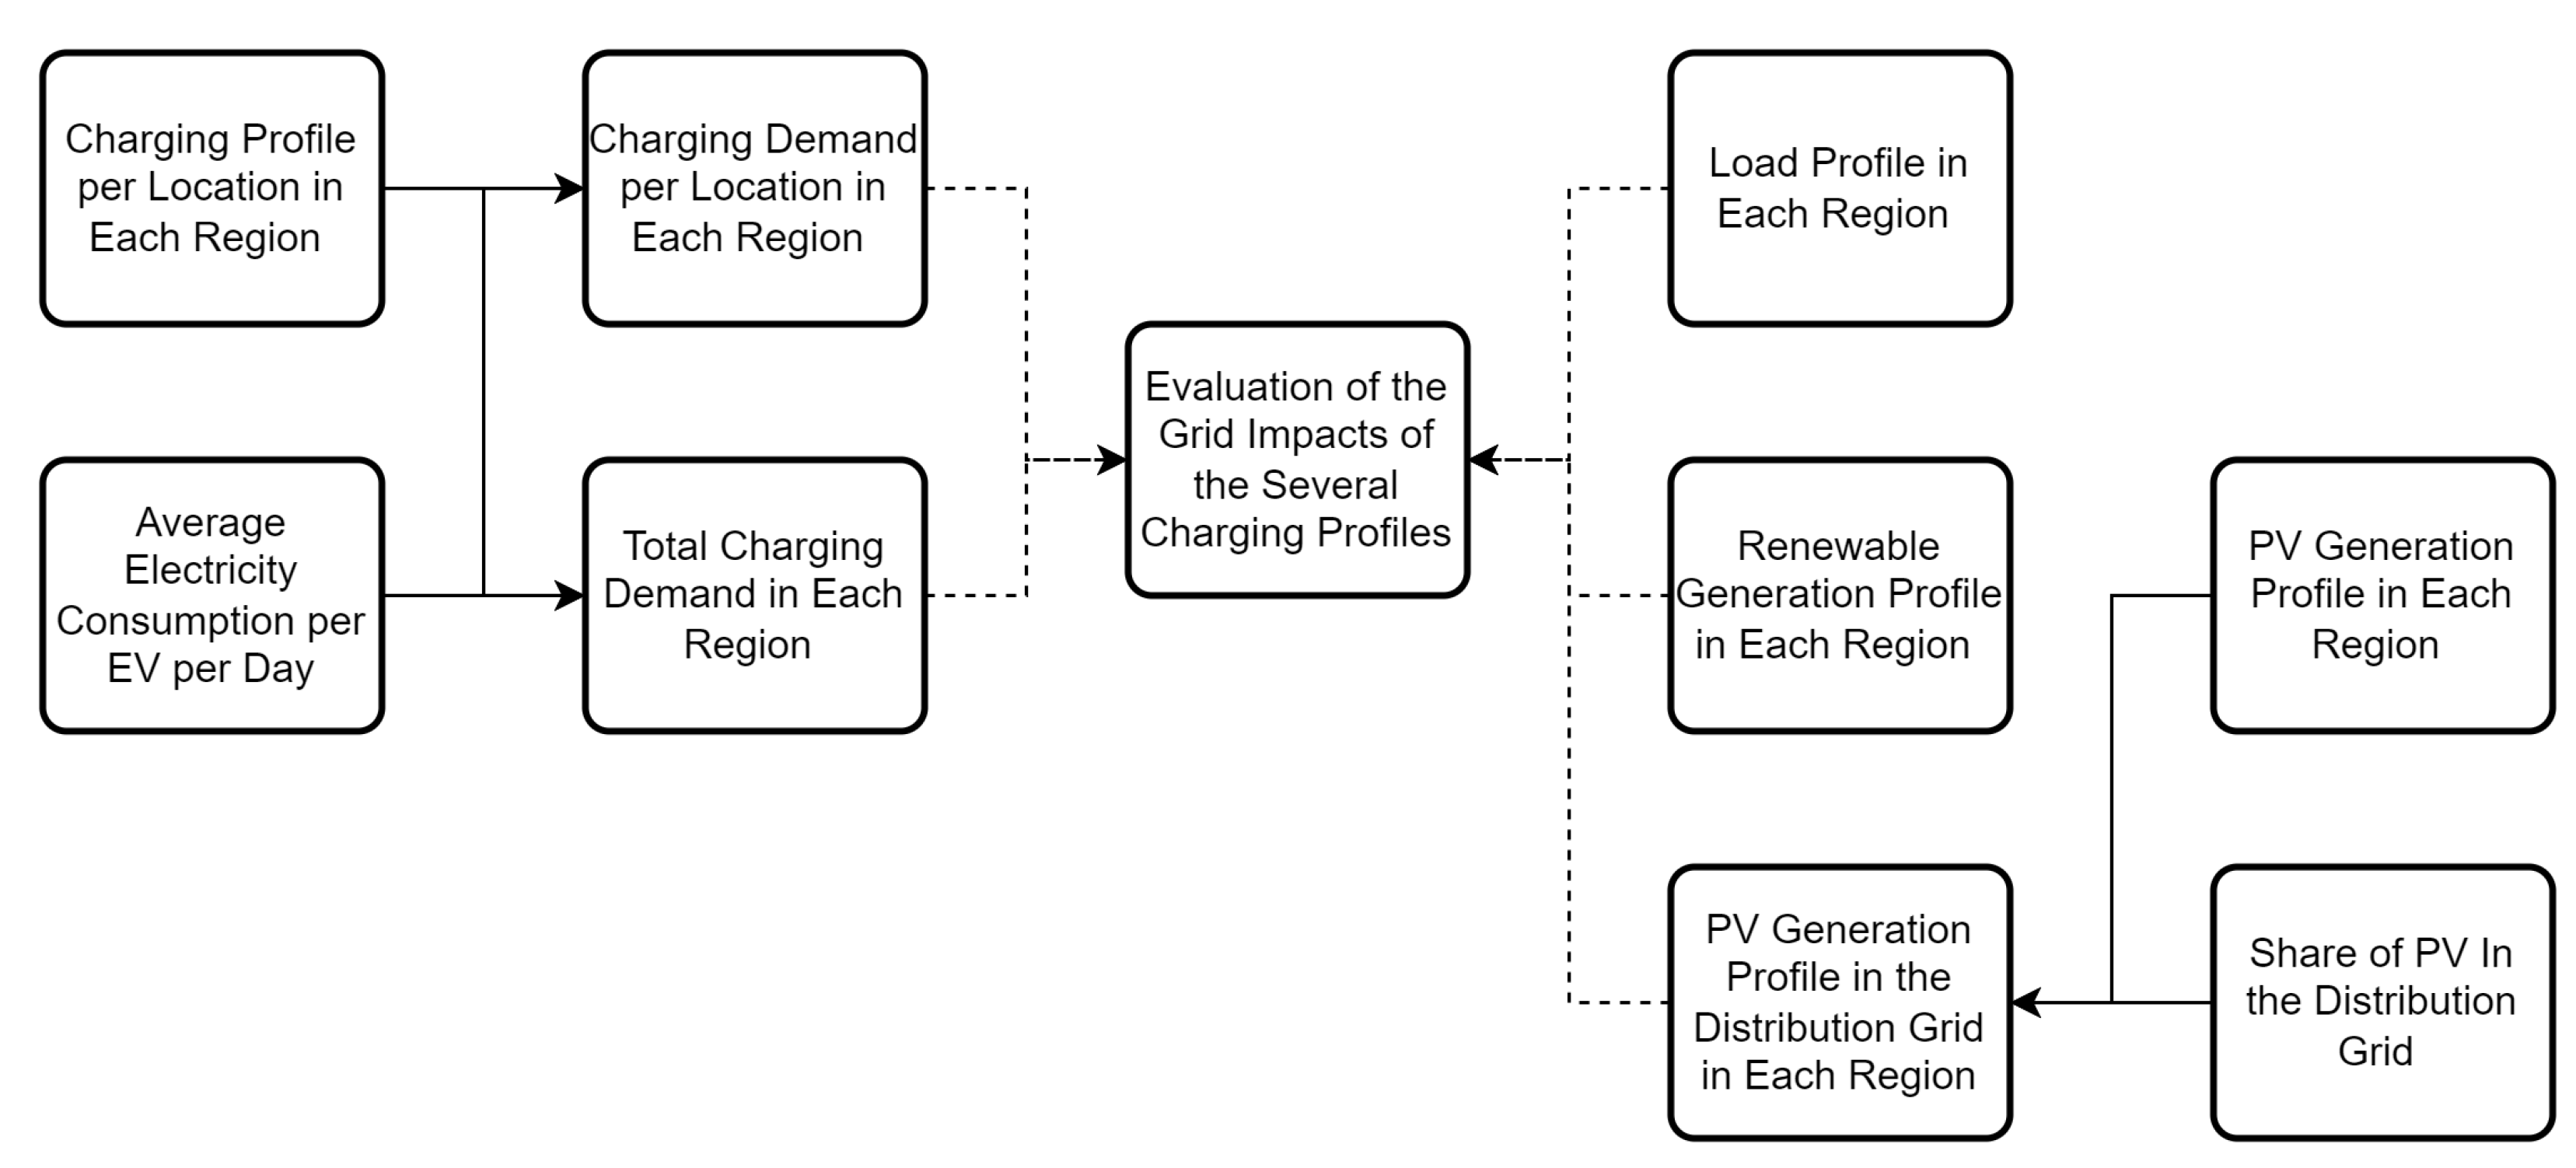
2. Materials and Methods

Several data sources were analyzed to evaluate the impacts of EVs. The references presented in the text after each variable identify the data sources used. Data from 2019 were used to avoid the impact of the pandemic of the 2020s. Specifically, U.S. plug-in electric vehicle sales were considered by model for 2019 [21], being distributed between states in proportion to the actual distribution of state-level EV registrations [22]. The state-level data were aggregated across the 13 balancing regions considered by the U.S. Energy Information Administration [23], represented in Figure 1. For future scenarios, the distribution of EVs was assumed to be correlated with the car registrations by state [24].
EV charging profiles were calculated based on the method presented in Figure 2. EV sales by model, S E V , and total sales of EVs, S T [21], were considered together with the consumption per distance, C D E V (in kWh/km), for each EV model [25] to calculate the average energy consumption per distance traveled. This value was then used together with the average distance traveled per vehicle per day, D T (in km) [26], to calculate the average electricity consumption per EV per day, C D h E V (in kWh/day), using Equation (1). Then, the average uncoordinated charging profiles assessed in different U.S. cities, C P h R (with the percentage of daily consumption that occurs in each hour) [27], were used to assess the charging profiles per EV in each balancing region, C D h E V , R (in kWh), using Equation (2).
C D h E V = S E V · C D E V S T · D T
C P h E V , R = C D h E V · C P h R
In order to be able to evaluate the GHG emissions associated with charging at different times and locations, the average daily variation in GHG emissions in each balancing region was used, as presented in Figure 3. The specific GHG emission profile in each region was assessed considering the average generation from each power plant in each hour, G h P P (in MWh), in each region [28], the total generation, G h T (in MWh), and the specific GHG emissions per power plant in each region, G H G P P S (in kgCO 2 /MWh) [29]. The assessment was carried out from the point of view of the generation in each region and not from the point of view of the demand, ignoring the potential impact of interconnections. Then, combining such data with the charging profiles per EV in each balancing region, the GHG emission profiles per EV in each region, G H G h E V , R (in kgCO 2 /MWh), were obtained, using Equation (3). The future profiles of GHG emissions were assessed considering the same method, but updating the data for the future generation mix in each region [30].
G H G h E V , R = G h P P · G H G P P S G h T · C P h E V , R
In the evaluation of the impact on the electrical grid, different charging profiles were used and matched with the renewable generation and demand profiles, as presented in Figure 4. The uncoordinated charging profiles per charging level from different U.S. cities (with the percentage of daily consumption that occurs in each hour) [27] were used to extract the charging profiles per location (considering home, work, and public charging) in each region, C P h L , R . Such profiles, C P h L , R (with the percentage of the daily energy demand that occurs in each hour), together with the electricity consumption per EV per day, C D h E V (in kWh/day), and the considered number of EVs per region, E V R , allowed to evaluate the charging demand per location in each region, C D h L , R (in kW), using Equation (4), as well as the total charging demand in each region, C D h R (in kW), using Equation (5) (taking L the value of 1, 2, and 3 for home, work, and public charging, respectively).
C D h L , R = C D h E V · C P h L , R · E V R
C D h R = L = 1 3 C D h L , R
The profiles for the charging demand per location in each region and the total charging demand in each region were then compared with the load profiles in each region, as well as with the profiles of renewable generation in each region [28]. The charging profiles were also compared with the solar photovoltaic (PV) generation profile at the distribution grid level, using the PV generation profile in each region [28] and the share of PV connected to the distribution grid [31]. The future profiles were also derived considering the defined projections for the future generation mix (capacity by power plant type) and demand of the U.S. Energy Information Administration [30], assuming a variation in the generation and demand during the year proportional to the actual variation.

3. Results

The presented methods and data were utilized to assess the electricity demand associated with EV charging, and the resulting impacts on GHG emissions and the operation of the electrical grid.

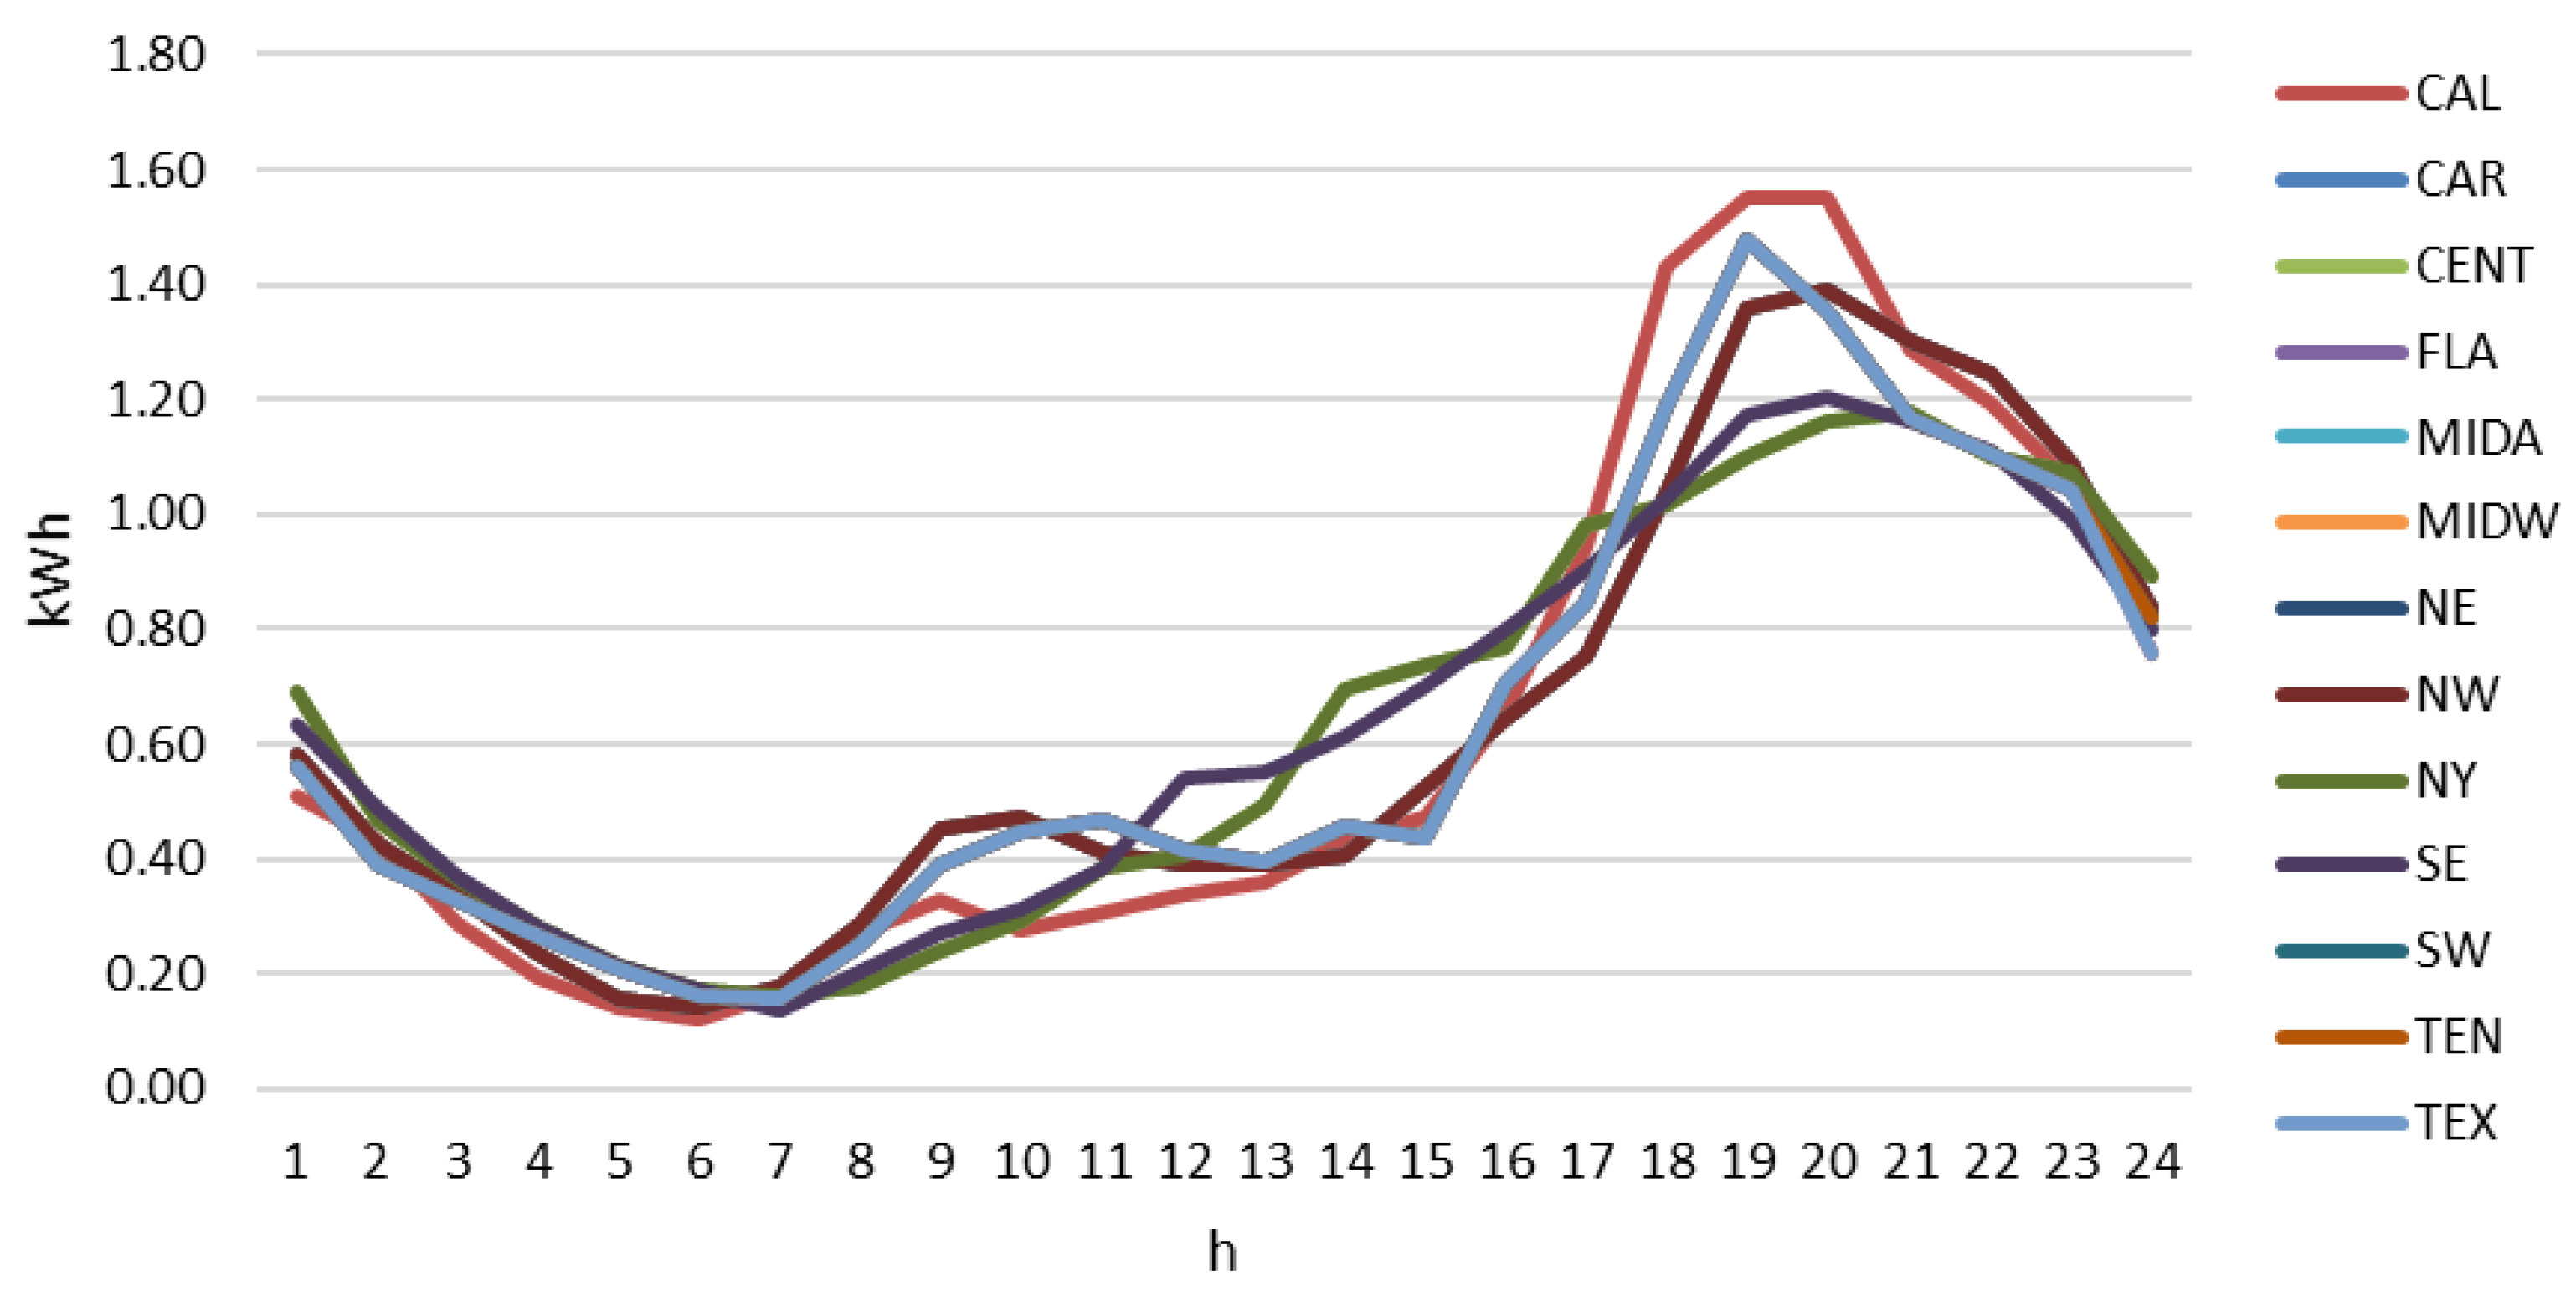
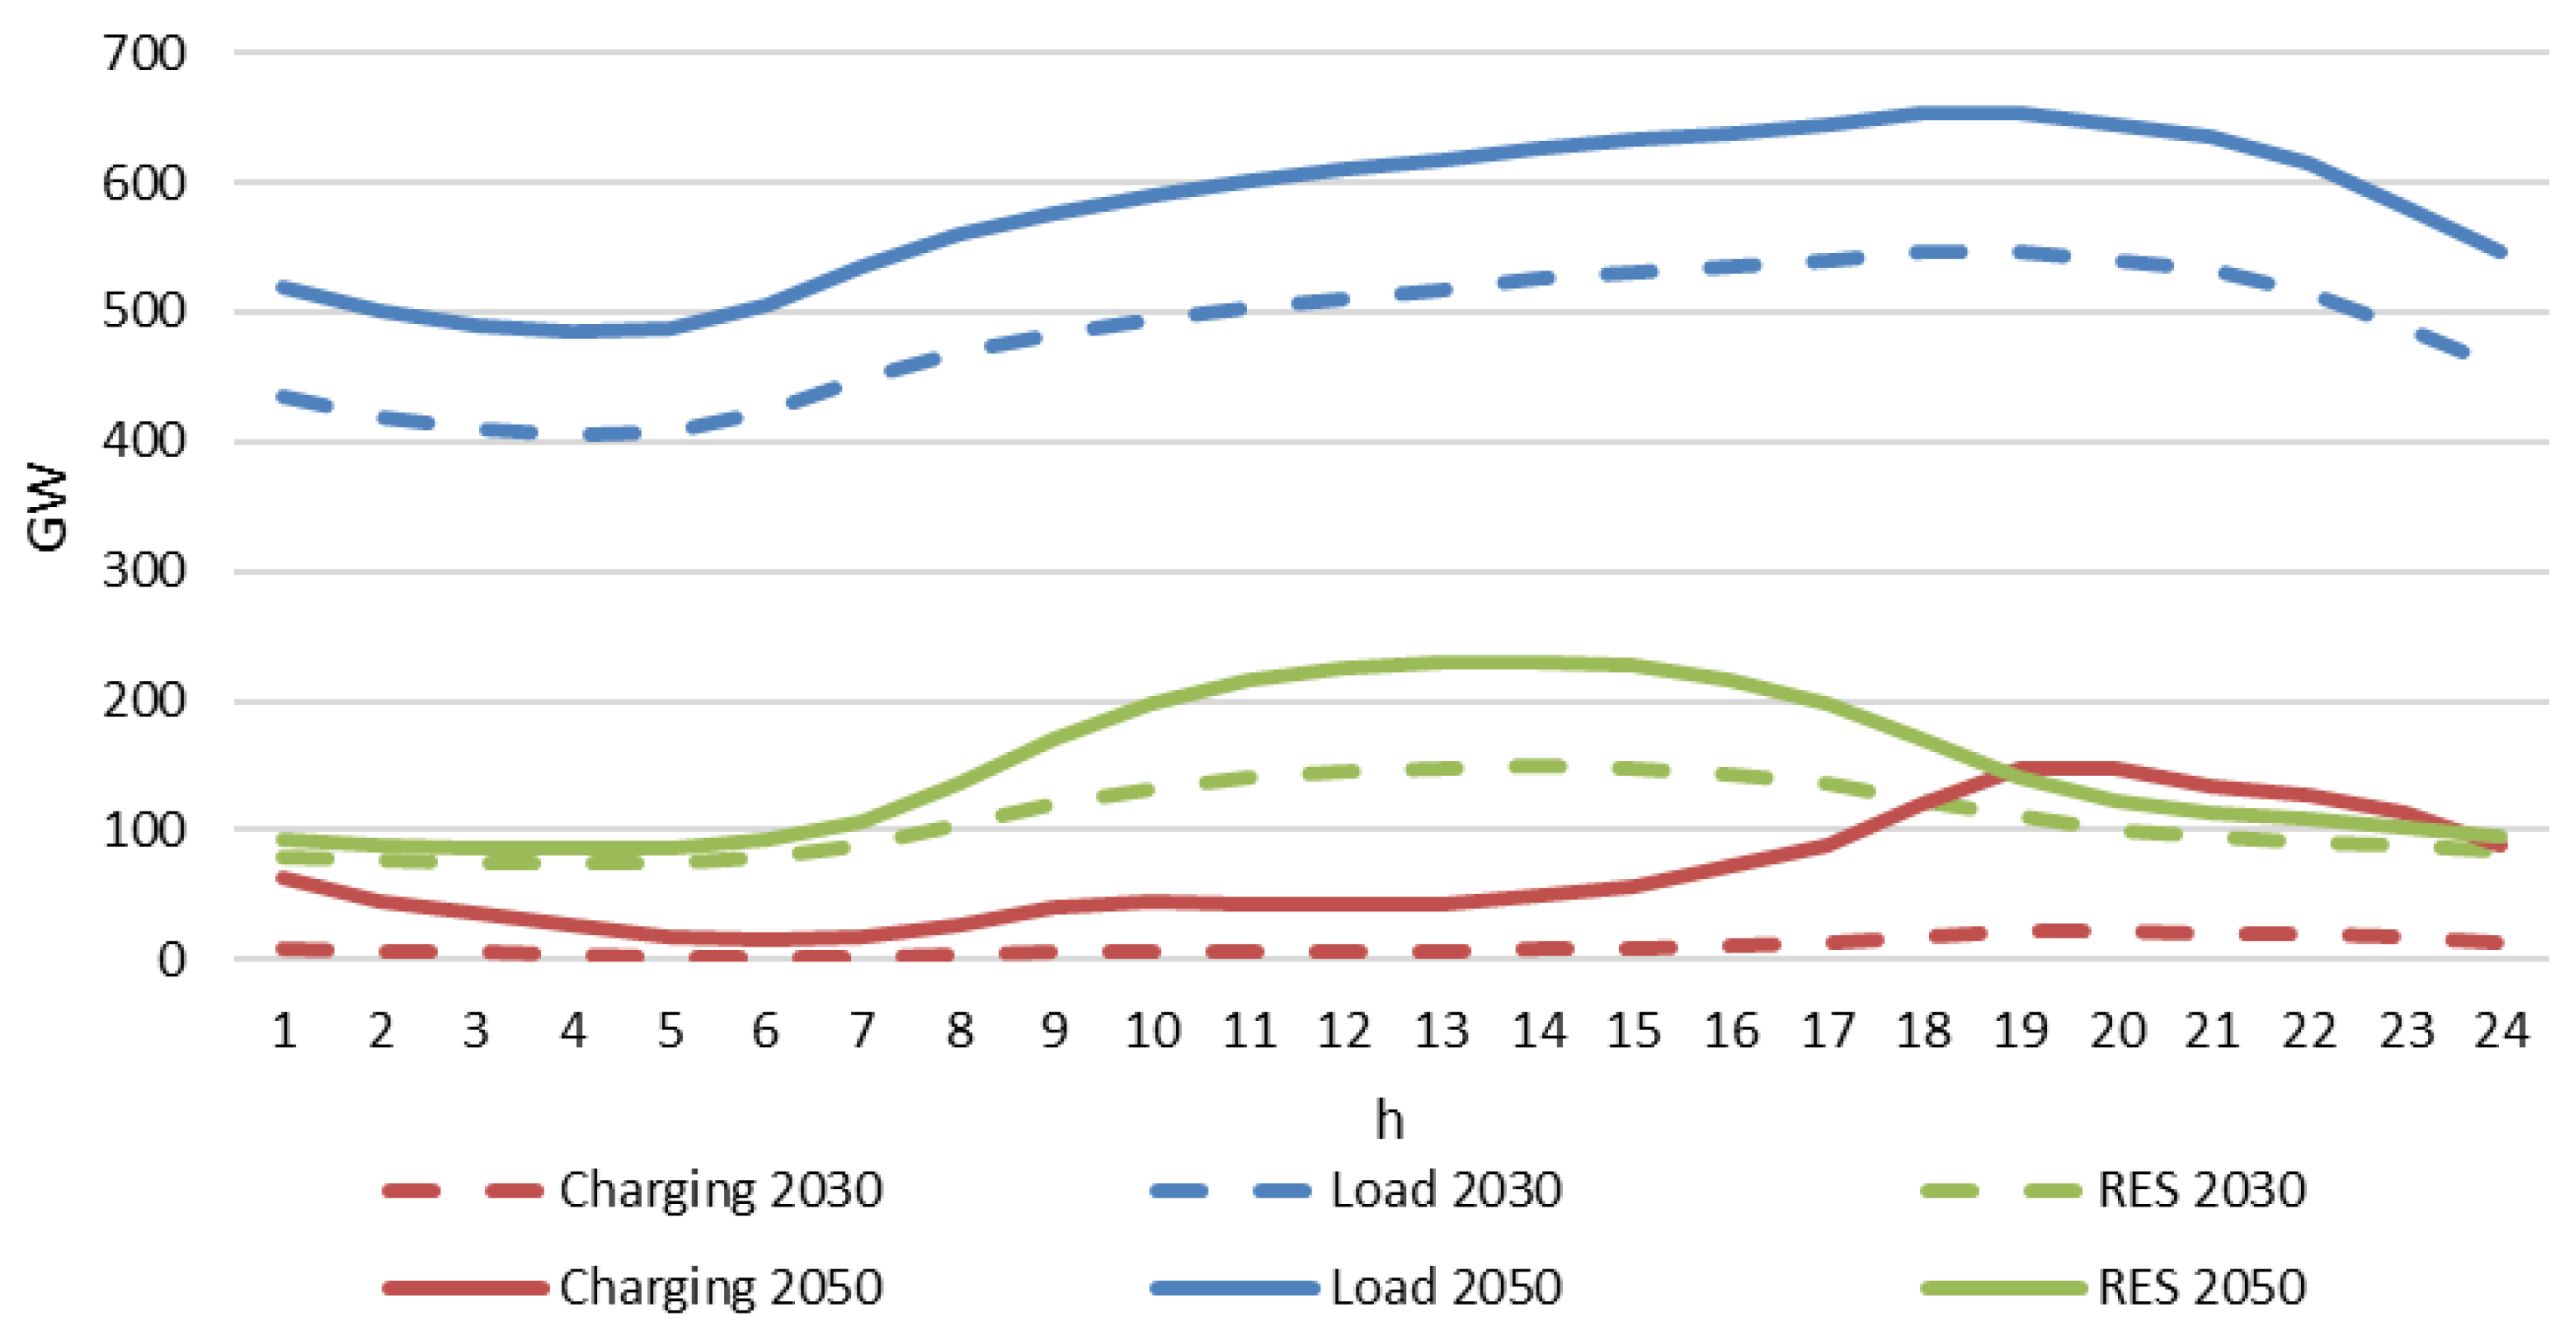
3.1. Electricity Demand
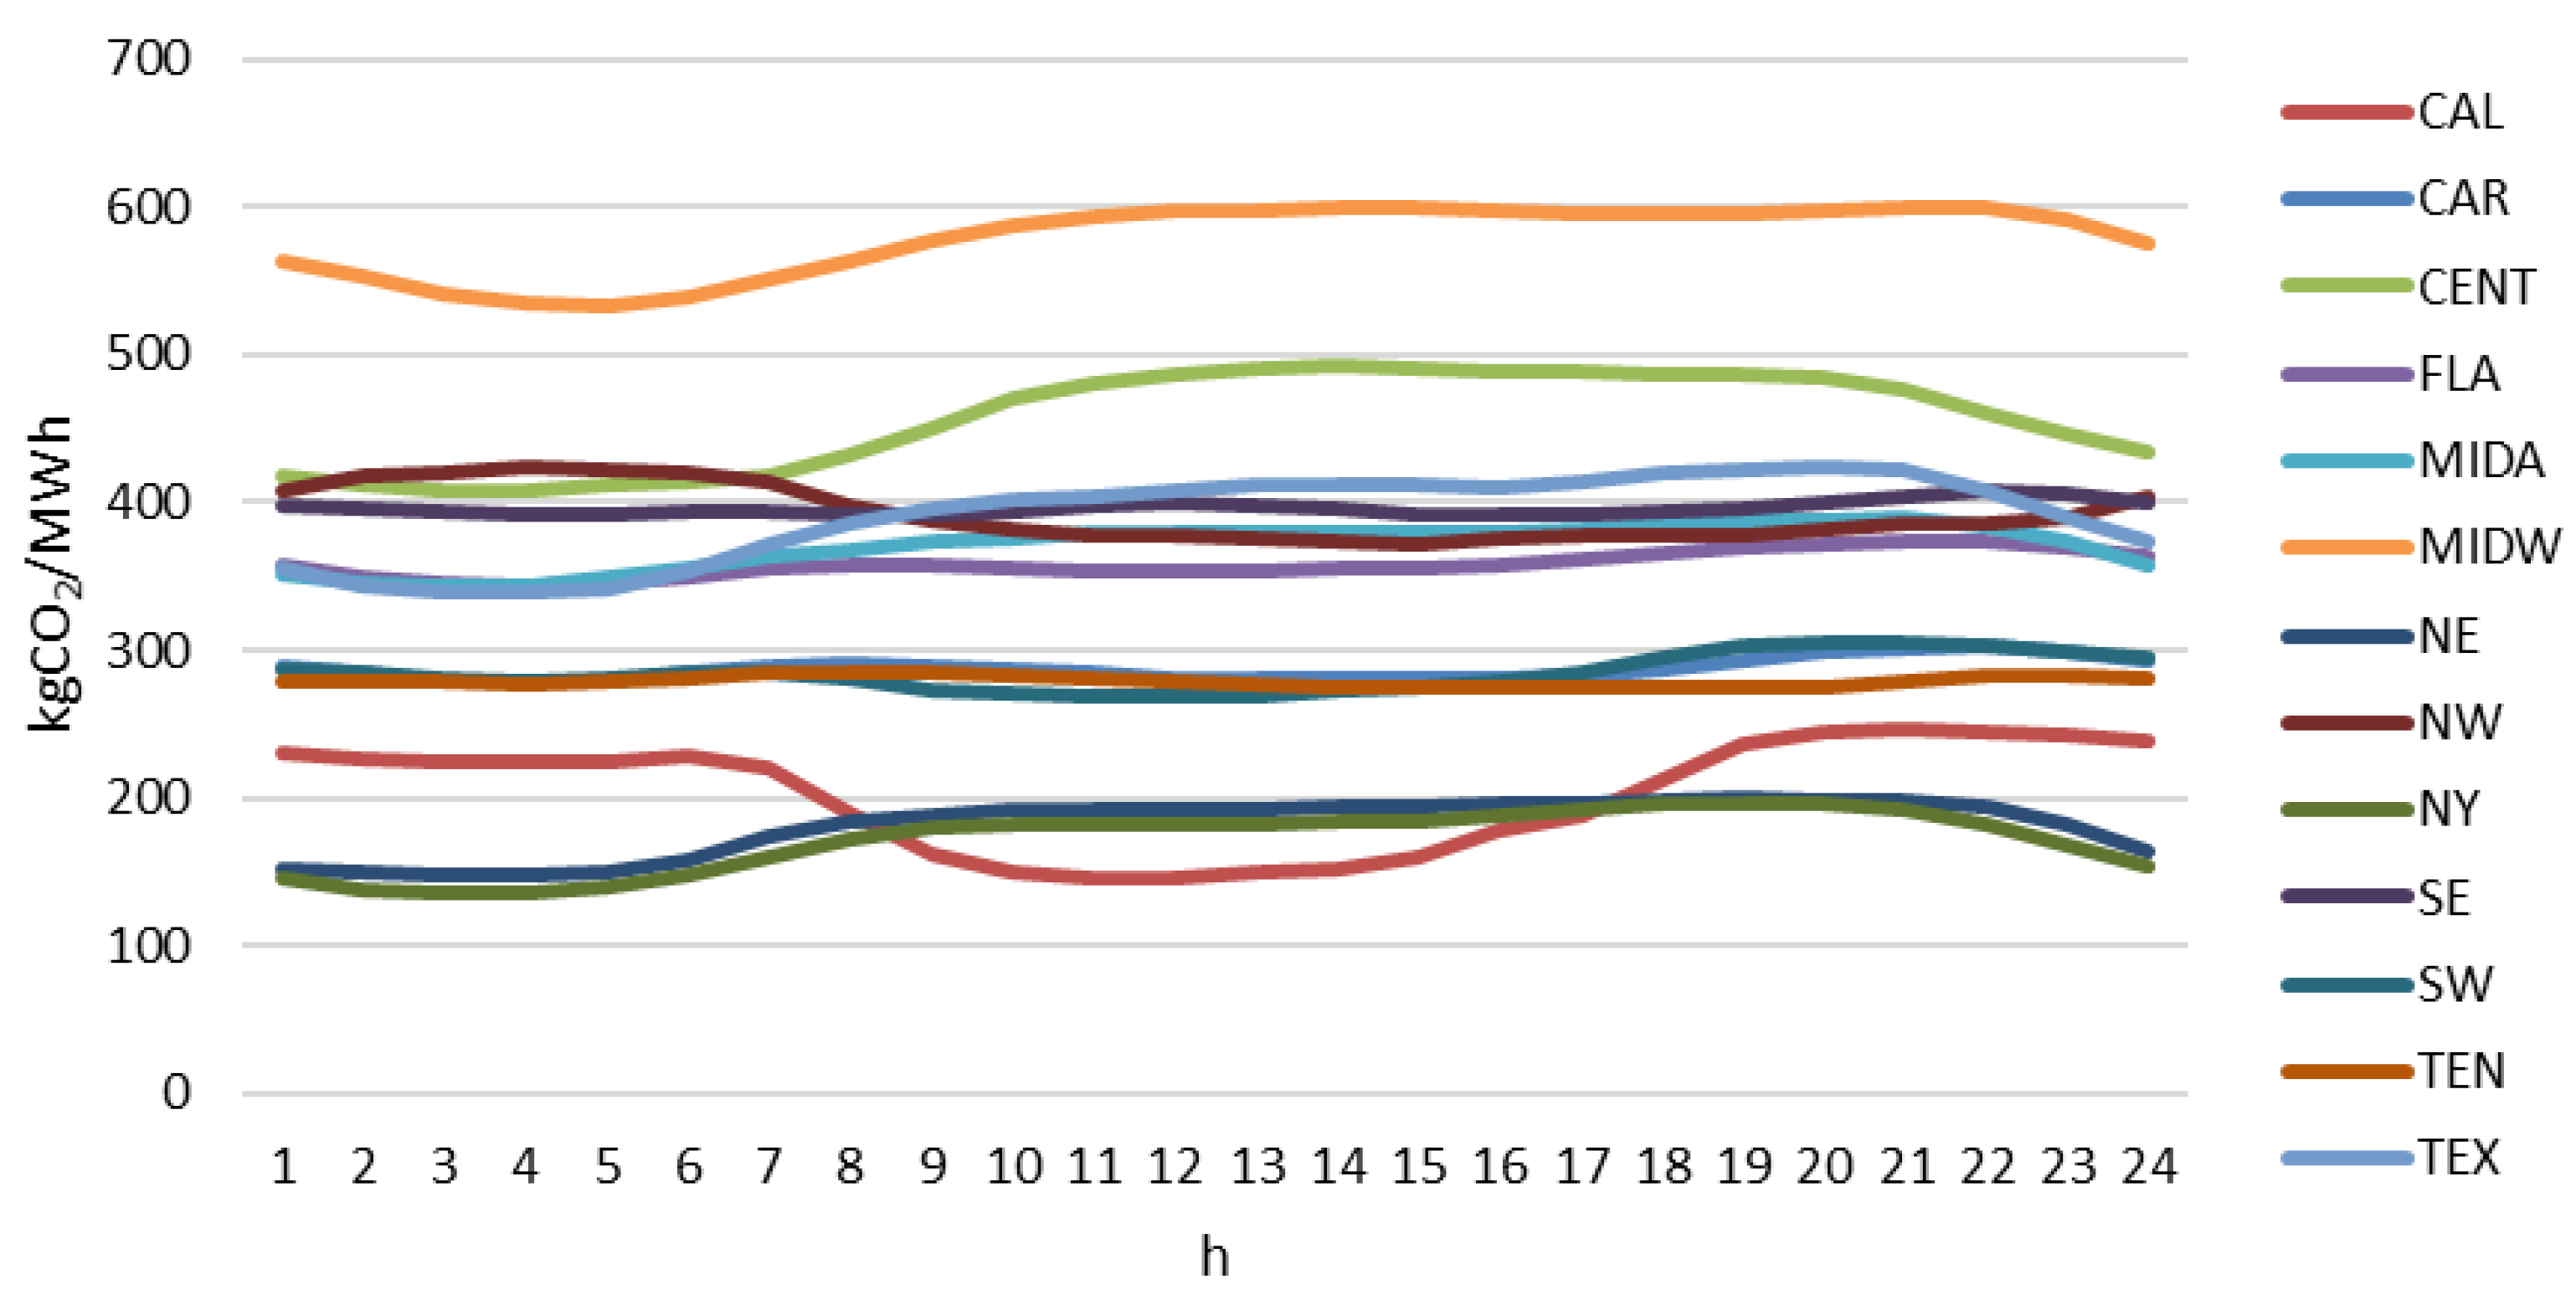
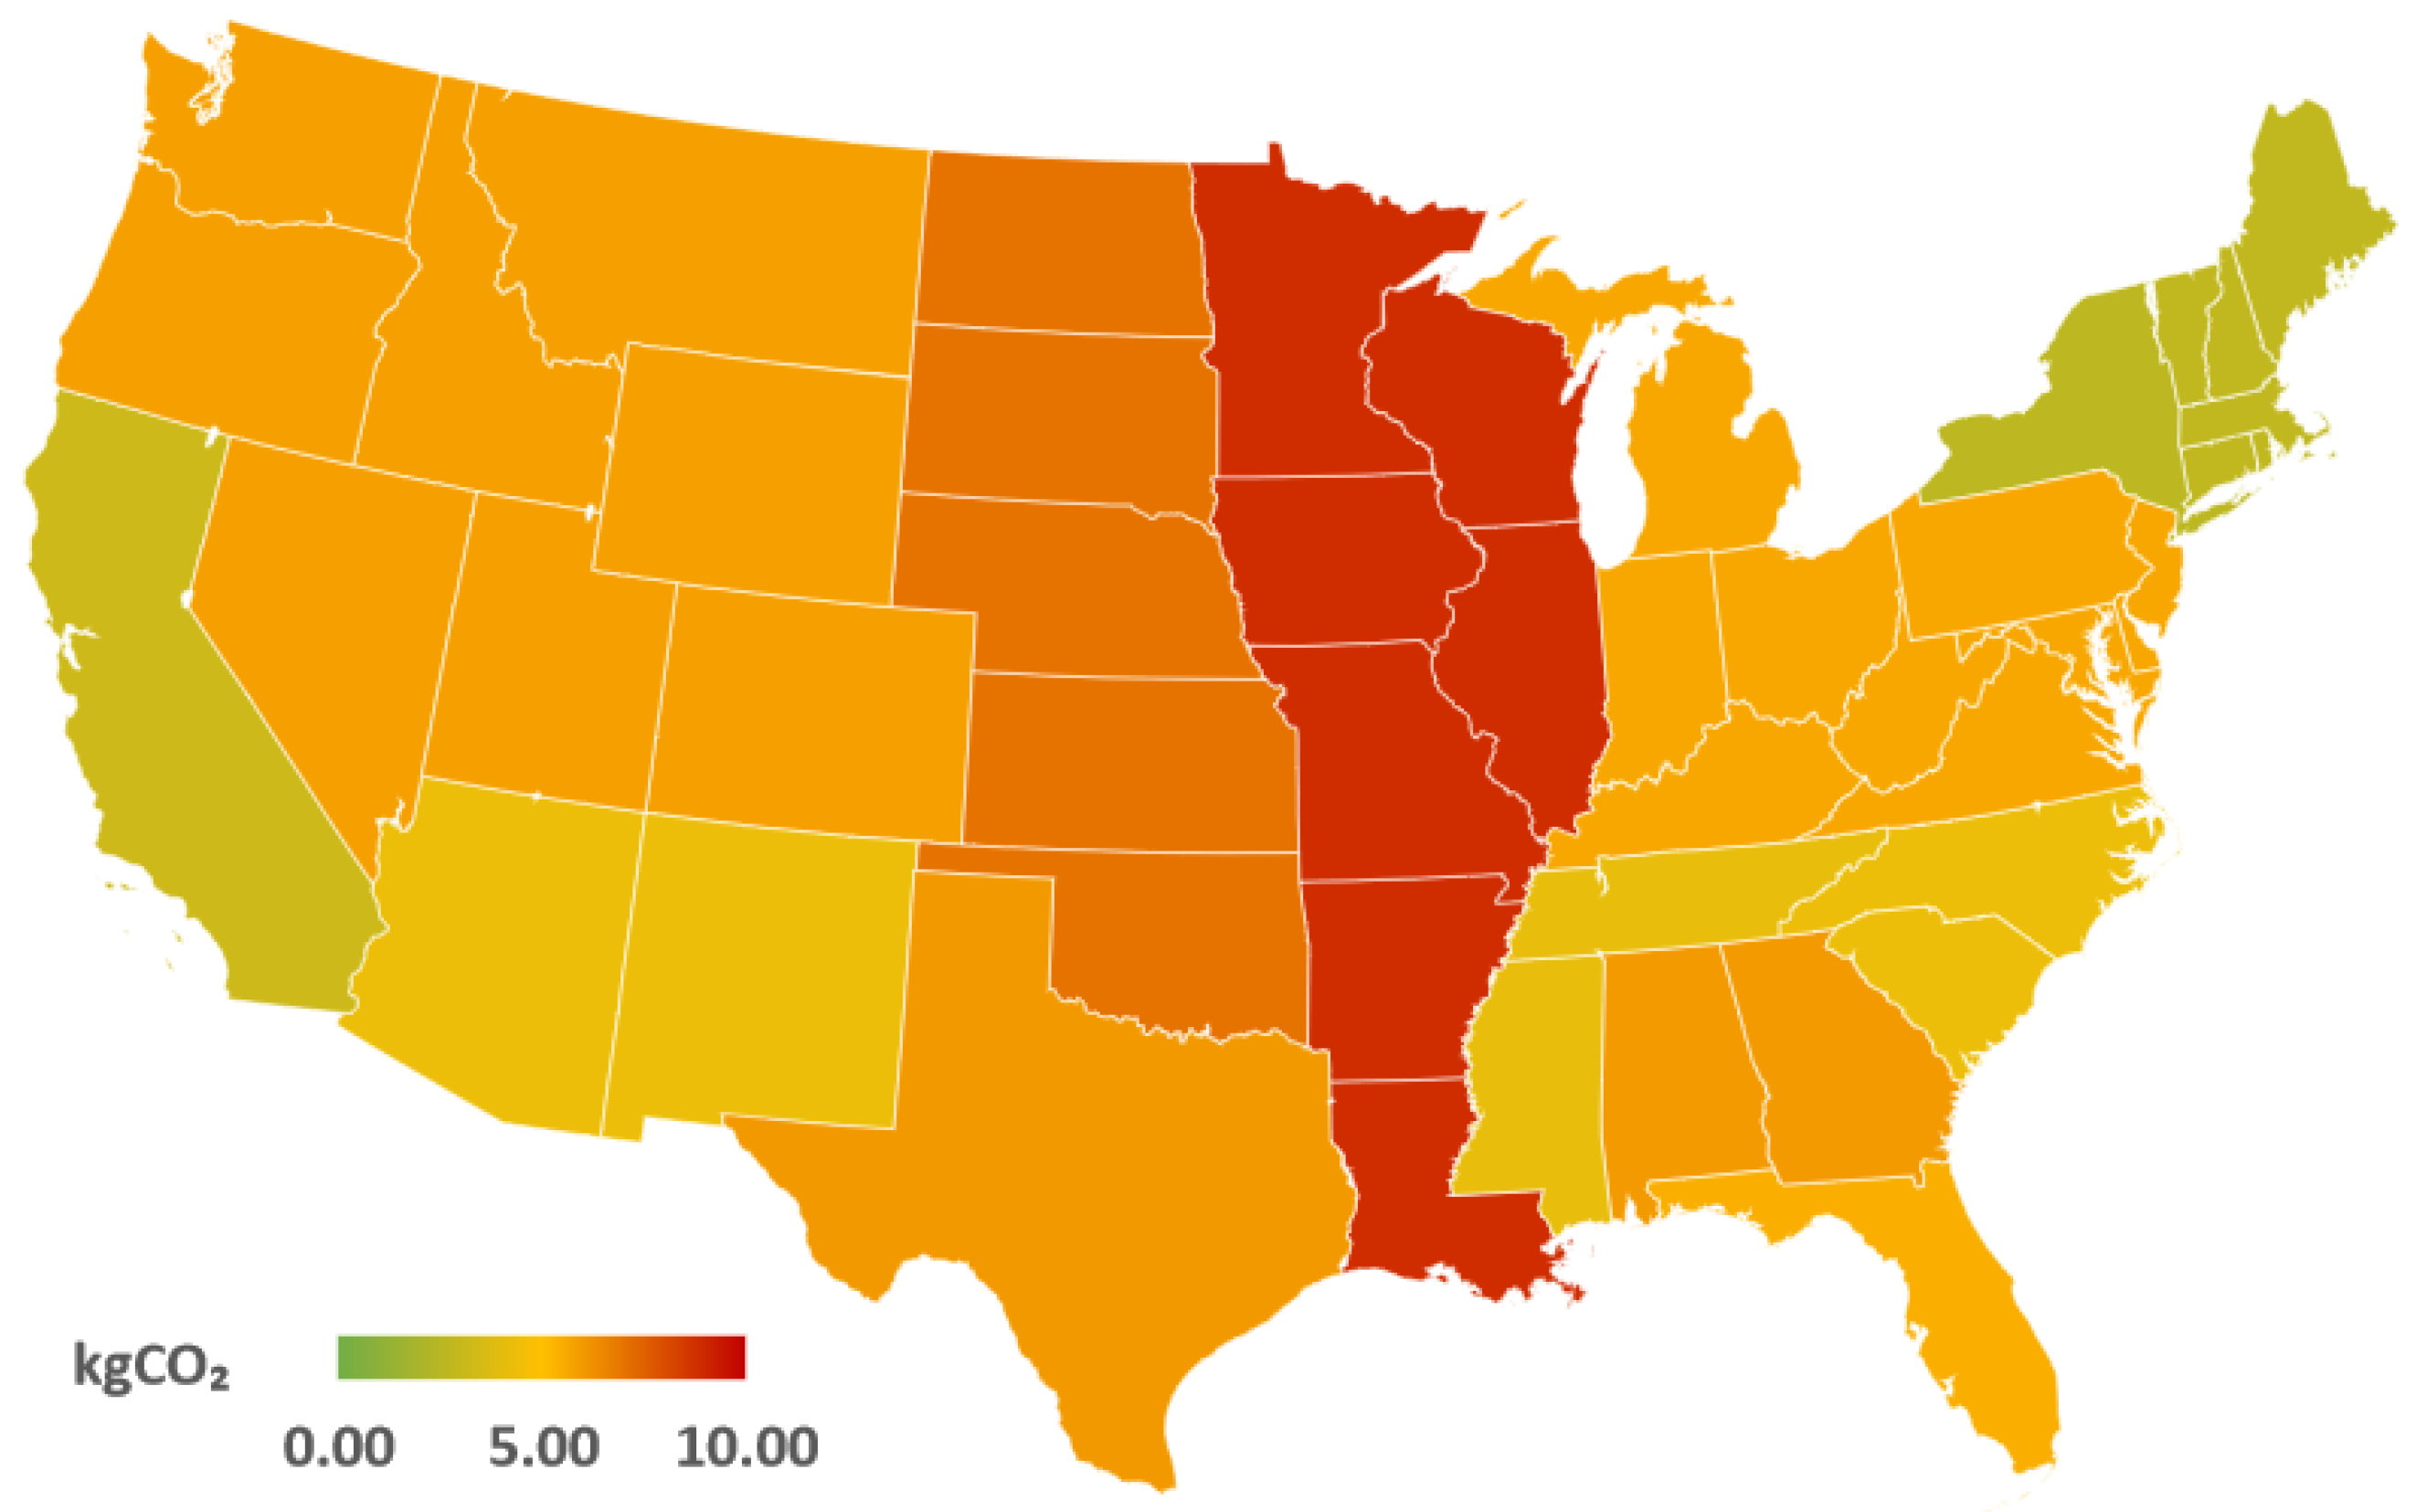
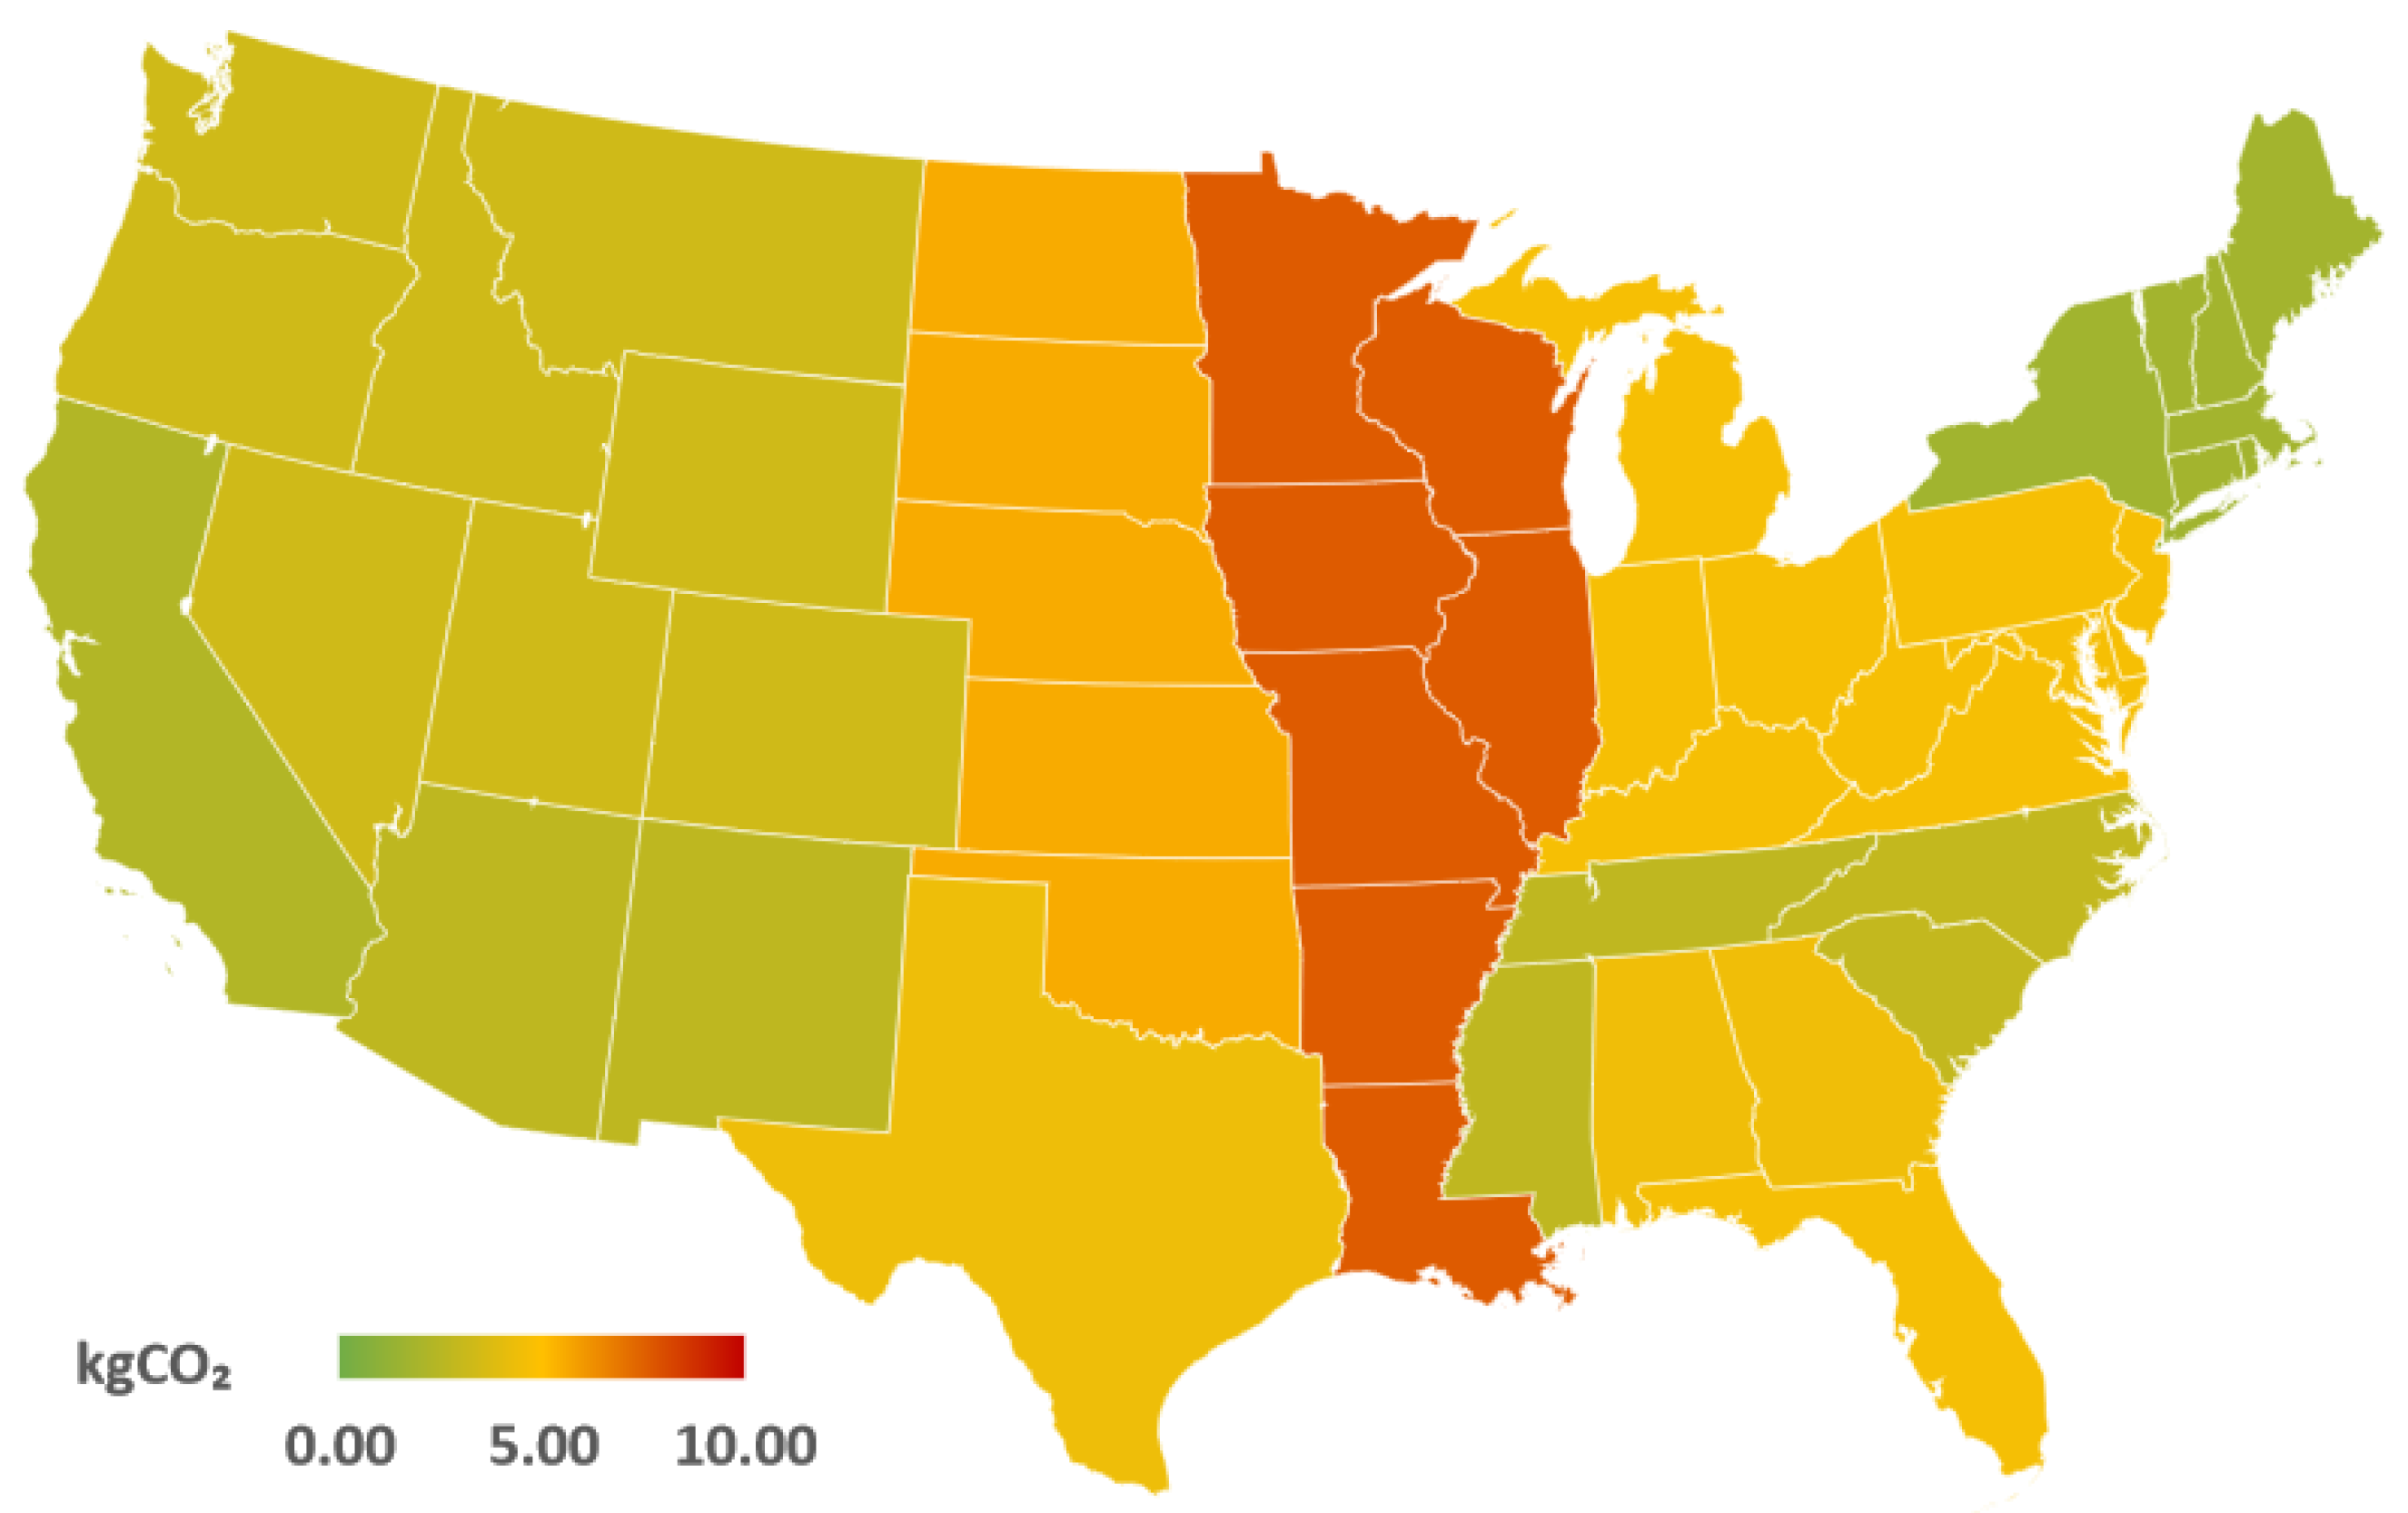
This paper considers the EV registrations by state and distributes the increase in EV sales proportionally between the 13 balancing regions. The current distribution of EVs was considered for evaluating the present impacts. However, for future scenarios (2030 and 2050), the actual distribution of all cars was holistically considered.
The values of the energy consumption per distance range from 16 to 47 kWh/100 km, using the weighted average energy consumption (19.15 kWh/100 km) considering the share of the sales associated with the electricity consumption for each EV model, since the objective is to evaluate the aggregated impact of all integrated EVs and not the impact of each EV option. The average vehicle distance traveled per vehicle is considered as 78.55 km/day, requiring an average electricity consumption of 15.04 kWh/day (given by Equation (1)). The real distance traveled can present different average values between the regions, but there are no reliable data to calculate this for each region.
Figure 5 illustrates the considered EV charging profiles in each balancing region, obtained with the methodology presented in Figure 2, using Equation (2). Each profile represents the average charging of one EV with a demand of 15.04 kWh/day. There are no major differences between the regions, with the charging mainly concentrated in the late afternoon and evening.

3.2. GHG Emissions

Figure 6 presents the average daily variation in the specific GHG emissions in the 13 balancing regions, obtained with the methodology presented in Figure 3, using Equation (3). The evaluation considered monthly average data for the generation mix and demand, but since there are no major variations during the year in most regions, to ensure a more compact and comprehensive visualization the figures present the yearly average. The broad variation between the regions is worth mentioning, e.g., the average emission in the Midwest is 3.37 higher than in New York. Most profiles do not present a significant variation during the day, except for Tennessee and Central regions.
The charging profile does not lead to a considerable difference in GHG emissions in most regions. Therefore, emissions patterns (Figure 7) associated with the charging of one EV in each region are nearly proportional to the charging profiles (Figure 5). However, it is expected that an increase in PV penetration will lead to higher availability of renewable generation during sunshine hours, decreasing emissions during such a period.
Figure 8 presents the daily GHG emission due to a typical charging schedule of an EV in 2019. This assessment accounts for (i) a typical charging profile of EVs in each region, (ii) generation mix, and (iii) variation in generation profiles across a year. The model can also accommodate multiple scenarios, either at the regional level or based on different targets. Figure 9 presents the results of a similar study for 2050, based on the current EIA’s prediction for the generation mix in each region [30].
In 2019, only about 19 % of the electricity generation was produced via renewable energy sources (RESs) and 56 % came from carbon-free sources (i.e., RESs and nuclear combined) [28]. This generation mix means that providing the daily energy needs of each EV results in the production of 4.45   kgCO 2 . RESs and carbon-free generation are expected to account for 32 % and 67 % of the generation mix by 2030 and 2050 [30], respectively. This translates to the production of 4.45   kgCO 2 to cover the daily energy needs of each EV. By 2050, RESs and carbon-free generation are expected to account for 38 % and 75 % , respectively, leading to the production of 4.24   kgCO 2 due to the daily charging of each EV.
Despite the larger share of carbon-free generation, the average emissions will stay the same in 2030 and decrease only 5 % in 2050. This is the consequence of a different distribution of EVs between regions. The data from 2019 assume the current distribution of EVs (mainly concentrated in California), but the data from 2030 and 2050 consider the current distribution of all cars. Therefore, in such a scenario, the benefits of the generation mix are mitigated by the disparities between regions. Regarding the GHG emissions of the typical EV charging in the different regions, the highest values are in the Midwest, and the lowest are associated with New York. In 2019, the average GHG emissions were 3.12 times higher in the Midwest than in New York, and this ratio will increase to 4.45 in 2050.

3.3. Electrical Grid

The impact of EV adoption on the electrical grid was assessed using the method presented in Figure 4, with the charging profiles resulting from Equations (4) and (5). This assessment accounts for a wide range of future EV penetration scenarios, including the target of 50 % EV sales share in 2030 [3], which can potentially lead to 15 % EV share compared with the total registered vehicles in 2030. The next major milestone is to achieve 50 % of the registered vehicles by 2050.

3.3.1. Bulk Power Grid

The increasing penetration of EVs will impact total electricity consumption and hence the use of the available renewable generation. Figure 10 compares the profiles of the charging demand with the total load and RES generation profiles in 2030 and 2050. The main difference between the 2030 and 2050 profiles for RES generation is a strong increase during the hours of the day with PV generation, despite an increase in all hours (less noticeable at night).
As can be seen, EV charging demands do not majorly contribute to the total load of 2030 but will have a considerable impact in 2050. Overlapping the charging patterns with the RES profile hints that a substantial part of charging occurs in periods of low availability of RES generation. On the other hand, the charging power requirement will exceed the availability of RES during the night by 2050. As can be seen in Table 1, this leads to 94.9 % of the EV charging demand ensured by RES ( E V R E S ) in 2050. However, another considered impact can be that the same level of RESs will represent a lower percentage of the total load if this load increases due to the EV charging demand. However, as can also be seen in Table 1, this only represents a reduction of 2.63 % in the share of the total demand ensured by RESs.
To assess the impact in more detail, the correlations between the charging profile and the load and RES profiles were assessed, as well as its contribution to peak load. The correlations were calculated with the Pearson Correlation Coefficient (r) (using Equation (6)), with the variables x and y being the charging and RES profiles on an average day. In addition to considering the total charging profile, this work studies the impact of home, work, and public charging profiles. Table 2 and Table 3 present the correlations and the contribution to the peak load, respectively.
r = i = 1 n ( x i x ¯ ) ( y i y ¯ ) i = 1 n ( x i x ¯ ) 2 ( y i y ¯ ) 2
It should be noted that only one assessment for the load profile was carried out since the load profiles considered for 2030 and 2050 are proportional. It can be observed that there is a positive correlation between the charging and the load, this being particularly high in the case of public charging. This has a negative impact since the charging will increase the load in periods of high demand. It can be concluded that an increase of peak load by 2.48 % is expected in 2030, and this impact will increase to 13.7 % in 2050. The increase in peak load is mainly caused by the home charging, contributing to about 80 % of the increase.
The impacts in 2030 and 2050 were evaluated separately since the RES profiles are different due to a different mix of RESs. There is a low correlation in 2030 and it decreases to slightly negative values in 2050. This means that EV charging is not taking advantage of RES availability, which is mostly caused by home charging, since such charging is mainly concentrated at the beginning of the night, in a period with low RES availability. However, this correlation exhibits strong variation between regions due to the different generation mix, as presented in Figure 11, ranging from 26 % to 65 % .

3.3.2. Distribution Grid in Urban Areas

In distribution systems, the objective is to evaluate the impact in urban areas (where most charging will occur) and not in the entire distribution grid. In the context of urban areas, RES generation is dominated by PV generation, it being important to assess the matching between the charging profiles and the PV generation connected to the distribution grid. The mismatch between these profiles is visible in Figure 12. Table 4 presents the correlation between the charging profile and the distributed PV generation, showing a relatively high negative correlation of about 20 % . In distribution systems, the correlation has a much lower variation between regions, as presented in Figure 13, since only PV generation connected to the distribution grid is considered. Therefore, the correlation is always negative, with a range between about 31 % and 2 % .
These results are mainly caused by home charging, since most charging is concentrated at the beginning of the night, in a period without PV generation. In contrast, the very high correlation between distributed PV generation and work and public charging should be highlighted.

4. Discussion

Nowadays, the specific GHG emissions present a strong variation between the regions and most profiles do not present a significant variation during the day. This is caused by the low share of RESs in most regions. Therefore, despite presenting average GHG emissions per day due to the charging of one EV of 4.45   kgCO 2 , in the different regions such value ranges from 2.67   kgCO 2 to 8.84   kgCO 2 .
The predicted transition of the generation portfolio in the U.S. will lead to 67 % carbon-free generation by 2030 and 75 % by 2050 [30]. Therefore, achieving the announced objectives of a 100 % carbon pollution-free electricity system by 2035 [32] requires ambitious targets and rapid deployment of GHG emissions reduction. A substantial decrease in carbon emissions is vital for achieving potential environmental benefits while pursuing 50 % EV sales share by 2030 [3].
However, defining a national target for the generation portfolio is insufficient since there are broad differences between the regions regarding specific GHG emissions. This disparity will result in a limited reduction in emissions expected from EVs, since the benefits of a generation mix with a higher share of carbon-free generation are attenuated by the asymmetries between regions when the penetration of EVs starts to increase in the regions with the highest specific emissions. Therefore, EV incentive targets need to be accompanied by generation decarbonization initiatives and GHG gap reduction plans.
The increasing penetration of EVs will directly impact the electrical grid. Specifically, the EV charging load will considerably affect the total electric consumption scenarios of 2030 and 2050. Additionally, EV charging profiles are highly correlated with the electricity consumption patterns at the grid level. This correlation means that EV charging can inflate the peak load and consumption in high-demand periods. This highlights the need for charging management and policies to promote charge scheduling.
Nowadays, the charging profiles do not present major differences between the regions, and the profile of the GHG emissions associated with the charging of EVs is almost proportional to the EV charging profile and does not substantially vary during the day. With the increasing penetration of PV generation, several regions will gradually present lower specific GHG emissions during the hours with higher PV generation levels. However, nowadays, a substantial part of charging takes place in periods with low RES availability. Additionally, EVs’ charging needs will surpass the availability of RESs overnight by 2050. It will then be critical to manage the charging to take advantage of the periods with higher availability of RESs. However, RES generation profiles vary across balancing regions (due to the diversity in the generation portfolio). Therefore, it is crucial to adopt strategies and policy incentives for shifting EV charging for high RES generation periods while accounting for regional RES generation mix characteristics.
At the distribution grid level in urban areas, the need for charging management is even higher due to the considerable mismatch between the distributed PV generation and charging demand. This mismatch mainly stems from home charging, the most common charging option, since home charging primarily occurs at the beginning of the night, i.e., a period without PV generation. Therefore, it is vital to provide incentives for charging during the daytime to take advantage of the available PV generation. On the other hand, there is a very high correlation between distributed PV generation and work and public charging. Therefore, there is a need to reinforce the work and public charging infrastructure and provide adoption incentives. In the near future, with the increasing penetration of EVs, the use of work and public charging will increase, therefore charging the total charging load and minimizing the mismatch between RES generation and charging demand.
The use of energy management strategies may affect the considered EV charging profiles, minimizing its impacts on the electrical grid and maximizing the use of RES generation. The use of smart charging devices together with optimal scheduling strategies may lead to more efficient power allocation among charging points [33]. The charging period can be then controlled to achieve objectives for the EV users (e.g., the minimization of charging costs), for buildings (e.g., flattening the load diagram, minimization of electricity costs, minimization of peak demand, or maximization of self-consumption of PV generation) and for the electrical grid (e.g., minimization of peak load, minimization of bi-directional power flows between the buildings and the grid and maximization of the integration of RES generation). Therefore, in addition to pursuing programs for increasing the installation of PV and EV charging, it is important to develop policies and incentives around the optimal use of on-site resources and the promotion of EV charging management.
In this context, EVs can provide the much needed flexibility to adjust the charging period based on renewable generation availability and the capabilities of V2X (Vehicle-to-Everything) systems. EVs can be used as controllable loads, using the Grid-to-Vehicle (G2V) system to charge in periods of high renewable generation or low electricity prices. In addition to absorbing power from the grid, EVs can also use some of their storage capacity to inject energy into the grid, using the Vehicle-to-Grid (V2G) system to help ensure the balance between generation and demand. At the building level, EVs can significantly contribute to providing the much needed flexibility through charging period management, using the Building-to-Vehicle (B2V) system, adjusting the charging period based on renewable generation availability. Additionally, using the Vehicle-to-Building (V2B) system, the energy stored in EVs can be injected into the building to compensate for periods of low generation (for instance, due to clouds passing by the PV system) or reduce the demand from the grid in periods of high tariffs. Therefore, it will be critical to provide incentives to use work and public charging stations and ensure effective management of the charging flexibility through B2V and V2B.
As with any work assessing future impacts and relying on data from different sources, there are uncertainties associated with the data. To minimize such uncertainties, all data used in the assessment were based on official projections, mainly from the U.S. Department of Energy and the U.S. Energy Information Administration. The future installed capacity of different types of power plants per region has a strong impact on the assessment of GHG emissions. Therefore, the future generation matrix was based on the projections of the U.S. Energy Information Administration for 2030 and 2050 for the installed capacity by power plant type in each state. However, these numbers depend on the target defined by policymakers and such targets could be changed in the future leading to a different generation mix. The same projections were used for the considered electricity demand in each state and these numbers can evolve differently depending on the evolution of economic activity and the progression of the electrification process. The future generation and demand profiles considering the updated generation capacity and demand assuming a variation in the generation and demand during the year proportional to the actual variation, but different factors (for instance, the adoption of new electric loads and changes of behavior), can lead to changes in the demand profiles.
In this work, it was assumed that the charging of EVs is going to use the electricity already available in the grid and therefore their GHG emissions will correspond to the average of the used power plants. However, with the increasing impact of EV charging, in future scenarios, instead of considering the available electricity, the approach could be to assess the needed power plants to supply the additional demand for the charging of EVs. This work considers the defined projections for the evolution of the generation capacity, but in a different work, the incremental capacity that the existing power plants can provide or that needs to be ensured by new power plants can be assessed to determine the future generation needed for each scenario of EV penetration, as well as the GHG emissions directly associated with such power plants.
Other uncertainties are associated with the evolution of parameters such as the energy consumption of EVs per distance, distance traveled per vehicle per day, and EV charging profiles. Regarding electricity consumption, a weighted average considering the sales per EV model was considered to find a representative value. However, in the future, the consumption of EVs and the share of EV models could change. Regarding the distance traveled by the vehicles, there is no reliable data at the state level to enable the use of a different distance aligned with the behavior of each region. The availability of such data would enable the improvement of the assessment by considering different energy consumption values in the regions. As previously explained, the charging profiles can change not only due to a behavior change, but also in accordance with the increasing relevance of work and public charging, as well as the impact of charging management strategies.

5. Conclusions

This work holistically studies the impact of rapid EV adoption in the U.S. in the context of GHG emissions and power grid modernization. This study inputs a wide range of data, including grid characteristics in different U.S. regions, variations in regional generation mixes (e.g., daily and seasonal), and different EV charging profiles. In addition, it takes into account future EV penetration scenarios, possible generation mixes, and charging profiles associated with home, work, and public charging.
The analysis concluded that EVs present a high impact on the future reduction in GHG emissions. However, in the long term, it is crucial to enact ambitious policies for carbon-free electricity generation. One primary consideration for EV integration plans is that increasing carbon-free generation in regions with the highest GHG emissions minimizes the considerable gap between regions. It was also concluded that current charging profiles show a high correlation with the total consumption at the grid level, contributing to increasing the peak load. Simultaneously, most charging occurs in periods of low availability of renewable energy generation, highlighting the need for policies to incentivize charging management protocols. In such a context, work and public charging can contribute to a higher matching with the availability of PV generation.
The numeric results of the assessment are limited by the future evolution of the used data. The uncertainties were minimized by using official projections, but factors such as new policies, the evolution of the global economy, the evolution of EVs and charging technologies, as well as user behavior, can lead to changes in the considered parameters. However, using the same methodology, the results can be updated using the new data. Additionally, the future use of this research could be focused on the identified policies needed to maximize the decarbonization benefits of transportation electrification, namely with more ambitious targets for RESs in the regions with the highest GHG emissions and to develop incentives for the management of EV charging.

Author Contributions

P.M.: conceptualization, methodology, assessment, writing—original draft, writing—review and editing. A.M.: methodology, data collection and assessment. S.L.: data collection and assessment. J.M.: conceptualization, methodology, writing—review and editing. All authors have read and agreed to the published version of the manuscript.

Funding

This research was supported by Carnegie Mellon University’s Block Center for Technology and Society and by the Portuguese Foundation for Science and Technology through the research project ML@GridEdge (UTAP-EXPL/CA/0065/2021).

Institutional Review Board Statement

Not applicable.

Informed Consent Statement

Not applicable.

Data Availability Statement

Not applicable.

Conflicts of Interest

The authors declare no conflict of interest. The funders had no role in the design of the study; in the collection, analysis, or interpretation of data; in the writing of the manuscript; or in the decision to publish the results.

References

  1. International Energy Agency. Global EV Outlook 2021—Analysis. Available online: https://www.iea.org/reports/global-ev-outlook-2021 (accessed on 17 January 2022).
  2. Internal Revenue Service. Plug-In Electric Drive Vehicle Credit (IRC 30D). Available online: https://www.irs.gov/businesses/plug-in-electric-vehicle-credit-irc-30-and-irc-30d (accessed on 17 January 2022).
  3. White House. President Biden Announces Steps to Drive American Leadership Forward on Clean Cars and Trucks. Available online: https://www.whitehouse.gov/briefing-room/statements-releases/2021/08/05/fact-sheet-president-biden-announces-steps-to-drive-american-leadership-forward-on-clean-cars-and-trucks/ (accessed on 6 August 2022).
  4. Faria, R.; Marques, P.; Moura, P.; Freire, F.; Delgado, J.; de Almeida, A.T. Impact of the electricity mix and use profile in the life-cycle assessment of electric vehicles. Renew. Sustain. Energy Rev. 2013, 24, 271–287. [Google Scholar] [CrossRef]
  5. Vergis, S.; Chen, B. Comparison of plug-in electric vehicle adoption in the United States: A state by state approach. Res. Transp. Econ. 2015, 52, 56–64. [Google Scholar] [CrossRef]
  6. Soltani-Sobh, A.; Heaslip, K.; Stevanovic, A.; Bosworth, R.; Radivojevic, D. Analysis of the Electric Vehicles Adoption over the United States. Transp. Res. Procedia 2017, 22, 203–212. [Google Scholar] [CrossRef]
  7. Hao, X.; Zhou, Y.; Wang, H.; Ouyang, M. Plug-in electric vehicles in China and the USA: A technology and market comparison. Mitig. Adapt. Strateg. Glob. Chang. 2020, 25, 329–353. [Google Scholar] [CrossRef]
  8. Carley, S.; Zirogiannis, N.; Siddiki, S.; Duncan, D.; Graham, J.D. Overcoming the shortcomings of U.S. plug-in electric vehicle policies. Renew. Sustain. Energy Rev. 2019, 113, 109291. [Google Scholar] [CrossRef]
  9. Hayashida, S.; La Croix, S.; Coffman, M. Understanding changes in electric vehicle policies in the U.S. states, 2010–2018. Transp. Policy 2021, 103, 211–223. [Google Scholar] [CrossRef]
  10. Breetz, H.L.; Salon, D. Do electric vehicles need subsidies? Ownership costs for conventional, hybrid, and electric vehicles in 14 U.S. cities. Energy Policy 2018, 120, 238–249. [Google Scholar] [CrossRef]
  11. Jenn, A.; Springel, K.; Gopal, A.R. Effectiveness of electric vehicle incentives in the United States. Energy Policy 2018, 119, 349–356. [Google Scholar] [CrossRef]
  12. Noori, M.; Gardner, S.; Tatari, O. Electric vehicle cost, emissions, and water footprint in the United States: Development of a regional optimization model. Energy 2015, 89, 610–625. [Google Scholar] [CrossRef]
  13. Huo, H.; Cai, H.; Zhang, Q.; Liu, F.; He, K. Life-cycle assessment of greenhouse gas and air emissions of electric vehicles: A comparison between China and the U.S. Atmos. Environ. 2015, 108, 107–116. [Google Scholar] [CrossRef]
  14. Onat, N.C.; Kucukvar, M.; Afshar, S. Eco-efficiency of electric vehicles in the United States: A life cycle assessment based principal component analysis. J. Clean. Prod. 2019, 212, 515–526. [Google Scholar] [CrossRef]
  15. Ou, Y.; Kittner, N.; Babaee, S.; Smith, S.J.; Nolte, C.G.; Loughlin, D.H. Evaluating long-term emission impacts of large-scale electric vehicle deployment in the US using a human-Earth systems model. Appl. Energy 2021, 300, 117364. [Google Scholar] [CrossRef] [PubMed]
  16. Brown, M.A.; Soni, A. Expert perceptions of enhancing grid resilience with electric vehicles in the United States. Energy Res. Soc. Sci. 2019, 57, 101241. [Google Scholar] [CrossRef]
  17. Zhang, C.; Greenblatt, J.B.; MacDougall, P.; Saxena, S.; Jayam Prabhakar, A. Quantifying the benefits of electric vehicles on the future electricity grid in the midwestern United States. Appl. Energy 2020, 270, 115174. [Google Scholar] [CrossRef]
  18. Tarroja, B.; Hittinger, E. The value of consumer acceptance of controlled electric vehicle charging in a decarbonizing grid: The case of California. Energy 2021, 229, 120691. [Google Scholar] [CrossRef]
  19. Hussain, S.; Thakur, S.; Shukla, S.; Breslin, J.G.; Jan, Q.; Khan, F.; Kim, Y.S. A two-layer decentralized charging approach for residential electric vehicles based on fuzzy data fusion. J. King Saud Univ. Comput. Inf. Sci. 2022, 34, 7391–7405. [Google Scholar] [CrossRef]
  20. Hussain, S.; Thakur, S.; Shukla, S.; Breslin, J.G.; Jan, Q.; Khan, F.; Ahmad, I.; Marzband, M.; Madden, M.G. A Heuristic Charging Cost Optimization Algorithm for Residential Charging of Electric Vehicles. Energies 2022, 15, 1304. [Google Scholar] [CrossRef]
  21. U.S. Department of Energy. Alternative Fuels Data Center. U.S. Plug-In Electric Vehicle Sales by Model. Available online: https://afdc.energy.gov/data/10567 (accessed on 17 January 2022).
  22. U.S. Energy Information Administration. Regional Electricity Overview. Available online: https://www.eia.gov/electricity/gridmonitor/dashboard/electric_overview/US48/US48 (accessed on 17 January 2022).
  23. U.S. Department of Energy. Alternative Fuels Data Center, U.S. Electric Vehicle Registrations by State. Available online: https://afdc.energy.gov/data/10962 (accessed on 17 January 2022).
  24. Federal Highway Administration. State Motor-Vehicle Registrations. Available online: https://www.fhwa.dot.gov/policyinformation/statistics/2019/mv1.cfm (accessed on 17 January 2022).
  25. U.S. Department of Energy. Find and Compare Cars. Available online: https://www.fueleconomy.gov/feg/findacar.shtml (accessed on 17 January 2022).
  26. U.S. Energy Information Administration. Average Annual PMT, VMT Person Trips and Trip Length by Trip Purpose. Available online: https://www.bts.gov/content/average-annual-pmt-vmt-person-trips-and-trip-length-trip-purpose (accessed on 17 January 2022).
  27. U.S. Department of Energy. Alternative Fuels Data Center, Electric Vehicle Infrastructure Projection Tool (EVI-Pro). Available online: https://afdc.energy.gov/evi-pro-lite/load-profile (accessed on 17 January 2022).
  28. U.S. Energy Information Administration. U.S. Daily Generation Mix. Available online: https://www.eia.gov/beta/electricity/gridmonitor/dashboard/daily_generation_mix/US48/US48 (accessed on 17 January 2022).
  29. U.S. Environmental Protection Agency. CO2 Total Output Emission Rates. Available online: https://www.epa.gov/egrid/data-explorer (accessed on 17 January 2022).
  30. U.S. Energy Information Administration. Annual Energy Outlook 2021. Available online: https://www.eia.gov/outlooks/aeo/ (accessed on 17 January 2022).
  31. U.S. Energy Information Administration. Net Summer Capacity Using Primarily Renewable Energy Sources and by State. Available online: https://www.eia.gov/electricity/monthly/ (accessed on 17 January 2022).
  32. White House. President Biden Sets 2030 Greenhouse Gas Pollution Reduction Target Aimed at Creating Good-Paying Union Jobs and Securing U.S. Leadership on Clean Energy Technologies. Available online: https://www.whitehouse.gov/briefing-room/statements-releases/2021/04/22/fact-sheet-president-biden-sets-2030-greenhouse-gas-pollution-reduction-target-aimed-at-creating-good-paying-union-jobs-and-securing-u-s-leadership-on-clean-energy-technologies/ (accessed on 6 August 2022).
  33. Tostado-Véliz, M.; Kamel, S.; Hasanien, H.M.; Arévalo, P.; Turky, R.A.; Jurado, F. A stochastic-interval model for optimal scheduling of PV-assisted multi-mode charging stations. Energy 2022, 253, 124219. [Google Scholar] [CrossRef]
Figure 1. Considered balancing regions.
Electricity 04 00004 g001
Figure 2. Evaluation of charging demand.
Electricity 04 00004 g002
Figure 3. Evaluation of GHG emissions.
Electricity 04 00004 g003
Figure 4. Evaluation of the impact on the electrical grid.
Electricity 04 00004 g004
Figure 5. EV charging profiles in each region.
Electricity 04 00004 g005
Figure 6. Specific GHG emissions profiles in each region.
Electricity 04 00004 g006
Figure 7. GHG emissions with the charging of one EV in each region.
Electricity 04 00004 g007
Figure 8. GHG emissions per day due to the charging of one EV in 2019.
Electricity 04 00004 g008
Figure 9. GHG emissions per day due to the charging of one EV in 2050.
Electricity 04 00004 g009
Figure 10. Charging, load, and RES profiles.
Electricity 04 00004 g010
Figure 11. Correlation between the charging and RES profiles in 2050.
Electricity 04 00004 g011
Figure 12. Charging and distributed PV generation in 2030.
Electricity 04 00004 g012
Figure 13. Correlation between the charging and distributed PV profiles in 2050.
Electricity 04 00004 g013
Table 1. EV charging ensured by RESs and impact on the total share of RESs.
Year EV RES Δ RES
2030 100 % 0.45 %
2050 94.9 % 2.63 %
Table 2. Correlation between each charging profile and the RES and load profiles.
ScenarioHomeWorkPublicTotal
Load 47.4 % 20.0 % 93.6 % 66.0 %
RES 2030 19.5 % 54.4 % 78.9 % 2.51 %
RES 2050 26.9 % 55.8 % 74.5 % 5.45 %
Table 3. Contribution to the peak load.
ScenarioHomeWorkPublicTotal
2030 1.99 % 0.13 % 0.36 % 2.48 %
2050 11.0 % 0.72 % 1.96 % 13.7 %
Table 4. Correlation between each charging profile and the distributed PV generation.
ScenarioHomeWorkPublicTotal
2030 41.1 % 59.7 % 64.2 % 20.7 %
2050 39.7 % 58.1 % 65.1 % 19.4 %
Disclaimer/Publisher’s Note: The statements, opinions and data contained in all publications are solely those of the individual author(s) and contributor(s) and not of MDPI and/or the editor(s). MDPI and/or the editor(s) disclaim responsibility for any injury to people or property resulting from any ideas, methods, instructions or products referred to in the content.

