Article

Multilevel and Multiregional Analysis of the Electricity Metabolism of Mexico across Sectors

by
Natalie Ortiz-Guerrero
and
Rafael González-López
*
Plataforma Nacional Energía Ambiente y Sociedad (PLANEAS), Consejo Nacional de Ciencia y Tecnología, Mexico City 03940, Mexico
*
Author to whom correspondence should be addressed.
Electricity 2023, 4(1), 1-21; https://doi.org/10.3390/electricity4010001
Submission received: 24 October 2022 / Revised: 22 December 2022 / Accepted: 30 December 2022 / Published: 6 January 2023
(This article belongs to the Special Issue Recent Advances in Electricity Economics)

Abstract

:
This paper presents a novel tool for electricity planning, based on an improvement of MuSIASEM (Multiscale Integrated Analysis of the Societal and Ecological Metabolism) by incorporating a new regional analysis of the electricity metabolism across levels. An analysis of Mexico illustrates this toolkit and shows that the industry sector has economic energy intensity (EEI) with 40.3 MWh/MMXN reaching a higher value than the commerce and services sector with 0.84 MWh/MMXN. Regarding the economic labor productivity (ELP) indicator (AV/h), the industrial sector with 208.5 TMXN/Kh reached a higher value than the commercial and services sector with 114.3 TMXN/Kh. Regarding the exosomatic metabolic rate (EMR), the household sector obtained 59.3 KWh/Kh, whereas the economic sector reached 2486.4 KWh/Kh. Disaggregation of the EMR indicator into economic sectors shows that the industrial sector reached 8.4 KWh/Kh and the commercial and services sector reached 0.10 KWh/Kh. The lack of complete data for the agricultural sector does not allow us to calculate EEI, ELP, and EMR indicators accurately. This innovative approach is useful for governance because it helps us to understand and reduce asymmetries across regions in terms of electricity consumption, resulting in more social equality and a better economic equilibrium across sectors and regions.

1. Introduction

It is increasingly important to analyze the economy from a biophysical perspective [1,2,3] and move beyond the use of the neoclassical economic model of supply and demand, which discards energy, work, and resources [4,5].
Therefore, this article examines in depth the costs of both electricity and work, since recent studies incorporating these factors provide evidence of serious consequences when studying the limits of economic growth [6,7], indicating inequalities in the contemporary economic model [8,9]. We think it is necessary to develop and apply an analysis that makes it possible to demonstrate the costs not incorporated in the equations of neoclassical economics, such as the multi-scale integrated analysis of societal and ecosystem metabolism (MuSIASEM) [10,11], and that allows strategic planning for a country such as Mexico, which has a great ethnic and social diversity [12].
We used the MuSIASEM methodology [13,14], since it allows the analysis of socioeconomic variables and constraints based on population and environment [15,16].
Mexico is an interesting country, since it is part of the North American Free Trade Agreement (NAFTA) together with the US and Canada, as well as a country that is examining a transformation in its government [17,18]. It has great bio-cultural wealth, also being considered a country within the Global South, besides having great economic, social, and regional inequalities [19]. In addition, Mexico depends on the import of natural gas from the US for the generation of 100% of the combined cycle. Therefore, we believe this article is necessary to discuss the agreement that replaced NAFTA in 2020, the United States–Mexico–Canada Agreement (USMCA), since NAFTA has brought uneven development between the different regions of the country [20]. This constitutes another reason for conducting this analysis, so as to contribute to the development of better public policies that reduce inequality between regions, and create opportunities for the USMCA.
In addition, given the current importance of the use of natural gas for electricity generation and the current restrictions on importing this product for this purpose [18], we think it is necessary to analyse how the use of electricity works in different sectors of the economy since there are crises derived from world conflicts that have affected the gas supply in the world, such as the current war between Russia and Ukraine.
To understand the changes and dependency on natural gas in Mexico, we must realize the evolution of electricity generation. By the year 2000, electricity generation reached approximately 200 TWh and was dominated by heavy oil power plants with 40.5% of generation, followed by combined-cycle plants with 20.7% and hydroelectric plants with 12.7%.
For 2015, electricity generation increased to approximately 310 TWh and the elevated contribution of combined-cycle plants stands out, with a participation of 50.1%. This year, some heavy oil plants were removed and there were increases in the generation of coal-fired and hydroelectric plants. These three technologies participated in the energy matrix with 12.7%, 10.9%, and 9.9%, respectively. All these changes occurred after the Mexican Energy Reform in 2013, benefiting the importation of natural gas, and thus the dependency on this resource, as half of it is imported from the USA.
In 2020, minor changes in generation occurred; it increased to 313 TWh, more heavy oil plants were retired, and coal-fired plants generation decreased, the participation percentage added was 11.5%. Combined-cycle power plants increased their share to 59%, as did wind power plants with 6% and solar power plants with 4.2%. Hydroelectric plants participated with 8.4% [21]. Mexico is in a bit of a complicated situation, since in the winter of 2021, in Texas, natural gas reached exorbitant prices which, in addition to COVID-19 impacts, brought consequences to the generation of electricity in Mexico and therefore made the economy vulnerable [18,22].
We trust that this work, based on biophysical economics, links many of the sustainable development goals [23]. However, we consider that an analysis based on neoclassical economics could not cover as many of the goals. The objectives that we believe are most linked to the proposed analysis are: (1) end of poverty; (3) health, and well-being; (7) affordable and clean energy; (8) decent work and economic growth; (9) industry innovation and infrastructure; (10) reduction of inequalities; (11) sustainable cities and communities; (12) responsible production and consumption; (13) action on climate; (16) peace, justice, and strong institutions.

Litereature Review

We should note that there are no studies at the regional level of MuSIASEM inside a country. They exist to compare countries [24,25,26,27], to analyze the evolution of a country [28,29,30] or those that exist focus on a specific region [31,32]. For this reason, this work presents a novel tool for electricity planning and focuses on performing a multilevel and multiregional analysis of Mexico, since there are no multilevel–multiregional works within a country, just as there is no MuSIASEM analysis for Mexico.
We organized the article as follows: in Section 2, the study area, data sources, and methods are provided. Section 3 describes the results of the analysis. Section 4 features a discussion of the analysis, and finally, the conclusion is given in Section 5.

2. Materials and Methods

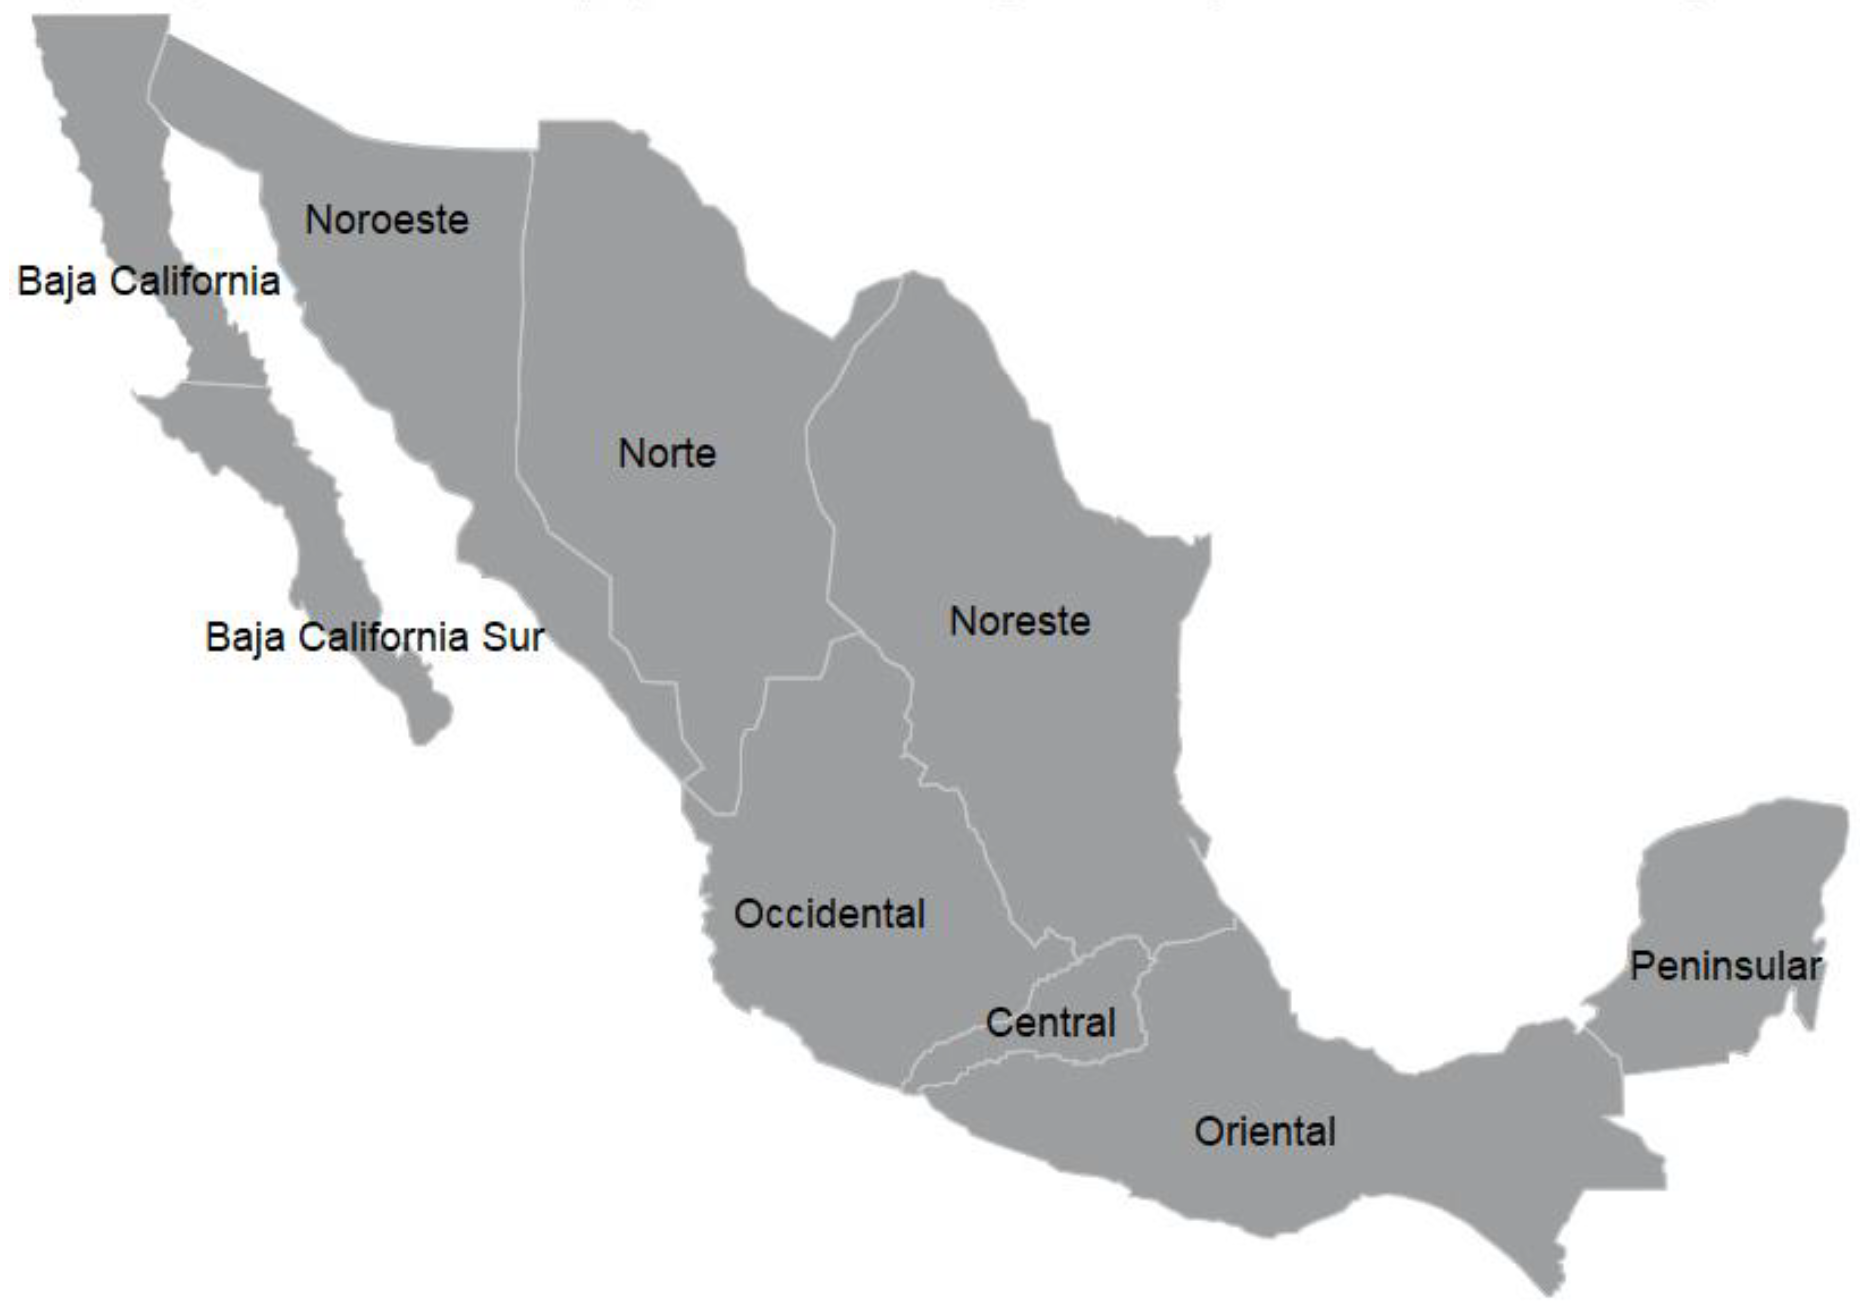
2.1. Study Area and Data Sources

The study area considered in this paper is Mexico, the second most populous country in Latin America, after Brazil. By 2020, its population reached about 126 million inhabitants [33]. Regarding the economic indicator GDP, by 2018, the GDP was 9687 USD per capita. In terms of electricity consumption, Mexico ranked sixth in Latin America with 2.01 MWh per capita, after Chile, Uruguay, Argentina, Venezuela, and Brazil [34].
According to the Secretary of Energy [35], the installed electrical capacity in 2018 was 70,053 MW in total. The installed capacities according to the techniques were: combined cycle with 25,569 MW (36.5%), heavy oil with 13,310 MW (19%), hydroelectric with 12,610 MW (18%), coal-fired with 5394 MW (7.7%), wind with 4764 MW (6.8%), turbogas with 3222 MW (4.6%), solar photovoltaic with 1821 MW (2.6%), nuclear with 1611 MW (2.3%). The installed capacities of the remaining technologies (internal combustion, geothermal, and biomass) added up to 1751 MW, which constitutes 2.5% of the total installed capacity.
Electricity consumption by sectors, imports, and exports are described in Section 3.2 Level N + 2: Sectors.

2.2. Data Sources

The work conducted here relies mainly on the analysis of economic, demographic, and electric consumption variables and their relations using MuSIASEM indicators across levels, sectors, and regions.
The year analyzed is 2018 and it was chosen because data from the Economic Census [36] and Population and Housing Census [33] are the most up to date, considering they are carried out every 5 years. Additionally, the electricity consumption data corresponds to the year 2018 [37].
Economic sector variables were grouped according to the Economic Census [36] which bases its framework for the collection, analysis, and presentation of economic statistics on the 2018 North American Industrial Classification System [36]. Table 1 describes the sectors that were taken into consideration for this analysis and their respective description.
Classification of electricity consumption by sectors (household, industry, commerce, and services) was based on the tariff scheme from CFE [38] (Table 2).
The choice of these sectors is relevant because it allows comparisons to be made with neighboring countries (USA and Canada) since the same classification system is used in this way to find out how it affects trade agreements such as NAFTA (now USMCA) and its consequences on economic and social development in Mexico.
Data analysis considered nine control regions as defined by SENER [35]. These regions are: Baja California, Baja California Sur, Central, Noreste, Norte, Noroeste, Occidente, Oriente, and Peninsular (Figure 1).

2.3. Methods

Multi-scale integrated analysis of societal and ecosystem metabolism (MuSIASEM) is an approach based on integrating various concepts related to complex system theory that makes it possible to perform a check on the feasibility and desirability of patterns of metabolism of socio-economic systems by providing a characterization at different levels and scales [3,14]. The concept of societal metabolism considers a set of transformation processes in a society that is necessary for its reproduction and sustenance over time [32]. The development of this methodology allows the analysis of a large amount of data from national statistics of the economic sectors, demography, and from electricity, to obtain a diagnosis of how these systems are organized and how they interact. This research presents a tool to plan and solve the unequal development of the different regions of Mexico.
In this work, data is organized from the most general to the most specific levels. The country is at the first level (N + 1). The second level corresponds to the economic and household sectors (N + 2). And the last level corresponds to the economic and household sectors distributed by region (N + 3). We organized the variables and indicators of the MuSIASEM methodology according to these levels (Table 3 and Table 4).

3. Results

3.1. Level N + 1: Mexico

Considering that Mexico had, in 2020, a population of 126 million inhabitants [33], total human activity (THA), which is the time available for conducting different activities, was 1,103,882 Mh. The total electrical energy throughput (TET) in 2018 was 220,653 GWh, which only considers basic users’ consumption and therefore does not include the users’ consumption of the wholesale electricity market or self-supply [37]. On the other hand, for the year 2018, Mexico imported 3940 GWh, and exported 7400 GWh [35].
In economic terms, the added value (AV) for the year 2018 was 9983.8 BMXN [36], and AV per capita was 79.2 TMXN.
The analysis of the MuSIASEM indicators at the country level show that economic energy intensity (EEI) was 24.7 MWh/MMXN, exosomatic metabolic rate (EMRsa) was 199.9 KWh/Kh and, finally, added value per hour (AVhour) was 8.1 MMXN/Mh.

3.2. Level N + 2: Sectors

According to data from INEGI [33], human activity in the household sector (HAhh) reached 1,039,858 Mh, represented by 94.2%, and 64,025 Mh corresponded to the economic sectors (HApw), equivalent to 5.8%. In terms of electrical energy throughput, the household sector (EThh) reached 61,614 GWh, which makes up 27.9%, and the economic sectors (ETpwi) reached 159,039 GWh, represented by 72.1% [37].
Regarding the exosomatic metabolic rate, the household sector (EMRhh) reached 59.3 KWh/Kh, whereas that in the economic sectors (EMRpwi) was 2486.4 KWh/Kh. These values show that economic sectors consumed more electricity per hour of human activity than the household sector.
Data analysis by sectors shows that the industrial sector had the highest electricity consumption with 143,498 GWh, which represents 90.2% of the paid sector. Regarding AVi, the industry sector ranked second with 3557 BMXN (39.8%) after the commercial and services sector. The HApwi dedicated to the industry sector was 17,064 Mh (26.7%), occupying second place after the commerce and services sector. Considering EEIi, with 40.3 MWh/MMXN, the industry sector ranked second after the commerce and services sector, which indicates it requires more energy to generate a unit of added value in comparison with the commerce and services sector. Considering the ELPpwi indicator with 208.5 TMXN/Kh, the industry sector ranked second after the agricultural sector. Finally, the EMRpwi indicator with 8.4 KWh/Kh reached second place after the agricultural sector. Although the industrial sector consumed the largest amount of energy, it was not the main generator of added value, nor was it the one that generated the most employment.
The commercial and services sector had the lowest electricity consumption, with only 4508 GWh, which represents 2.8% of the paid work sector. This sector generated the highest AVi with 5355 BMXN (60%) and accounted for the highest number of working hours (HApwi) with 46,869 Mh (73.3%). Regarding the EEIi indicator, this sector had the lowest value of 0.84 MWh/MMXN. Regarding the ELPpwi and EMRpwi indicators with 114.3 TMXN/Kh and EMRpwi with 0.10 KWh/Kh, respectively, the commercial and services sector reached the lowest values among the other sectors.
The agricultural sector had second place in electricity consumption in the paid sector with 11,032 GWh (6.9%). Considering that this sector only included fishing and aquaculture, the generation of added value (AVi) was 17 BMXN (0.2%) and the human activity (HApwi) was 30 Mh, representing 0.05% of the total in the paid sector. In terms of economic energy intensity (EEIi), the agricultural sector reached the highest value with 632.8 MWh/MMXN. This indicator cannot be representative because the electricity consumption data included the entire agricultural sector while the added value data only included fishing and aquaculture, as mentioned before. Regarding economic labor productivity by sectors (ELPpwi), the agricultural sector reached 572.8 TMXN/Kh, which makes up the highest value of this indicator compared to the industry, commerce, and services sectors. In terms of the exosomatic metabolic rate (EMRpwi), the highest value was presented in the agricultural sector with 362.5 KWh/Kh. As was explained before for the case of EEIi, EMRpwi lacks sufficient data to be calculated accurately.

3.3. Level N + 3: MuSIASEM Variables by Sectors and Regions

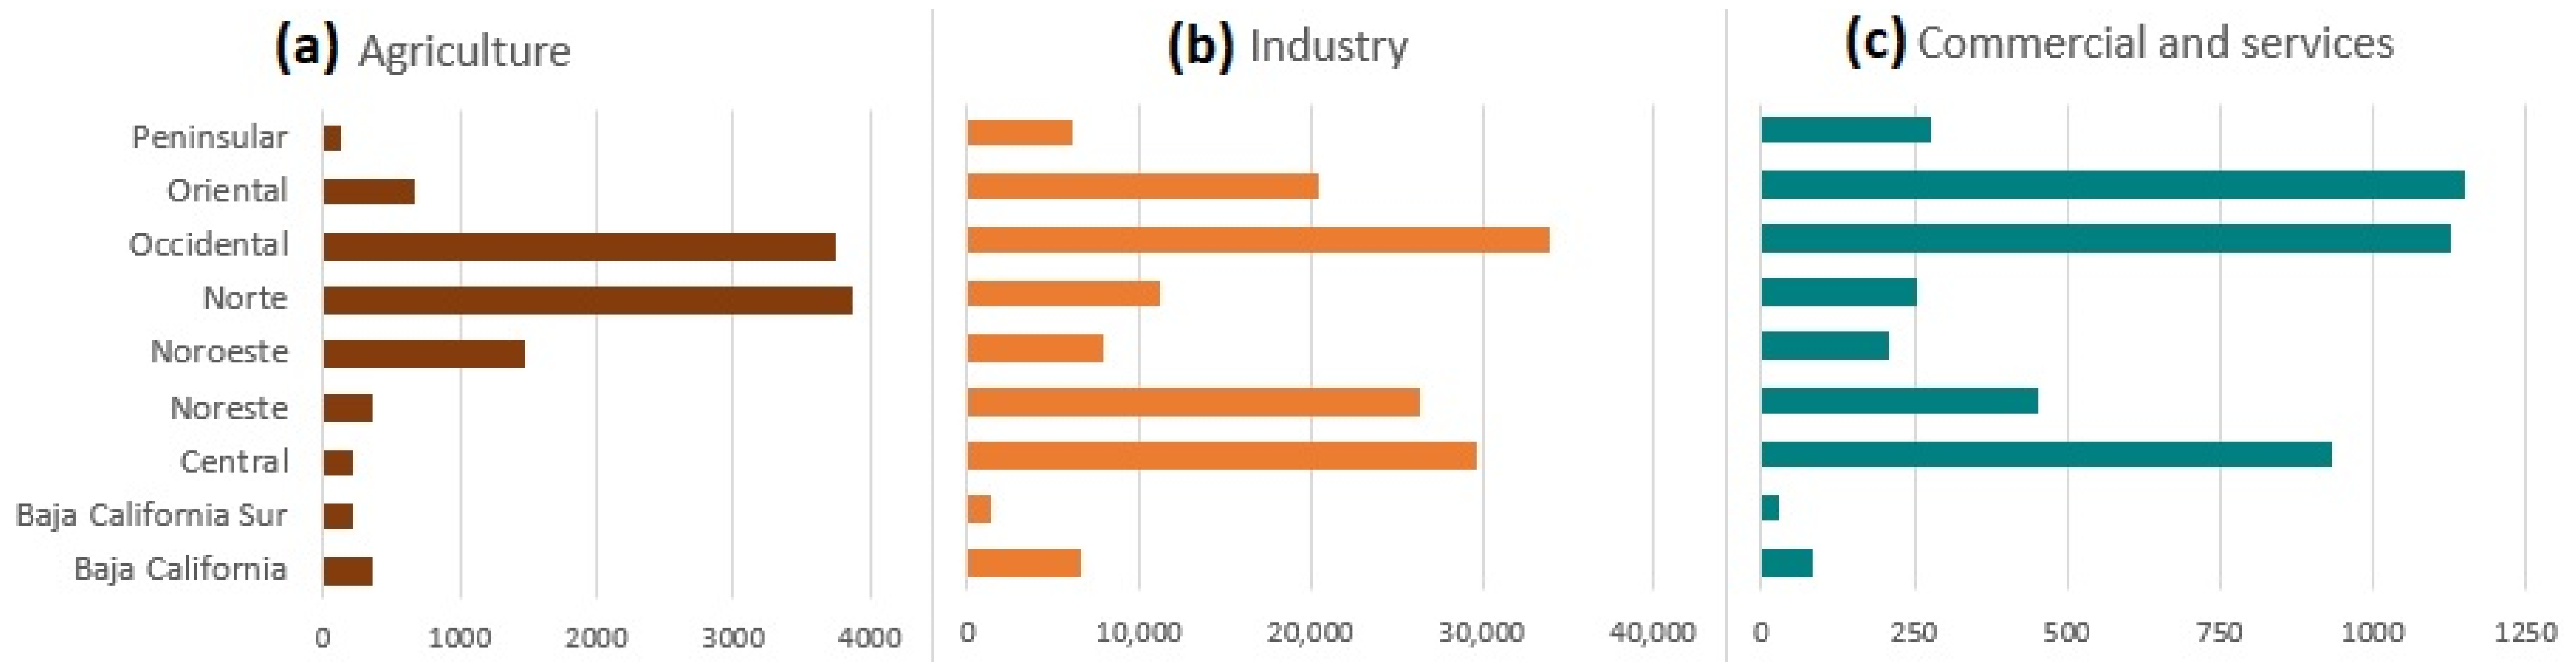
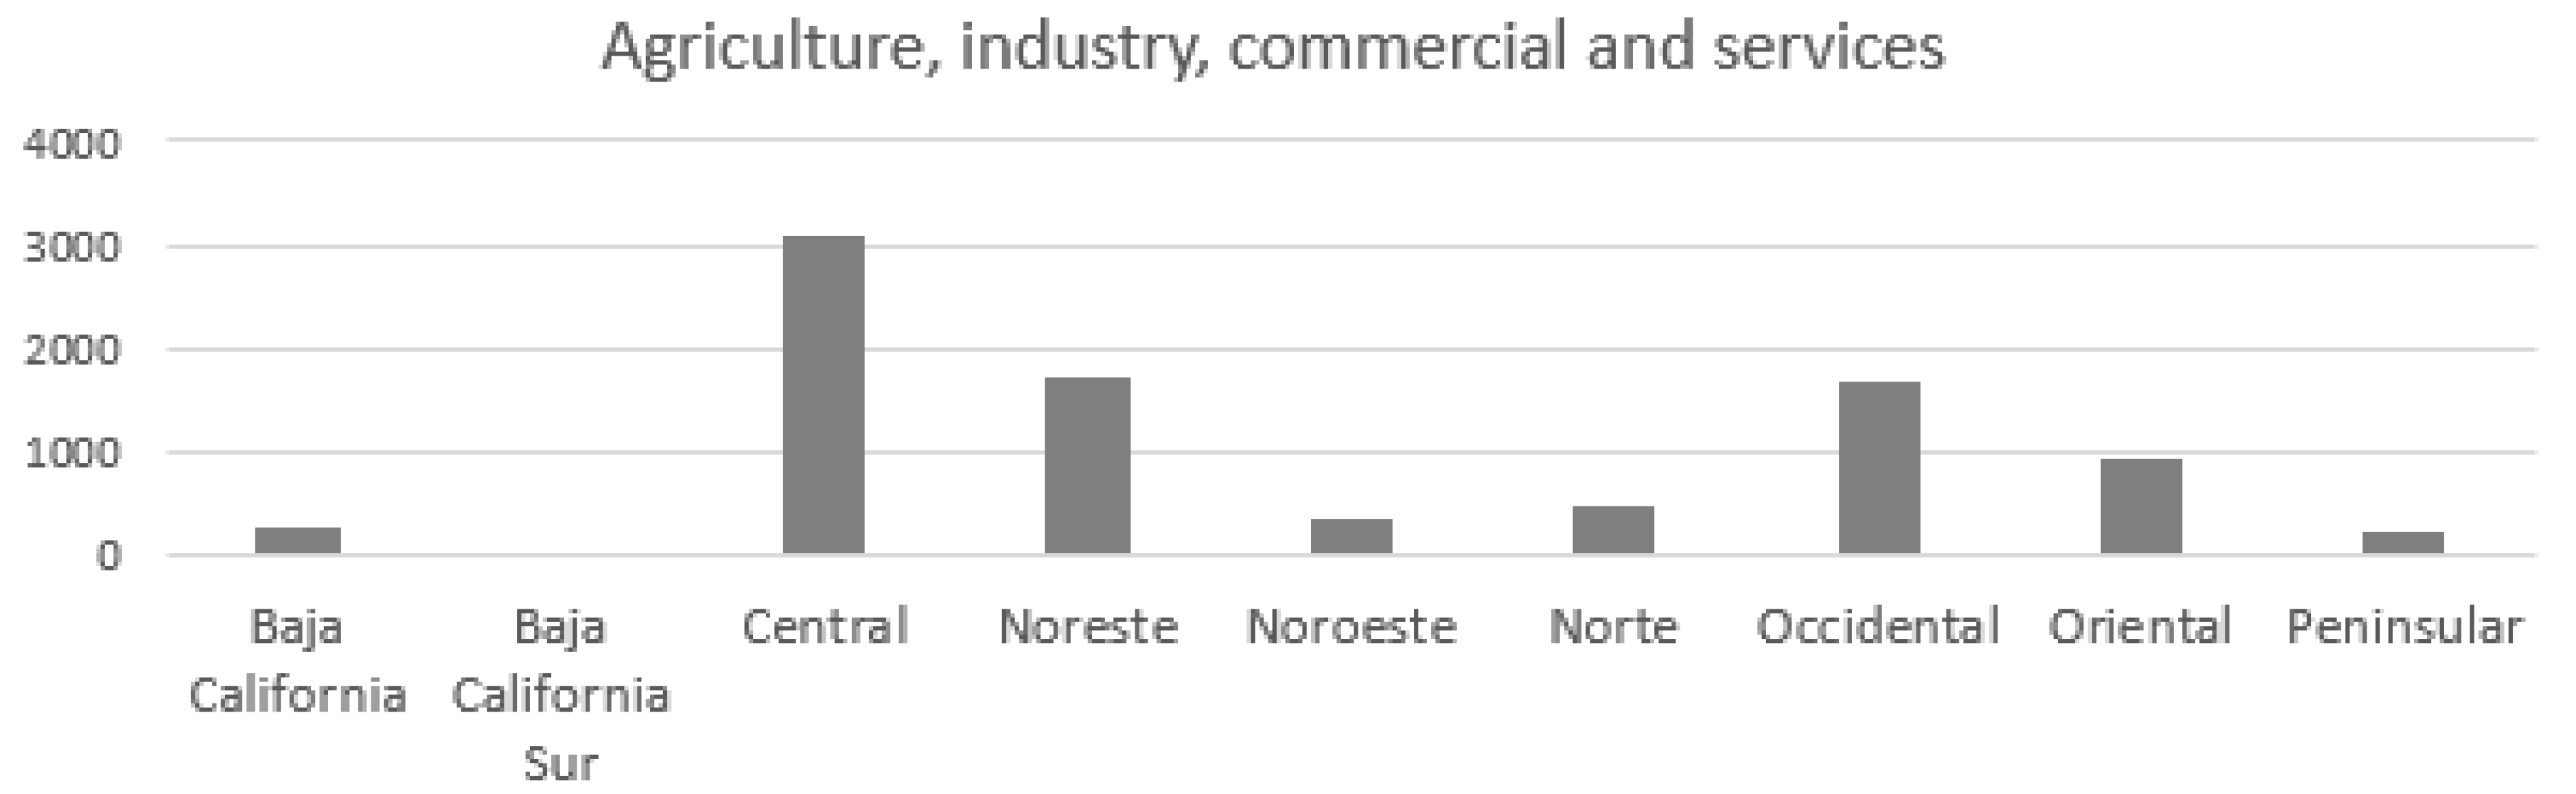
3.3.1. MuSIASEM Variables by Sectors and Regions

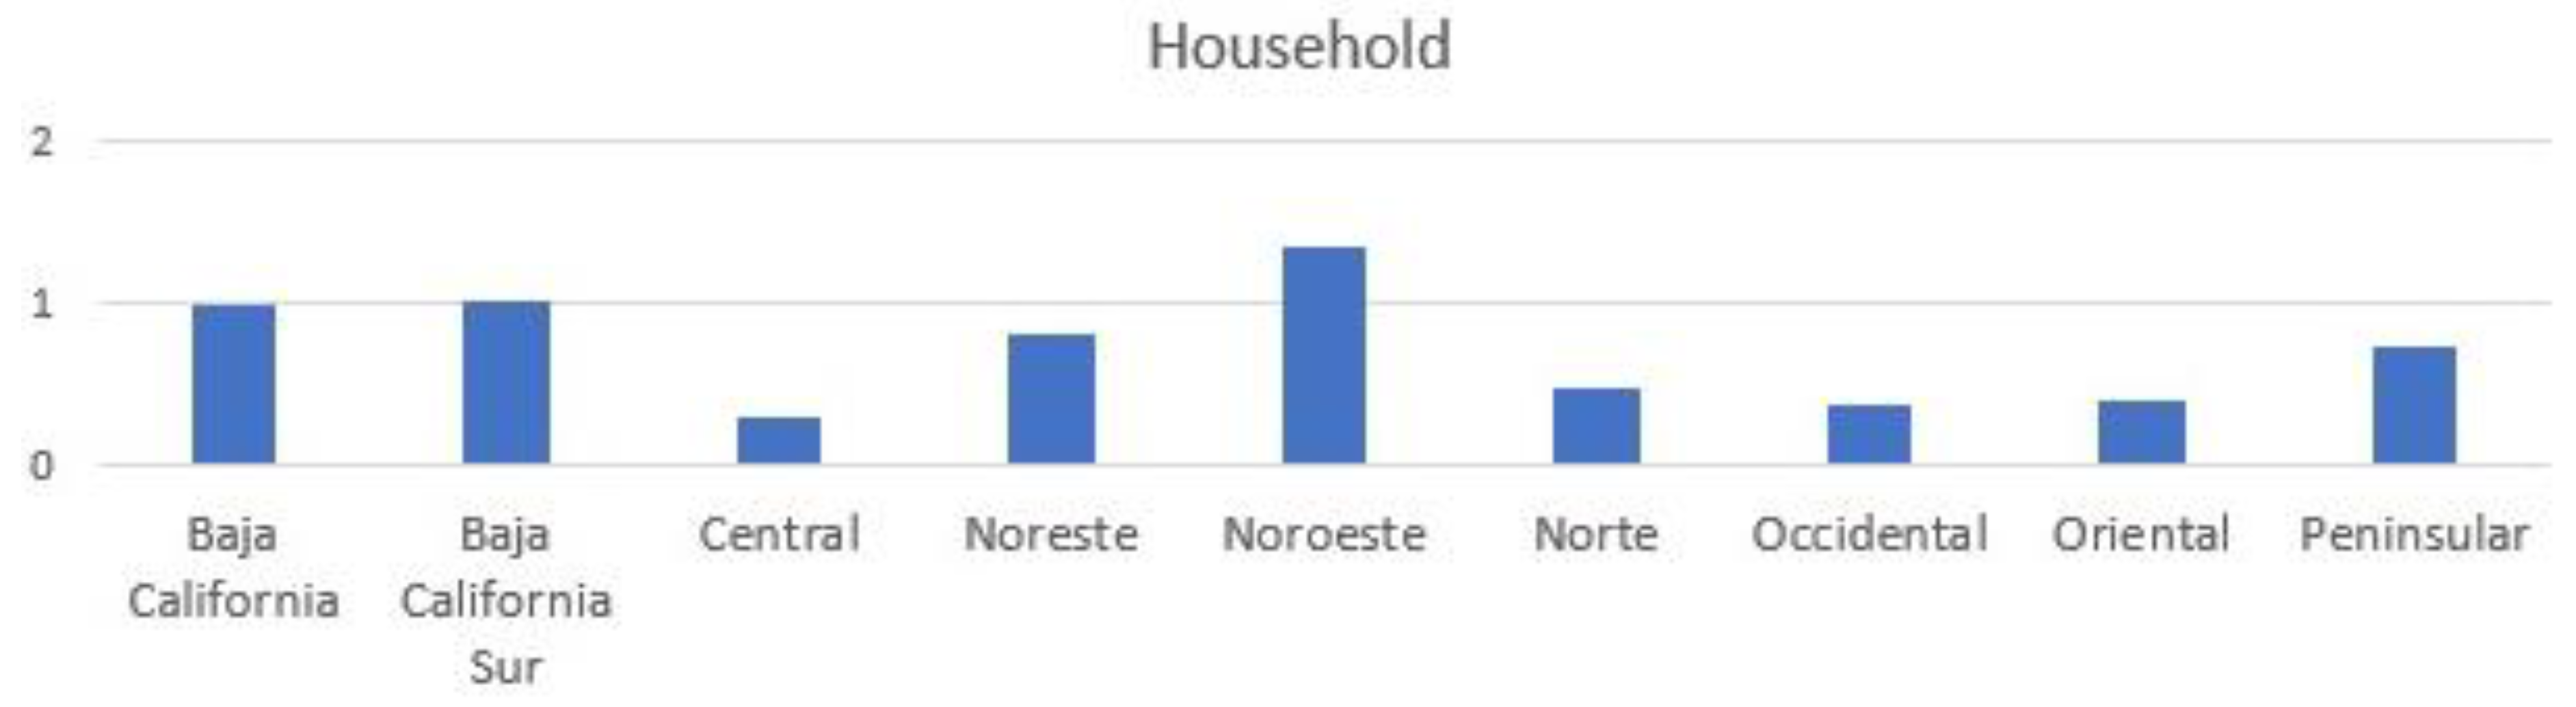
Human Activity in the Household (HAhh) and Economic Sectors (HApwi)

Regarding human activity allocated in the household sector (HAhh), the control region with the highest value of HAhh was Oriental, with 274,895 Mh (26.4%), followed by Central with 239,456 Mh (23%), Occidental with 218,127 Mh (21%), and Noreste with 123,983 Mh (11.9%). The regions with lower values of HAhh were Norte with 55,443 Mh (5.3%), Noroeste with 49,104 Mh (4.7%), Peninsular with 41,946 Mh (4%), Baja California with 30,519 Mh (2.9%) y Baja California Sur with 6445 Mh (0.6%) (Figure 2).
Taking into consideration all economic sectors (agriculture, industry, commercial, and services), the region with the highest values of HApw was the Central with 17,509 Mh (27.4%), followed by: Occidental with 13,734 Mh (21.5%), Oriental with 10,423 Mh (16.3%) and Noreste with 9390 Mh (14.7%). HApw for the remaining control regions (Baja California, Baja California Sur, Noroeste, Norte, and Peninsular) reached values below 4000 Mh, which makes up 20.2%% of the total HApw (Figure 3).
Now we consider each economic sector grouped into control regions. Regarding the agricultural sector, the Noroeste region had the highest HApwi values, with approximately 20 Mh representing 67.3% of the total hours allocated in this sector, followed by regions: Occidental with 4.1 Mh (13.5%), Baja California with 2.4 Mh (8.1%) and Oriental with 1.6 Mh (5.3%). The remaining regions add up to 1.7 Mh, which makes up 5.7% of HApwi in the agricultural sector (Figure 4a).
According to the analyzed data, the highest numbers of human activity (HApwi) in the industry sector, were presented in the following control regions: Occidental with 4127 Mh (24.2%), Noreste with Mh (21.1%) 3608, Central with 3165 Mh (18.5%), Oriental with 2159 Mh (12.7%) and Norte with 1640 Mh (9.6%). The following regions: Baja California, Baja California Sur, Noroeste, and Peninsular reached together HAPwi 2365 Mh, representing 13.8% of this sector (Figure 4b).
In the commercial and services sector, the amount of human activity (HApwi) was higher in the following regions: Central with 14,345 Mh (30.6%), Occidental with 9603 Mh (20.5), Oriental with 8263 Mh (17.6%) y Noreste 5581 with Mh (12.3%), which together represent a percentage of 81.1% of the human activity allocated in this sector. Regions that presented a lower quantity of human activity in the same sector were Baja California, Baja California Sur, Noroeste, Norte, and Peninsular. These add up to 8877 Mh, equivalent to 8.9% of HApwi in the commercial and services sector (Figure 4c).

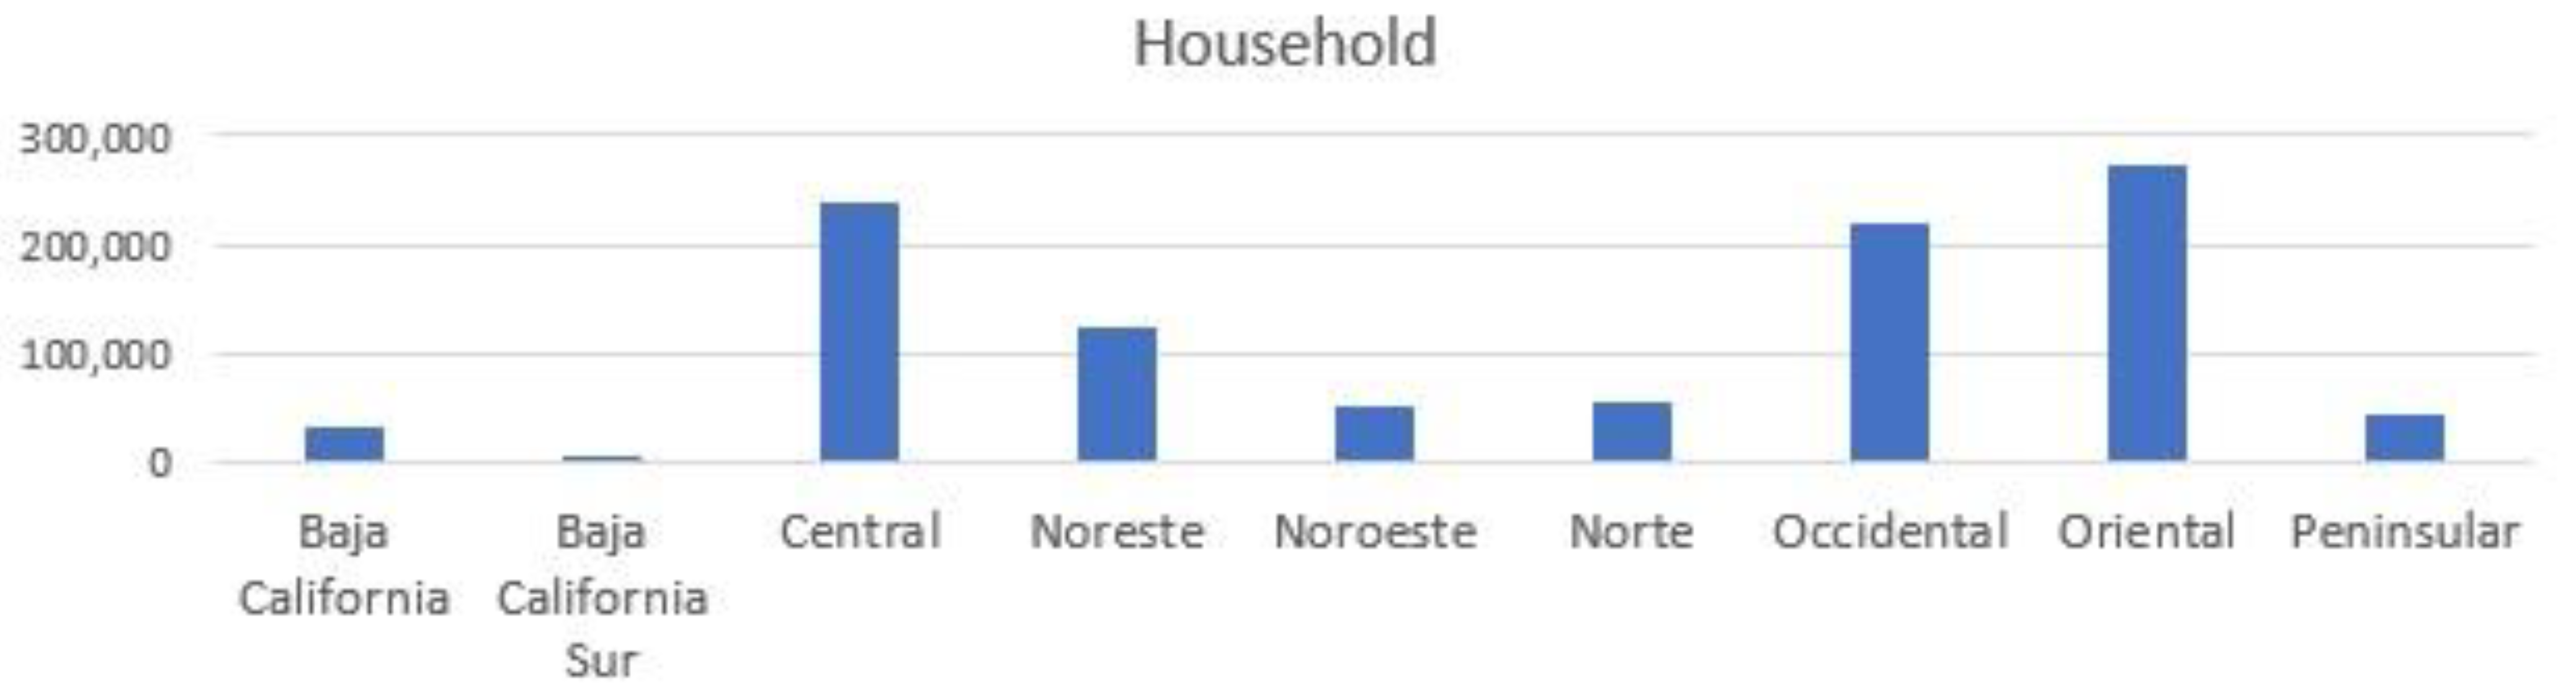
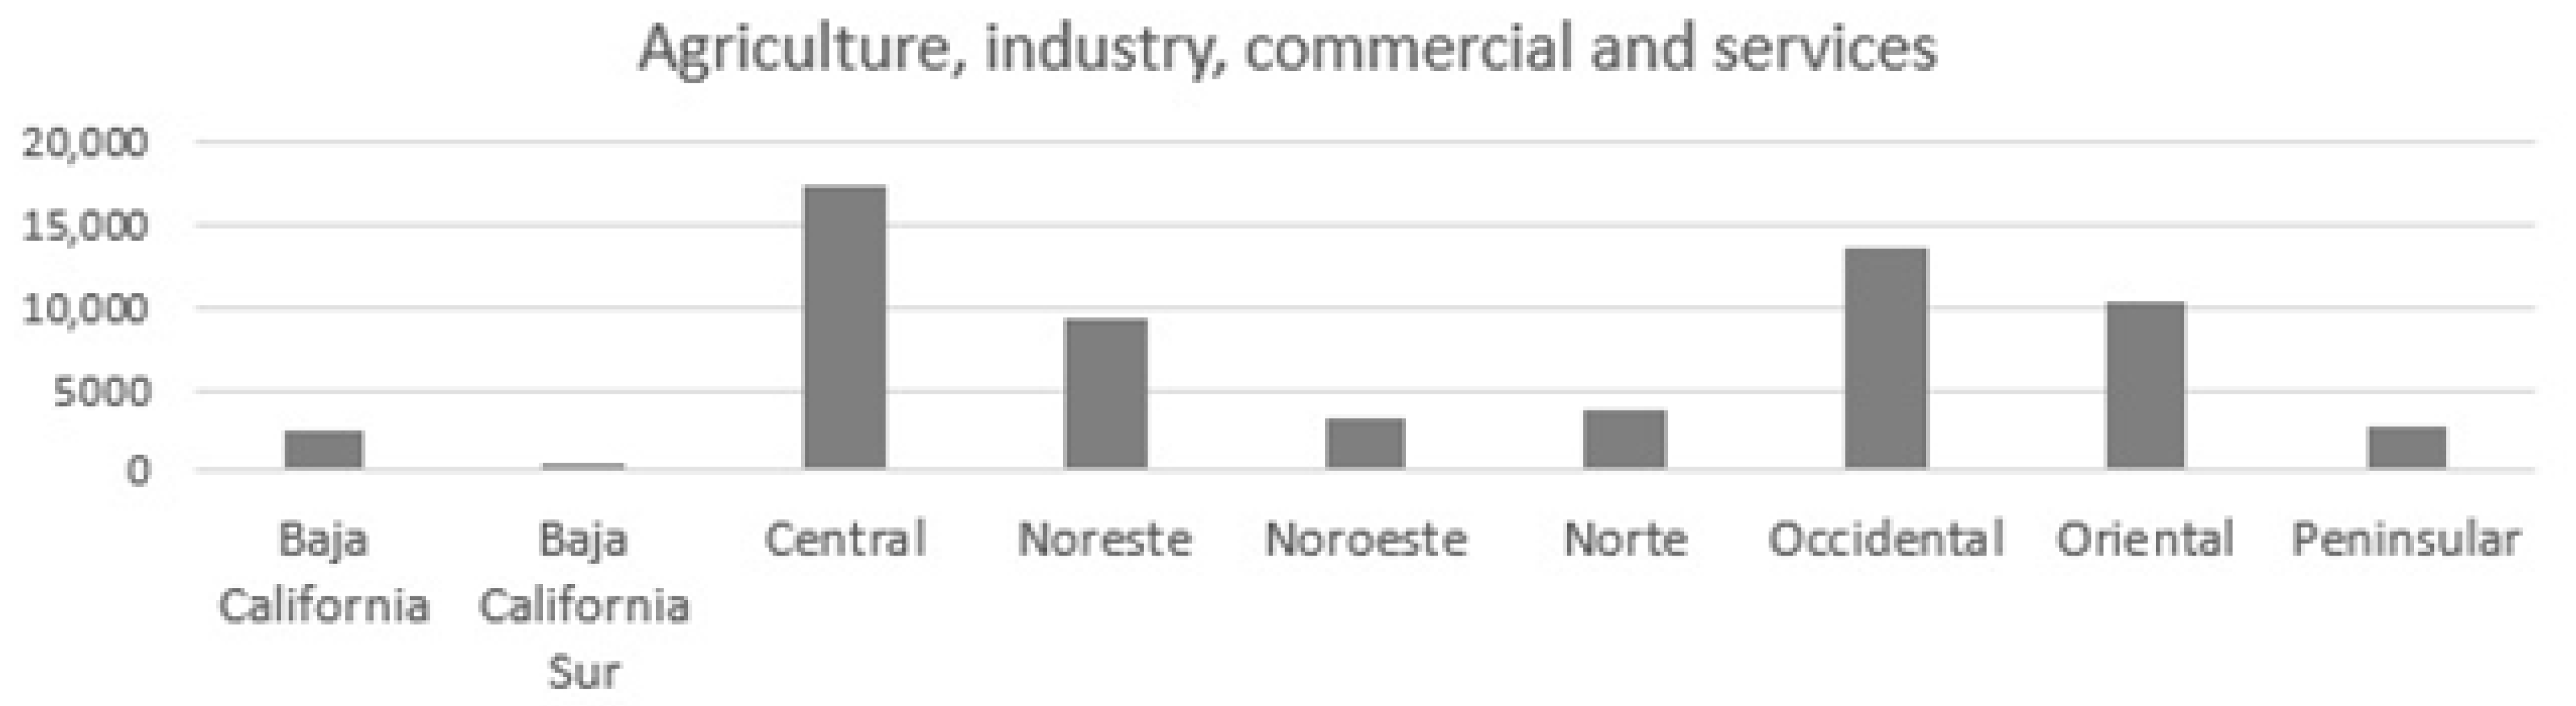
Electrical Energy Throughput in Economic Sectors (ETpw) and in the Household Sector (EThh)

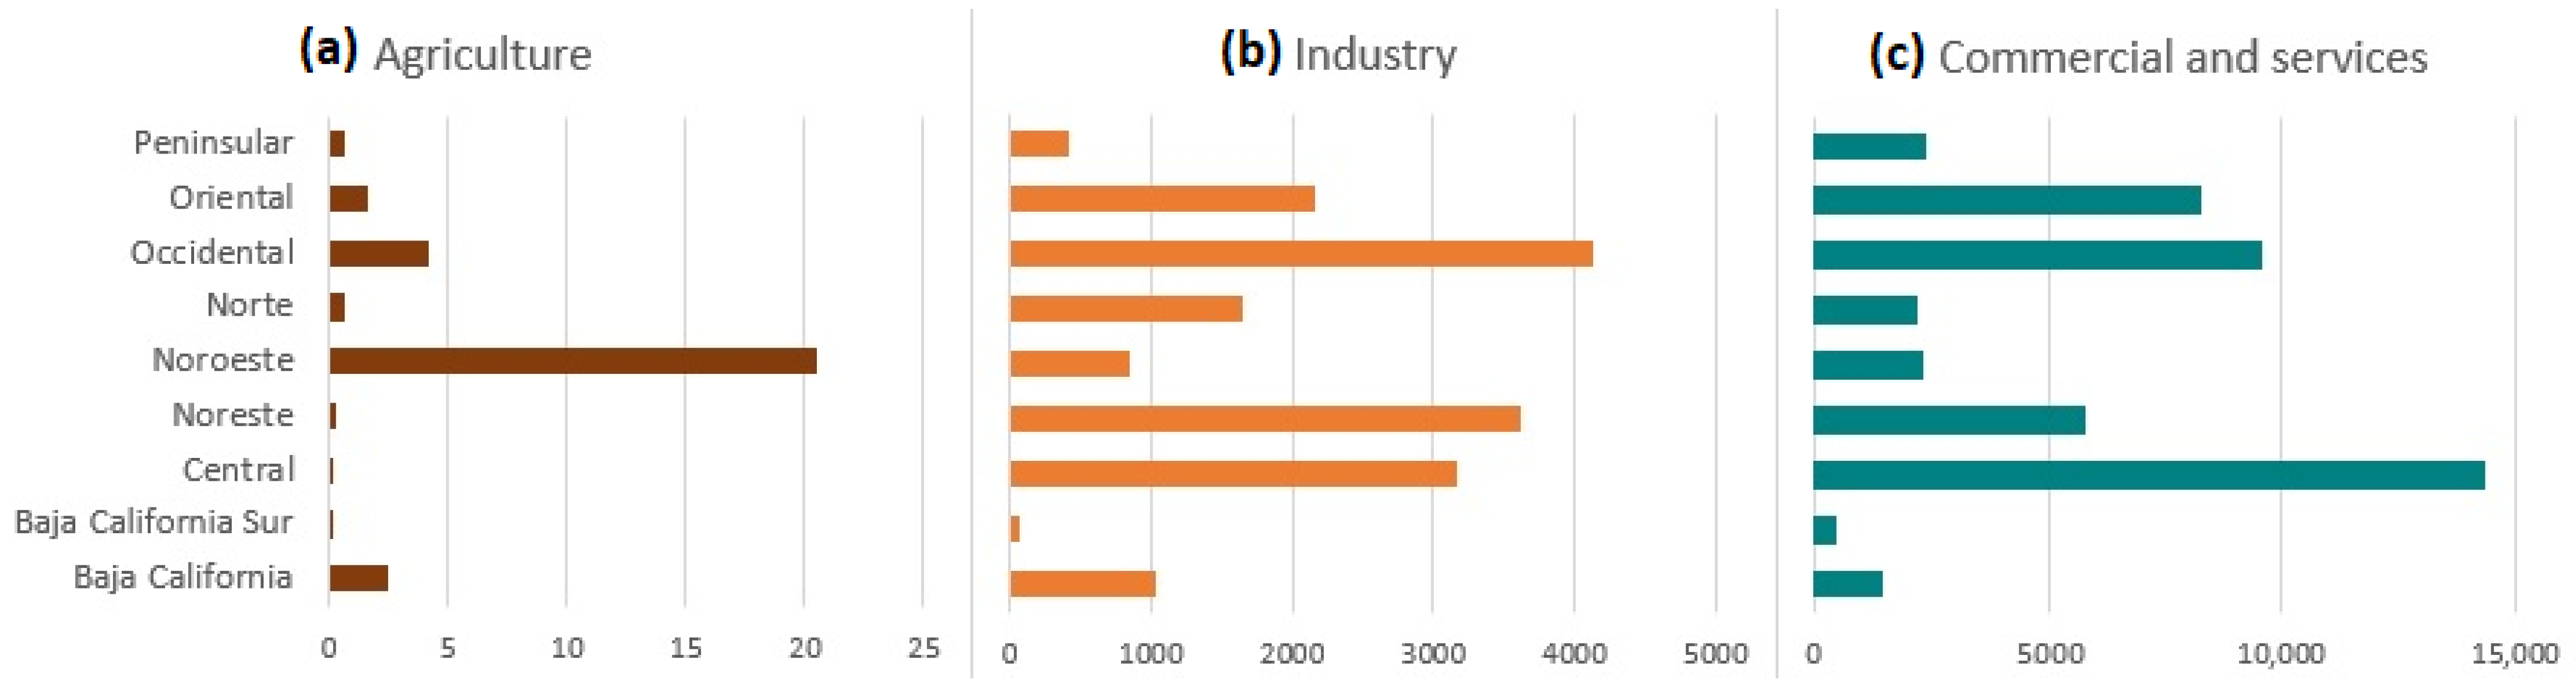
  • Electrical Energy throughput in Economic Sectors (ETpwi)
According to data from CFE [37], the industry sector had the highest electricity consumption because of the use of automated processes and mechanization, and this is revealed in the behavior of the ETpwi indicator. When ETpwi is analyzed by regions, it is observed that the Occidental region reached the highest value with 38,768 GWh (22.6%), followed by Central with 30,855 GWh (17.8%), Noreste with 27,120 GWh (16.6%), Oriental with 22,318 GWh (16.1%), Norte with 15,312 GWh (8.4%) and Noroeste with 9604 GWh (8.0%). The regions that presented the lowest consumption values were Baja California with 7098 GWh, Baja California Sur with 1525 GWh, and Peninsular with 6439 GWh, which represented 10.6% of the energy consumed in the paid sector (Figure 5).
When focusing on each economic sector disaggregated by control regions, we can notice that in the agricultural sector, four regions stand out as having the highest electrical consumption: Norte with 3877 GWh (35.1%), Occidental with 3740 GWh (33.9%), Noroeste with 1467 GWh (13.3%) and Oriental with 672 GWh (6.1%). In this same sector, the regions with the least energy consumption were Baja California with 357 GWh, Baja California Sur with 2016 GWh, Central with 223 GWh, Noreste with 363 GWh, and Peninsular with 125 GWh; whose added percentage of electric consumption was 11.5% (Figure 6a).
Regarding the electrical consumption of the industry sector, the following control regions were highlighted: Occidental with 33,899 GWh (23.6%), Central with 29,699 GWh (20.7%), Noreste with 23,304 GWh (18.3%) and Oriental with 20,498 GWh (14.3%). The remaining control regions presented lower electricity consumption as follows: Baja California with 6660 GWh (4.6%), Baja California Sur with 1291 GWh (0.9%), Noroeste with 7928 GWh (5.5%), Norte with 11,180 GWh (7.8%), and Peninsular with 6038 GWh (4.2%) (Figure 6b).
Finally, the electricity consumption of the commercial and services sector was higher in the Oriental region with 1148 GWh (25.5%), Occidental with 1128 GWh (25%), Central with 933 (20.7%), and Noreste with 451 GWh (10%). To a lesser extent, regions with lower electricity consumption were Baja California with 81 GWh, Baja California Sur with 28 GWh, Noroeste with 208 GWh, Norte with 255 GWh, and Peninsular with 276 GWh (Figure 6c).
  • Electrical Energy throughput per Capita in the Household Sector (EThh)
The data on electricity consumption per capita in the household sector by region shows that the highest values were reached in the following regions: Noroeste with 1.34 MWh, Baja California Sur with 1.1 MWh, Baja California with 0.99 MWh, Noreste with 0.80 MWh and Peninsular with 0.74 MWh. Regions with less electricity consumption per capita were Norte with 0.48 MWh, Oriental with 0.4 MWh, Occidental with 0.37 MWh, and Central with 0.29 MWh (Figure 7).

Added Value (AVi)

In 2018, the control region that contributed the most in added value (AV) was the Central with 3108 BMXN, representing 34.8% of the total, followed by the Noreste with 1712 BMXN (19.2%), Occidental with 1692 BMXN. (18.9%) and Oriental with 941 BMXN (10.5%). The following regions generated the remaining 16%: Baja California with 293 BMXN, Baja California Sur with 52 BMXN, Noroeste with 386 BMXN, Norte with 490 BMXN, and Peninsular with 255 BMXN (Figure 8).
The added value of the agricultural sector had the highest values in the following regions: Noroeste with 8.3 BMXN (47.7%), Oriental with 2.04 BMXN (11.7%), Peninsular with 2.02 BMXN (11.6%), and Occidental with 1.6 BMXN (8.9%). The regions that contributed the least in this sector were Baja California with 1.3 BMXN (7.2%). Noreste with 1 BMXN (5.9%), Baja California Sur with 1 BMXN (5.9%), Central with 0.2 BMXN (0.9%), and Norte with 0.05 BMXN (0.3%) (Figure 9a).
Regarding the industry sector, regions with the highest contributions in added value were Noreste with 981 BMXN (27.6%), Occidental with 835 BMXN (23.5%), Central with 737 BMXN (20.7%), Oriental with 345 BMXN (9.7%) and Norte with 287 BMXN (8.1%). The remaining regions contributed to a lesser extent in this way: Noroeste with 171 BMXN (4.8%), Baja California with 155 BMXN (4.4%), Peninsular with 38 BMXN (1.1%), and Baja California Sur with 8.5 BMXN (0.2%) (Figure 9b).
In the commercial and services sector, the contribution of the Central region stands out with 2371 BMXN (44.3%), Occidental with 856 BMXN (16%), Noreste with 730 BMXN (13.6%), and Oriental with 594 BMXN (11.1%). Regions that contributed to a lesser extent were Peninsular with 215 BMXN (4%), Noroeste with 207 BMXN (3.9%), Norte with 203 BMXN (3.8%), Baja California with 138 BMXN (2.6%), and Baja California Sur with 43 BMXN (0.8%) (Figure 9c).

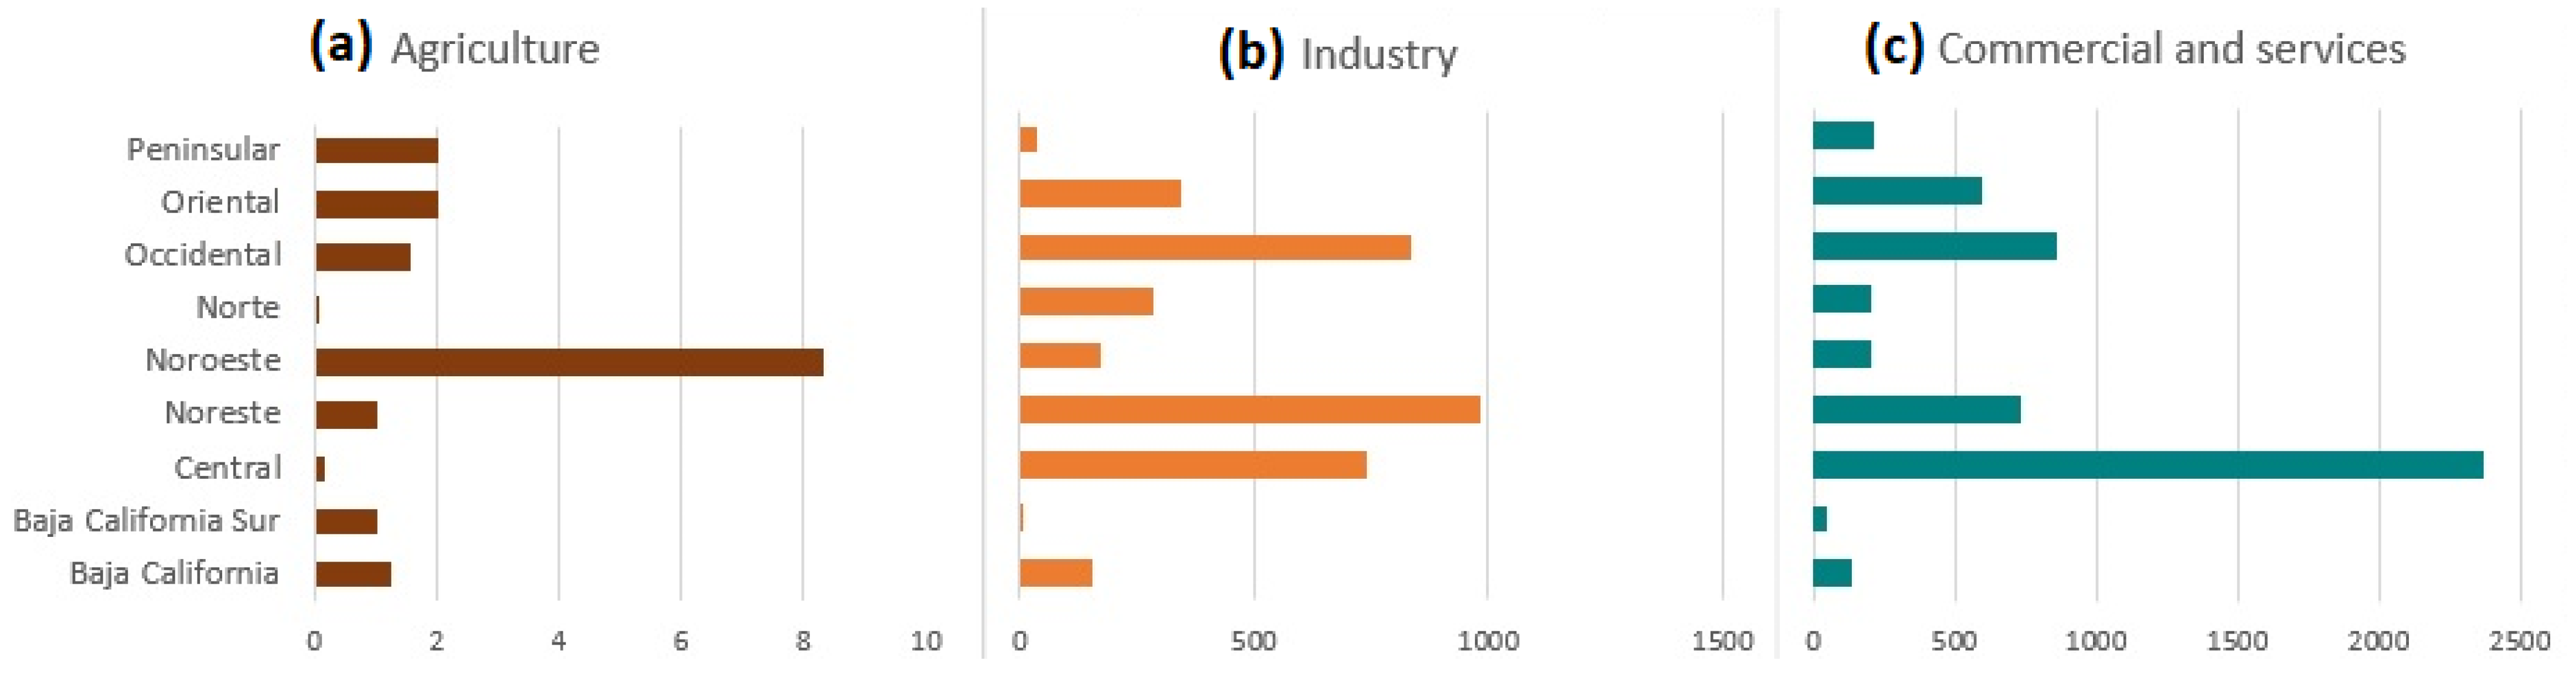
3.3.2. MuSIASEM Indicators by Sectors and Regions

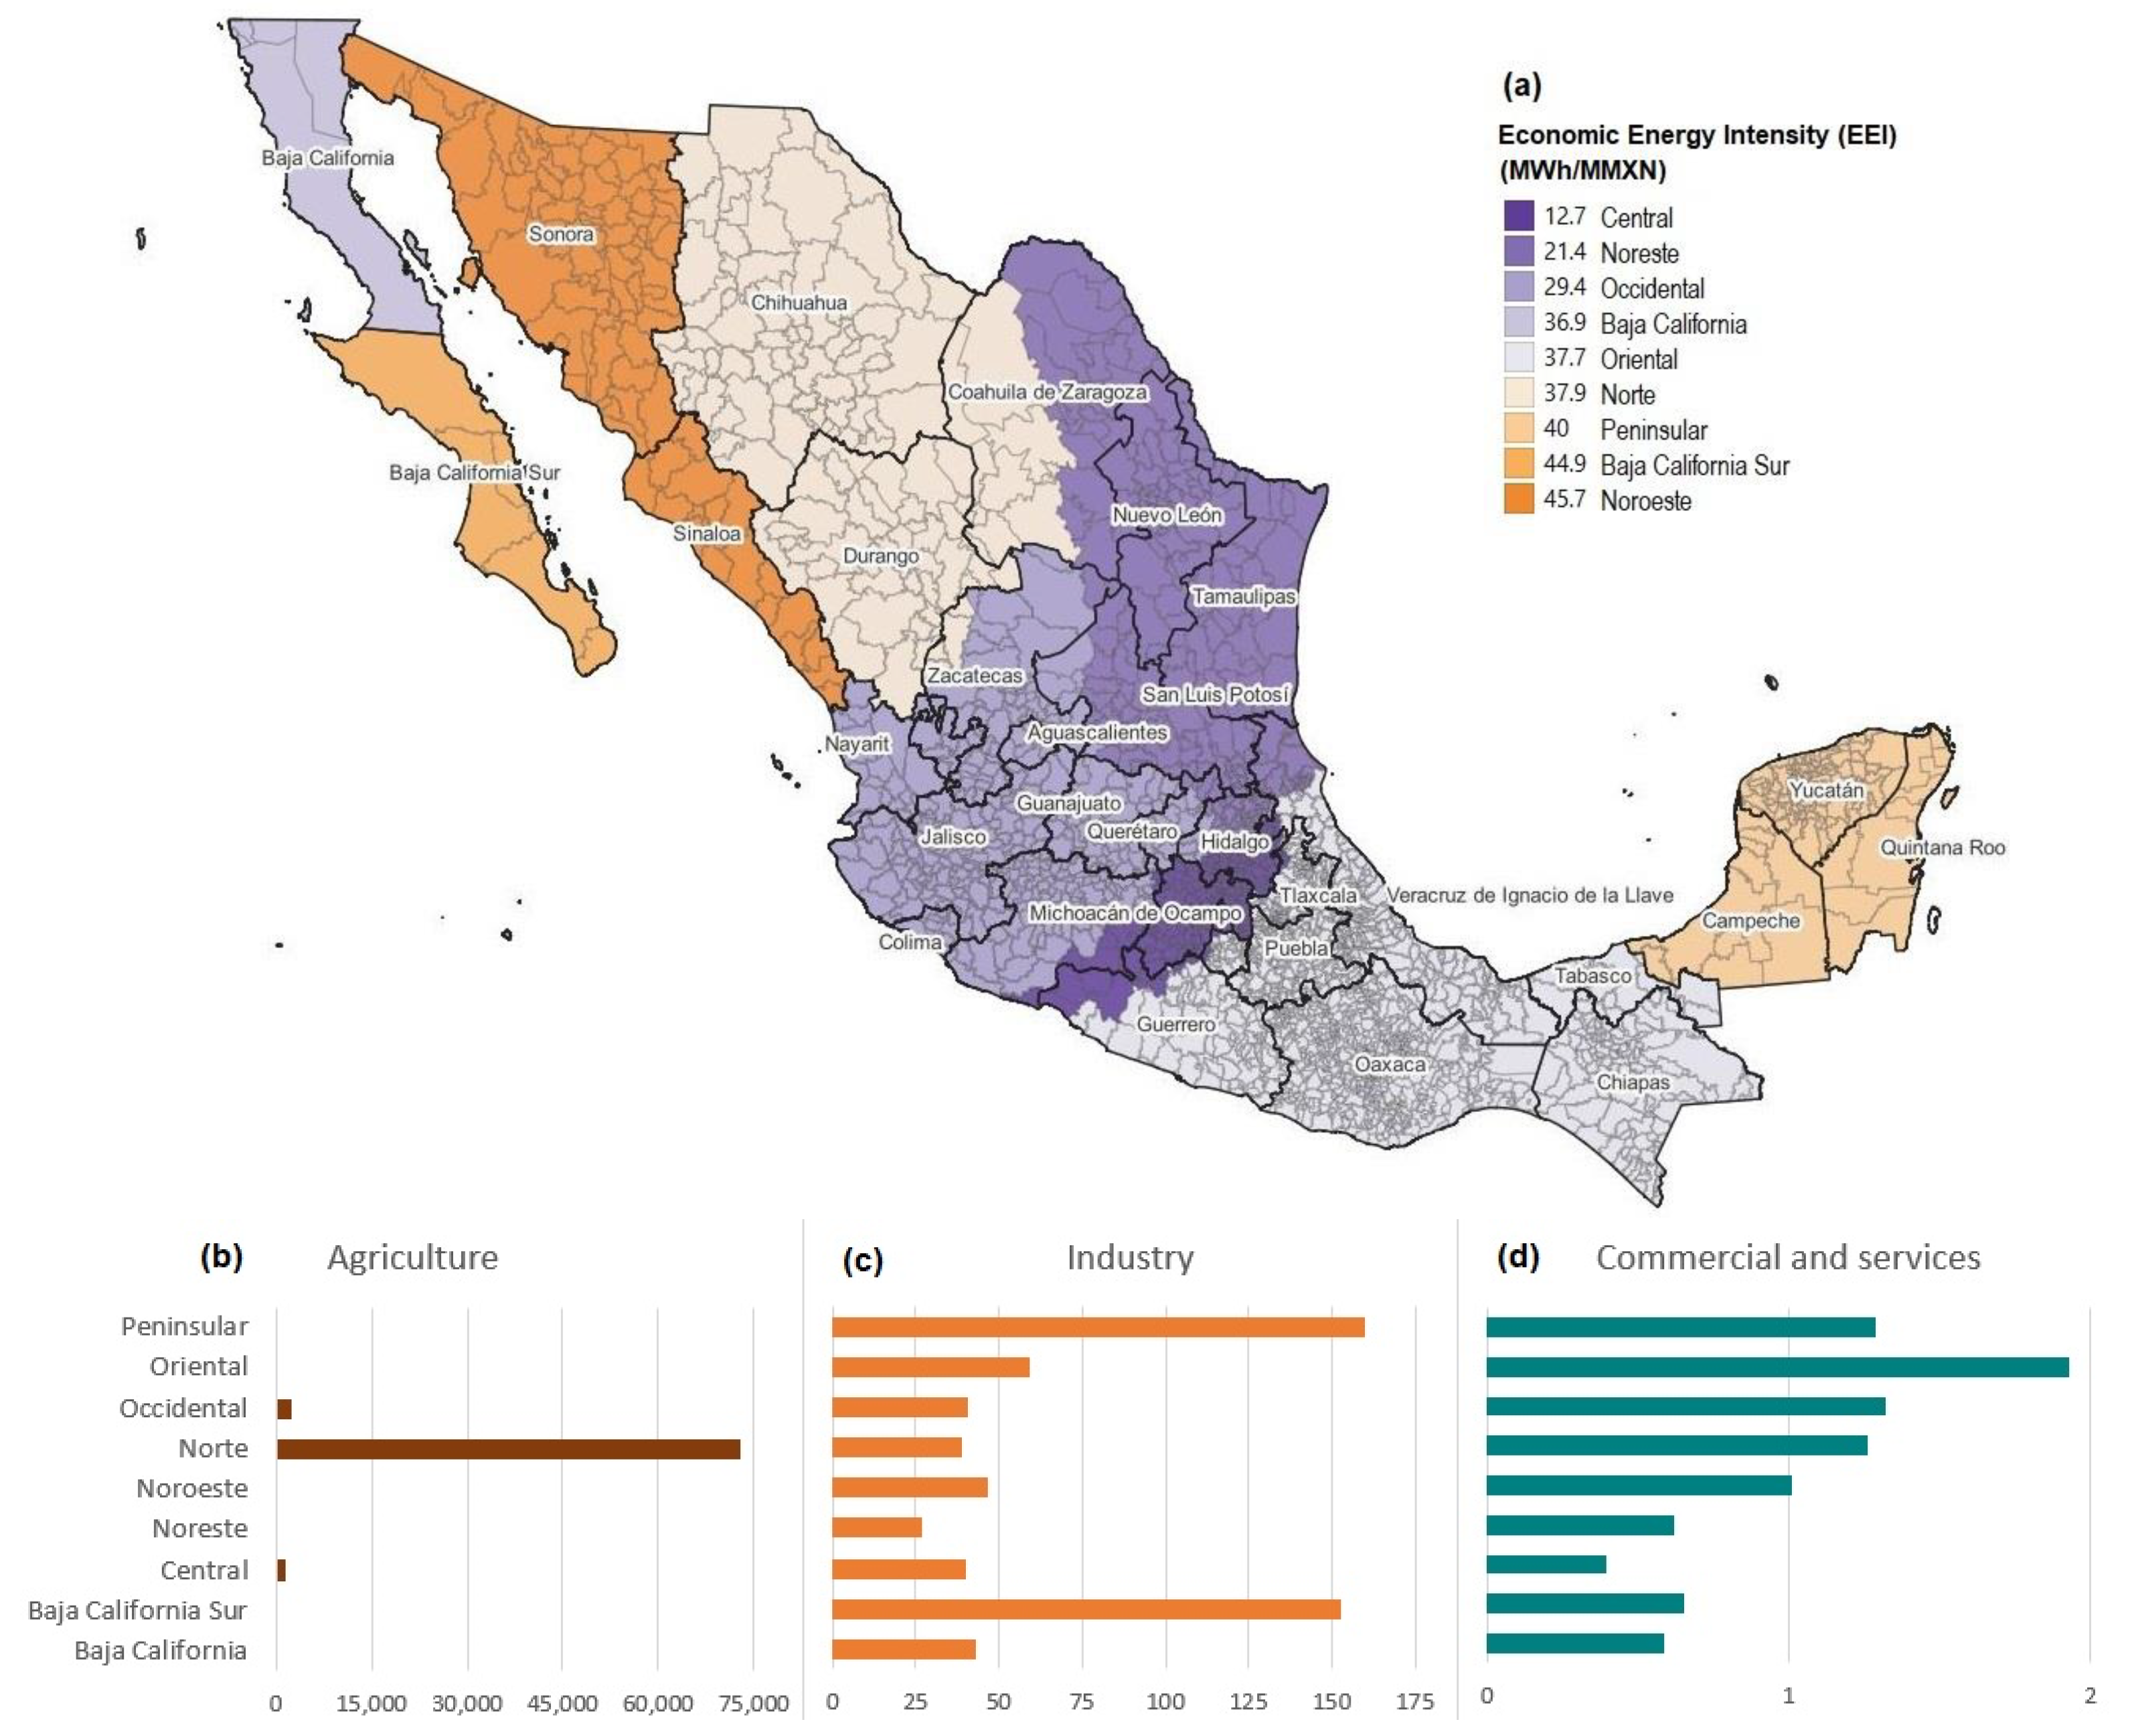
Economic Energy Intensity (EEIi)

Considering all economic sectors distributed by regions, the Central region had the lowest value of EEI with 12.7 MWh/MMXN, followed by Noreste with 21.4 MWh/MMXN, Occidental with 29.4 MWh/MMXN, Baja California with 36.9 MWh/MMXN, Oriental with 37.7 MWh/MMXN, Norte with 37.9 MWh/MMXN, Peninsular with 40 MWh/MMXN, Baja California Sur with 44.9 MWh/MMXN and, finally, the highest value in Noroeste region with 45.7 MWh/MMXN. (Figure 10a).
Analysis of the EEIi indicator shows that in the agricultural sector, the Norte region stands out from other regions with 72,967 MWh/MMXN, followed by regions: Occidental with 2416 MWh/MMXN and Central with 1424 MWh/MMXN. Values of EEIi were smaller in Noreste with 355 MWh/MMXN, Oriental with 330 MWh/MMXN, Baja California with 285 MWh/MMXN, Baja California Sur with 199 MWh/MMXN, and Noroeste with 177 MWh/MMXN (Figure 10b).
Regarding the industry sector, two regions had the maximum values of EEIi; they were Baja California Sur with 153 MWh/MMXN and Peninsular with 160 MWh/MMXN, followed by Oriental with 60 MWh/MMXN, Noroeste with 46 MWh/MMXN, Baja California with 43 MWh/MMXN, Central, Occidental and Norte with 40 MWh/MMXN each, and the lowest value corresponded to Noreste with 27 MWh/MMXN. (Figure 10c).
Finally, in the commercial and services sector, the Oriental region had the highest value of EEIi with 1.9 MWh/MMXN, followed by regions Norte, Occidental, and Peninsular with 1.3 MWh/MMXN each, Noroeste with 1 MWh/MMXN, Baja California Sur with 0.7 MWh/MMXN, Noroeste and Baja California with 0.6 MWh/MMXN each, and Central region with 0.4 MWh/MMXN (Figure 10d).

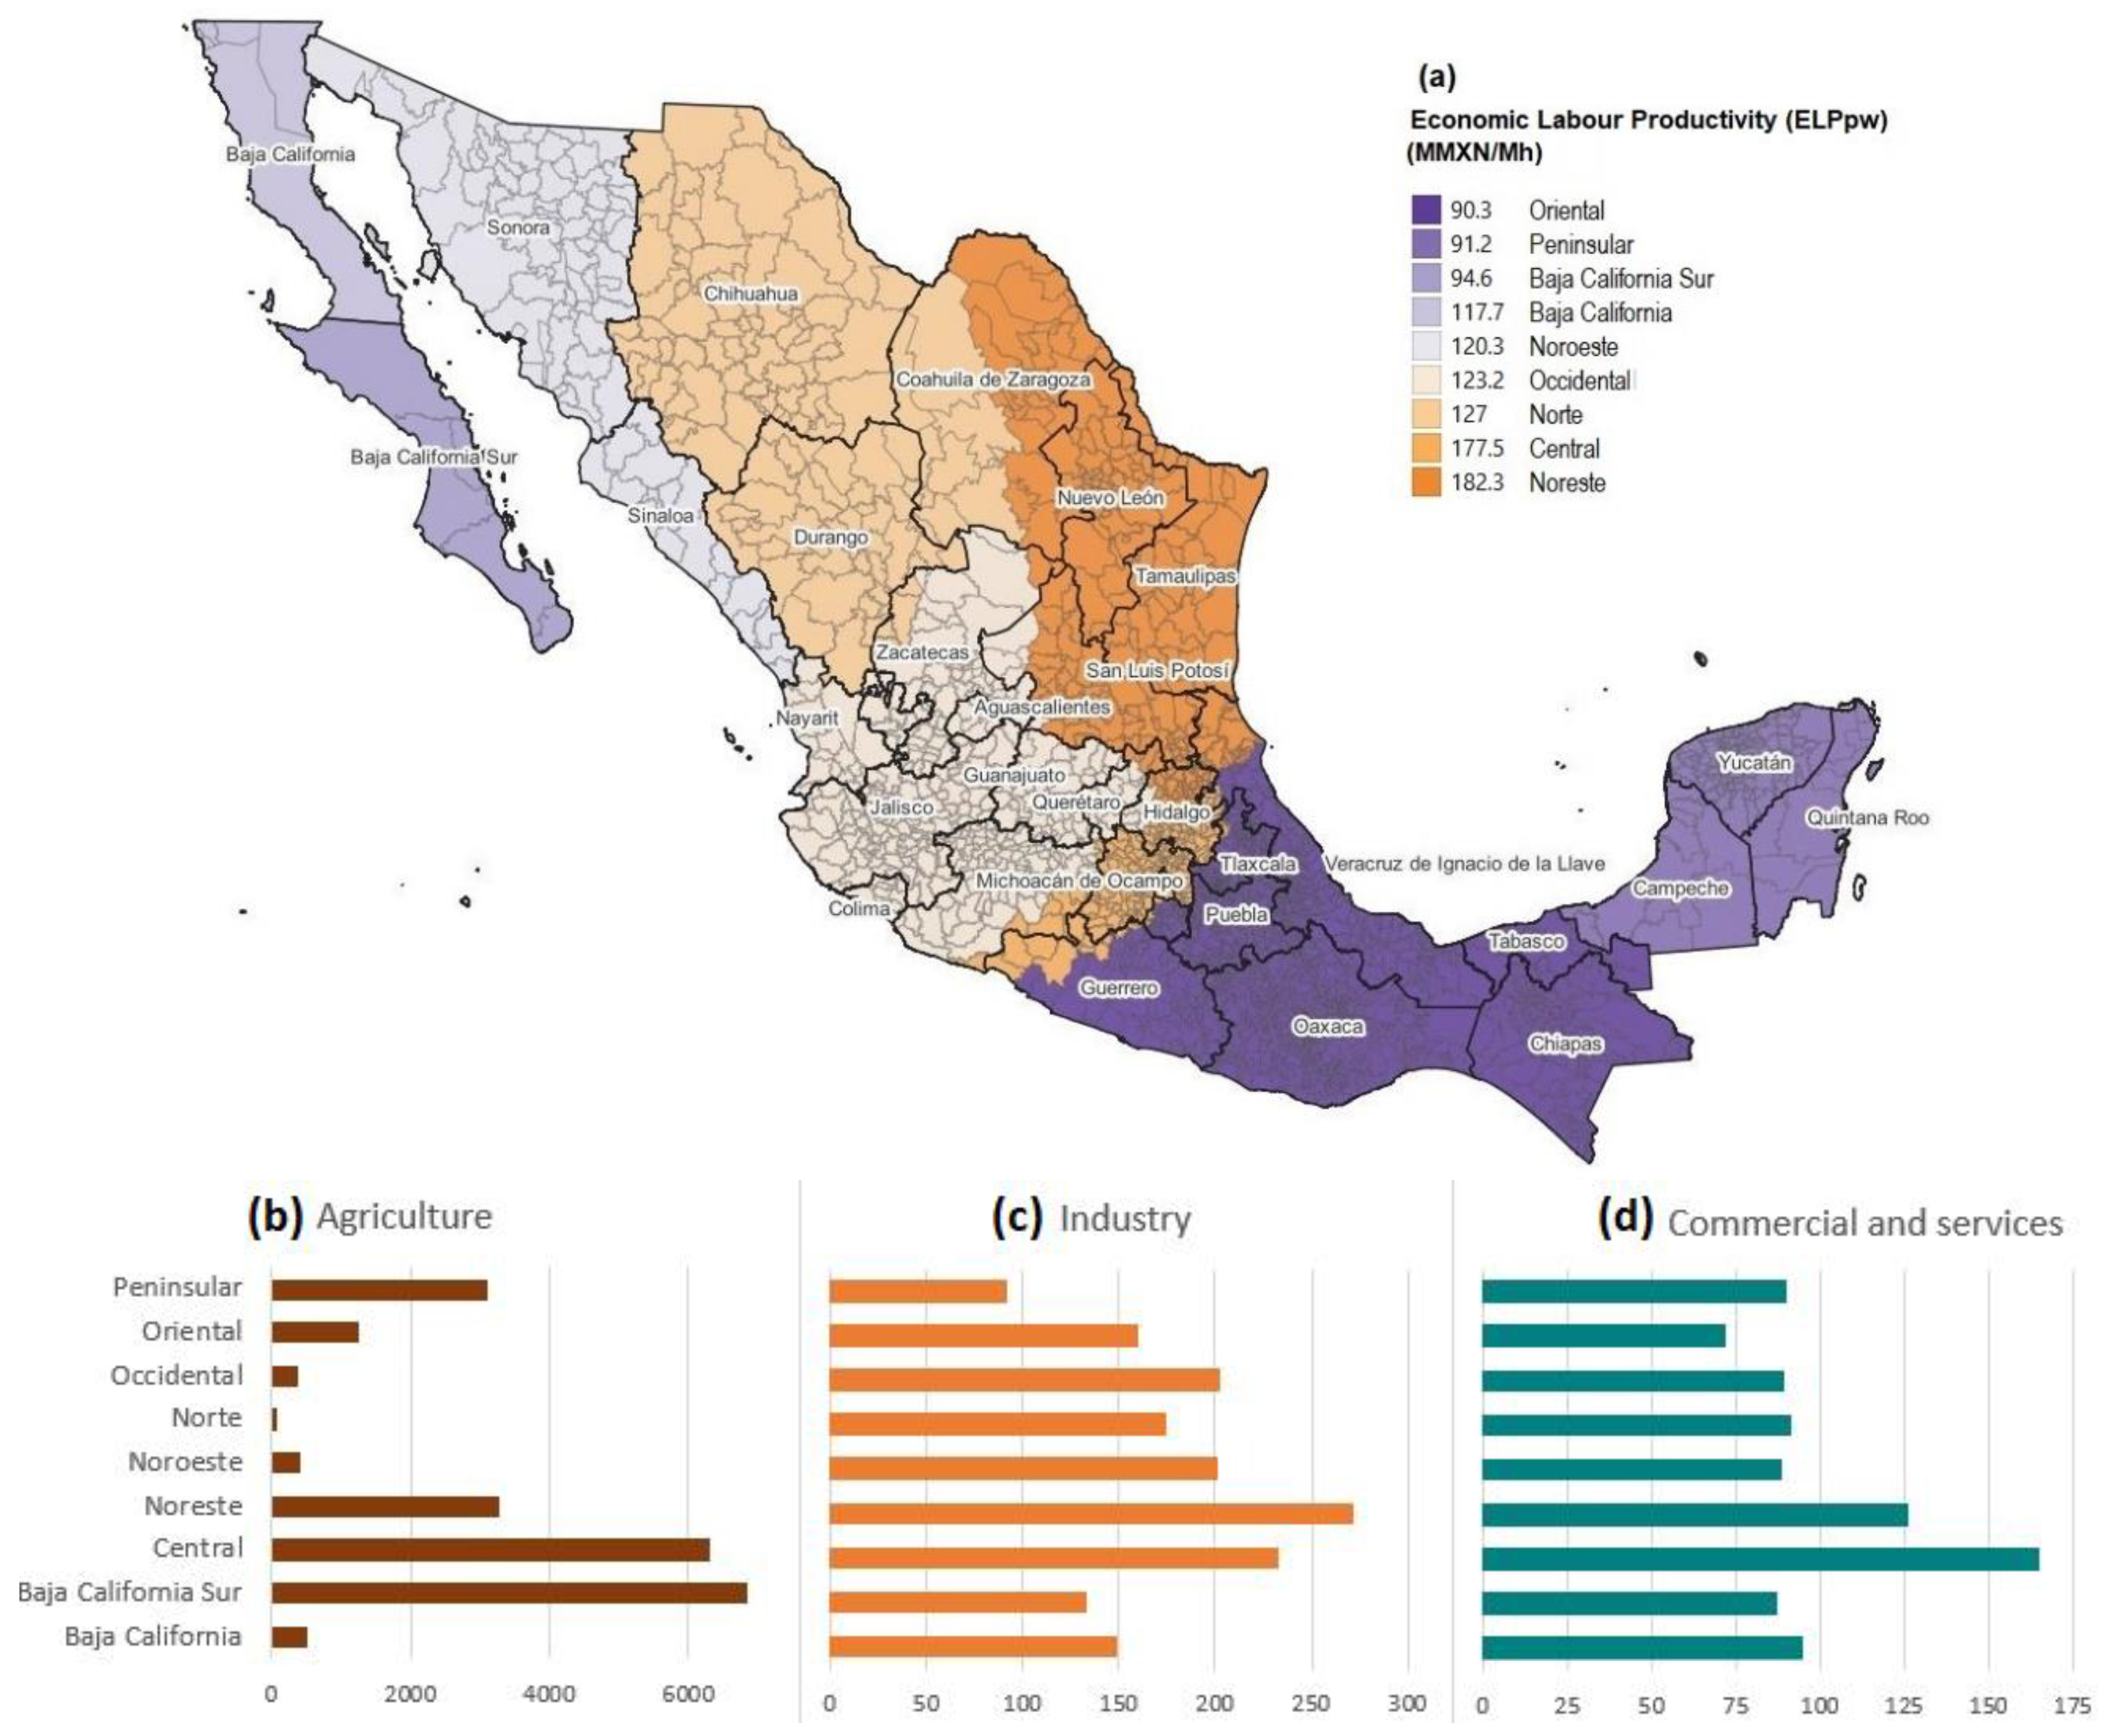
Economic Labour Productivity (ELPpwi)

Regions with the highest ELPpwi were: Noreste with 182.3 MMXN/Mh, Central with 177.5 MMXN/Mh, Norte with 127 MMXN/Mh, and Occidental with 123.2 MMXN/Mh. Followed by regions with a smaller value of ELPpwi: Noroeste with 120.3 MMXN/Mh, Baja California with 117.7 MMXN/Mh, Baja California Sur with 94.6 MMXN/Mh, Peninsular with 91.2 MMXN/Mh and Oriental with 90.3 MMXN/Mh. (Figure 11a).
Considering the ELPpwi values by regions, it is observed the highest values in the agricultural sector corresponded to the following regions: Baja California Sur with 6852 MMXN/Mh, Central with 6320 MMXN/Mh, Noreste with 3271 MMXN/Mh, and Peninsular with 3098 MMXN/Mh. Lower values corresponded to the regions: Oriental with 1267 MMXN/Mh, Norte with 87 MMXN/Mh, Occidental with 376 MMXN/Mh, Noroeste with 406 MMXN/Mh, and Baja California with 506 MMXN/Mh (Figure 11b).
The highest values of ELPpwi in the industrial sector were presented in the Noreste and Central regions (with 272 and 233 MMXN/Mh respectively), followed by Noroeste and Occidental with 202 MMXN/Mh each, Norte with 175 MMXN/Mh, Oriental with 159 MMXN/Mh, Baja California with 149 MMXN/Mh. The lowest values were presented in Baja California Sur and Peninsular with 133 and 92 MMXN/Mh, respectively (Figure 11c).
Finally, considering data on the commercial and services sector, the Central and Noroeste regions stand out with 165 and 126 MMXN/Mh, respectively. The following regions had intermediate values: Baja California with 94.7 MMXN/Mh, Norte with 91.4 MMXN/Mh, Peninsular with 90.3 MMXN/Mh, Occidental with 89.1 MMXN/Mh, Noroeste with 88.3 MMXN/Mh. The lowest values were presented in Baja California Sur with 87.5 MMXN/Mh, and Oriental with 71.9 MMXN/Mh (Figure 11d).

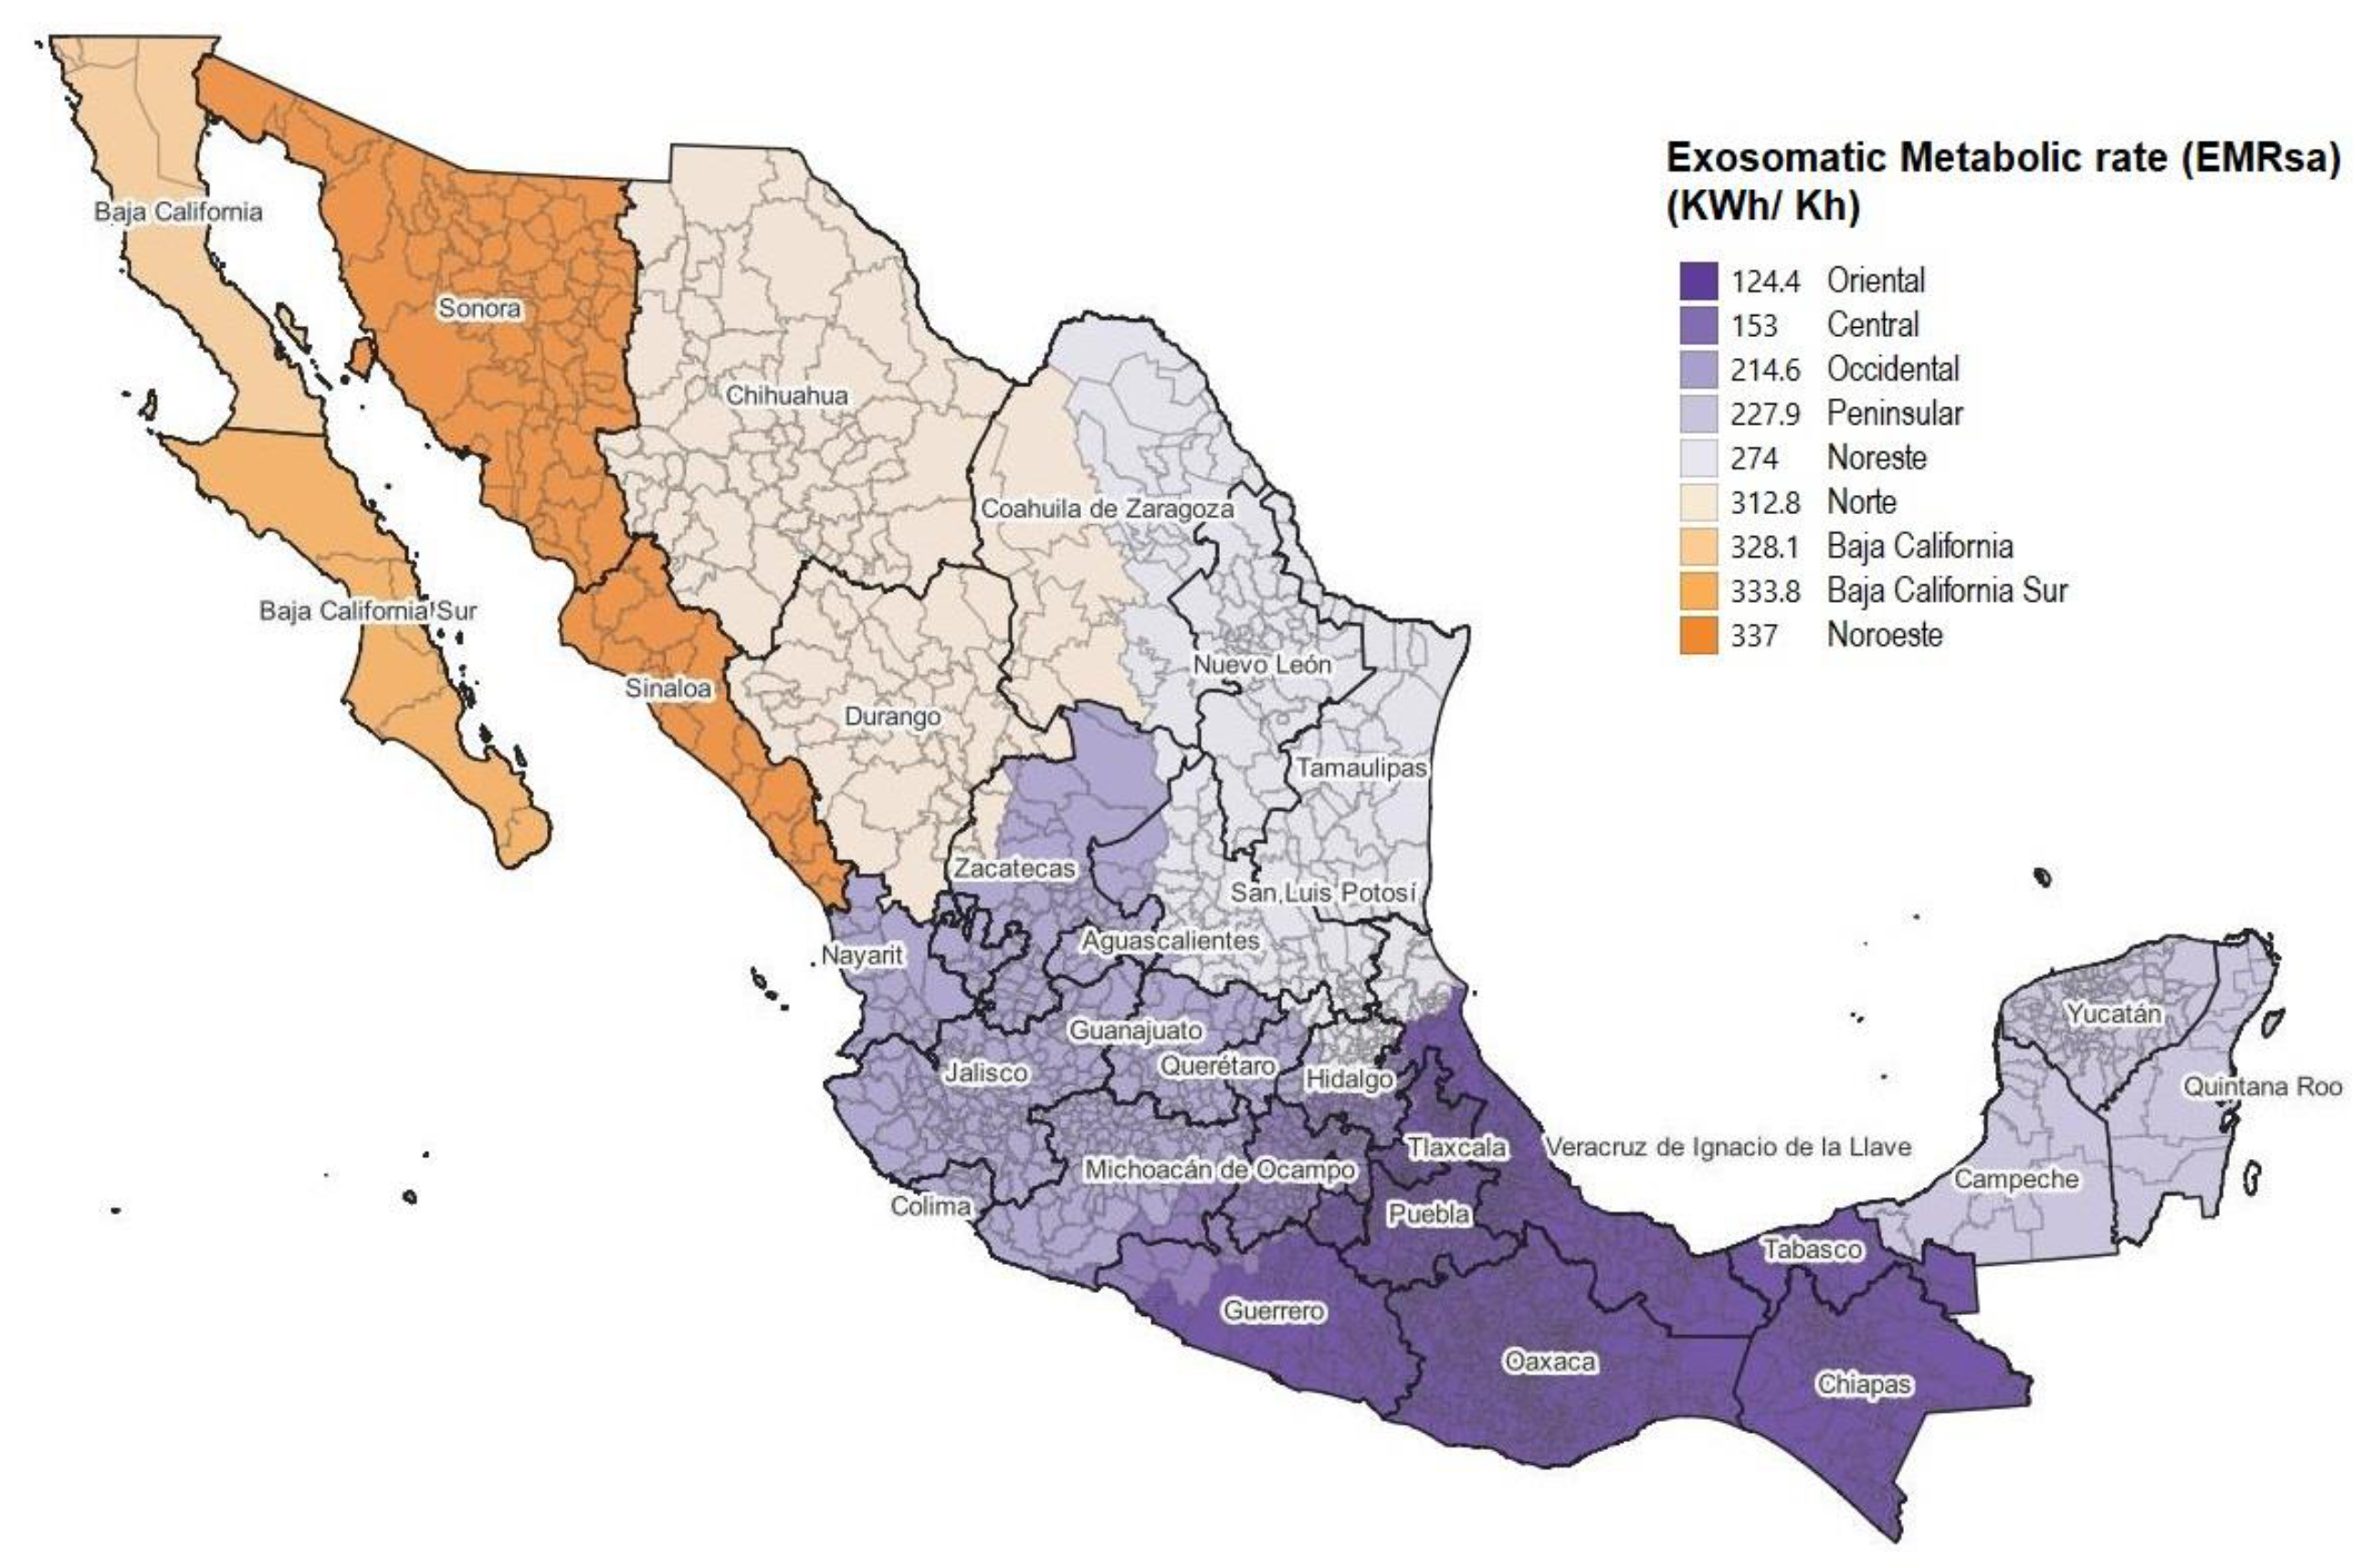
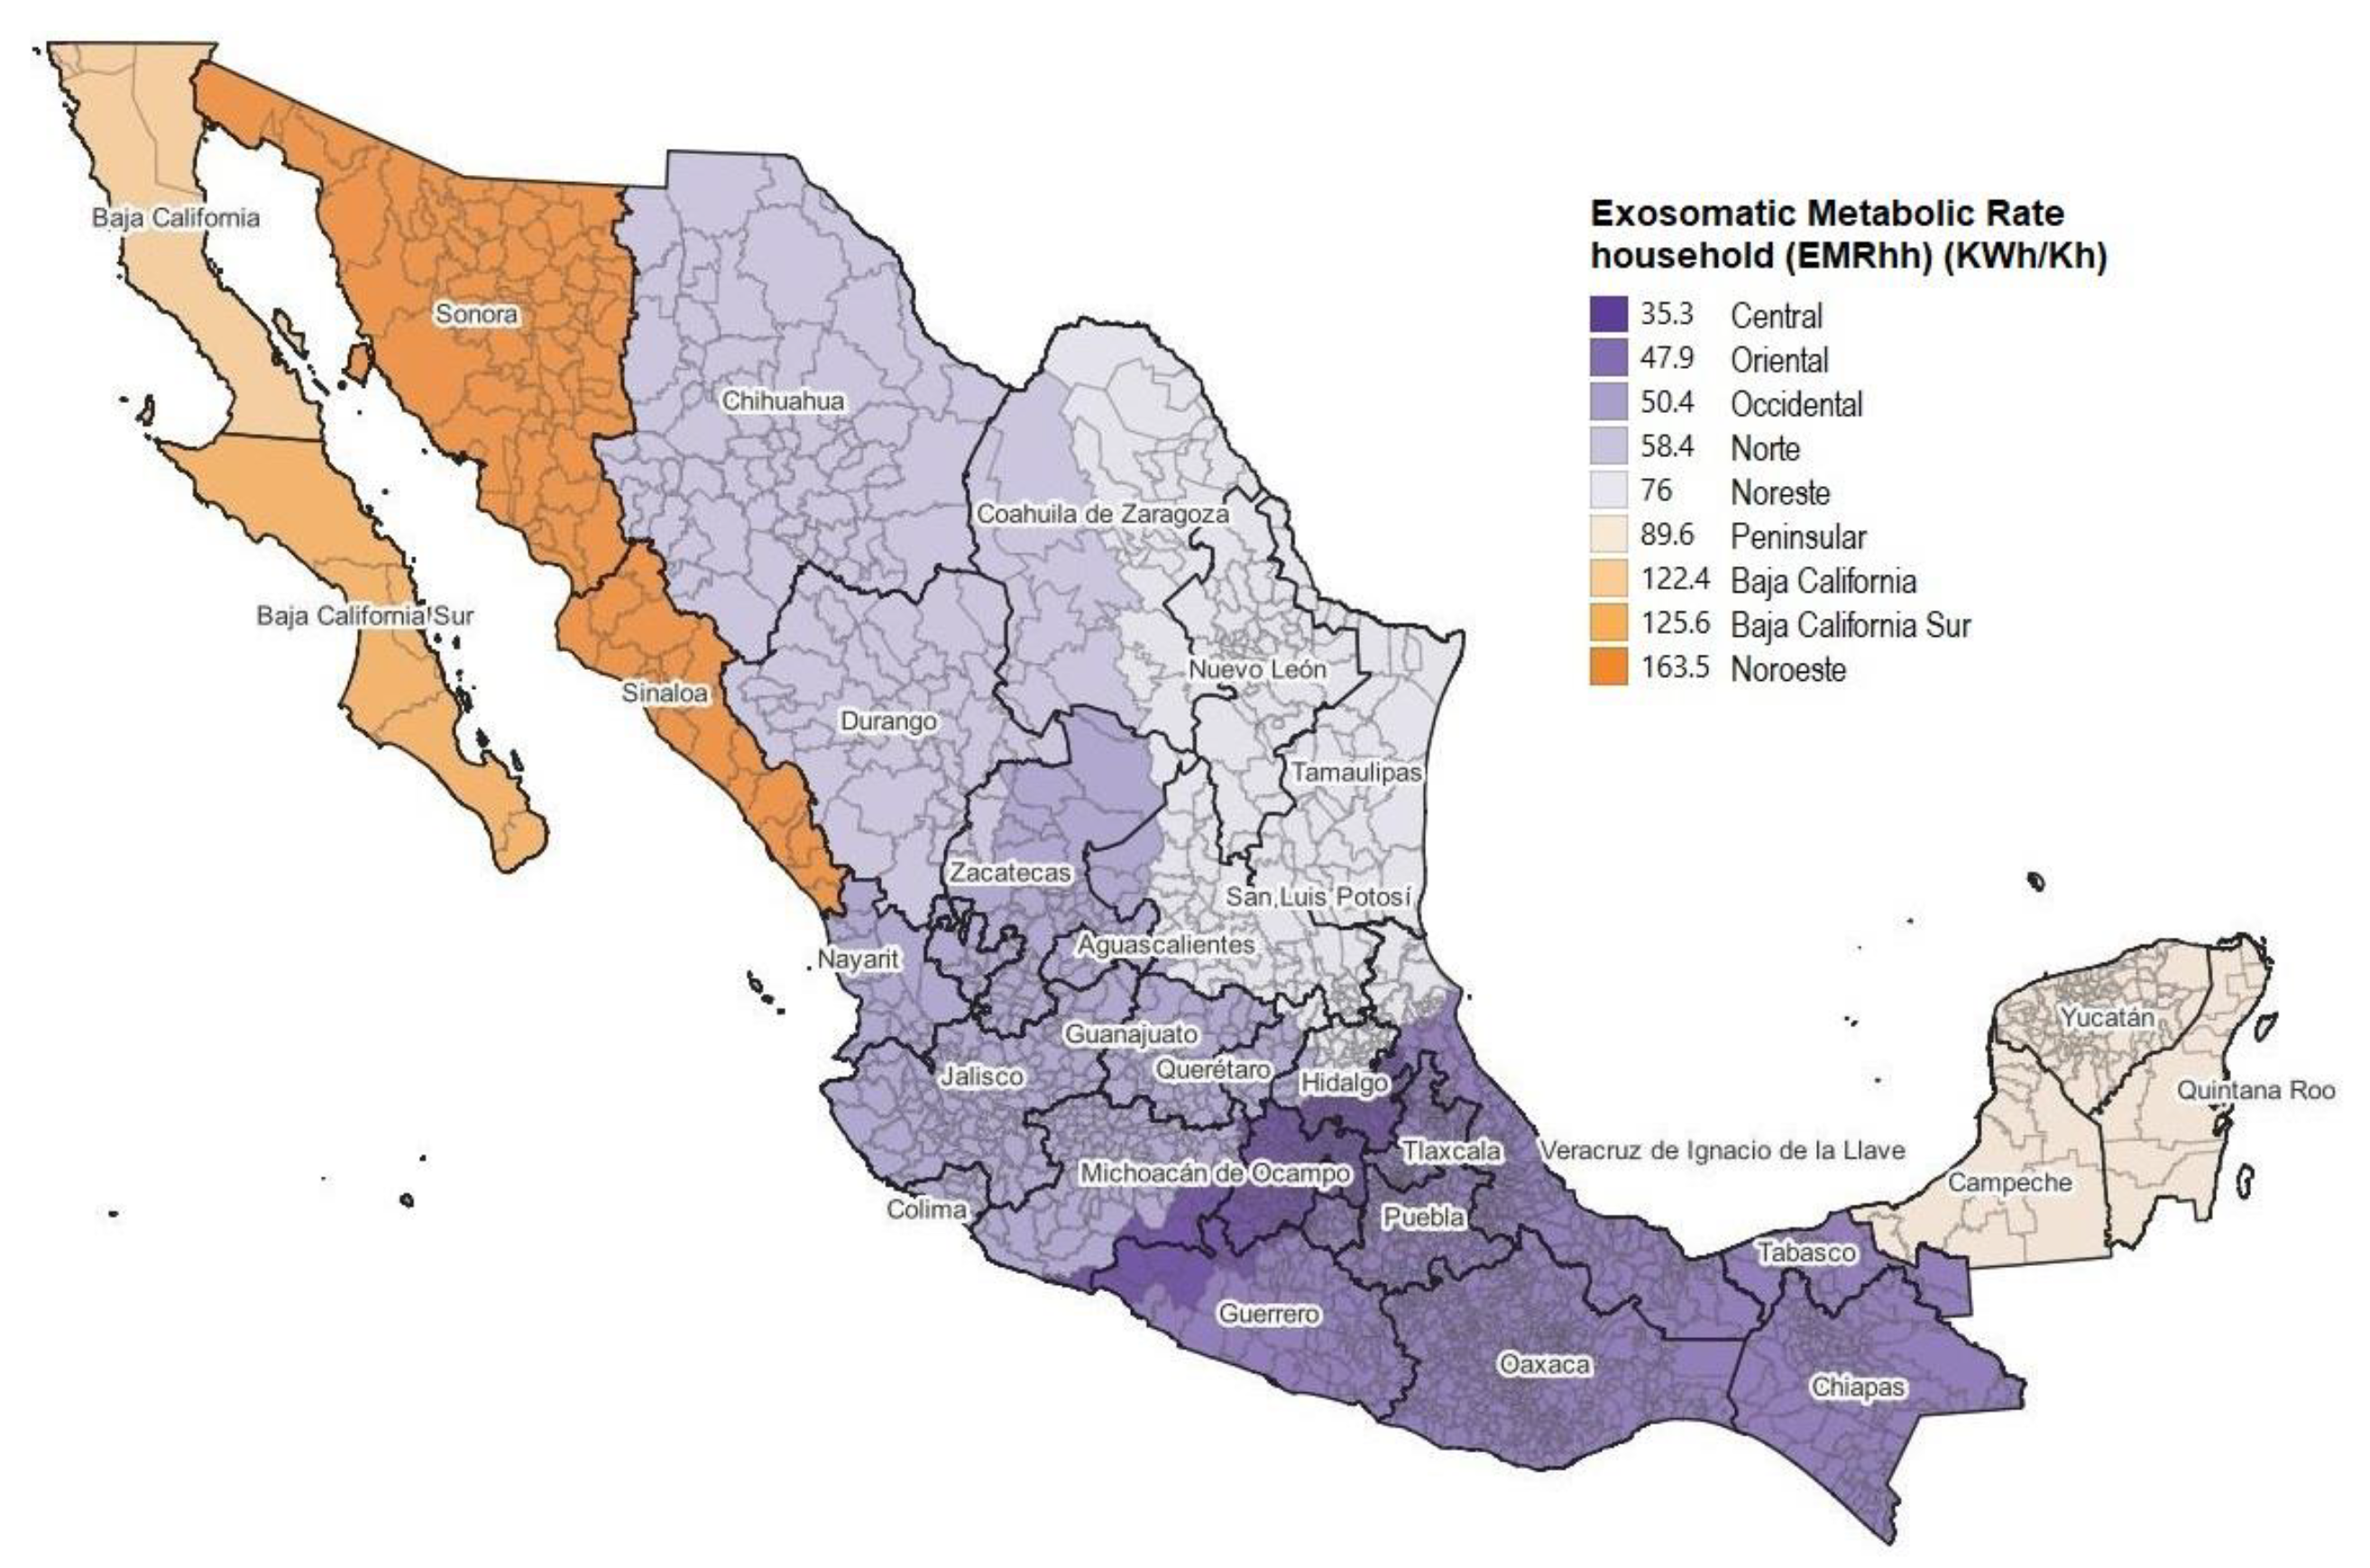
Exosomatic Metabolic Rate in the Household Sector (EMRhh) and in the Economic Sectors (EMRpwi)

Considering the exosomatic metabolic rate for both the household sector and economic sectors (EMRsa), it is observed that regions in the northern part of the country had higher values: Noroeste with 337 KWh/Kh, Baja California Sur with 334 KWh/Kh, Baja California with 328 KWh/Kh, Norte with 313 KWh/Kh and Noreste with 274 KWh/Kh. While the following regions registered lower values of EMRsa: Oriental with 124 KWh/Kh, Central with 153 KWh/Kh, Occidental with 215 KWh/Kh, and Peninsular with 228 KWh/Kh. (Figure 12).
  • Exosomatic Metabolic Rate in the Household Sector (EMRhh)
The data show that the highest values of EMRhh occurred in the following regions: Noroeste with 163.5 KWh/Kh, Baja California Sur with 125.6 KWh/Kh, Baja California with 122.4 KWh/Kh, Peninsular with 89.6 KWh/Kh, Noreste with 76 KWh/Kh. EMRhh values were lower in the following regions: Norte with 58.4 KWh/Kh, Occidental with 50.4 KWh/Kh, Oriental with 47.9 KWh/Kh, and Central with 35.3 KWh/Kh (Figure 13).
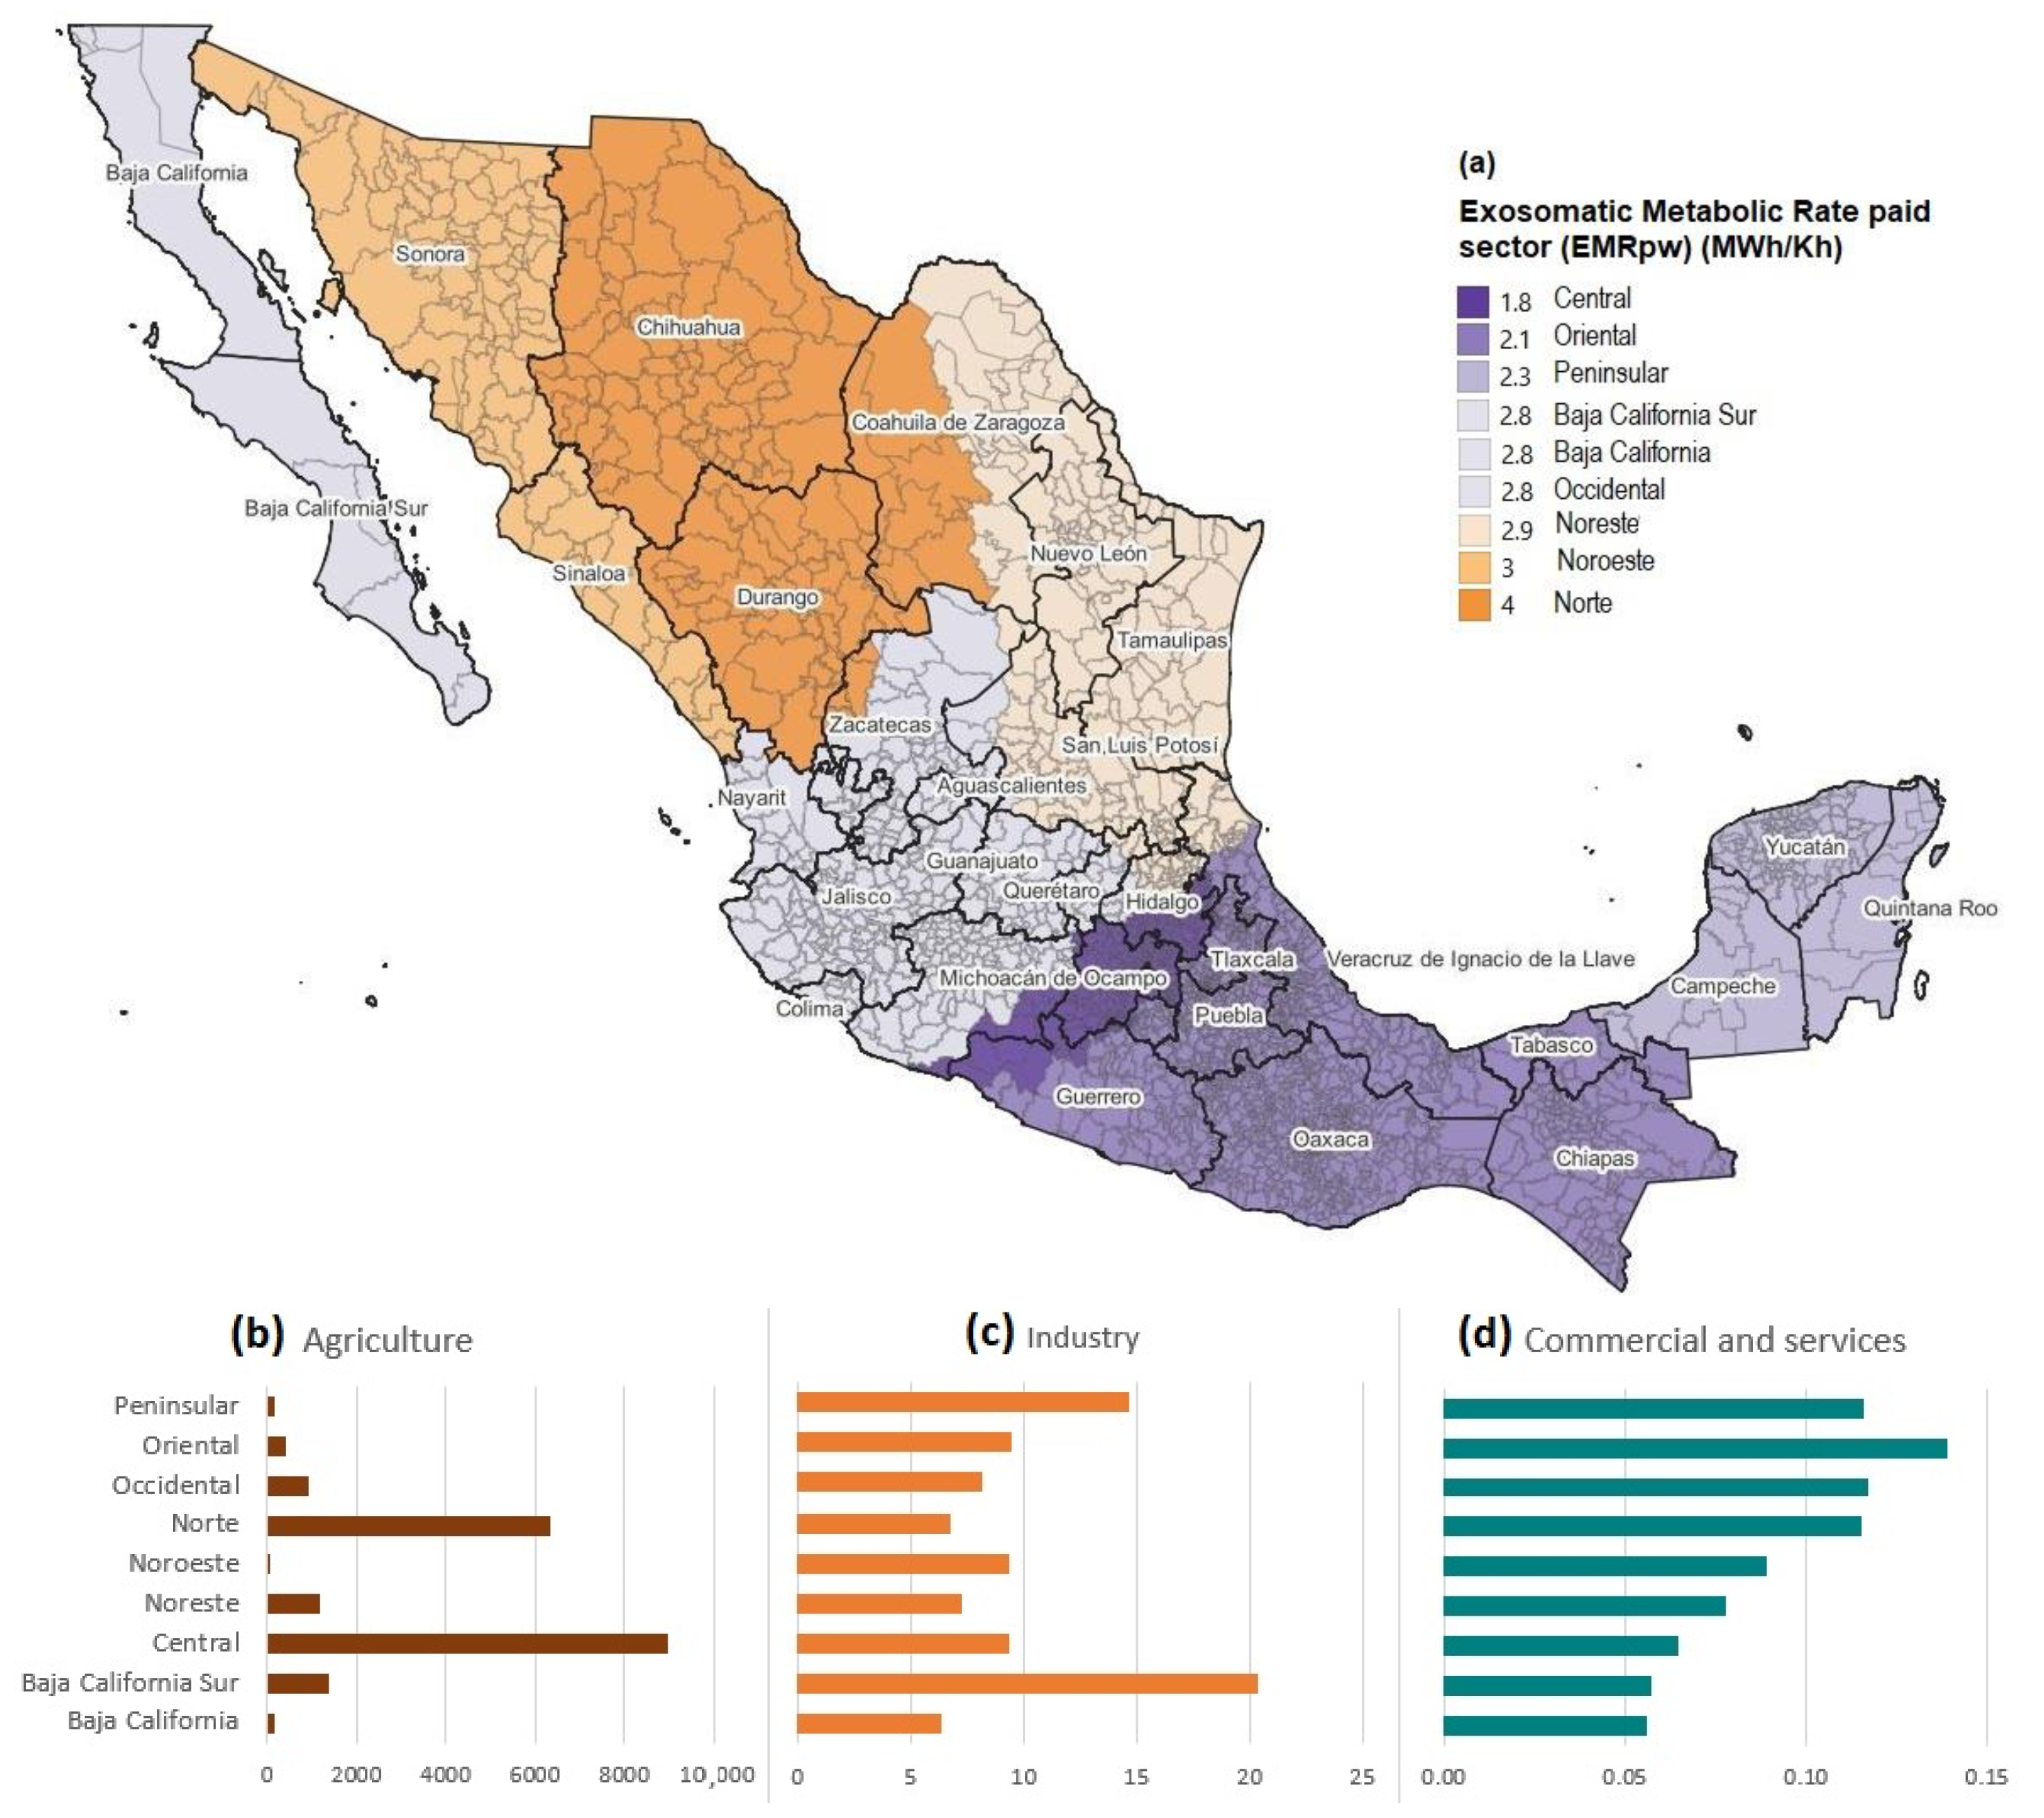
  • Exosomatic Metabolic Rate in Economic Sectors (EMRpwi)
Analysis of the exosomatic metabolic rate in the economic sectors by regions (EMRpwi) indicates that the next regions reached higher values: Norte with 4 MWh/Kh, Noroeste with 3 MWh/Kh, Noreste with 2.9 MWh/Kh, and Occidental with 2.8 MWh/Kh. Baja California and Baja California Sur with 2.8 MWh/Kh each. The regions with the lower values were Peninsular with 2.3 MWh/Kh, Oriental with 2.1 MWh/Kh, and Central with 1.8 MWh/Kh (Figure 14a).
Consideration of disaggregation by economic sectors and control regions shows that the agricultural sector had the highest EMRpwi values among the other sectors. In this context, the Central and Norte regions stand out with 8997 MWh/Kh and 6365 MWh/Kh, respectively. Followed by Baja California Sur with 1367 MWh/Kh, Noreste with 1161 MWh/Kh. Occidental with 909 MWh/Kh, Oriental with 418 MWh/Kh, and finally Peninsular with 191 MWh/Kh, Baja California with 144 MWh/Kh, and Noroeste with 72 MWh/Kh (Figure 14b).
Following the agricultural sector is the industry sector with EMRpwi values that range between 20 and 6 MWh/Kh. The following regions presented the highest values: Baja California Sur with 20.3 MWh/Kh, Peninsular with 14.7 MWh/Kh, Oriental with 9.5 MWh/Kh, Central with 9.4 MWh/Kh, Occidental with 8.2 MWh/Kh, Noreste with 7.3 MWh/Kh, Norte with 6.8 MWh/Kh and Baja California with 6.4 MWh/Kh (Figure 14c).
Finally, the lowest values of EMRpwi were reached in the commercial and services sector. The regions with the highest values were Oriental with 0.14 MWh/Kh, Peninsular, Norte, and Occidental with 0.12 MWh/Kh each, Noroeste with 0.09 MWh/Kh, Noreste with 0.08 MWh/Kh, Central with 0.07 MWh/Kh, Baja California, and Baja California Sur with 0.06 MWh/Kh each (Figure 14d).

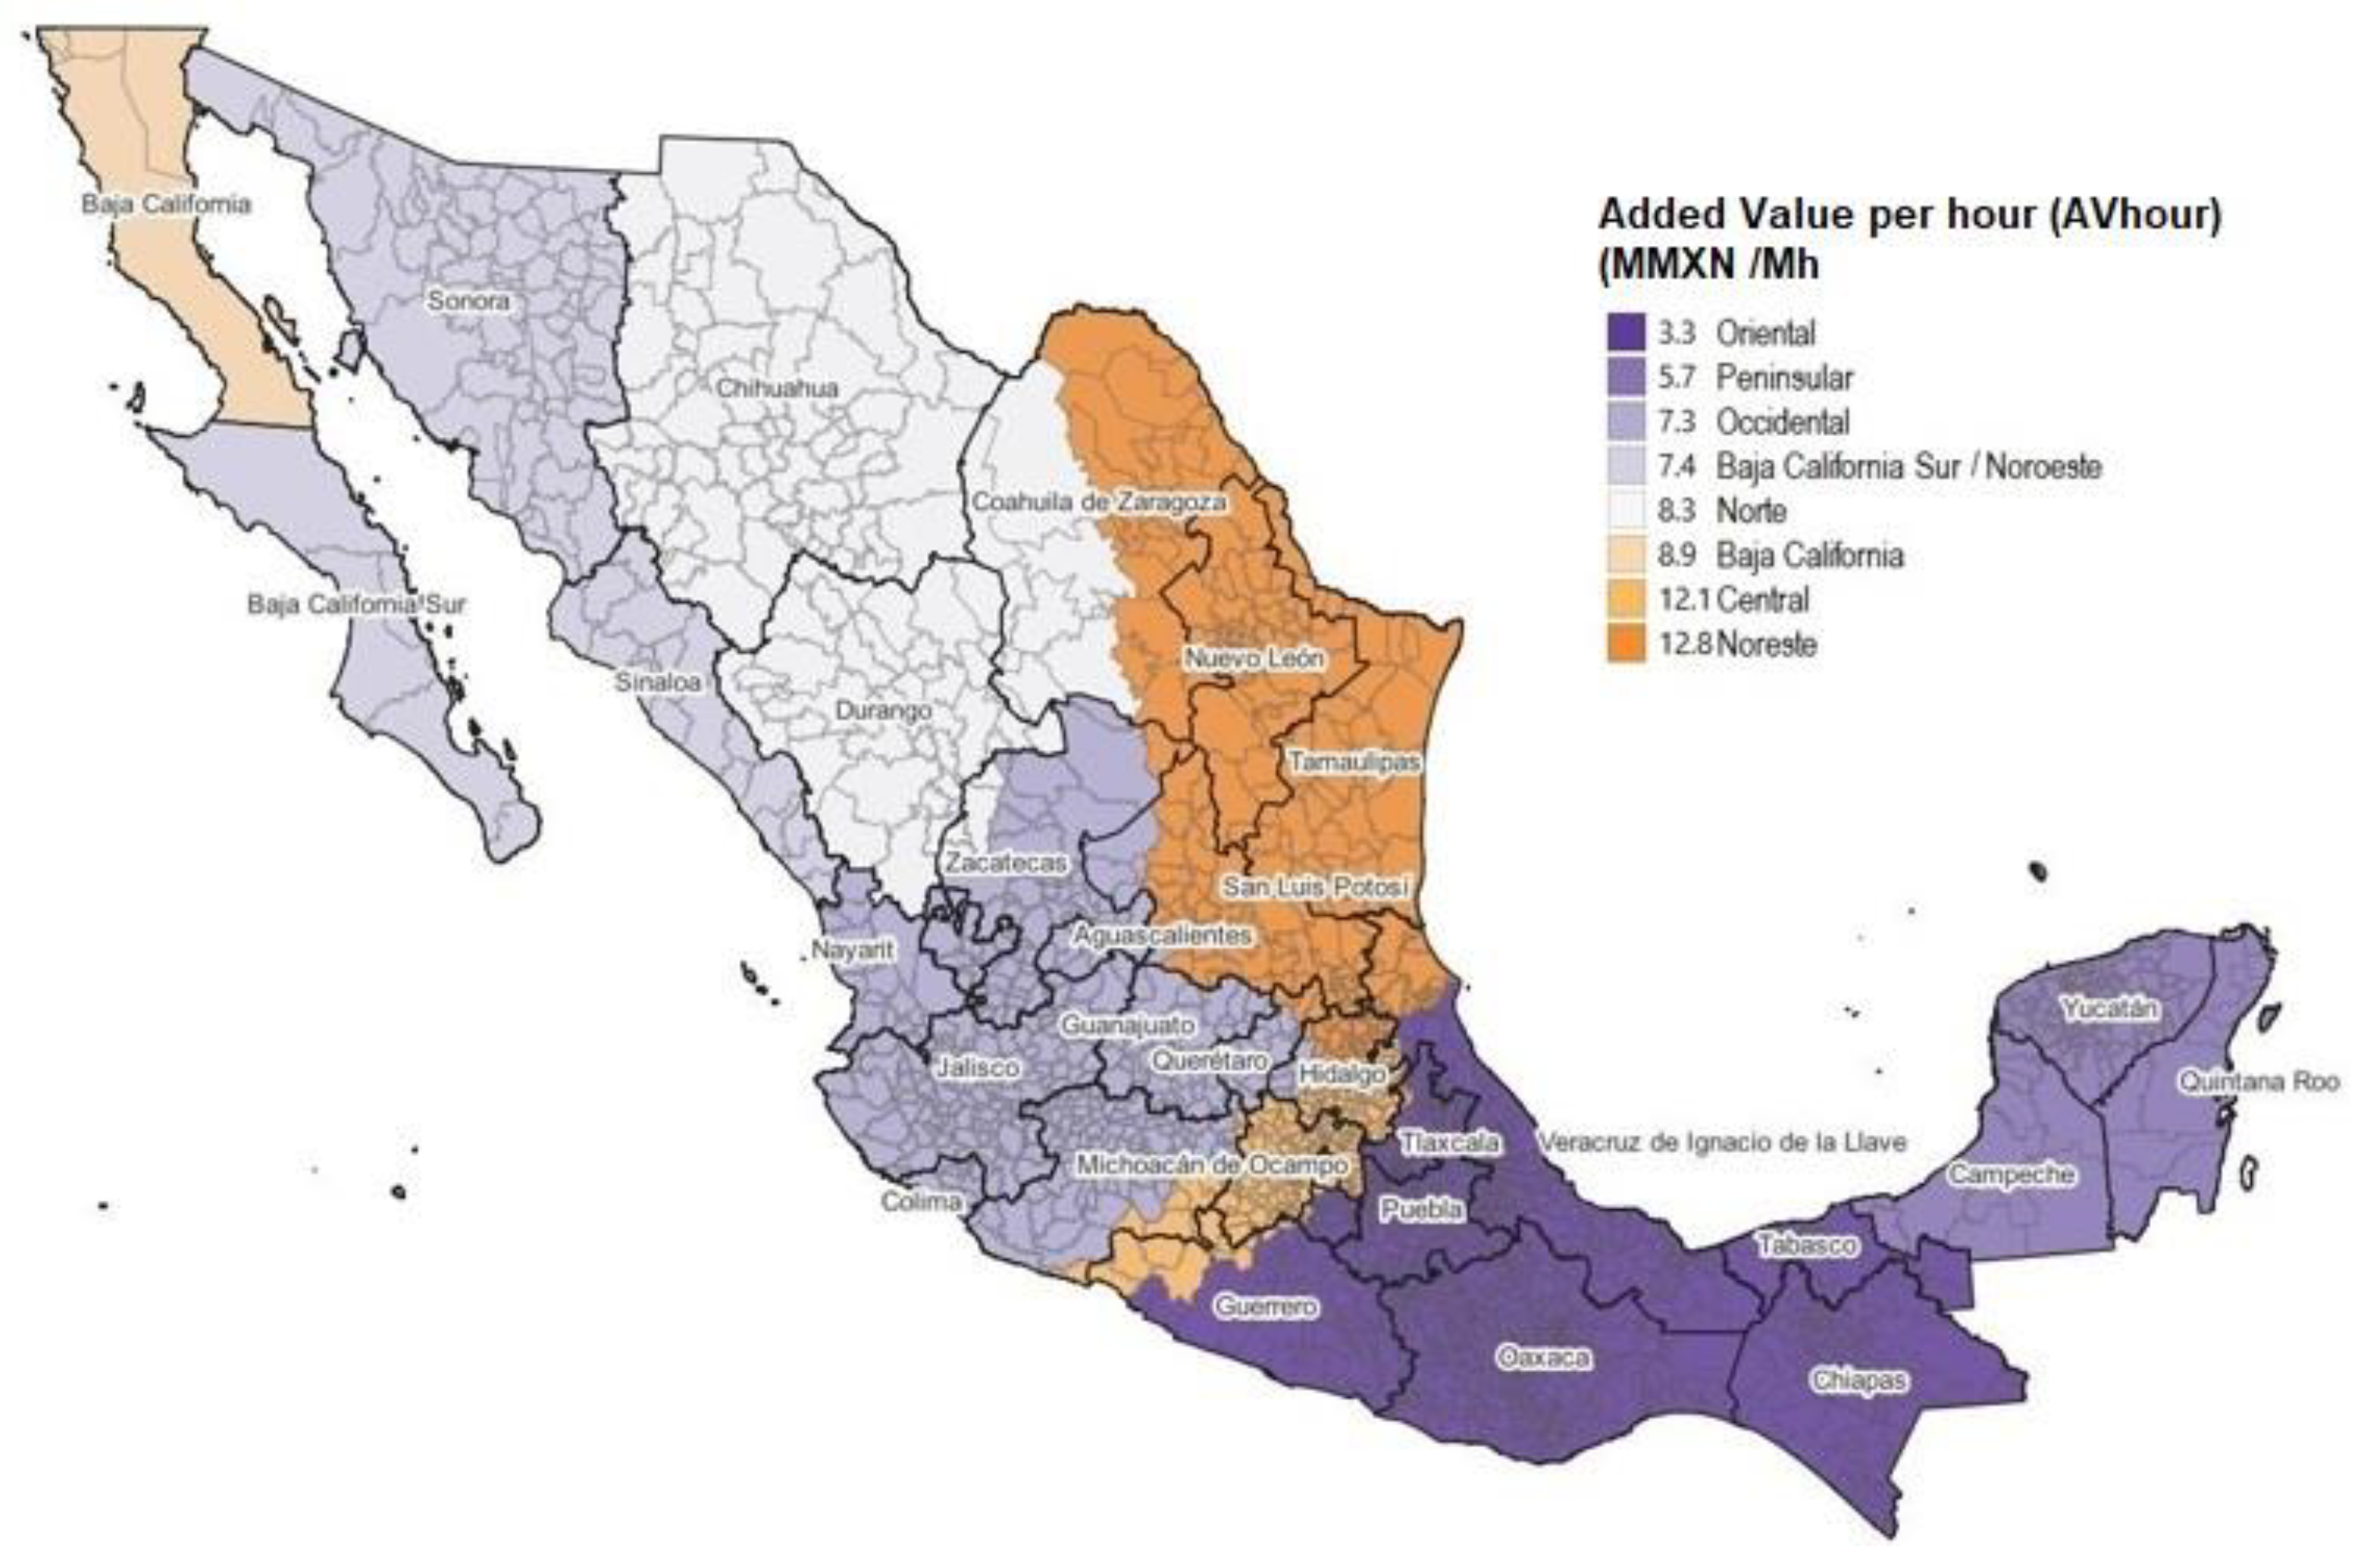
Added Value per Hour (AVhour)

Based on the data reported by official sources [33,36] the value generated per hour of human activity (AVhour) in 2018 was higher in the following regions: Noreste with 12.8 MMXN/Mh, Central with 12.1 MMXN/Mh, Baja California with 8.9 MMXN/Mh, and Norte with 8.3 MMXN/Mh. Lower values of AVhour were reached in Baja California Sur y Noroeste with 7.4 MMXN/Mh each, Occidental with 7.3 MMXN/Mh, Peninsular with 5.7 MMXN/Mh, and finally Oriental with 3.3 MMXN/Mh (Figure 15).

4. Discussion

Based on the analysis of the variables and indicators by sectors, we can state that the industrial sector had the highest electricity consumption, ranked second in added value generation after the commercial and services sector, and occupied second place in human activity. Regarding the economic energy intensity (EEI = ET/AV), the industrial sector ranked second after the commerce and services sector, which shows more energy is needed to generate a unit of added value in comparison with the commerce and services sector. Considering the economic labour productivity indicator (ELP = AV/HA), the industrial sector ranked second after the agricultural sector. Finally, the exosomatic metabolic rate indicator for the industrial sector (EMR = ET/HA) reached second place after the agricultural sector. The industrial sector stands out because although it consumes the largest amount of energy, it was not the main generator of added value, nor was it the one that generates the most employment.
The commercial and services sector had the lowest electricity consumption. This sector generated the highest added value (AV) and accounted for the highest number of human activity (HA). Regarding the EEI indicator, this sector had the lowest value, since the activities carried out required less electricity consumption compared to the industrial sector, which is compensated with greater human activity. Regarding the ELP and EMR indicators, the commercial and services sector had the lowest values compared to the other sectors. This is because of the high number of hours of HA allocated to the commercial and service sector.
The agricultural sector was the second sector in electricity consumption in the paid work sector. Considering that this sector only included fishing and aquaculture, the generation of added value (AV) and human activity (HA) were undervalued. In terms of economic energy intensity (EEI), the agricultural sector reached the highest value. This indicator cannot be representative because the electricity consumption data included the entire agricultural sector, while the added value data only included fishing and aquaculture, as mentioned before. In terms of the exosomatic metabolic rate (EMR), the agricultural sector presented the highest value. Values of EEI and EMR indicators lack sufficient data to be calculated accurately.
The regions with the highest electricity consumption (Occidental, Central, and Noreste) were also those that provided the most added value. There is an imbalance in terms of energy generation and consumption, that causes losses in this process [18] since the energy must travel large distances from the regions with high electricity production (Noreste and Oriental) to regions that demand the most (Occidental and Central). With the establishment of the North American Free Trade Agreement (NAFTA) between the US, Canada, and Mexico, automobile and other manufacturing industries were installed in Mexican territory, mainly in the Occidental, Noreste, Norte, and Central regions, which have high electrical consumption and the added value is less than that generated by the commerce and services sector. Regarding human activity in the economic sectors, the regions with the highest values were the Central, Occidente, and Oriente, which were allocated in the commerce and services sector. The industrial sector offers a smaller number of jobs compared to the commerce and services sector.
On the contrary, the regions with the lowest electricity consumption in the paid sector were Baja California, Baja California Sur, and Peninsular whose economic activities were focused on industry, commerce, and services and the generation of added value was less than the regions mentioned previously. Because they are far from regions that generate the most electricity, the supply of electricity presents difficulties in its transmission, especially because they are regions that consume more electricity than they produce. Regarding per capita electricity consumption, these three regions plus the Noroeste region presented the highest values, which are related to the need for lower temperatures, especially in summer. In these regions, it would be important to install distributed energy generation plants to meet their own needs.
Regarding the economic energy intensity indicator (EEI = ET/AV), the lowest values were reached by the Central, Occidental, and Noreste regions, which shows that they need less electricity to generate a unit of added value. In the Central region, the sector that contributed the most to added value (AV) was commercial and services, and the amount of energy required to develop this activity was less than that required in the industrial sector. The situation is different in the Occidental region where the industrial, commercial, and service sectors generated approximate values, and electricity consumption was the highest of all the regions. In the Noreste region, the industrial sector generated a high added value (AV) which corresponds to high energy consumption. On the contrary, we find the highest values of EEI indicator in the Peninsular, Baja California Sur, and Noroeste regions, which means more electricity was required to produce a unit of added value.
Considering the economic labour productivity indicator (ELP = AV/HA) which is added value per hour of working time, it can be observed that the higher values were in the following regions Norte and Noreste, where the industrial sector generated higher added value compared to other sectors and the human activity was relatively low compared with commercial and services sector. The Central region also reached a high value of ELPpw, and it was characterized by the highest number of hours and added value in the commercial and services sector. The lowest values were found in the Oriental, Peninsular, Baja California, and Baja California Sur regions. These regions are the ones that had a lower contribution in added value in the industrial, commercial, and services sectors.
Analyzing the exosomatic metabolic rate of the economic sectors (EMR = ET/HA) which is the amount of energy used per unit of time in the paid sectors and considering the regions with higher values, it can be observed this occurs in regions where the industry is more developed (Occidental y Noreste), and the energy is more required because of the use of automated processes and mechanization. On the contrary, regions with lower EMRpw (Oriental and Central) are characterized by having economic activities oriented towards commerce and services.
In terms of the exosomatic metabolic rate of the household sector (EMRhh = EThh/HAhh), which is the electricity consumed per unit of time in the household sector, it can be considered as an indicator of the standard of living. Greater consumption of electrical energy and home appliances is related to greater comfort of resting time at home [3,15]. It can be noticed that the regions located in the north of the country, and the Peninsular region have hot summers and there is a need to use air conditioning which increases electrical consumption [37]. However, regions with lower values of EMRhh coincide with those that have the poorest overall access to energy services (Oriental and Central).
It should further be noted that the electric generation of self-supply modality is an area without information, but it has been found that they have evaded taxes and have perhaps even carried out illegal operations within the electricity market [39,40]. It would be optimal to have this information in the future, since it mainly includes the electric consumption of large industries, so the level of lack of information is significant to achieve a more complete analysis.
As part of this research, an analysis of the evolution of the variables and indicators over time was attempted, which was impossible because, in the first place, the economic census does not present all the data of the same variables in consecutive censuses. The official source (INEGI) does not allow access to all data under the argument that it is information that compromises national security, as in the energy and mining sectors. Additionally, all the data was not available for the same municipalities in consecutive Economic Censuses. Therefore, this work has allowed finding weaknesses in national statistics, it is clear in the Economic and Population and Housing Censuses do not occur in the same years and do not have the same periodicity, which makes difficult the analysis of indicators and relations among variables through time. Similarly, the data on electricity consumption also does not allow a study of the temporal evolution since the electric rates were changed and even though there are equivalences, the trends after and before 2018 do not seem to represent reality.
However, this analysis is presented for the first time showing how electrical metabolism works in different regions and levels in Mexico. For the strategic planning of the country, it is key to count on information on where, for what, how, and what produces added value, as well as energy and labour costs, since to plan the economy of regions with imbalances, is necessary to plan where to use necessary resources to reduce disparities, since, as can be seen in the analysis, there is an imbalance on where the industry and services and commerce sectors are mainly located.
We know that the economy also obeys logistical market issues, but these types of logistical operations do not apply when there is an internal economic imbalance within a country, and if this economic imbalance is to be reduced [18]. With where agriculture is located, it is more complex because it also has to do with the availability of resources; much of the electricity used is because seasonal agriculture cannot occur in those regions that depend more and more on the pumping of water and this makes up a vicious circle; the greater the scarcity of water, the greater the amount of energy is required.
The decisions on which activities to use resources, or create new jobs have consequences in determining a country’s future development. Therefore, not only there will be an impact in the regions regarding whether to carry out certain activities, but also, in terms of economic activities, there may be an imbalance benefiting only certain sectors.
We must consider the diversification of the economy since a society cannot only live on services. In the past, this decision has had consequences, such as what happened in the 2008 crisis [41], where the United States benefited the service sector over others, bringing with it an impact on the new Internet corporations. However, this situation also brought unemployment, since frequently services generate fewer jobs compared to industry [42]. Societies require food, so we cannot lose focus of the fact that not all activities must be based on business, but we must consider them as activities that can bring well-being to the population. Therefore, conducting analyses allows us to identify the imbalances between regions and between sectors, which is essential to seek a balance in the well-being of a country.

5. Conclusions

This work is important, since statistics are integrated for the first time that previously were only analyzed separately. We believe that, above all, they will be useful for the Secretary of Energy, the Secretary of Economy, and the Energy Regulatory Commission, since there was no integration of statistics in the way we have developed them in this investigation. Therefore, economic, energy and social decisions are disintegrated, and, in the future, it will be increasingly important to decide in an integrated manner, since the effect of one decision has repercussions on other areas and vice versa.
This work presents, for the first time, a multilevel and multiregional analysis of the electrical metabolism across residential and economic sectors, and it was possible through the application of the MuSIASEM methodology and the organization of the data in a geospatial way that allowed synthesis of a large amount of data to identify the regions and sectors with the highest economic energy intensity (EEI), economic labor productivity (ELP), exosomatic metabolic rate (EMR) and added value per hour (AVhour) values. This analysis constitutes a tool for diagnosing economic development by region of the country and adequate planning to achieve a greater regional balance of the residential and economic sectors.
This work has also made it possible to see the weaknesses of national statistics, both in the economic census and in integrating energy economic statistics. We propose new statistical agendas that are necessary and useful for decision-making and to provide greater well-being to regions with inequalities and therefore reduce the country’s regional and sectoral imbalance.
We recommend applying policies and studies that reduce inequalities between the regions holistically, especially in countries with a significant contrast, such as Mexico, by adopting an ecological, social, and economic vision that seeks prosperity and well-being, and not just centralized economic benefit.
We believe that through this regional analysis, we are making the invisible visible, which often goes unnoticed in free trade agreements. Therefore, it is the beginning of a future work that deepens free trade agreements, since it is a subject that is in dispute, and it is a subject that will recur in the future. For this reason, in future works, regional injustices, ecological inequality and the effects of imports and exports at the regional level will be researched in further depth.
It is worth mentioning that there is already a regional analysis on generation, so this research allows the integration between generation, consumption, and human activity. However, as mentioned above, we will expand our work to generate an analysis that integrates more dimensions until it can cover all the spheres of the sustainable development objectives across regions.
We hope that this work will serve for sharp consultations and discussions on the new free trade agreement and for the new intergovernmental energy plans, since a vision that does not contemplate a regional level is not useful.
The world is still under construction, and we believe that the effects of COVID-19 and the current international conflicts make us question and rethink how society has worked up until now. Hopefully, this analysis can leave us with more questions about where the agendas must go in terms of free trade agreements, welfare, economy, and ecology.
For future research, it is recommended to evaluate the evolution over time of the variables and indicators to identify how regional and sectoral development has been conducted and to make recommendations focused on reducing economic and social inequalities between regions. Additionally, it would make it possible to identify the impact of regional development across sectors derived from the application of international free trade agreements, to guide decisions focused on reducing the negative impacts for Mexico (e.g., the agricultural sector).

Author Contributions

Conceptualization, R.G.-L. and N.O.-G.; data curation, N.O.-G.; writing—original draft preparation, R.G.-L. and N.O.-G.; writing—review and editing, R.G.-L. and N.O.-G., visualization, N.O.-G.; supervision, R.G.-L. All authors have read and agreed to the published version of the manuscript.

Funding

This research was funded by CONACYT, grant number FORDECYT-PRONACES-2019-4-2999507.

Data Availability Statement

The data presented in this study are available on request from the corresponding author.

Acknowledgments

Rafael González-López, and Natalie Ortiz-Guerrero acknowledge PLANEAS Conacyt Project Plataforma Nacional: Energía, Ambiente y Sociedad. This work reflects only the author’s views; the funding agencies are not responsible for any use that may be made of the information it contains.

Conflicts of Interest

The authors declare no conflict of interest.

Correction Statement

This article has been republished with a minor correction to the correspondence contact information. This change does not affect the scientific content of the article.

Abbreviations

AVAdded value
AvhourAdded value per hour
AviAdded value disaggregated by agriculture, industry, commerce, and services sectors
BMXNBillion of Mexican pesos
CFEComisión Federal de Electricidad
CONACYTConsejo Nacional de Ciencia y Tecnología
EEIEconomic energy intensity
EEIiEconomic energy intensity disaggregated by agriculture, industry, commerce, and services sectors
ELPpwEconomic labor productivity in paid sector
ELPpwi Economic labor productivity in paid sector disaggregated by agriculture, industry, commerce, and services sectors
EMRsa Exosomatic metabolic rate
EMRpw Exosomatic metabolic rate in paid sector
EMRpwi Exosomatic metabolic rate in paid sector disaggregated by agriculture, industry, commerce, and services sectors
EMRhhExosomatic metabolic rate in the household sector
EtpwElectrical energy throughput in the paid sector
EtpwiElectrical energy throughput in paid sector disaggregated by agriculture, industry, commerce, and services sectors
EthhElectrical energy throughput in the household sector
GDPGross domestic product
GWhGigawatt hour is a unit of energy equivalent to 1 × 10⁹ Watt-hour
Hapw Human activity allocated in paid sector
HapwiHuman activity allocated in paid sector disaggregated by agriculture, industry, commerce, and services sectors
HahhHuman activity allocated in the household sector
INEGI Instituto Nacional de Estadística, Geografía e Informática
KWhKilowatt hour is a unit of energy equivalent to 1000 Watt-hour
MWhMegawatt hour is a unit of energy equivalent to 1 × 10⁶ Watt-hour
MhMillion hours
MMXNMillions of Mexican pesos
MuSIASEMMulti-Scale Integrated Analysis of Societal and Ecosystem Metabolism
PLANEASPlataforma Nacional Energía Ambiente y Sociedad

References

  1. Hall, C.; Klitgaard, K. Energy and the Wealth of Nations: Understanding the Biophysical Economy; Springer Science & Business Media: Berlin/Heidelberg, Germany, 2011. [Google Scholar]
  2. Hall, C.; Klitgaard, K. The Need for, and the Growing Importance of, BioPhysical Economics. Curr. Anal. Econ. Financ. 2019, 1, 75–87. [Google Scholar]
  3. Giampietro, M.; Mayumi, K.; Sorman, A. The Metabolic Pattern of Societies: Where Economists Fall Short; Routledge: New York, NY, USA, 2011. [Google Scholar]
  4. Di Felice, L.J.; Ripa, M.; Giampietro, M. An alternative to market-oriented energy models: Nexus patterns across hierarchical levels. Energy Policy 2019, 126, 431–443. [Google Scholar] [CrossRef]
  5. Velasco-Fernández, R.; Dunlop, T.; Giampietro, M. Fallacies of energy efficiency indicators: Recognizing the complexity of the metabolic pattern of the economy. Energy Policy 2020, 137, 111089. [Google Scholar] [CrossRef]
  6. Manfroni, M.; Velasco-Fernández, R.; Pérez-Sánchez, L.; Bukkens, S.; Giampietro, M. The profile of time allocation in the metabolic pattern of society: An internal biophysical limit to economic growth. Ecol. Econ. 2021, 190, 107183. [Google Scholar] [CrossRef]
  7. Velasco-Fernández, R.; Pérez-Sánchez, L.; Chen, L.; Giampietro, M. A becoming China and the assisted maturity of the EU: Assessing the factors determining their energy metabolic patterns. Energy Strategy Rev. 2020, 32, 100562. [Google Scholar] [CrossRef]
  8. Hickel, J.; Dorninger, C.; Wieland, H.; Suwandi, I. Imperialist appropriation in the world economy: Drain from the global South through unequal exchange, 1990–2015. Glob. Environ. Change 2022, 73, 102467. [Google Scholar] [CrossRef]
  9. Giampietro, M.; Mayumi, K. Another View of Development, Ecological Degradation, and North-South Trade. Rev. Soc. Econ. 2006, 56, 20–36. [Google Scholar] [CrossRef]
  10. Gerber, J.-F.; Scheidel, A. In Search of Substantive Economics: Comparing Today’s Two Major Socio-metabolic Approaches to the Economy—MEFA and MuSIASEM. Ecol. Econ. 2018, 144, 186–194. [Google Scholar] [CrossRef]
  11. Haberl, H.; Wiedenhofer, D.; Pauliuk, S.; Krausmann, F.; Müller, D.; Fischer-Kowalski, M. Contributions of sociometabolic research to sustainability science. Nat. Sustain. 2019, 2, 173–184. [Google Scholar] [CrossRef]
  12. Pérez-Llorente, I.; Ramírez, M.; Paneque-Gálvez, J.; Orozco, C.G.; González-López, R. Unraveling complex relations between forest-cover change and conflicts through spatial and relational analyses. Ecol. Soc. 2019, 24, art3. [Google Scholar] [CrossRef]
  13. Giampietro, M.; Mayumi, K. Multiple-Scale Integrated Assessments of Societal Metabolism: Integrating Biophysical and Economic Representations Across Scales. Popul. Environ. 2000, 22, 155–210. [Google Scholar] [CrossRef]
  14. Giampietro, M.; Mayumi, K.; Ramos-Martin, J. Multi-scale integrated analysis of societal and ecosystem metabolism (MuSIASEM): Theoretical concepts and basic rationale. Energy 2009, 34, 313–322. [Google Scholar] [CrossRef]
  15. Velasco-Fernández, R.; Ramos-Martín, J.; Giampietro, M. The energy metabolism of China and India between 1971 and 2010: Studying the bifurcation. Renew. Sustain. Energy Rev. 2015, 41, 1052–1066. [Google Scholar] [CrossRef]
  16. Giampietro, M.; Bukkens, S. Analogy between Sudoku and the multi-scale integrated analysis of societal metabolism. Ecol. Inform. 2015, 26, 18–28. [Google Scholar] [CrossRef]
  17. González-López, R. Why energy return on energy investment is not useful for policy. Energy Res. Soc. Sci. 2021, 74, 101915. [Google Scholar] [CrossRef]
  18. González-López, R.; Ortiz-Guerrero, N. Integrated analysis of the Mexican electricity sector: Changes during the COVID-19 pandemic. Electr. J. 2022, 35, 107142. [Google Scholar] [CrossRef]
  19. UNDP. Trapped: High Inequality and Low Growth in Latin America and the Caribbean; UNDP: New York, NY, USA, 2021. [Google Scholar]
  20. Bair, J.; Spener, D.; Gereffi, G. NAFTA and uneven development in the North American apparel industry. In Free Trade and Uneven Development: North American Apparel Industry after Nafta; Temple University Press: Philadelphia, PA, USA, 2009; pp. 327–340. Available online: https://dukespace.lib.duke.edu/dspace/handle/10161/11447 (accessed on 23 November 2022).
  21. Palacios-Saldaña, R.; Ortiz-Guerrero, N.; González-López, R. Infraestructura y diagnóstico del SEN. In Transición Energética Justa y Sustentable; Conacyt: Mexico City, Mexico, 2023. [Google Scholar]
  22. BBC News. Apagones en México: La Enorme Dependencia Mexicana del Gas de EE.UU. que Dejó al Descubierto la Tormenta Invernal en Texas—BBC News Mundo. 2021. Available online: https://www.bbc.com/mundo/noticias-america-latina-56106262 (accessed on 23 November 2022).
  23. United Nations Development Programme. Sustainable Development Goals. Available online: https://www.undp.org/sustainable-development-goals (accessed on 23 November 2022).
  24. Andreoni, V. Energy Metabolism of 28 World Countries: A Multi-scale Integrated Analysis. Ecol. Econ. 2017, 142, 56–69. [Google Scholar] [CrossRef]
  25. Andreoni, V. The energy metabolism of countries: Energy efficiency and use in the period that followed the global financial crisis. Energy Policy 2020, 139, 111304. [Google Scholar] [CrossRef]
  26. Velasco-Fernández, R.; Giampietro, M.; Bukkens, S. Analyzing the energy intensity of manufacturing across levels using the end-use matrix. Energy 2018, 161, 559–572. [Google Scholar] [CrossRef]
  27. Pérez-Sánchez, L.; Velasco-Fernández, R.; Giampietro, M. The international division of labor and embodied working time in trade for the US, the EU and China. Ecol. Econ. 2021, 180, 106909. [Google Scholar] [CrossRef]
  28. Andreoni, V. From the Celtic Tiger to the Celtic Phoenix: The metabolic profile of Ireland and the main drivers of energy change. J. Clean. Prod. 2020, 246, 118975. [Google Scholar] [CrossRef]
  29. Andreoni, V. A multiscale integrated analysis of the COVID-19 restrictions: The energy metabolism of UK and the related socio-economic changes. J. Clean. Prod. 2022, 363, 132616. [Google Scholar] [CrossRef] [PubMed]
  30. Chen, L.; Xu, L.; Velasco-Fernández, R.; Giampietro, M.; Yang, Z. Residential energy metabolic patterns in China: A study of the urbanization process. Energy 2021, 215, 119021. [Google Scholar] [CrossRef]
  31. Pérez-Sánchez, L.; Giampietro, M.; Velasco-Fernández, R.; Ripa, M. Characterizing the metabolic pattern of urban systems using MuSIASEM: The case of Barcelona. Energy Policy 2019, 124, 13–22. [Google Scholar] [CrossRef]
  32. Yan, N.; Liu, G.; Ripa, M.; Wang, N.; Zheng, H.; Gonella, F. From local to national metabolism: A review and a scale-up framework. Ecosyst. Health Sustain. 2020, 6, 1839358. [Google Scholar] [CrossRef]
  33. Instituto Nacional de Estadística Geografía e Informática. XII Censo General de Población y Vivienda, México. 2020. Available online: https://www.inegi.org.mx/programas/ccpv/2000/ (accessed on 1 December 2021).
  34. The World Bank. The World Bank Data. Available online: https://data.worldbank.org/ (accessed on 1 June 2021).
  35. Secretaría de Energía (SENER). Programa de Desarrollo del Sistema Eléctrico Nacional (PRODESEN) 2019–2033. Available online: https://www.gob.mx/sener/articulos/prodesen-2019-2033-221654 (accessed on 15 December 2020).
  36. Instituto Nacional de Estadística y Geografía (INEGI). Censo Económico 2019. 2019. Available online: https://www.inegi.org.mx/programas/ce/2019/default.html#Tabulados (accessed on 20 January 2020).
  37. Comisión Federal Electricidad (CFE). Usuarios y Consumo de Electricidad por Municipio (A Partir de 2018), Datos Abiertos. 2018. Available online: https://datos.gob.mx/busca/dataset/usuarios-y-consumo-de-electricidad-por-municipio-a-partir-de-2018 (accessed on 5 November 2019).
  38. Comisión Federal Electricidad (CFE). Tarifas para el Suministro y Venta de Energía Eléctrica (2016–2017). Available online: https://app.cfe.mx/Aplicaciones/CCFE/Tarifas/Tarifas/tarifas_casa.asp (accessed on 5 November 2019).
  39. La Jornada. Sanción en México a Iberdrola por Venta Ilegal de Electricidad. 2022. Available online: https://www.jornada.com.mx/notas/2022/05/28/economia/sancion-en-mexico-a-iberdrola-por-venta-ilegal-de-electricidad/ (accessed on 1 September 2022).
  40. Pais, E. CRE: El Regulador Energético de México Multa a Iberdrola con 9000 Millones de Pesos. 2022. Available online: https://elpais.com/mexico/2022-05-27/el-regulador-energetico-de-mexico-multa-a-iberdrola-con-9000-millones-de-pesos.html (accessed on 1 September 2022).
  41. The Associated Press. Greenspan Admits ‘Mistake’ That Helped Crisis. 2008. Available online: https://www.nbcnews.com/id/wbna27335454 (accessed on 26 September 2022).
  42. Smil, V. Made in the USA: The Rise and Retreat of American Manufacturing; MIT Press: Cambridge, MA, USA, 2013. [Google Scholar]
Figure 1. Control regions. Source: Own elaboration based on data from SENER [35].
Electricity 04 00001 g001
Figure 2. Human activity in the household sector (HAhh) (Mh) by regions.
Electricity 04 00001 g002
Figure 3. Human activity in economic sectors (HApw) (Mh) by regions.
Electricity 04 00001 g003
Figure 4. Human activity is grouped into different economic sectors (HApwi) (Mh) by region. (a) Agriculture. (b) Industry. (c) Commercial and services.
Electricity 04 00001 g004
Figure 5. Electrical energy throughput in economic sectors (ETpw) (GWh) by regions.
Electricity 04 00001 g005
Figure 6. Electrical energy throughput is grouped into different economic sectors (ETpwi) (GWh) by region. (a) Agriculture. (b) Industry. (c) Commercial and services.
Electricity 04 00001 g006
Figure 7. Electrical energy throughput per capita in the household sector (EThh) (MWh) by regions.
Electricity 04 00001 g007
Figure 8. Added value (AV) (BMXN) by regions.
Electricity 04 00001 g008
Figure 9. Added value grouped into different economic sectors (AVi) (BMXN) by regions. (a) Agriculture. (b) Industry. (c) Commercial and services.
Electricity 04 00001 g009
Figure 10. (a) Economic energy intensity (EEI = TET/AV) (MWh/MMXN) by regions and grouped into different economic sectors (b) Agriculture. (c) Industry. (d) Commercial and services.
Electricity 04 00001 g010
Figure 11. (a) Economic labour productivity (ELPpw = AV/HApw) (MMXN/Mh) by regions and grouped into different economic sectors (b) Agriculture. (c) Industry. (d) Commercial and services.
Electricity 04 00001 g011
Figure 12. Exosomatic metabolic rate by regions (EMRsa = TET/THA) (KWh/Kh).
Electricity 04 00001 g012
Figure 13. Exosomatic metabolic rate in the household sector (EMRhh = EThh/HAhh) (KWh/Kh) by regions.
Electricity 04 00001 g013
Figure 14. (a) Exosomatic metabolic rate (EMRpw = ETpw/HApw) (KWh/Kh) by regions and grouped into different economic sectors (b) Agriculture. (c) Industry. (d) Commercial and services.
Electricity 04 00001 g014
Figure 15. Added value generated per hour of human activity (AVhour = AV/THA) (MMXN/Mh) by regions.
Electricity 04 00001 g015
Table 1. Economic sectors. Thematic areas in italics were included in the 2019 Economic census. Source: Own elaboration based on data from [36].
SectorDescription
AgricultureFishing, aquaculture, agriculture, forestry, breeding and exploitation of animals, and hunting
IndustryConstruction, manufacturing industries
Commercial and servicesRetail and wholesale trade. Health and social assistance services. Professionals, scientists, and technical services. Financial and insurance services. Educational services. Mass media information services. Cultural and sports entertainment and other recreational services. Postal transport and storage. Temporary accommodation and food and beverage preparation services. Other services except for government activities. Corporate.
Table 2. Classification of electricity consumption by sectors. Source: Own elaboration based on data from CFE [38].
SectorCodes and Descriptions
Agriculture9, 9M, 9CU, 9N, RABT, RAMT
Low and medium voltage water pumping service for agricultural irrigation. Nightly incentive rate for pumping water for agricultural irrigation and with a single charge. Agricultural irrigation in low and medium voltage.
Household1, 1A, 1B, 1C, 1D, 1E, 1F, DAC, DB2, DB1
Domestic with and without subsidy.
Commercial
and services
5, 5A, 6, 7, APBT, APMT, 2, 3
Public lighting service, service for pumping drinking or sewage water for public service, temporary service, low and medium voltage public lighting. General service.
IndustryDIT, DIST, GDBT, GDBTH, GDBTO, HS, HSF, HSL, HSLF, HT, HTF, HTL, HTLF, GDMTH, PDBT, GDMTO
Industrial demand in transmission and sub-transmission. Great demand (greater than 25 kW-month) in medium voltage. Hourly rate for general service in high voltage.
HM, HMC, OM, OMF
Hourly rate for general service in medium voltage.
PDBT
Small demand (up to 25 kW-month) in low voltage.
Table 3. MuSIASEM variables (adjusted from Andreoni, 2017 [24]).
Level N + 1 MexicoLevel N + 2 SectorsLevel N + 3 Sectors and Regions
THA: Total human activity. Total human time for one year. Population × 24 h × 365 days. Unit: hours (h)HApwi: hours allocated to different economic sectors
HAhh: hours allocated to the household sector
HApwi: hours grouped by different economic sectors and regions.
TET: Total electrical energy throughput by country in one year. Units: kilowatt hour (KWh)ETpwi: electrical energy throughput in the different economic sectors
EThh: electrical energy consumption per capita in the household sector
ETpwi: electrical energy throughput grouped by different economic sectors and regions.
AV: Added value generated by an economy in one year by country. Units: MXNAVi: added value grouped by different economic sectors.AV: added value by regions
Table 4. MuSIASEM indicators (adjusted from Andreoni, 2017 [24]).
Level N + 1: MexicoLevel N + 2: SectorsLevel N + 3: Sectors and Regions
EEI: Economic energy intensity. Electrical energy consumption per unit of added value. TET/AV. Units: MWh/MMXNEEIi: Economic energy intensity grouped by different economic sectors
ELPpwi: Economic Labour Productivity. AV/HApwi. Units: MMXN/Mh
EEIi: EEI grouped by different economic sectors and regions
ELPpwi: ELPpw grouped by different economic sectors and regions
EMRsa: Exosomatic metabolic rate. Electrical energy consumption per hour of human time is available to society. TET/THA. Units: KWh/KhEMRpwi exosomatic metabolic rate per hour in the economic sectors. ETpwi/HApwi
EMRhh exosomatic metabolic rate per hour in the household sector. EThh/HAhh
EMRpwi: EMRpw grouped by different economic sectors and regions
AVhour: added value generated per hour of human activity in society. AV/THA
Units: MMXN/Mh
AVhour: added value per hour of human activity grouped by region
Disclaimer/Publisher’s Note: The statements, opinions and data contained in all publications are solely those of the individual author(s) and contributor(s) and not of MDPI and/or the editor(s). MDPI and/or the editor(s) disclaim responsibility for any injury to people or property resulting from any ideas, methods, instructions or products referred to in the content.

