Article

Integration of EV in the Grid Management: The Grid Behavior in Case of Simultaneous EV Charging-Discharging with the PV Solar Energy Injection †

by
Evode Rwamurangwa
1,*,‡,
Juan Diaz Gonzalez
1,‡ and
Albert Butare
2
1
Department of Electrical Engineering, University of Oviedo, 33204 Gijón, Spain
2
Department of Energy Research and Development, Africa Energy Services Group Ltd., Kigali 3446, Rwanda
*
Author to whom correspondence should be addressed.
This paper is an extended version of our paper published in an extended version of a conference paper published in Evode, R. Modeling of Electric Grid Behaviors having Electric Vehicle charging stations with G2V and V2G Possibilities. In Proceedings of the 2021 International Conference on Electrical, Computer, Communications and Mechatronics Engineering (ICECCME), 7–8 October 2021; pp. 1–5.
These authors contributed equally to this work.
Electricity 2022, 3(4), 563-585; https://doi.org/10.3390/electricity3040028
Submission received: 31 August 2022 / Revised: 29 October 2022 / Accepted: 17 November 2022 / Published: 22 November 2022
(This article belongs to the Special Issue Recent Advances toward Carbon-Neutral Power System)

Abstract

:
The actual research in terms of energy focuses drastically on the use of green energy resources. Hydropower systems have been the most known green sources for years. However, the hydropower systems, which are seasonal and most exploited, do not cover the speed of increasing daily demand. The injection of solar power could be a supporting alternative, but it is only in daylight, weather dependent and intermittent. Therefore, a storage system is required. The batteries are the quick recourse. Not only the energy sector, but also the transport systems are not left behind; they are striving to turn green. Therefore, they are turning to electric vehicles (EVs) and electric moto-bicycles (EMBs). On the other hand, this option tends to be a sharply increasing demand that can be a burden to the grid, i.e., the increase in the EVs and EMBs implies increases in power demand, grid components and pressure on the grid. Fortunately, the EVs use batteries to store energy for their use. Therefore, the EVs are the power storage system, they become part of the power management system and they can save the power surplus. With the injection of PV solar power, there is no need for an extra storage system, as the EVs are charged from the grid and store the solar energy that can be used later after sunset. The bi-directional off-board charger is a solution as it allows the grid to charge the vehicle (G2V) and the vehicle to send power back to grid (V2G). The inclusion of EVs in power management introduces the concept of vehicle-to-vehicle (V2V) when one EV can charge another, and the vehicle-to-load (V2X) where the EV can supply power to EMBs or any load. The V2G, G2V, V2X, the inclusion on solar energy to the grid and the behavior of the grid in that scenario will be illustrated in this paper.

1. Introduction

Nowadays, the climate change is a point of major concern, whatever option of mitigation is of capital value. The research in various domains are concentrating on Net-Zero targets, i.e., balancing the greenhouse gases emitted into the atmosphere with what is extracted. The last is to keep the rise of the global temperature well below 1.5 °C [1,2,3,4,5]. The green and renewable energy resources are the saving grace. In countries where enough water is accessible, hydro-power generation is emerging and dominant, but in some cases, it does not generate enough power to sustain the daily increasing demand in energy. It is in this case that solar, wind and green hydrogen are being raised [6,7,8,9,10,11,12,13,14]. The biggest drawback in renewable energy harvesting is that all of those resources are intermittent and seasonal. Therefore, reliable energy storage systems have to be considered. Apart from the energy domain, transport is picking up as well and striving towards green. Hence, the introduction of electrical vehicles (EVs) and electric moto-bicycles (EMBs) in daily transport activities. The transport electrification (e-transport) is becoming a strategy for reducing greenhouse gas emissions and contributing to Net-Zero achievements, but it might be a strain on the extensive power network. In fact, the increase in e-transport implies a rise in power demand, power systems components and a rise in generation. Considering that most of the generation facilities are not green, the net-zero target will not close the loop. In order to strive for net-zero and properly close the loop, without ignoring the green generation implementation and the development in the green transport, the reliable storage systems are of capital importance. The development in green generation has to go hand-in-hand with the green transport. The EVs use batteries, then they can be made part of the power grid and contribute to the grid management instead of being a burden [15,16]. The EVs store the power in their batteries first for use, and secondly for sending back to the grid in peak times, for grid support. The charging and discharging management is important, to ensure the EVs are charged during the peak generation from the most intermittent sources, i.e., solar. The power stored in the EVs is for both transport purposes and grid support in grid pick hours. In case the EVs are sending power back to the grid, the loads connected on the same network can profit to use the same power from the EV. Therefore, the integration of the EV to the grid introduces the following terminologies:
1.
G2V: Grid-to-Vehicle; in this case, the grid sends power to the vehicle; in other words, the vehicle is charging.
2.
V2G: Vehicle-to-Grid; in this case, the vehicle sends power back to the grid; in other words, the vehicle is discharging the power back to the grid.
3.
V2V: Vehicle-to-Vehicle; in this case, two vehicles share a bus; one is charging, while another is discharging.
4.
V2X: Vehicle-to-Load; in this case, the vehicle supplies power to any load on the same bus.
The last mentioned terminologies have been trending in very recent studies in the e-mobility domain [17,18,19,20]. To be able to perform charging and discharging, the bi-directional off-board charger is used; this type of charger, together with the grid behaviors during the simultaneous charging and discharging of the EVs, are illustrated in [21]. This paper extends the work presented in conference paper [21], and assesses the integration and behavior of the grid during charging and discharging of the EVs. The solar power system is added to the study as a renewable energy source that supports the hydro-power generation system and assists in EVs charging. The photovoltaic-assisted charging options are detailed in [22]. The grid and PV power storage in the EVs for future use, as part of the grid management system, is illustrated in this work. However, the integration of the EVs to the grid is not straightforward. The proper control over the charging and discharging time is important to avoid unexpected challenges [23]. During charging (G2V), the EVs make part of the load and can have a substantial impact on the grid, the power network faces a disruptive effect, and some domestic distribution networks can be substantially affected [24]. On the other hand, during the discharging (V2G) [25,26,27], the EVs decrease the environmental stress, the burden to the power network is reduced and non-green power sources are avoided [28]. Taking into consideration that, depending on the available EVs, the likelihood of simultaneous charging and discharging the grid reacts accordingly. Therefore, this work outlines the behavior of the grid during simultaneous charging and discharging. In addition, the grid behavior will be assessed in the same scenario, while being assisted by the PV solar energy. The combination of grid, EVs, EMBs, and PV solar system and the related controls make the micro-grid, and it is simulated in Matlab-Simulink. The technology behind EV battery charging, discharging and the related control are shown. The G2V, V2G, V2V and V2X are studied. The bi-directional behavior of the power flow is deeply elaborated. The power profile illustrating the complete scenario is shown. The model in Matlab-Simulink is used to validate the study and demonstrate the test results.

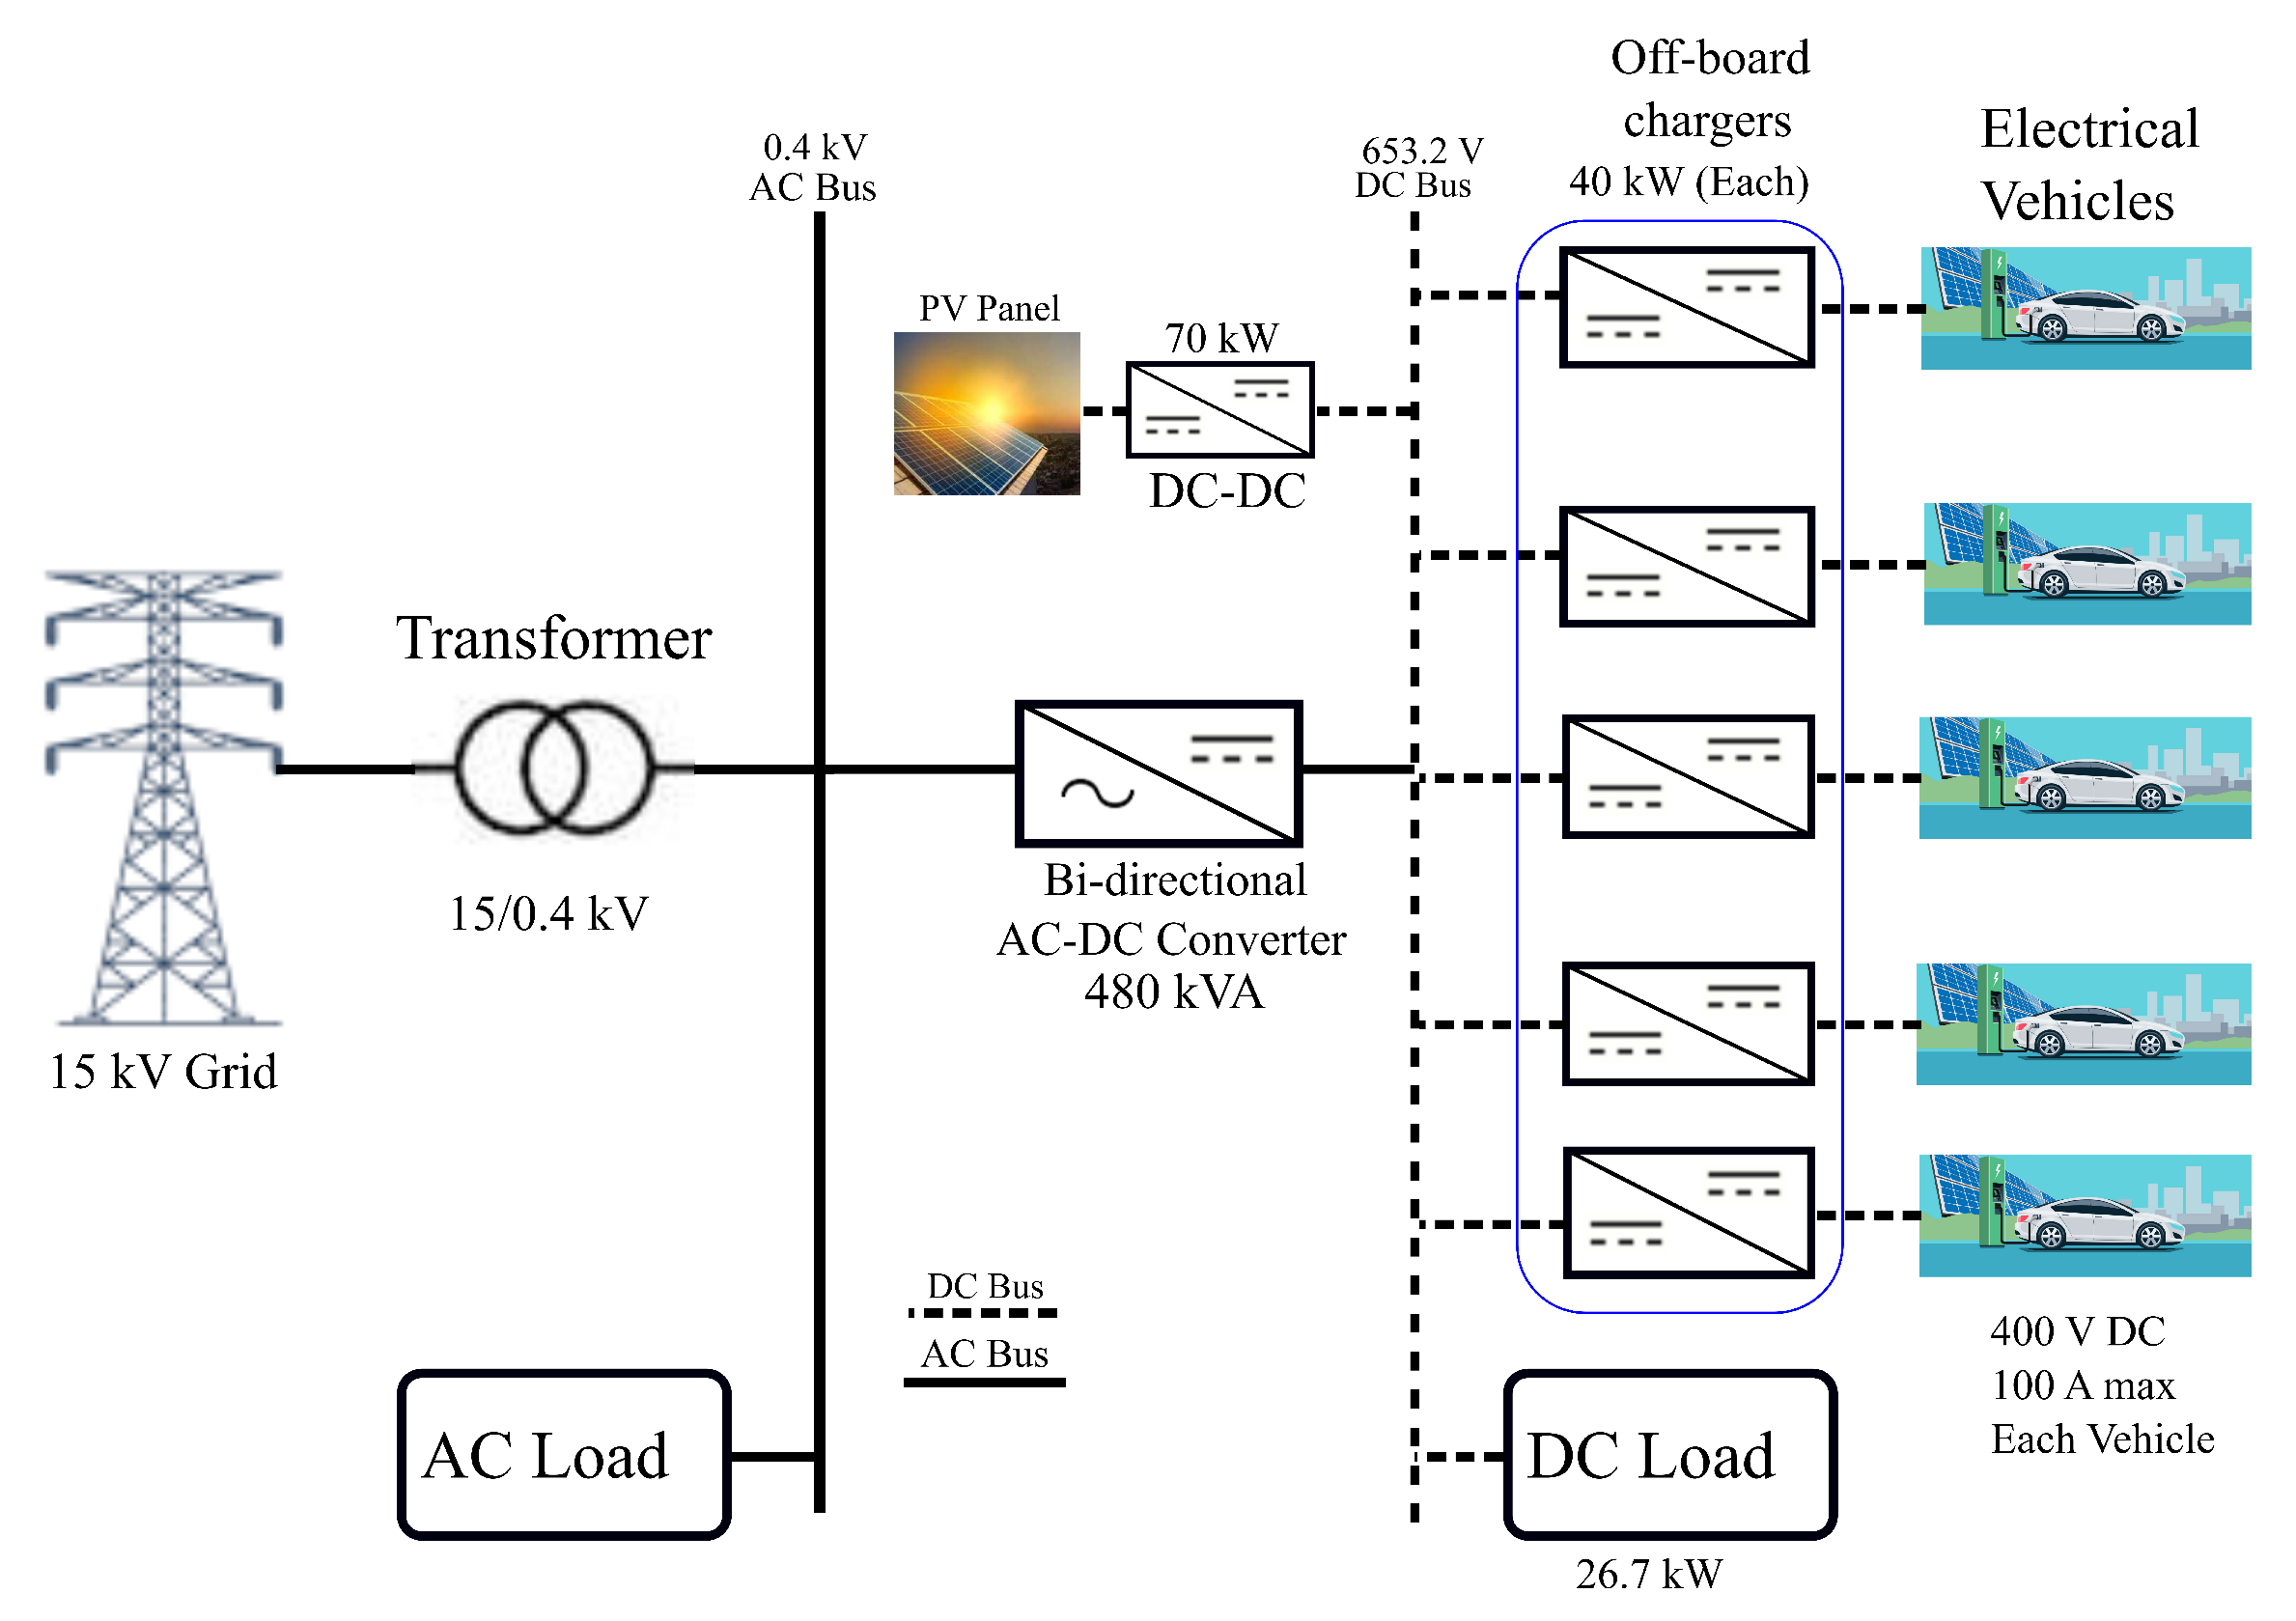
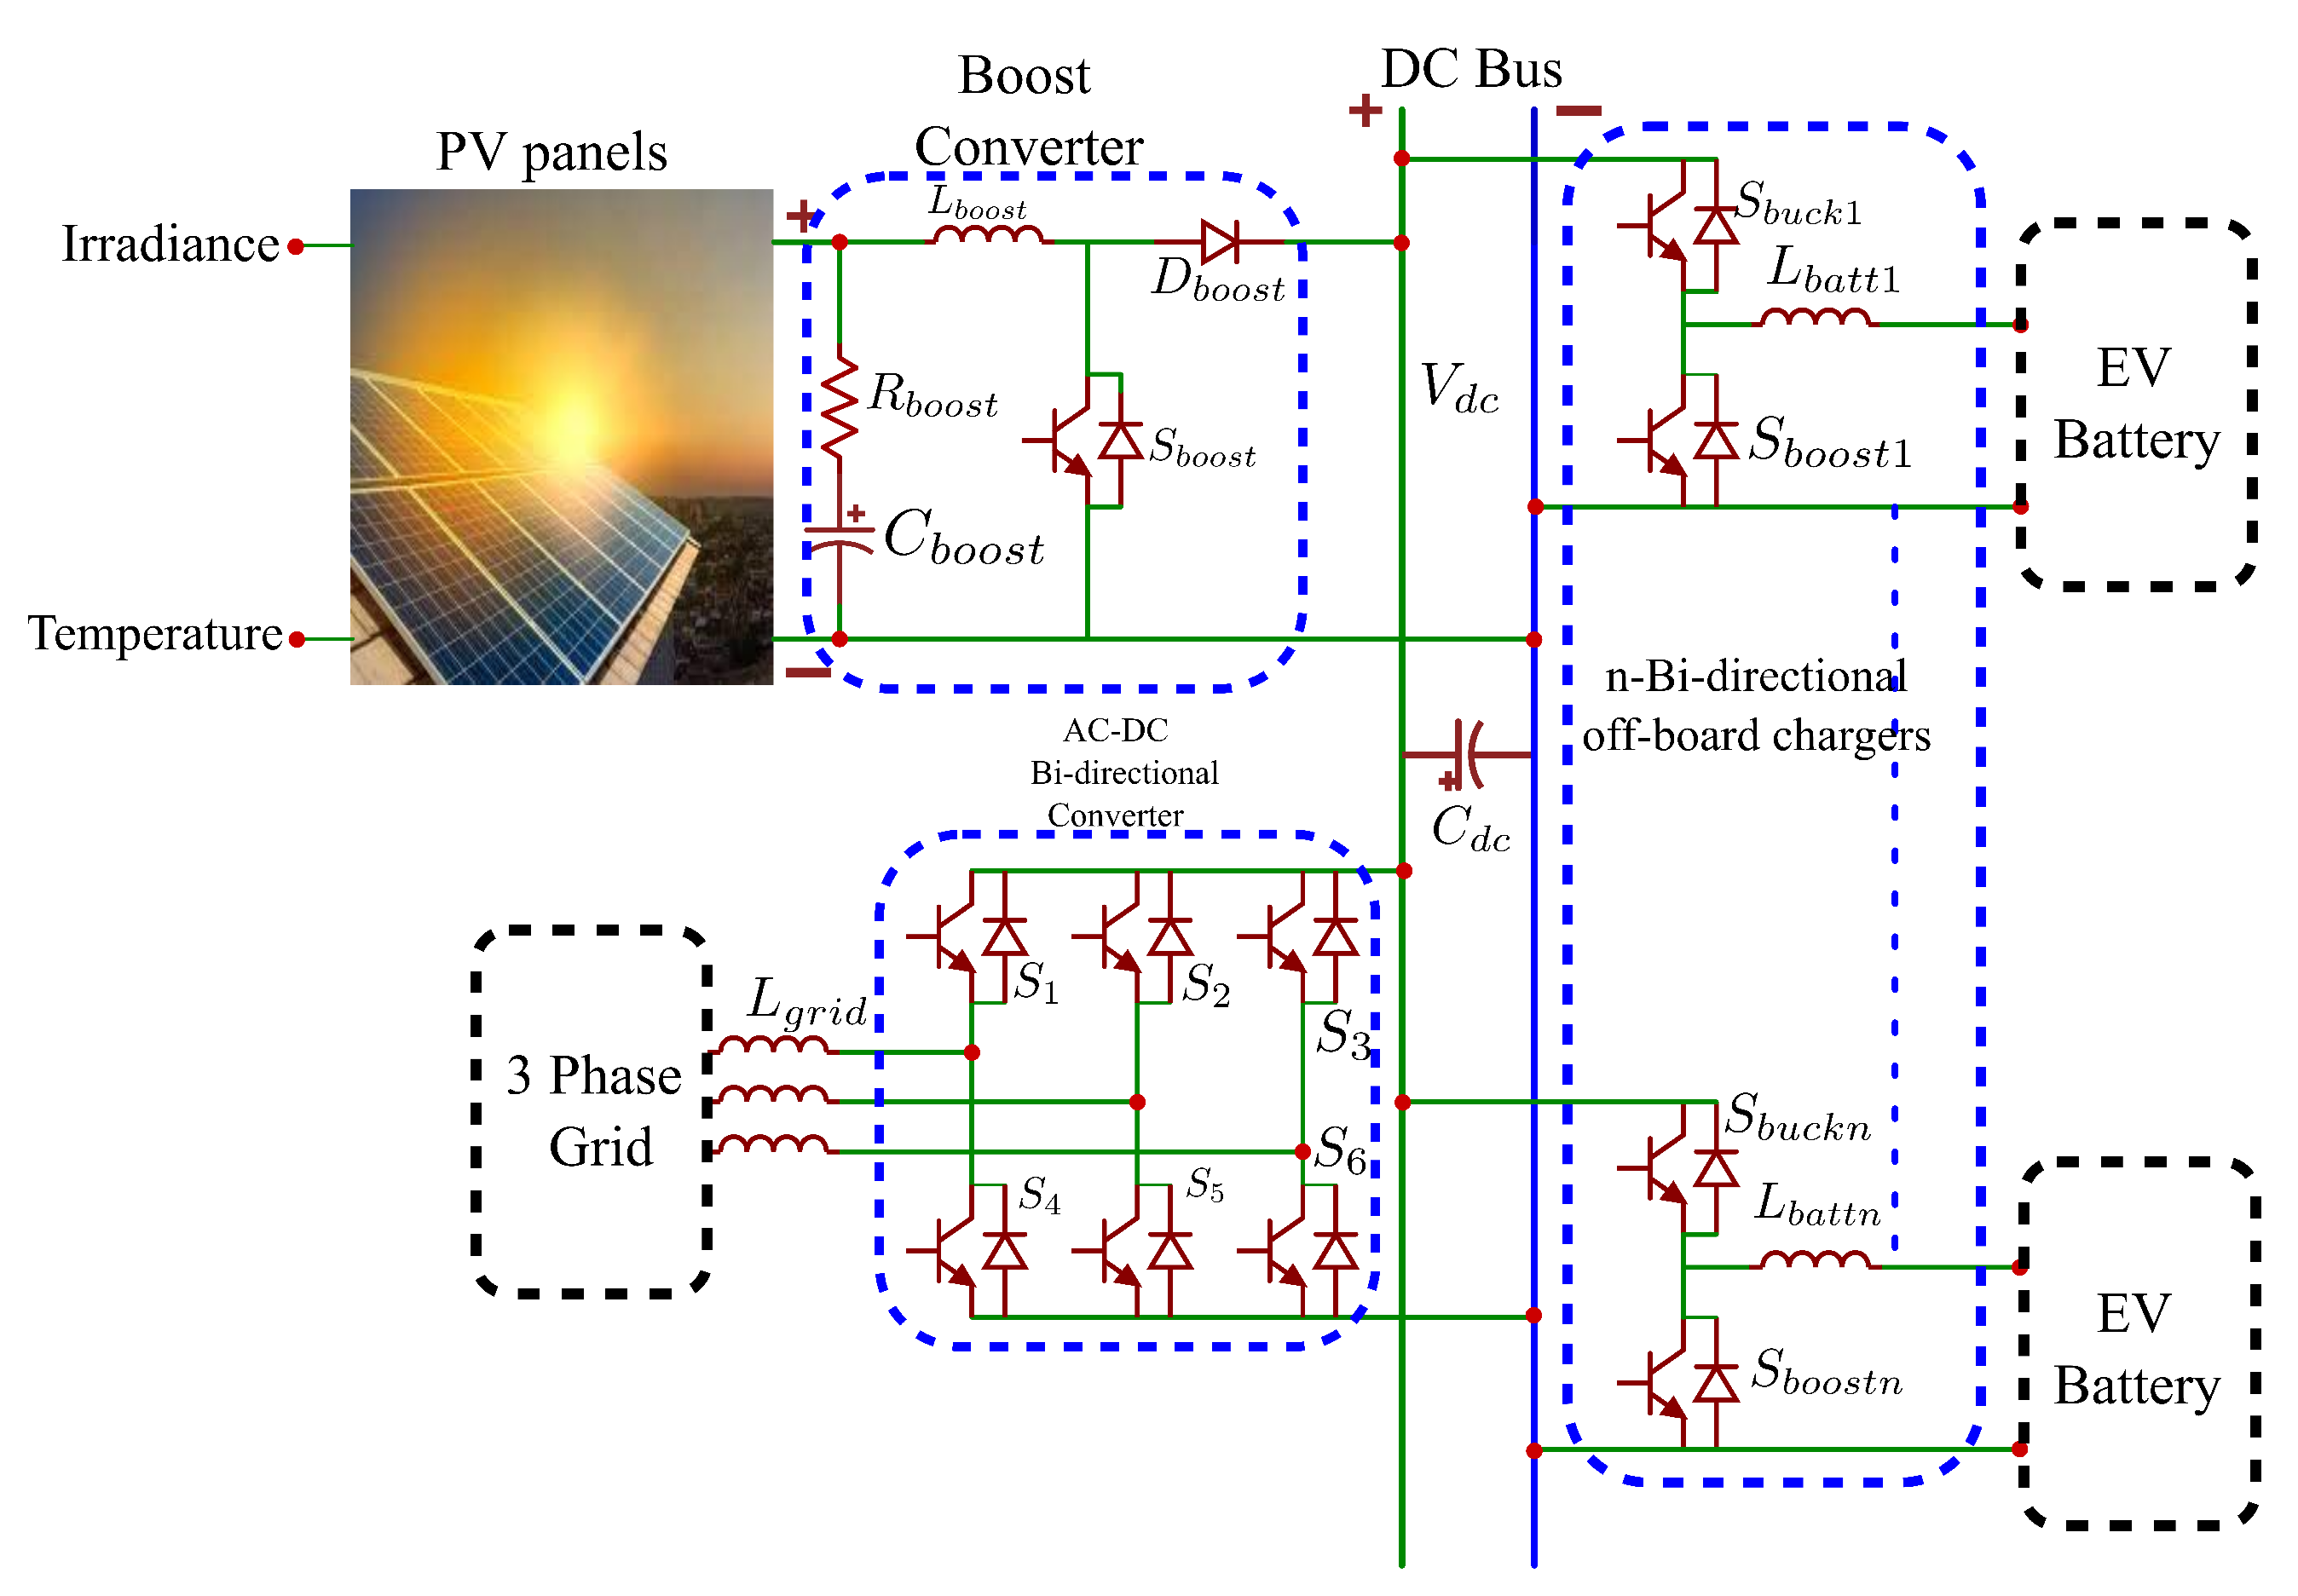
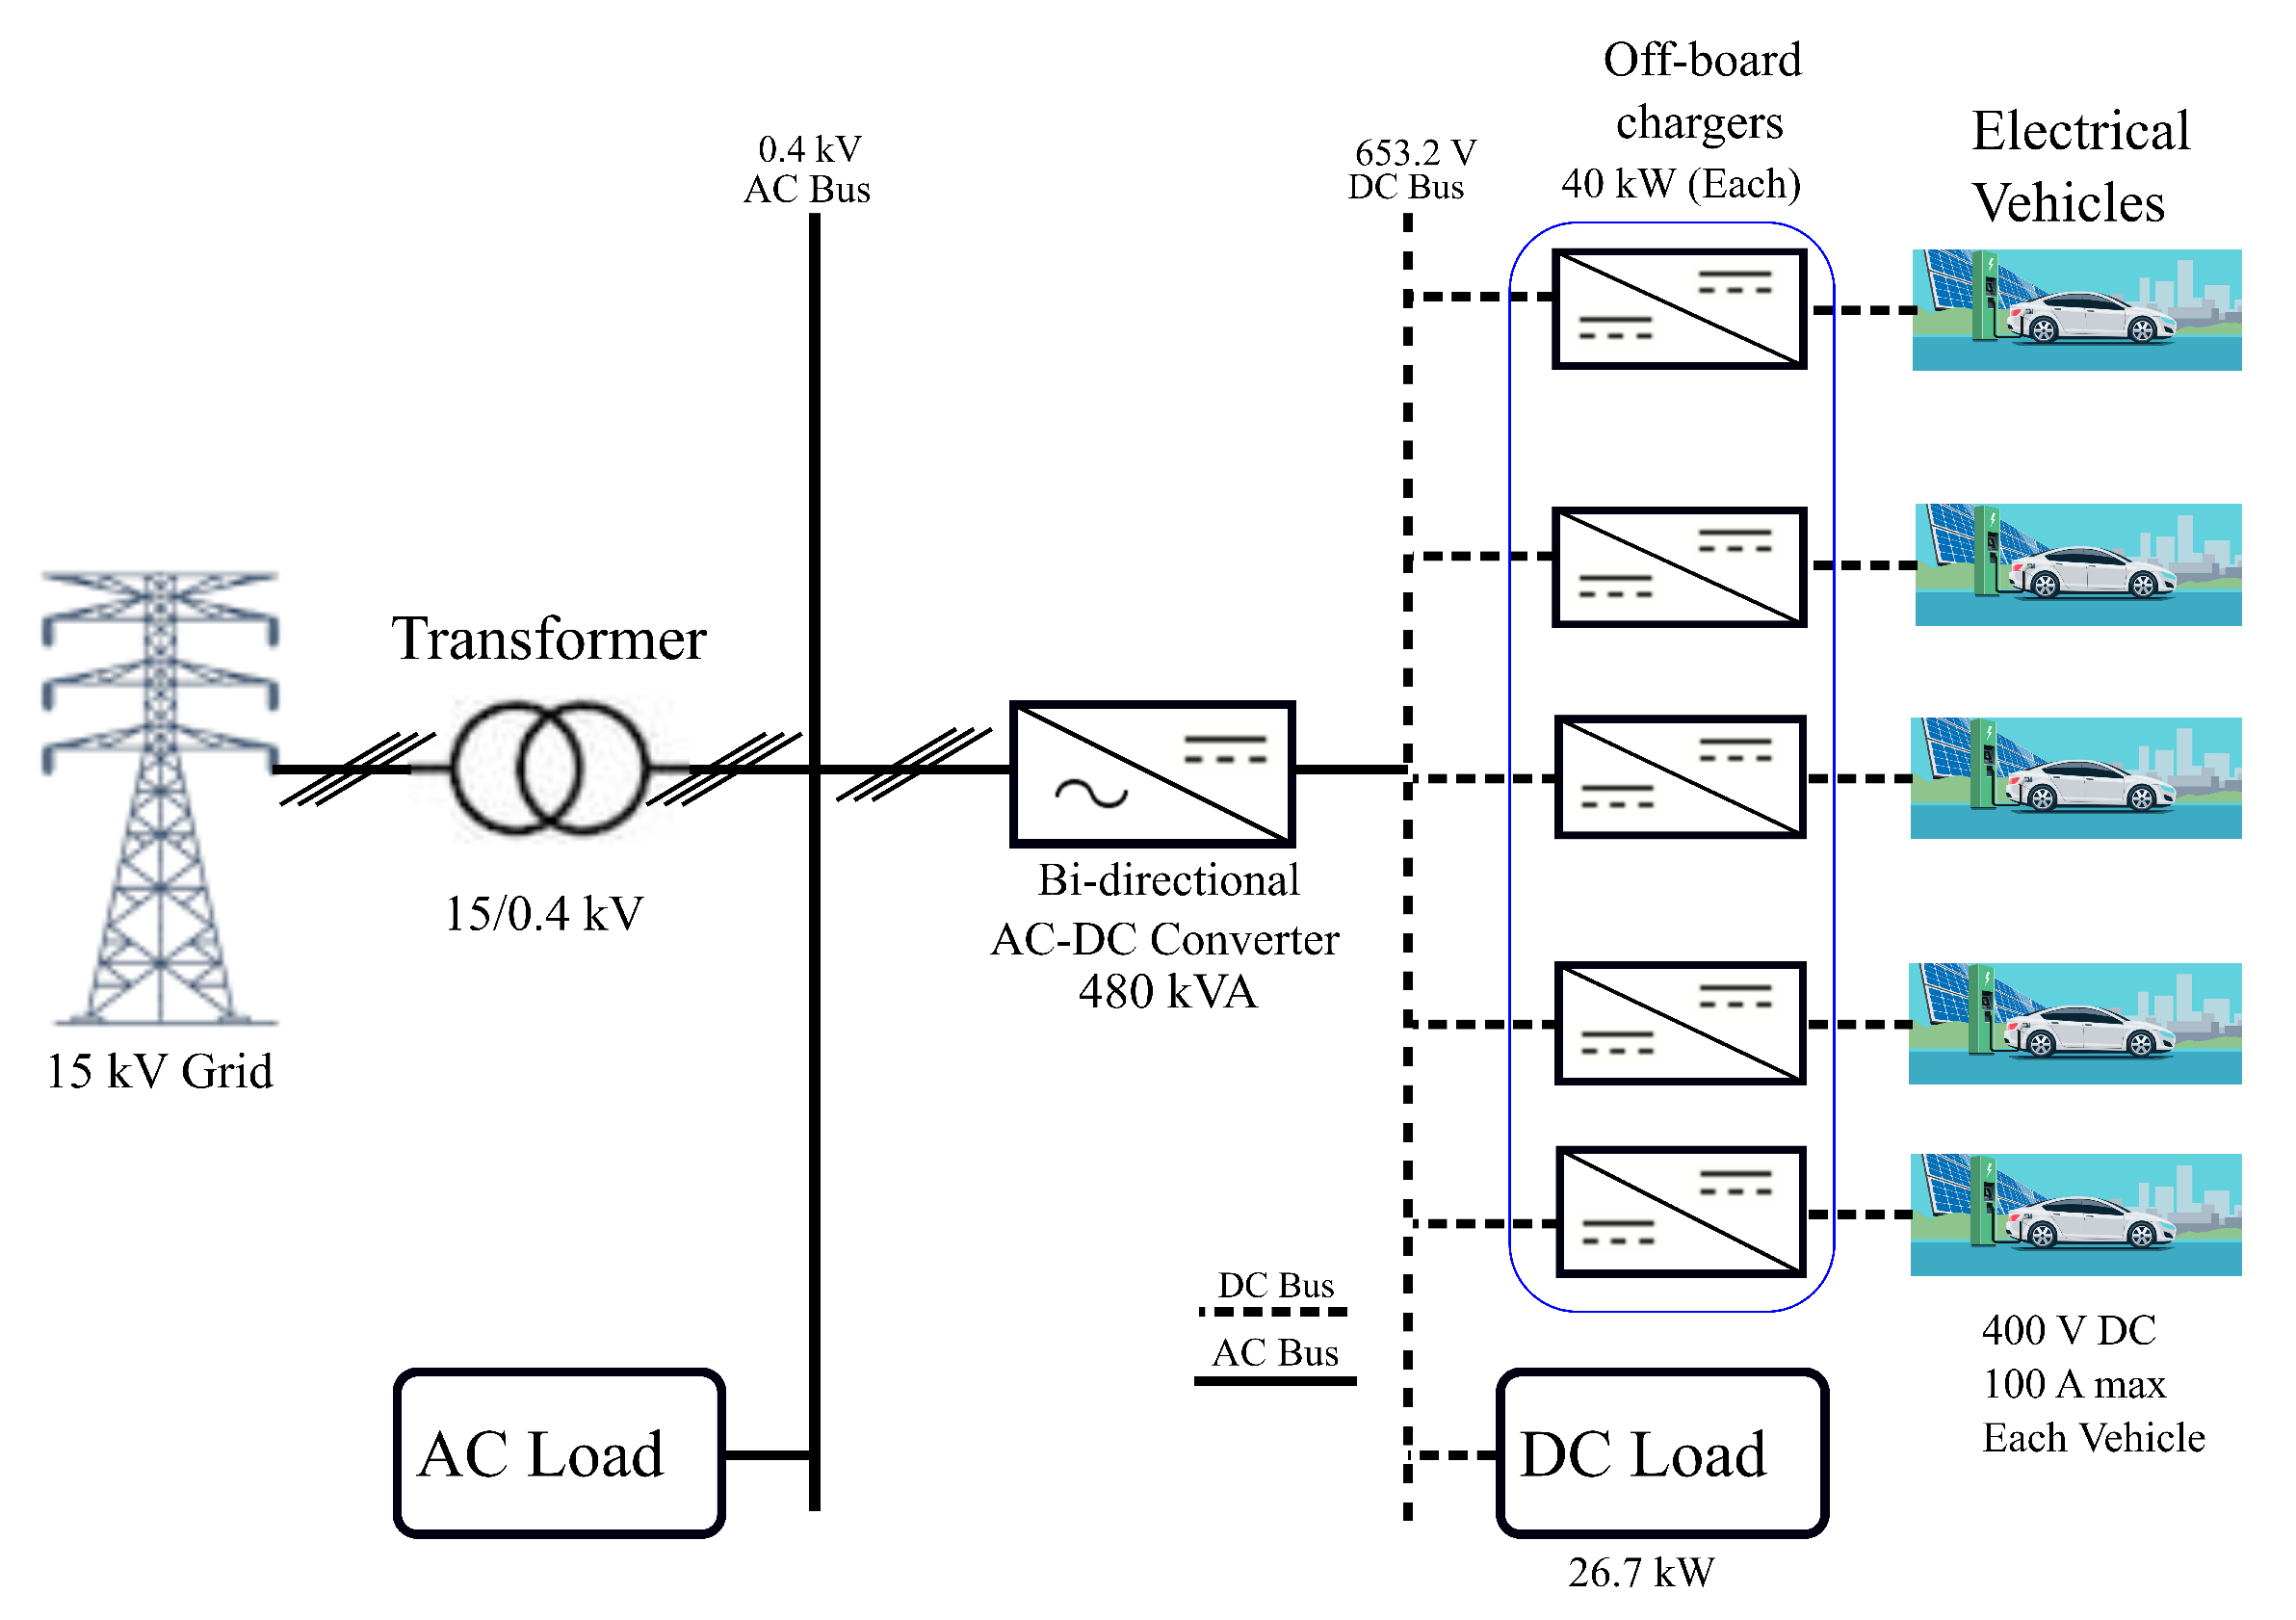
2. Microgrid Components, Structure and Controls

The Figure 1 illustrates a micro-grid. The last consists of infinity power grid, various EV charging stations and the PV solar power system. Inside the same micro-grid, power electronics energy conversion is applied, the power flow is processed and various controls are performed in order to ensure the correct parameters. The EV and EMB form the load, while the EVs can serve as storage systems. The EV and EMB charging stations are mostly installed in cities, where in most countries, the medium voltage urban transmission grid is 15 k V [29]. The last is converted to a low voltage of 0.4 k V through a step-down transformer for distribution. In Figure 1, a microgrid is connected to the low voltage (0.4 k V ) side of the main grid. The low voltage in turn is obtained from 15 k V medium voltage grid through a transformer. Through the bi-directional AC-DC converter [30], the 653.2 V DC is supplied to the DC link. The PV power system supplies to the same DC bus of 653.2 V. In turn, the DC bus supplies the 40 k W off-board chargers for the EV charging and discharging and a 26.7 k W DC load. The DC load stands for EMBs or any other load. The 40 kW and 100 A off-board charger is chosen among the commercially available and most-used charging stations. The indicated off-board chargers are all above level 2 in the levels defined by the Society of Automotive Engineers [31]. They are Electric Vehicle Supply Equipment (EVSE) and categorized as level 3, as they can fast-charge (rated current of 100 A max) [32]. This work considers the micro-grid in Figure 1. Hence, the study will focus on the grid behavior facing the power flow from/to EVs with PV power system support. Before elaborating in detail on the behaviors of the grid, this work will first elaborate more on the bi-directional flow of energy, energy conversion, solar power harvesting, the controls involved and charging/discharging of the EV batteries. Simulink is used as a tool to simulate and achieve the required results.

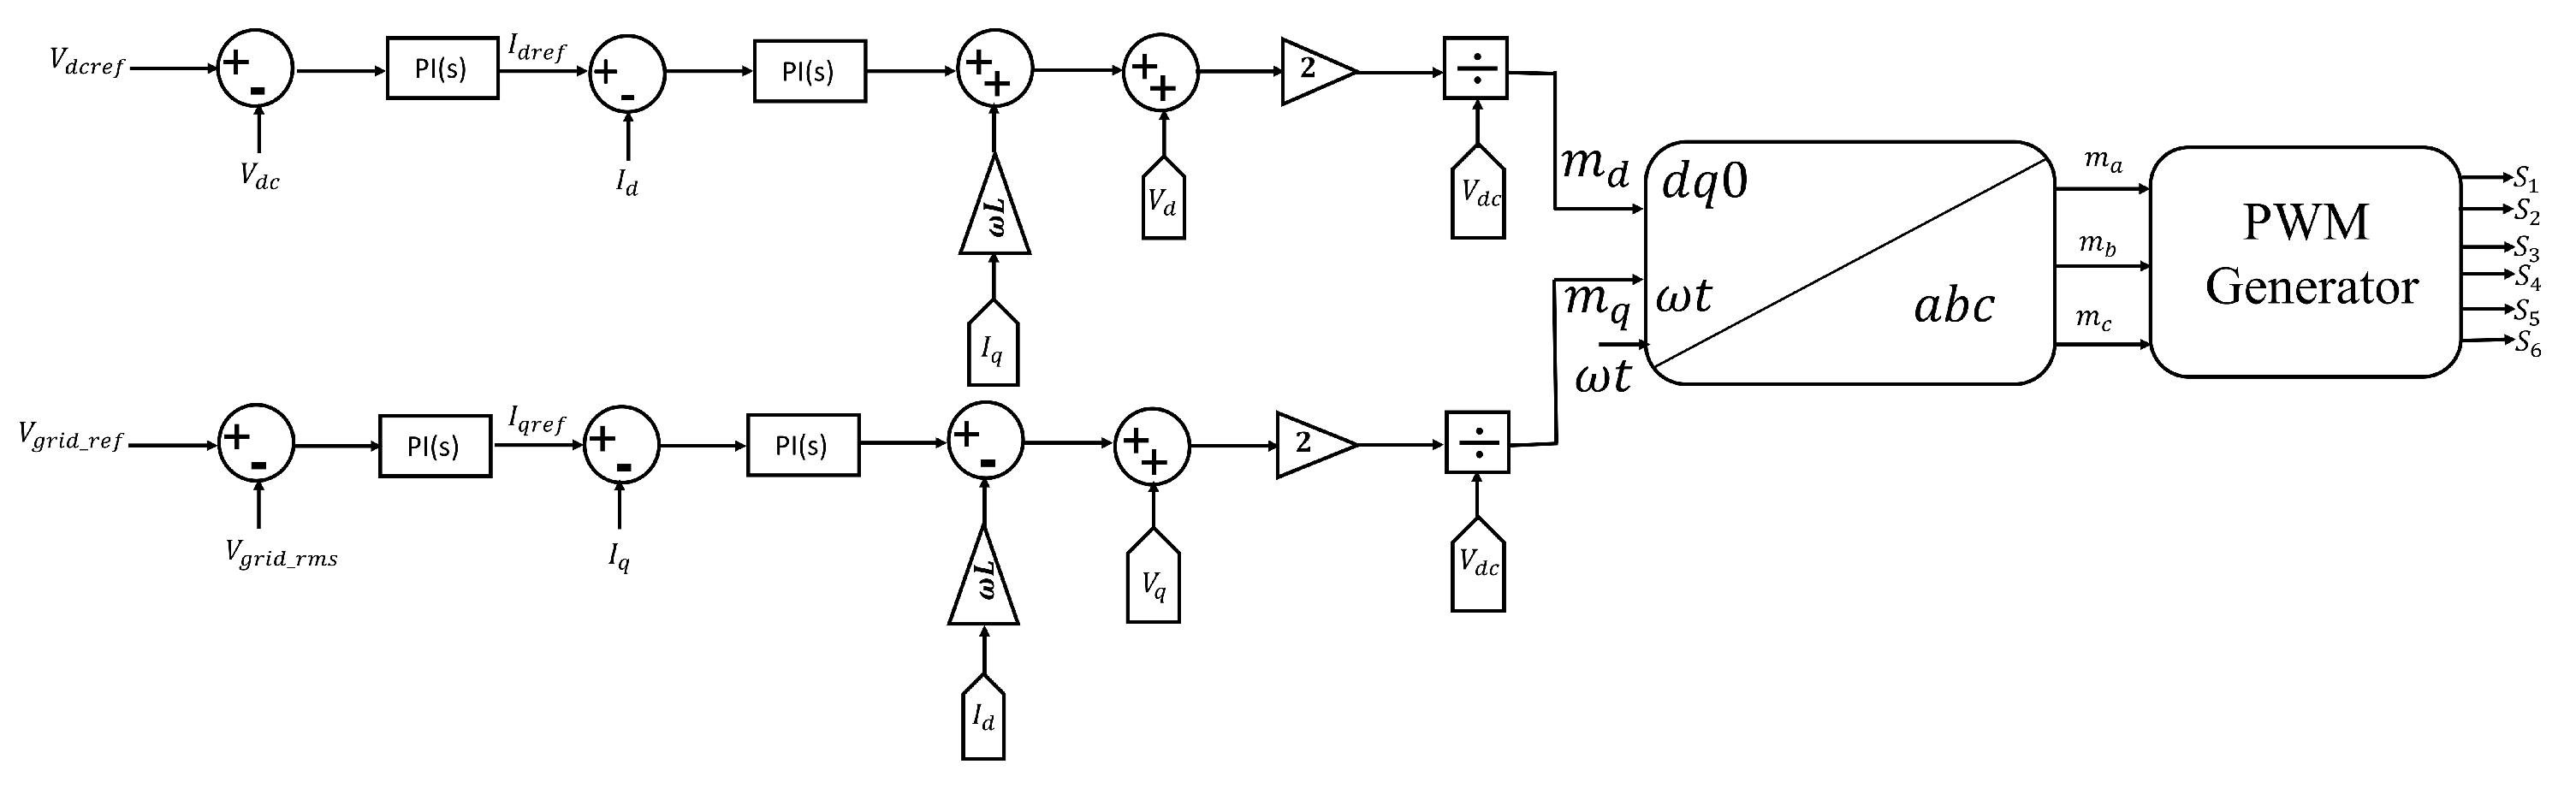
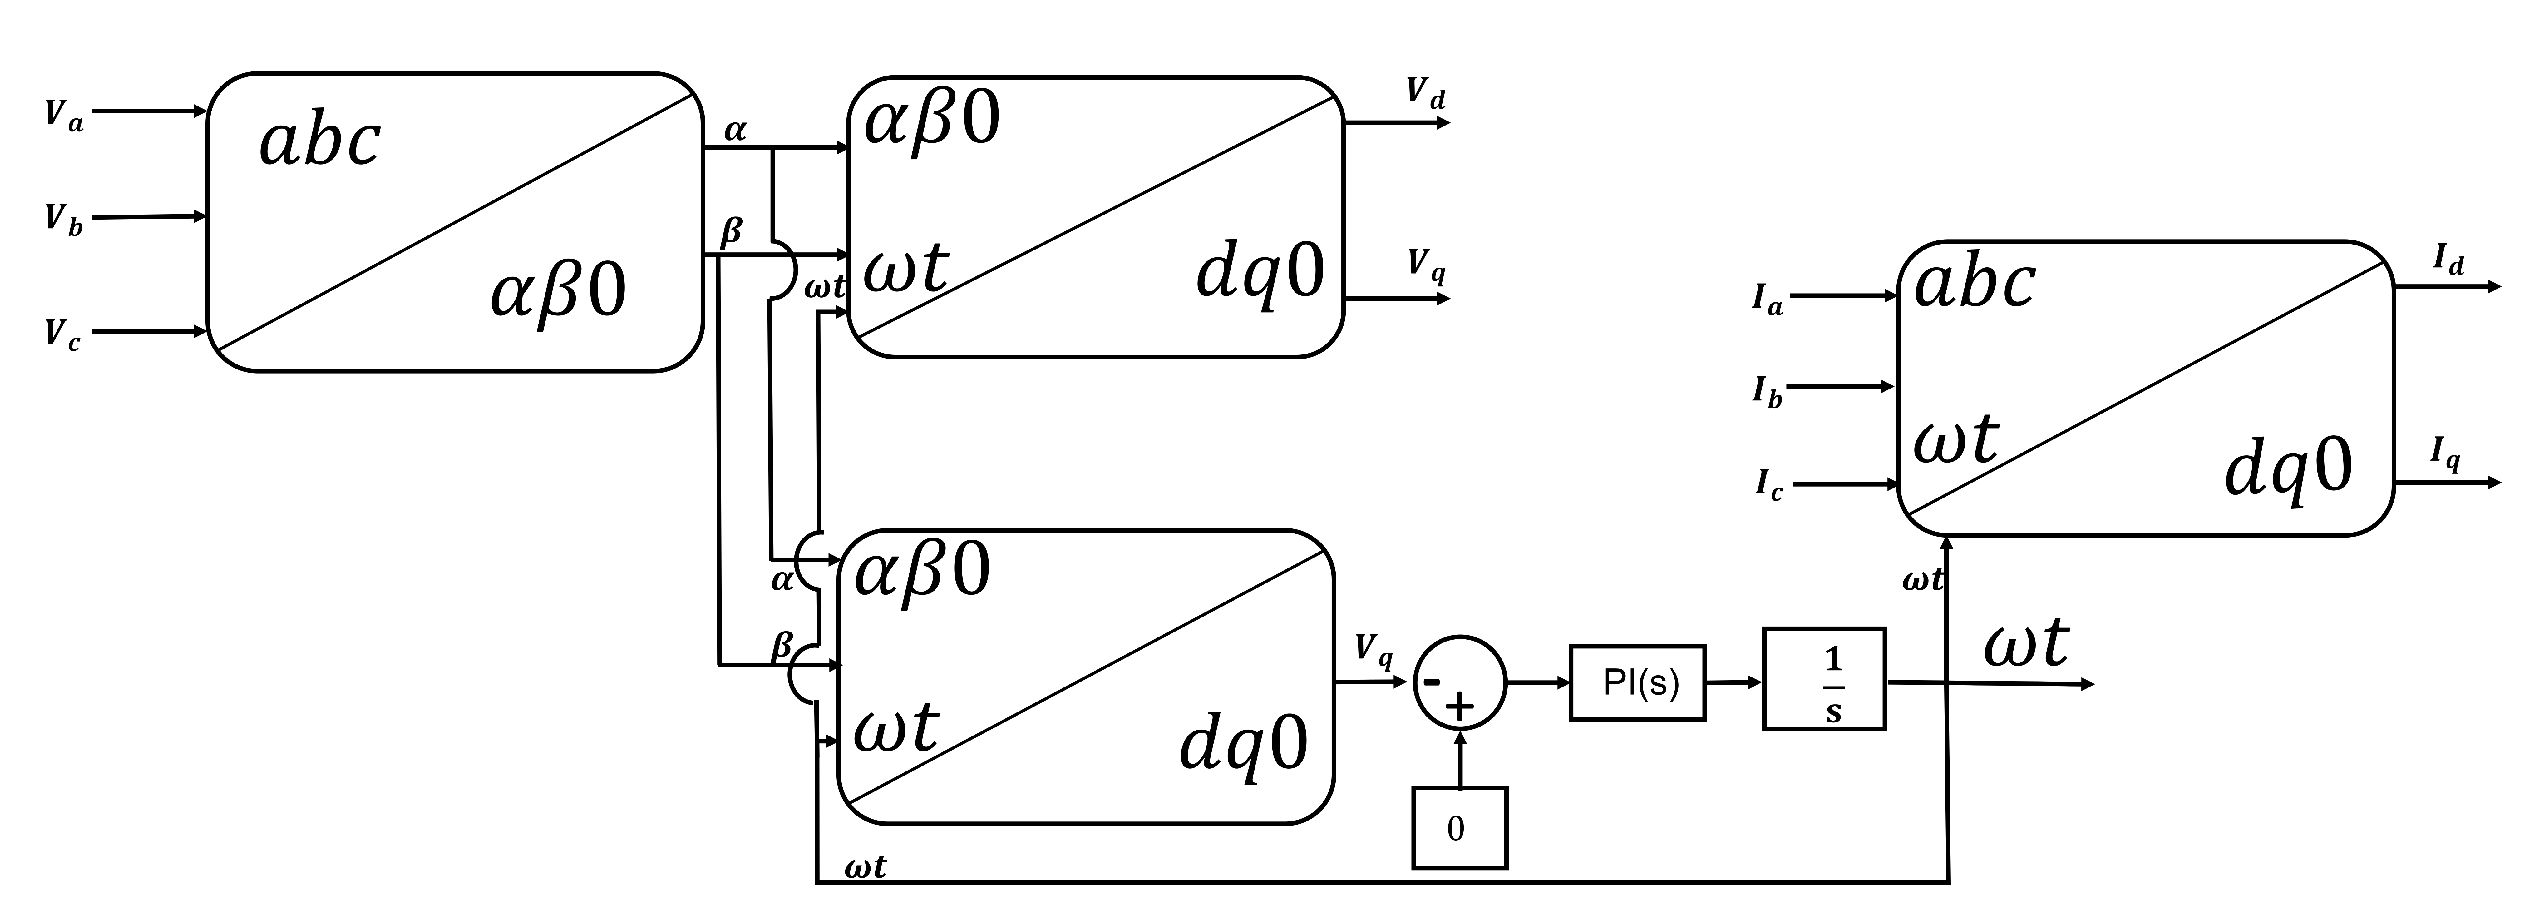
2.1. Grid Connected Inverter

This is the bi-directional interface converter between the AC infinity grid and the DC link. It is the part of the microgrid that links it to the infinite grid. It is made of the grid side AC power that is converted into DC at the DC link. On this part, the control part is built to fix the DC link at given value. It is made of controlled bi-directional AC-DC front-end converter. It is a three phase bi-directional AC-DC and controlled converter made of IGBTs. The converter is connected to the grid through an R L choke of 1 μ Ω and 500 μ H , respectively, as shown later in the Table 1. The choke stands for a filter to reduce harmonics. The same choke, also known as a rectifier choke, is reflected as L g r i d in Figure 2 and determined as in [32]. The grid voltage is 400 V r m s phase-to-phase, at the grid frequency of 50 H z . The grid is mimicked into a three-phase voltage source of the indicated voltage and frequency, respectively. It presents the source resistance R S o u r c e and source inductance L S o u r c e as 100 m Ω and 40 μ H , respectively.

DC Link Voltage Control

From the Figure 2, the AC-DC converter connected to the grid provides a suitable level of DC link voltage. The expected DC link voltage is retrieved from the grid voltage through the Equation (1).
V d c = 2 2 3 V L L r m s
With V L L r m s being the phase-to-phase rms grid voltage. The DC link voltage control is capital in making the DC link stable. The decoupled d q 0 control method is applied. It is a cascaded control that consists of outer voltage and inner current loop as illustrated on the Figure 3.
The grid voltage and current are captured through voltage and current sensors, respectively. On the last, the a b c to α β 0 , a b c to d q 0 or α β 0 to d q 0 are performed. The phase locked loop (PLL) is applied to determine the satisfactory synchronous angle ω t as detailed on the Figure 4.
Apart for the determination of the synchronous angle ω t , the PLL illustration on the Figure 4 gives grid voltage and current in the d q 0 reference frame. The d-axis outer loop controls the DC bus voltage, while the inner loop controls the active AC current [32], as detailed in Figure 3. In case of bi-directional applications, the changes in DC bus voltage are influenced by positive or negative current due to power flow direction. The q-axis outer loop adjusts AC voltage magnitude by regulating the reactive current through the q-axis inner loop control. The decoupling term ω L and the feed-forward voltage signal are added for transient performance improvements. Figure 3 presents the complete control model for the DC link voltage and the grid current. Considering the Equation (1) and the grid voltage level, the DC voltage level of 653.2 V with the rated 432 kW rated power are targeted. Therefore, the DC bus shown in Figure 1 and Figure 2 is of 653.2   V DC.

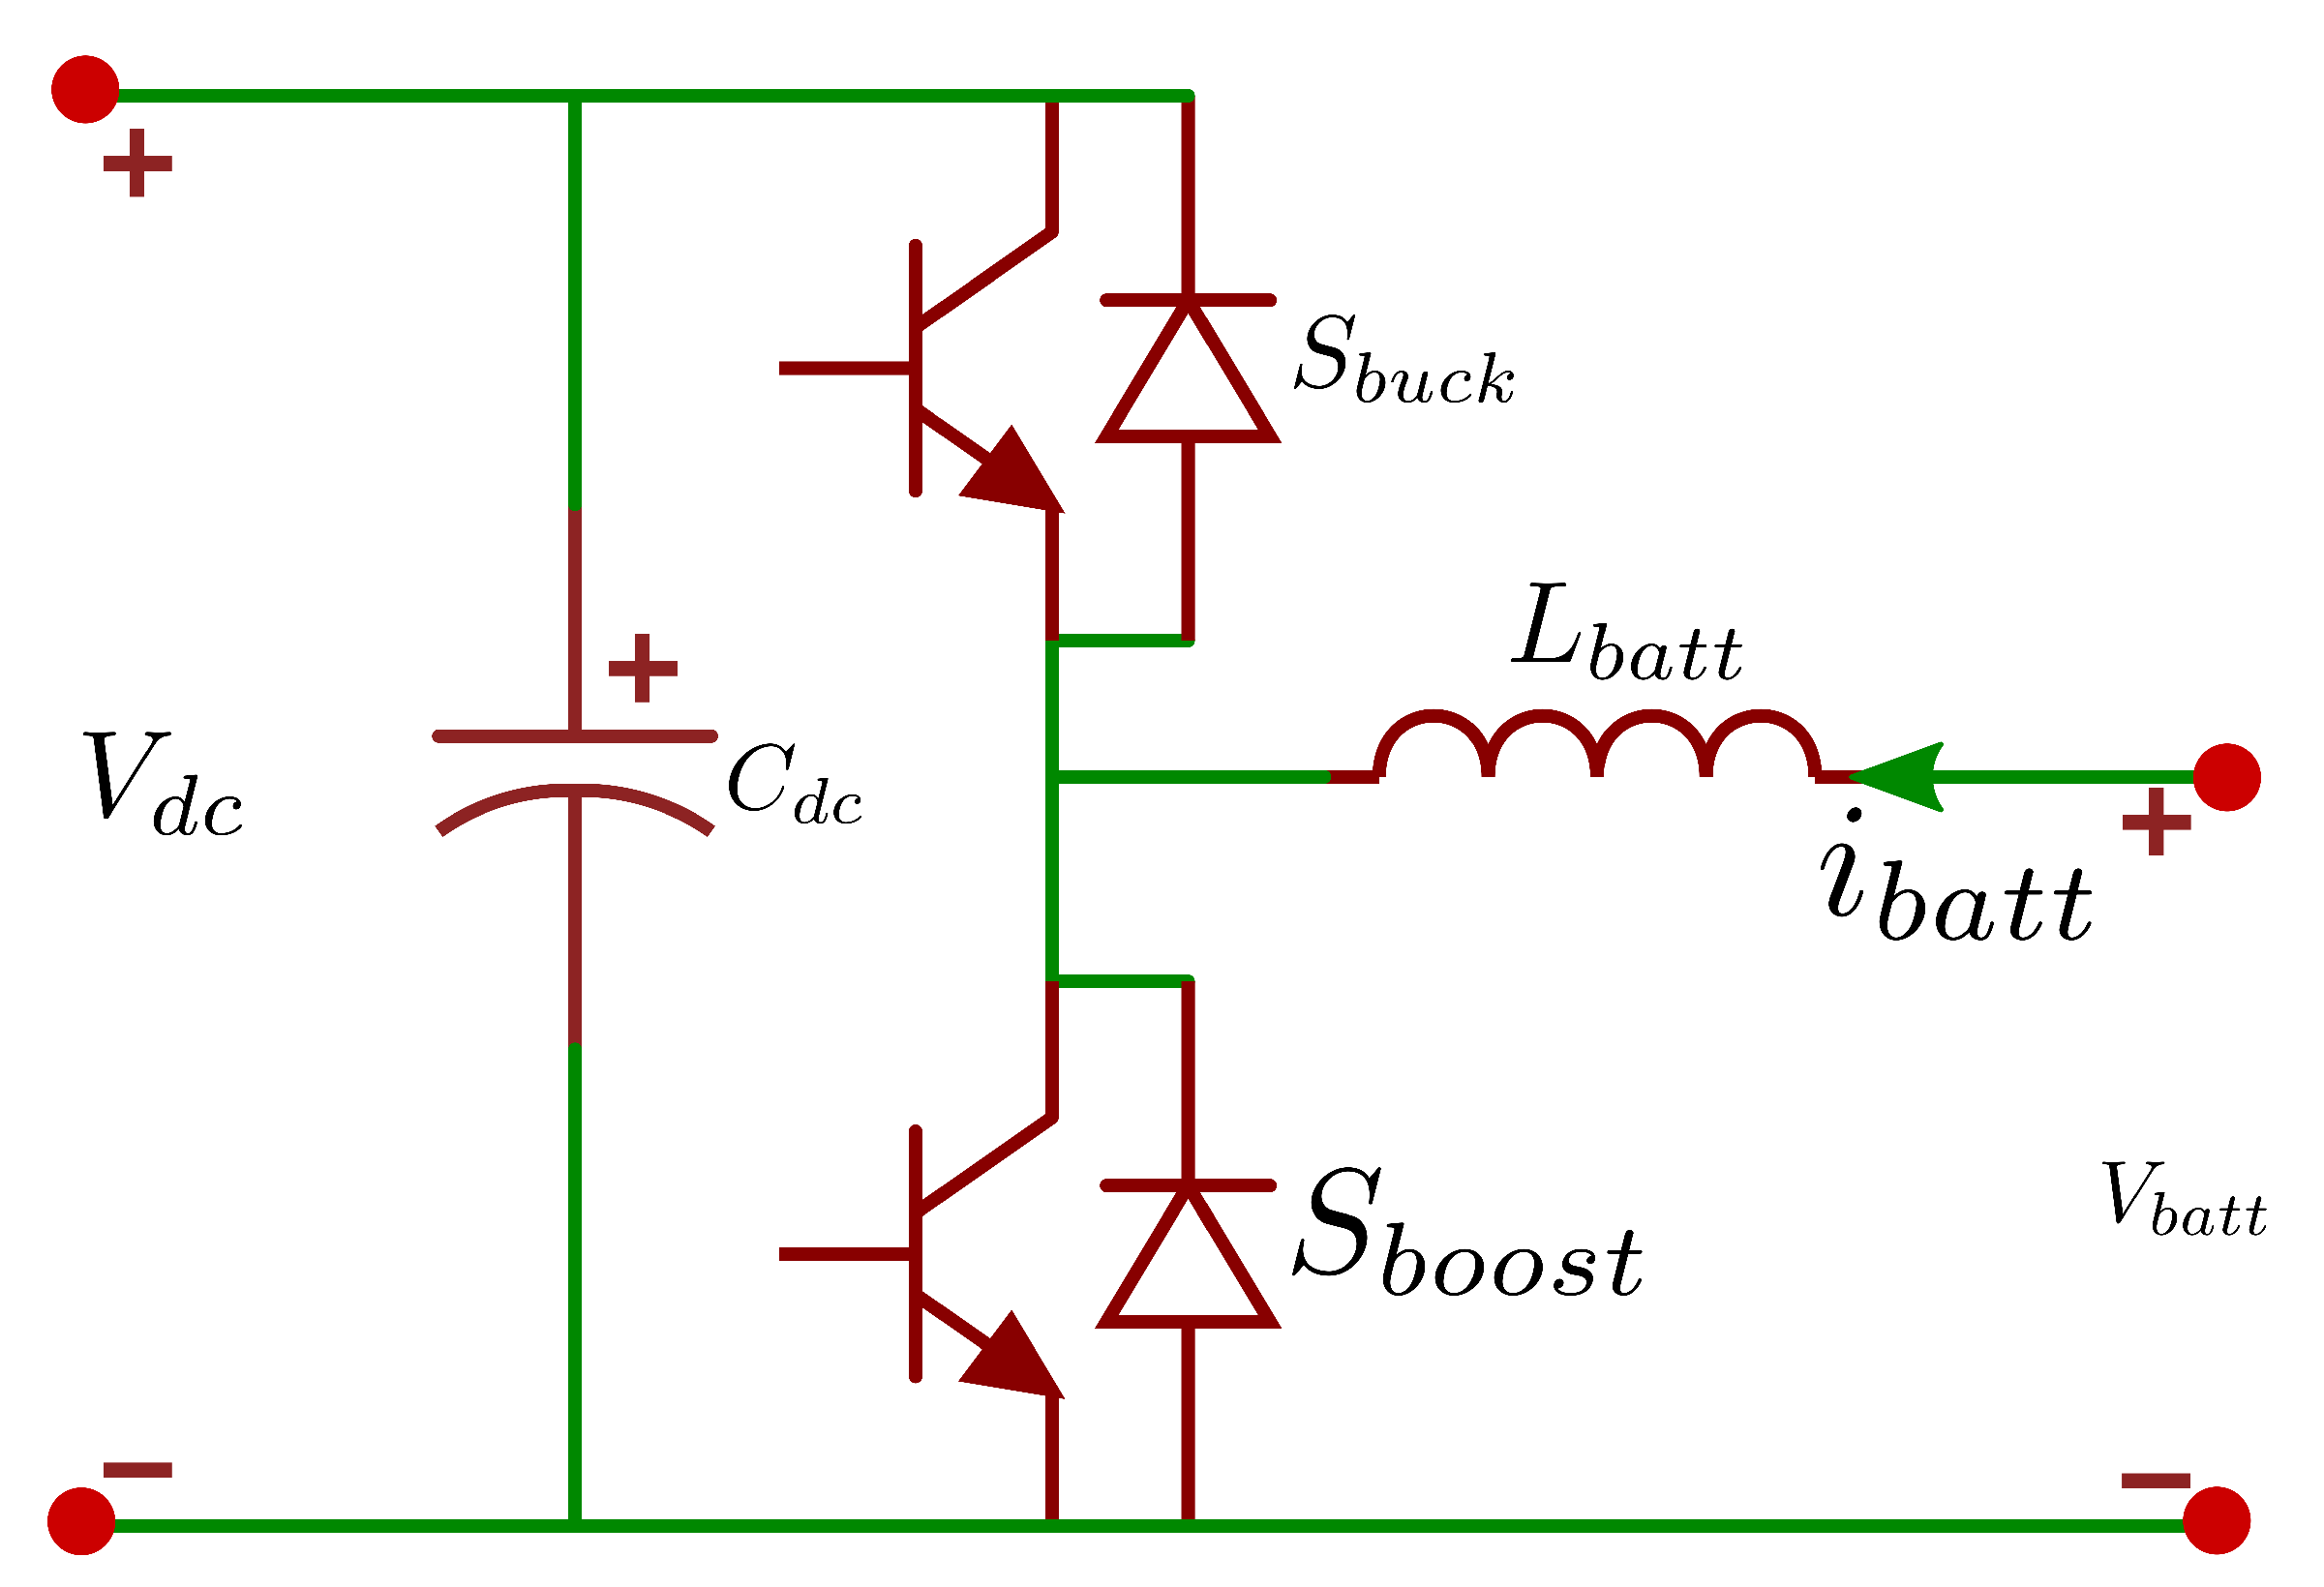
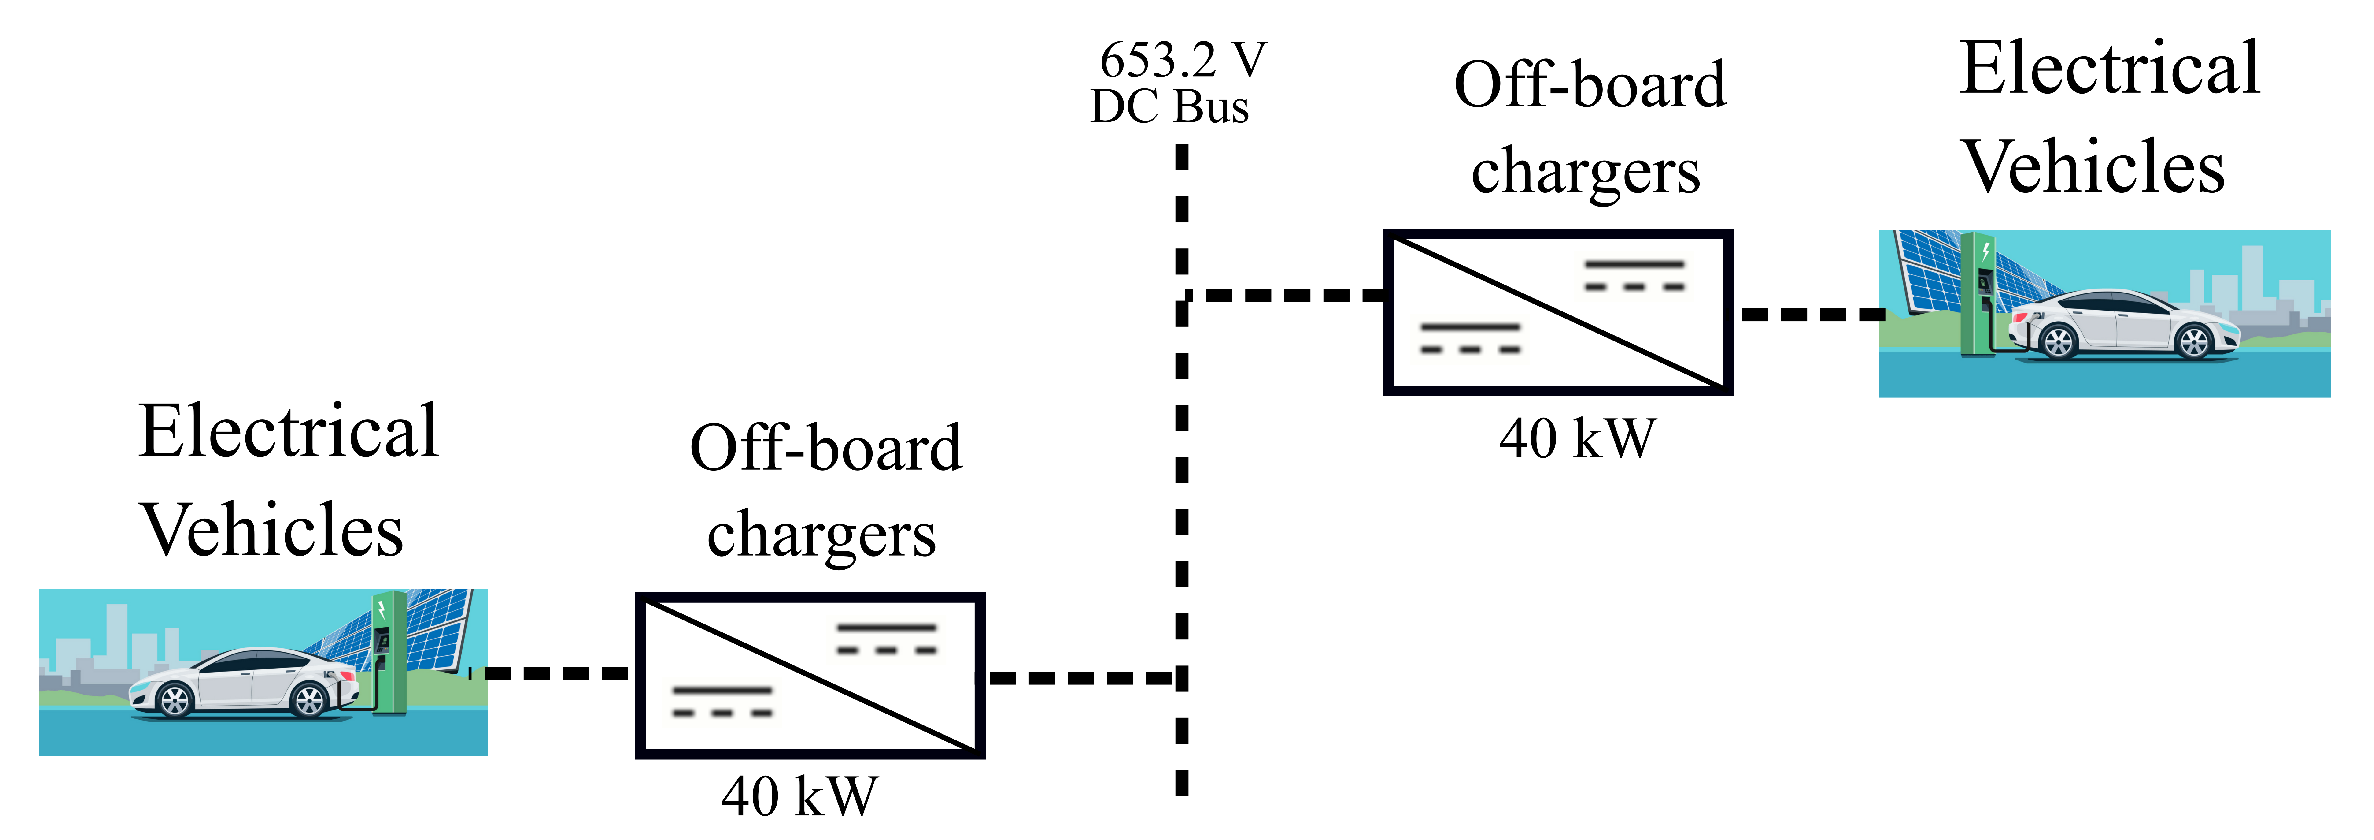
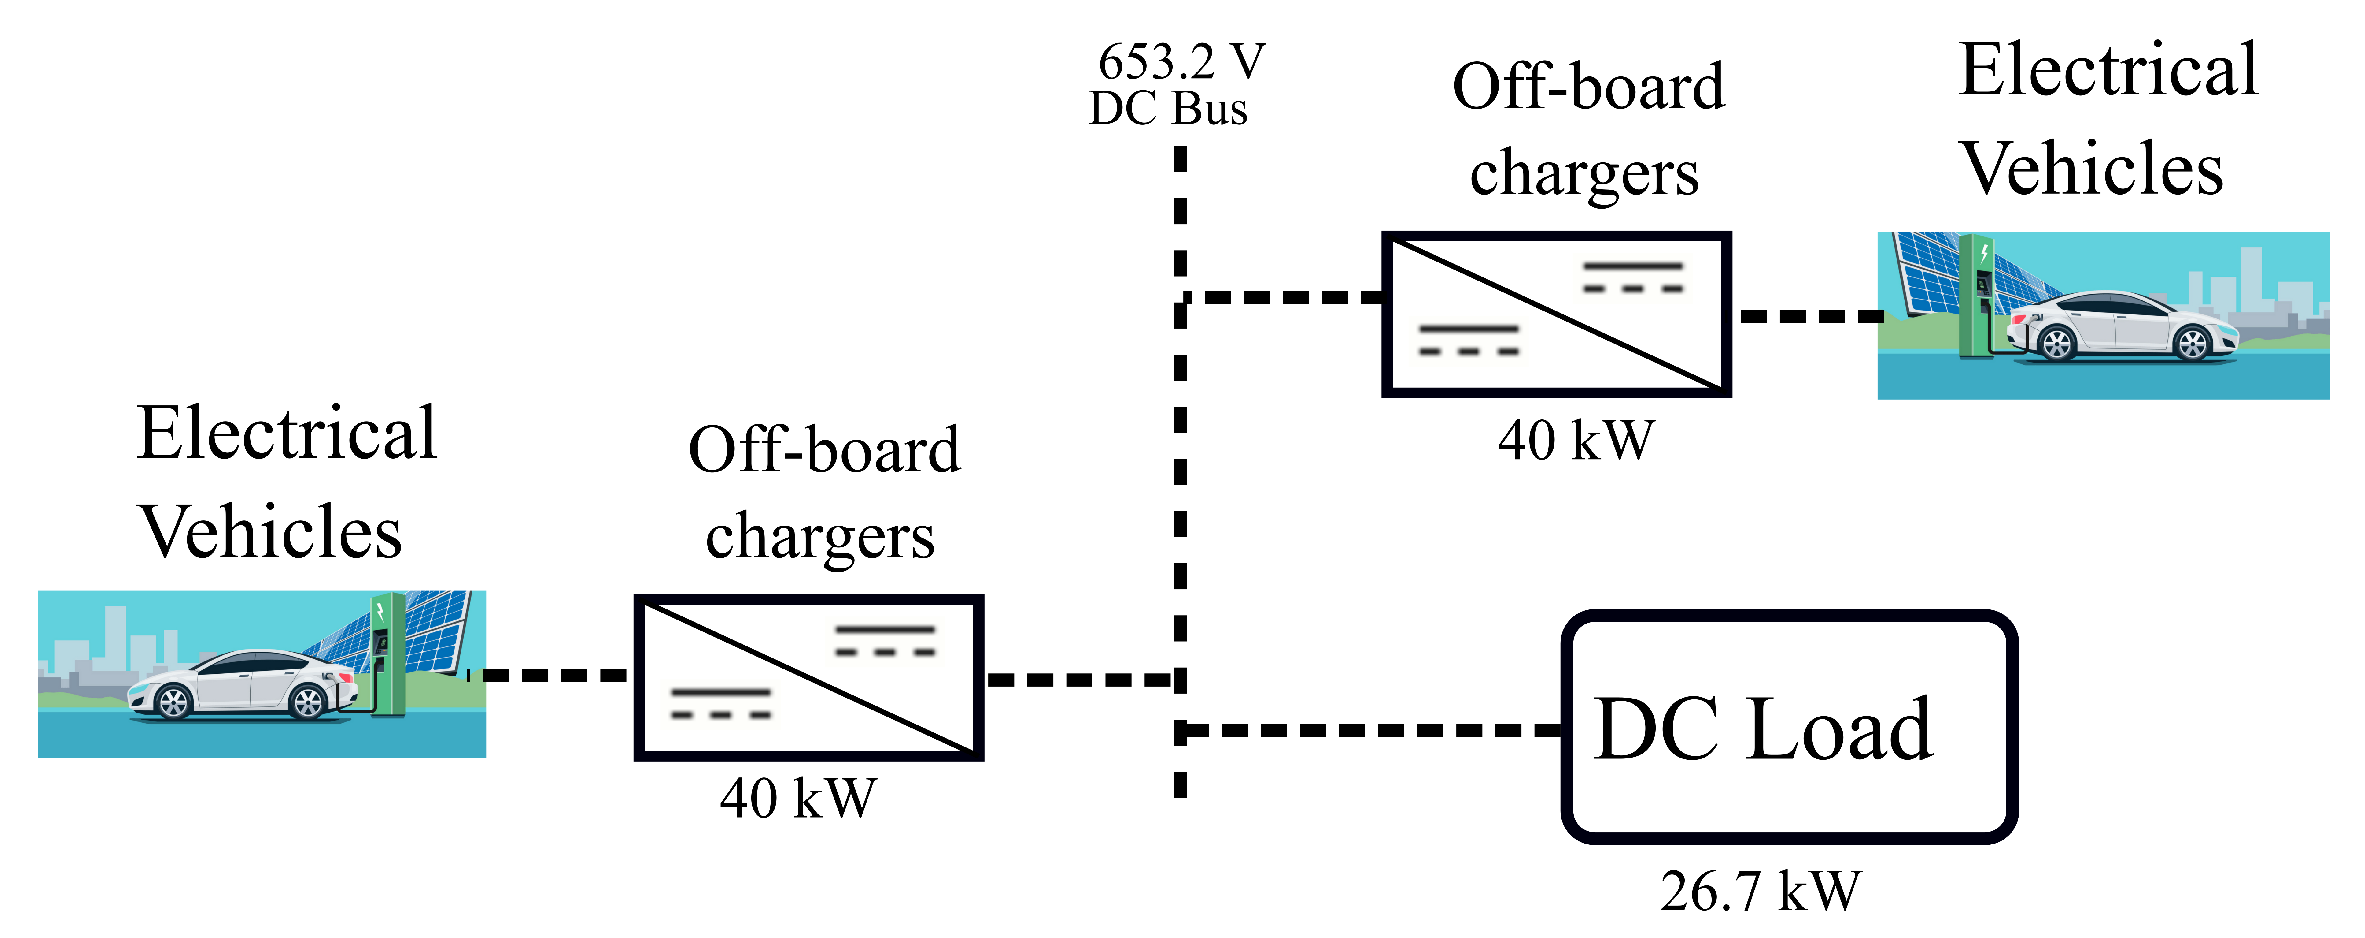
2.2. Off-Board Battery Chargers Configuration

The off-board chargers are the EVs on-site and fixed charging stations. Those are the chargers that are not embedded in the vehicle construction [33]. From the Figure 1 and Figure 2, the off-board chargers are the converters that link the EVs to the DC bus. The battery charging configuration consists of a bi-directional converter configuration that operates by following the direction of the power flow. It works as a buck when the power flows from the DC link to the EV’s battery, i.e., charging mode or G2V. On the other hand, it works as a booster, when the power flows from the EVs battery to the DC link (on-ward to the grid), i.e., discharging mode of V2G.
Figure 5 illustrates the off-board charger converter configuration. The flow of power, i.e., charging or discharging, is determined by the status of the EV’s battery, the power cost and the decision of the EV’s owner.

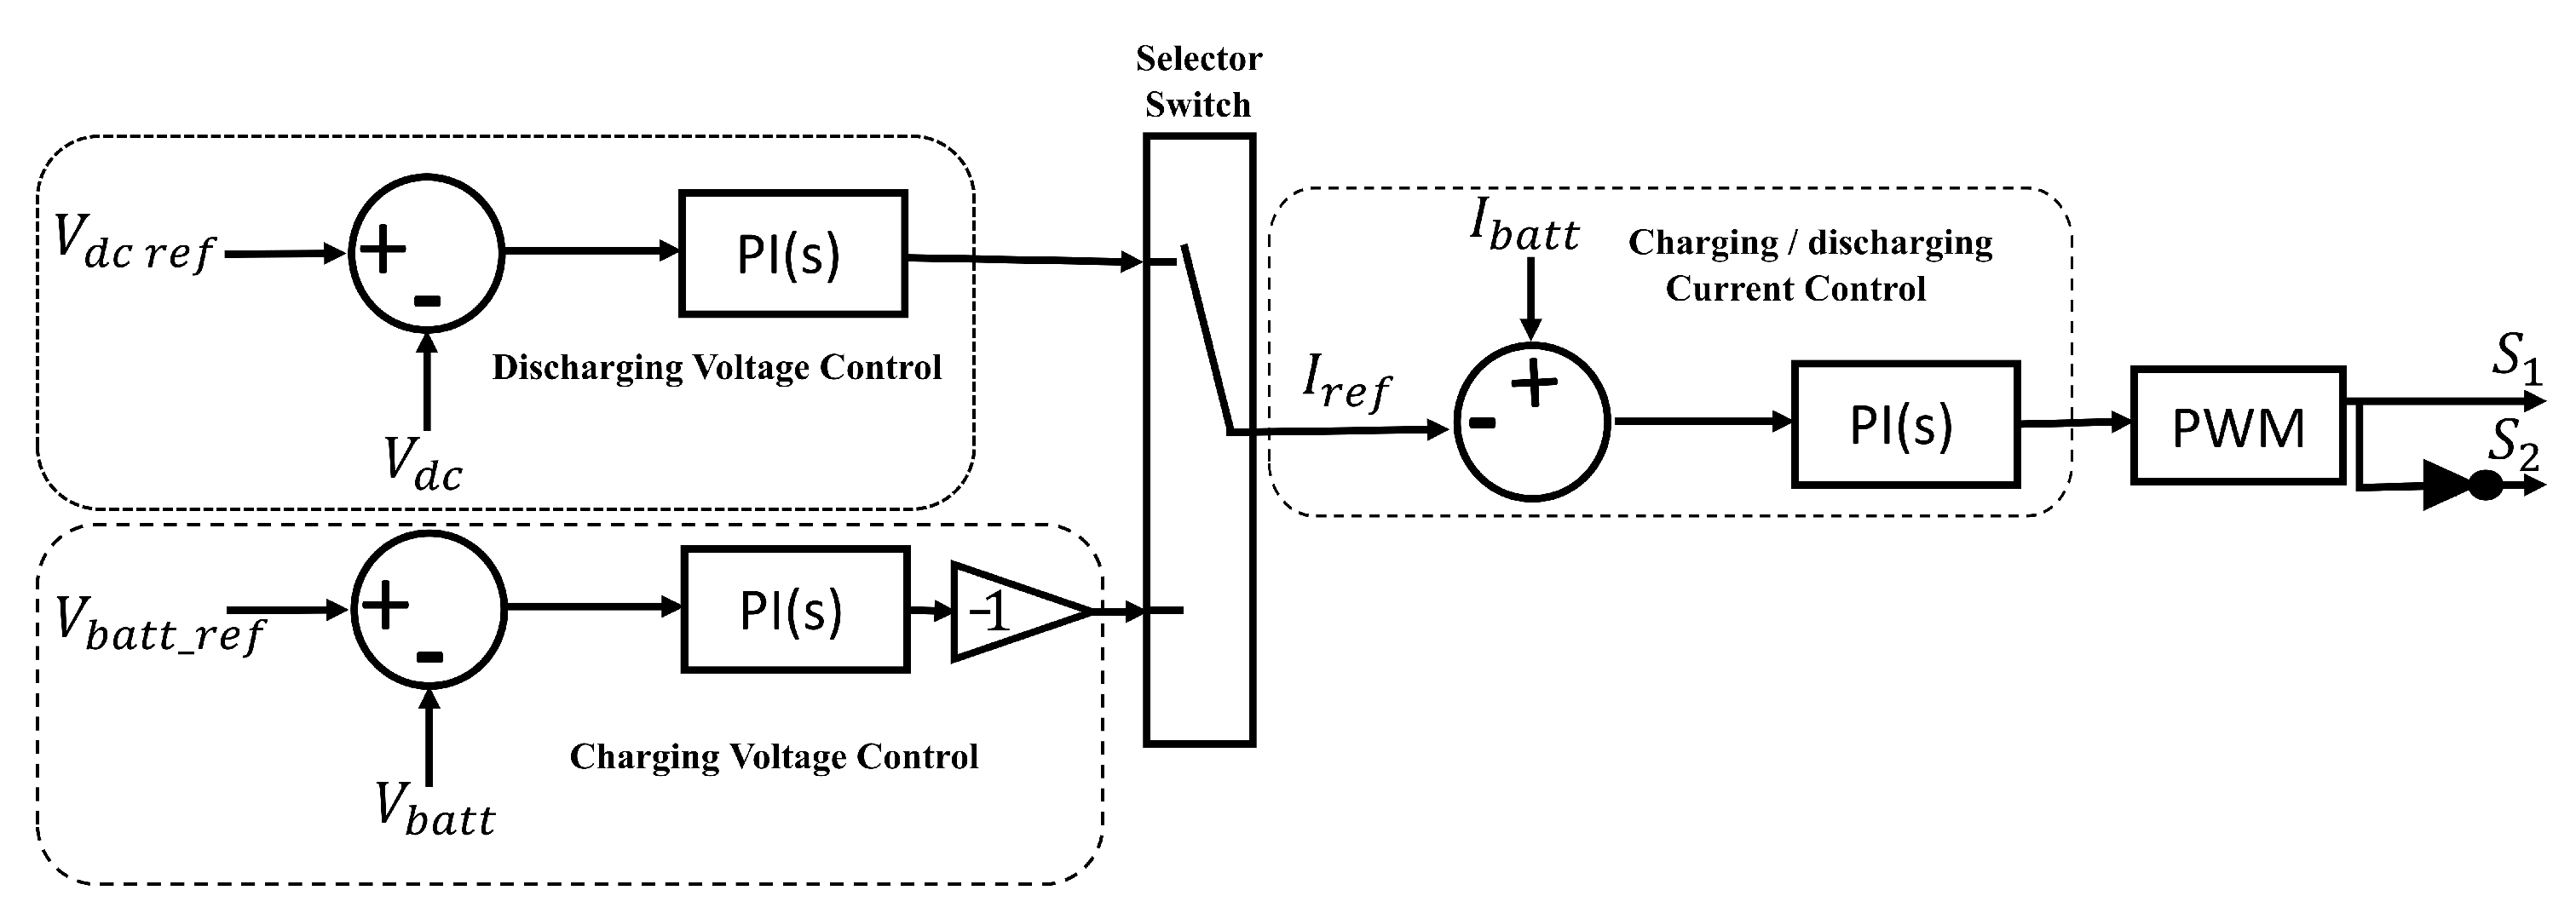
2.2.1. EV Charging and Discharging Control

The EVs’ charging or discharging implementation is done with the help of the control algorithm shown later on the model illustrated in Figure 6.
From Figure 6, the model is a cascaded closed loop control in which the inner loop controls the battery charging or discharging current, while the outer loop controls the battery charging or discharging voltage. The charging control take reference voltage from the battery norminal voltage, which in turn generates the battery reference charging current. The last saturates at the maximum rated charging current. This process controls the off-board charger in buck mode. On the other hand, the discharging control takes reference on the DC link voltage, which in turn generates the reference dicharging current, that is as well saturated and the rated discharging current of the battery. The last process controls the boost mode of the off-board charger. It can be noted that the battery charging current is negative, while the discharging current is conventionally positive.

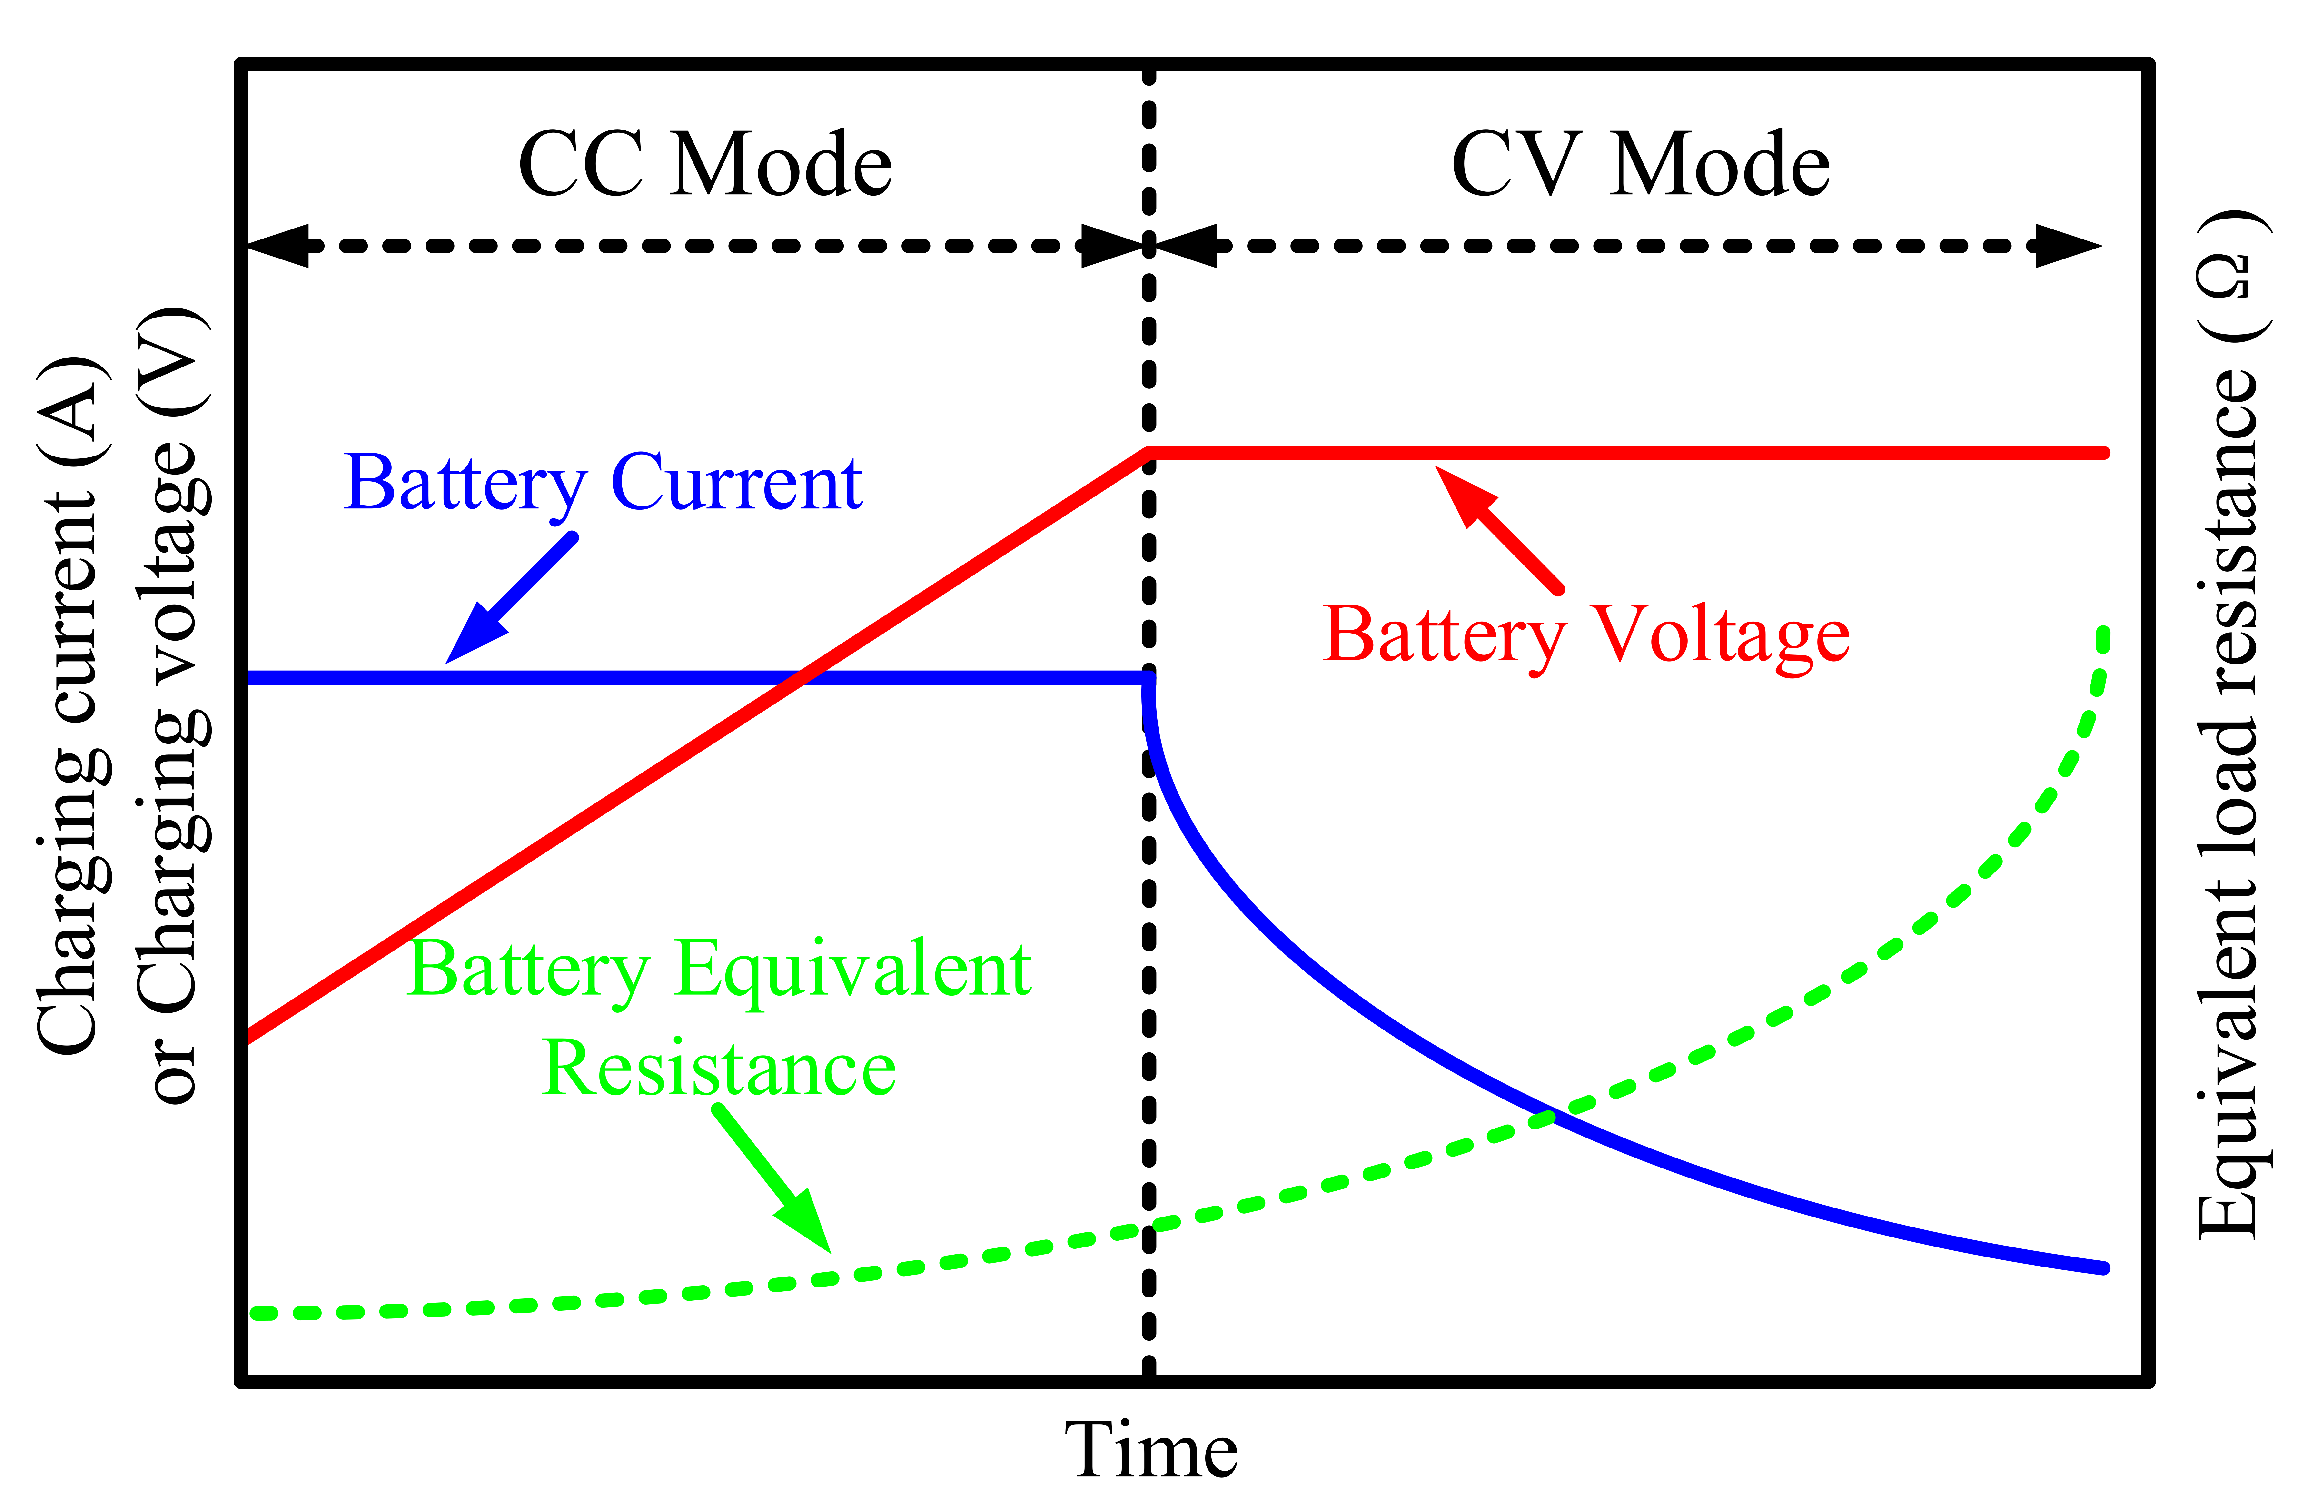
2.2.2. Mode of Battery Charging

The same model controls the charging and discharging of the EVs’ batteries and fixes them in the respective mode of charging. The battery charging or discharging is made in two modes: Constant Current (CC) and Constant Voltage (CV), as indicated in Figure 7. Setting up the modes and charging current strongly depends on the State-of-Charge (SOC) of the battery (EV battery). Depending on the battery SOC, the charging current starts at its possible maximum value, while the charging voltage increases. When the charging voltage reaches its referenced charging voltage, the charging current starts decreasing towards zero as the battery becomes fully charged. It is illustrated in Figure 7.
The same principle is inversely applied when the battery is discharging. In some practical cases, CC and CV become separated at SOC of 80%, hence the open-circuit battery voltage at 80% SOC plays a cut-off role for the charging voltage. Similarly, the nominal discharge current plays cut-off on charging current side. This makes the control boundaries represented in Figure 6.

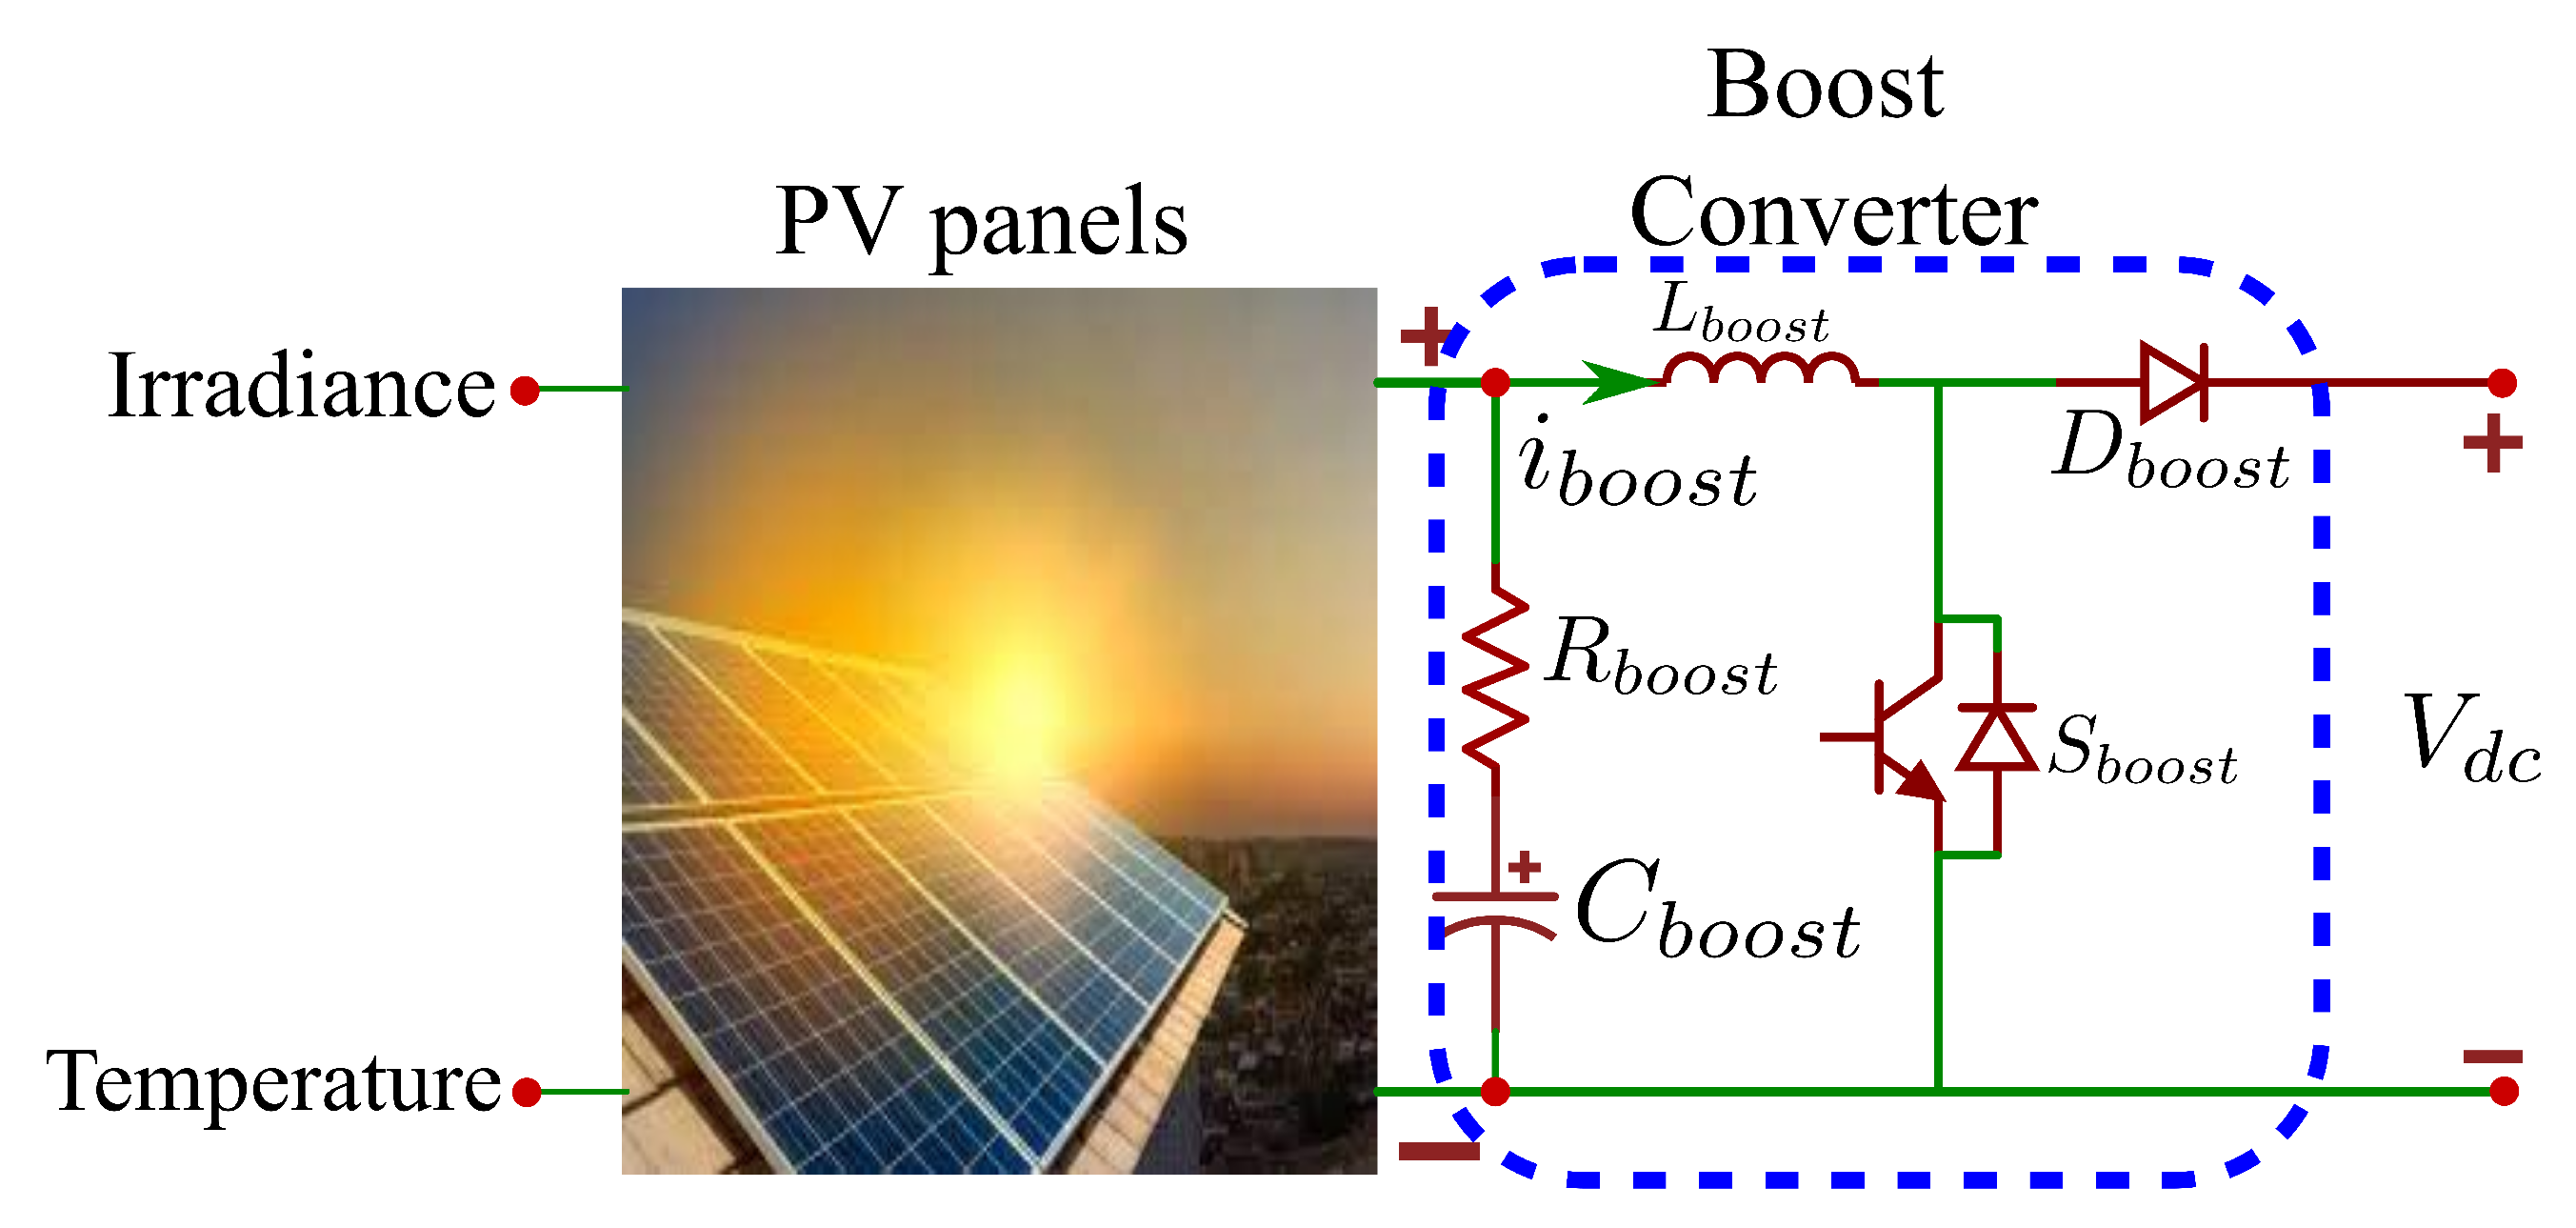
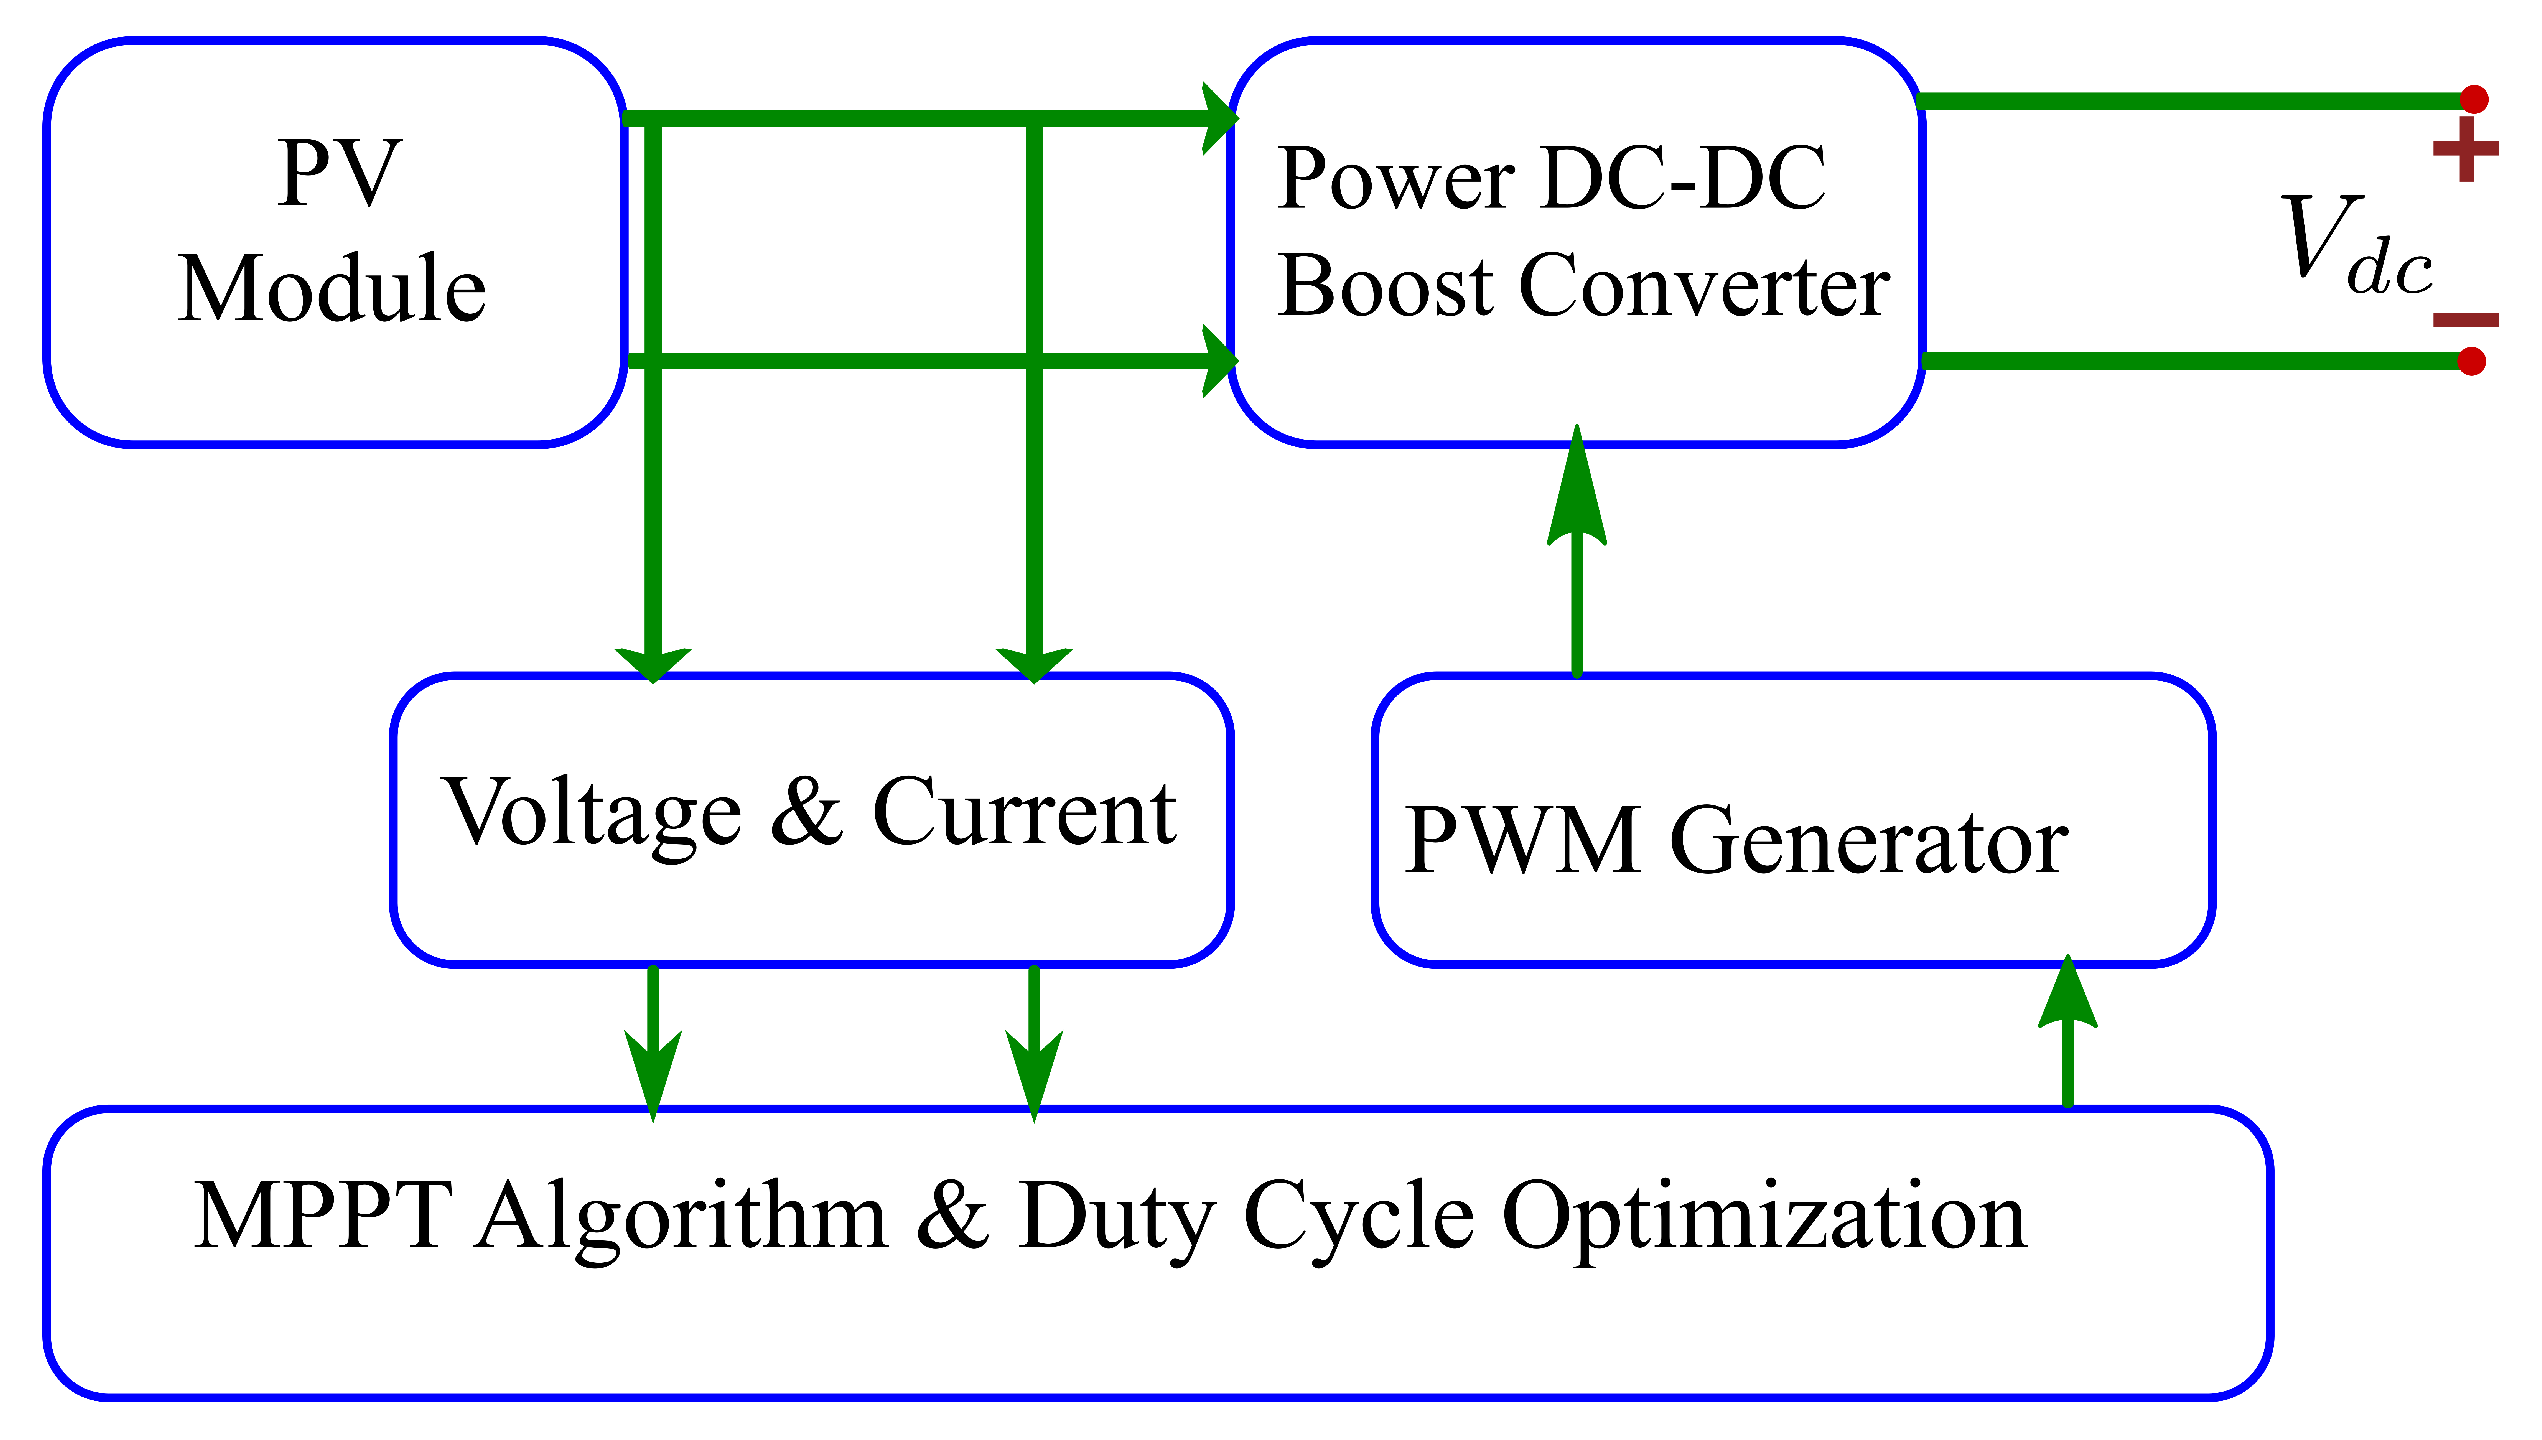
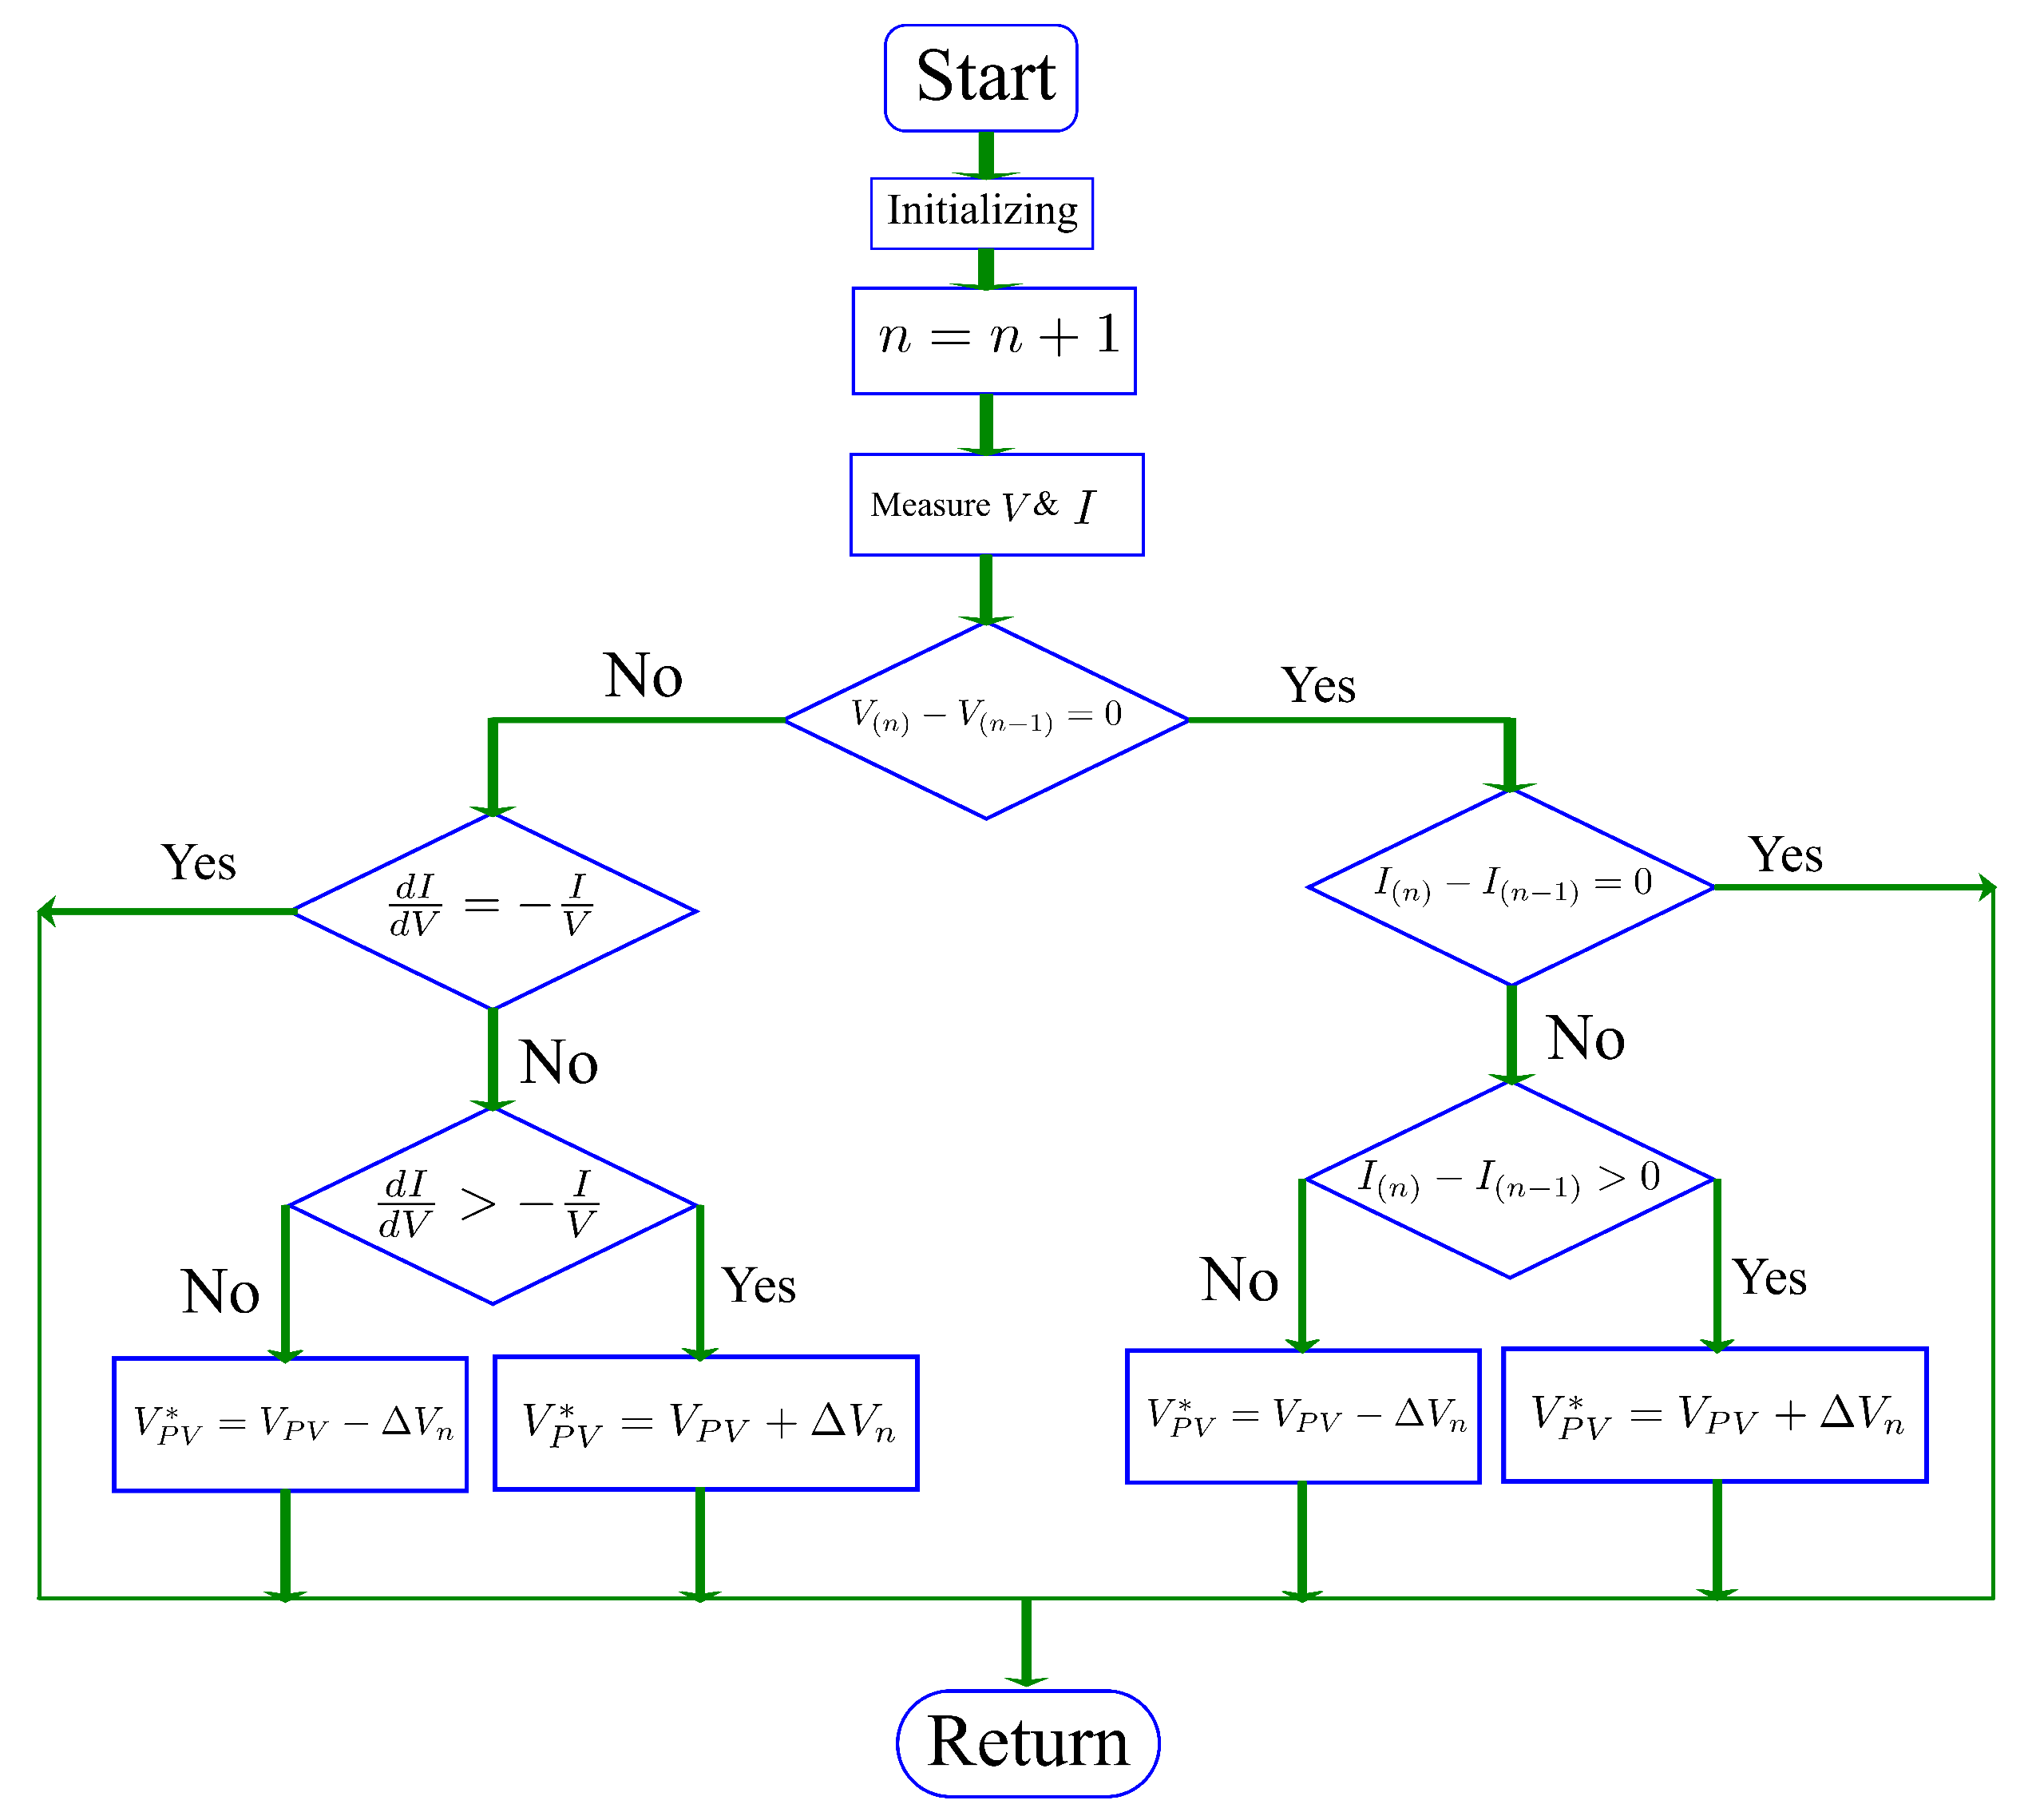
2.3. PV Array Power Supply System

Figure 8 springs from Figure 2, and illustrates the process of generating solar power and feeding it to the DC link [35]. It is made from the PV array and the DC-DC converter. The last is a booster that takes the PV array voltage to the DC link-required voltage level. The PV array gives DC solar power to the main DC link through the DC-DC converter. The control on this point is built to inject the solar power to the main DC link (and to the grid). The power generated from the PV array is obtained through a circuitry shown in Figure 8. It is made of a PV array composed of 14 series modules on 17 parallel strings. The last configuration is hit by the solar radiation at a given weather temperature and generates solar power (at a given voltage and current level).
By having the changes in irradiance and weather temperature, the PV array generates power, at a given level of voltage and current. The PV power can either be used as standalone or sent to the grid. In this case, it is linked to the grid, and it has to be adapted to the level of voltage suitable to the grid. Therefore, the booster DC-DC converter is used as shown in the Figure 8. The solar power harvesting needs to be maximized in order to keep the system efficiency. Hence, the control of the booster has to consider the power harvesting maximization.
The complete booster control structure is illustrated in Figure 9, where the power harvesting maximization is achieved through applying Maximum Power Point Tracking (MPPT). There are several algorithms used to apply MPPT on PV power systems control, incremental conductance is one of those and it is the one applied in this work.
The PV module current and voltage are used in the MPPT algorithm and come up with the suitable duty cycle that for the right PWM control. The Figure 10 shows the incremental conductance algorithm for MPPT implementation.

3. Microgrid Modes of Operation

This section illustrates various mode of operation, in which different power flow are indicated. In the same case, the related terminologies are shown. Figure 11 is retrieved from Figure 1, by extruding the solar power source. It is for the purpose of deeply studying the behavior of the grid in presence of simultaneous charging and discharging of the EVs and some other DC loads.
Excluding the solar power source at this stage makes the first part of this work. It concentrates more on various modes, i.e., EV charging modes or G2V and EVs discharging back to the grid or V2G. In addition, the EVs on the DC link can charge each other or V2V mode, and lastly the EVs can supply power to the rest of the DC loads or V2X. All of the indicated modes are drastically elaborated on in this section.

3.1. G2V or Charging Mode

The battery in charging mode (G2V) consists of negative current(charging current) at the cut-off level(CC). The charging current starts decreasing toward zero once the charging voltage reaches the cut-off value (CV). The charging current reaches zero once the SOC is approximately 100%. In G2V mode, the off-board charger will be operating as a buck converter. It provides the right level of charging voltage, lower than the DC link voltage. Considering the off-board charger shown in Figure 5 in buck mode, the upper switch ( S b u c k ) is operated together with the lower switch anti-parallel diode. The off-board charger duty ratio is D and the charging voltage is given by Equation (2).
V b a t = V d c D
The duty ratio D is in the range of 0.0 1.0 , hence the voltage at the battery V b a t will be lower than the DC link voltage V d c by the ratio D. Therefore, the last statement illustrates the buck converter functionalities.

3.2. V2G or Discharging Mode

When the EV battery has to send the power back to the grid, or to a certain load (part of the grid), the booster is necessary. The battery voltage is on a lower level, so it needs to be boosted to a voltage level of the DC link. During the V2G, the battery current is positive (discharging current), the battery voltage is constant (CV) until the current reaches the cut-off (CC). Hence, the voltage starts decreasing. The SOC in this case decreases as well. The battery voltage will keep decreasing until the SOC reaches zero, the battery current will drop to zero and the discharging is completed. Considering Figure 5 in the boost mode, the lower switch ( S b o o s t ) and the upper-switch ant-parallel diode are operated. The DC link capacitor is enough to stabilize the DC link on the required voltage, and the booster mode is illustrated in Equation (3).
V d c = V b a t 1 D 1
where D 1 is the duty of the boost mode in Figure 5.

3.3. V2V or Combination of Charging and Discharging Mode

Vehicle-to-Vehicle (V2V) is the platform of charging the EVs; where the EVs with batteries full of power can charge others with low power batteries without the support of the grid or any other source of power. It can be through plug-in or wireless charging. The plug-in charging option is considered in this work. As it is illustrated in Figure 12, this work demonstrates an option of plug-in V2V charging, where the EVs are charged or discharged on different off-board chargers sharing the same or interlinked DC bus. Therefore, the discharging EVs supply power to the DC bus and from the same DC bus, the charging EVs get power.
It implies that the off-board chargers can perform bi-directional operations, as indicated in the Figure 5, with the controls shown in Figure 6.

3.4. V2X or the Case Where the Vehicle Supplies Various Loads on the Same Bus

The off-board charger with bi-directional capabilities is considered. It links the EV with the rest of the network through a DC link. The mentioned off-board charger is for the plug-in option.
Therefore, the EV plug-in to the DC link and supply power to the DC bus. From the same bus; either other EVs or any other load can be supplied power without any support of other source of power. So, the EV in the similar process is referred to as being in V2X. The V2X process is shown on the Figure 13.

4. Microgrid Power Flow Analysis

In order to understand and correctly analyze the power flow in the micro-grid, the following points have to be considered:
1.
P G is the grid power, it can flow in both directions inside the micro-grid. This means that P G is negative when it flows to the grid and P G is positive when it flows from the grid to the EVs or load.
2.
P E V is the EV power, it can flow in both directions inside the microgrid. This means that P E V is negative when the EV batteries are charging, and positive when the EV batteries are sending power back to the grid, to the load or to other charging EVs.
3.
P P V is the PV power, and this power is always positive and unidirectional as it gives away power either to the grid or to EVs.
4.
P x is the load power, the DC bus supplies some other DC loads.
To make a distinction, the power to the charging EV is negative and represented as P E V , while the discharging power from EVs is positive and represented as P E V . Considering a given number of EV on the grid, as illustrated in the Figure 1, they can either be charging, discharging or both. In this case, in order to have a completed view of the power flow, various scenarios shall be analyzed. The complete power flow is shown in Equation (4).
P G = P P V i = 0 i = n ψ P E V i + i = ψ + 1 i = n P E V i + P x

4.1. All EV Are Charging on the Grid

In this case, the following conditions are in place:
1.
The solar power P P V = 0 , this implies that there is no solar power contribution.
2.
There are no EVs sending power to the grid; all EVs are charging P E V = 0 .
3.
There is no power consumed by any other load.
Therefore, the power flow is represented by the expression in Equation (5).
P G = i = 0 i = n P E V i
The total power drawn from the grid is completely consumed by the EVs.

4.2. All EVs Are Charging on the Grid with PV Power Injection

In this case, the following conditions are in place:
1.
The solar power P P V > 0 ; this implies that there is a solar power contribution to the grid.
2.
There are EVs sending power to the grid; all EVs are charging P E V = 0 .
3.
There is no power consumed by any other load.
Therefore, the power flow is represented by the expression in Equation (6).
P G =   P P V i = 0 i = n P E V i P G   P P V = i = 0 i = n P E V i
The total demand required by the EVs is totally supported by the PV power, and the rest is compensated by the grid. The grid compensation is also illustrated in Equation (6).

4.3. Simultaneous EVs Charging and Discharging on the Grid without PV Power Injection

In this case, the following conditions are in place:
1.
The solar power P P V = 0 , this implies that there is no solar power contribution to the grid.
2.
Some EVs are sending power to the grid ( P E V > 0 ), while others are getting power from the grid or charging ( P E V > 0 ).
3.
There is no power consumed by any other load.
Therefore, the power flow is represented by the expression in Equation (7).
P G = i = 0 i = n ψ P E V i + i = ψ + 1 i = n P E V i P G i = ψ + 1 i = n P E V i = i = 0 i = n ψ P E V i
The total demand required by the charging EVs is totally supported by the discharging EV, and the rest is compensated by the grid. The grid compensation is also illustrated in Equation (7).

4.4. Simultaneous EVs Charging and Discharging on the Grid with the PV Power Injection

In this case, the following conditions are in place:
1.
The solar power P P V > 0 ; this implies that there is solar power contribution to the grid.
2.
Some EVs are sending power to the grid ( P E V > 0 ), while others are getting power from the grid or charging ( P E V > 0 ).
3.
There is no power consumed by any other load.
P G = i = 0 i = n ψ P E V i + i = ψ + 1 i = n P E V i + P P V P G i = ψ + 1 i = n P E V i P P V = i = 0 i = n ψ P E V i
The total demand required by the charging EVs is completely supported by the discharging EV and the PV power, and the rest is compensated by the grid. The grid compensation is also illustrated in Equation (8). If the combination of discharging EVs’ power and the PV power is greater than the total demand, then the surplus is sent to the grid. In that case, the grid power is negative, as the grid is receiving.

5. Simulations and Results

Following Figure 1, the model is built in Simulink for the purpose of assessing the behavior of the grid as described by the expression in Equation (4). Additionally, the same model shall be used to validate the G2V, V2G, V2X and PV power system integration to the grid. Table 1 illustrates the Simulink model parameters used.

5.1. Simulink Model and Simulations

The model mimicking the Figure 1 was built in Simulink. The model starts from the AC bus and includes the PV power system contribution. Bearing in mind the mentioned part will help to assess the behavior of the grid during the random charging and discharging of the EVs. Therefore, the model is made of a 0.4 kV voltage source, a 480 kVA AC-DC converter, 653.2 V DC link, 5 off-board chargers of 40 kW each, a 26.7 kW resistive load (for EBs and EMBs) and 5 EVs of 400 V dc and 100 A max battery each. Each off-board charger is connected to the DC link, whose capacitor is 5 m F . The off-board charger inductor, referred to as L b a t t in Figure 5, is of 5.76 mH, and the battery capacitor of 5.6 n F . The lithium-iron battery model from Simulink is used as EV battery. The off-board chargers are connected in parallel to the DC link and 5 EVs are connected to the chargers. The EVs are named EV0 up to EV5, with the respective SOC as in Table 2.
Initially, all of the EVs are in V2G mode (discharging to the grid), and the DC load is disconnected. The last process is indicated in Table 2 as Mode 1. As indicated in the same table, the sequence of switching is shown to change from Mode 1 to Mode 2 of the presented EVs. However, in Mode 2, the DC load and EV0 were left out as they don’t change the mode, i.e., there are not any EB or EMB charging and EV0 continues discharging. The rest of the EVs switch to G2V (charging from the grid) in Mode 2. The switching algorithm and sequence from Mode 1 to Mode 2 and vice-versa, together with the charging and discharging controls, are illustrated in Figure 6 and in Table 2. The off-board charger cut-off voltage is 433 V DC, while the cut-off current is ± 100   A .

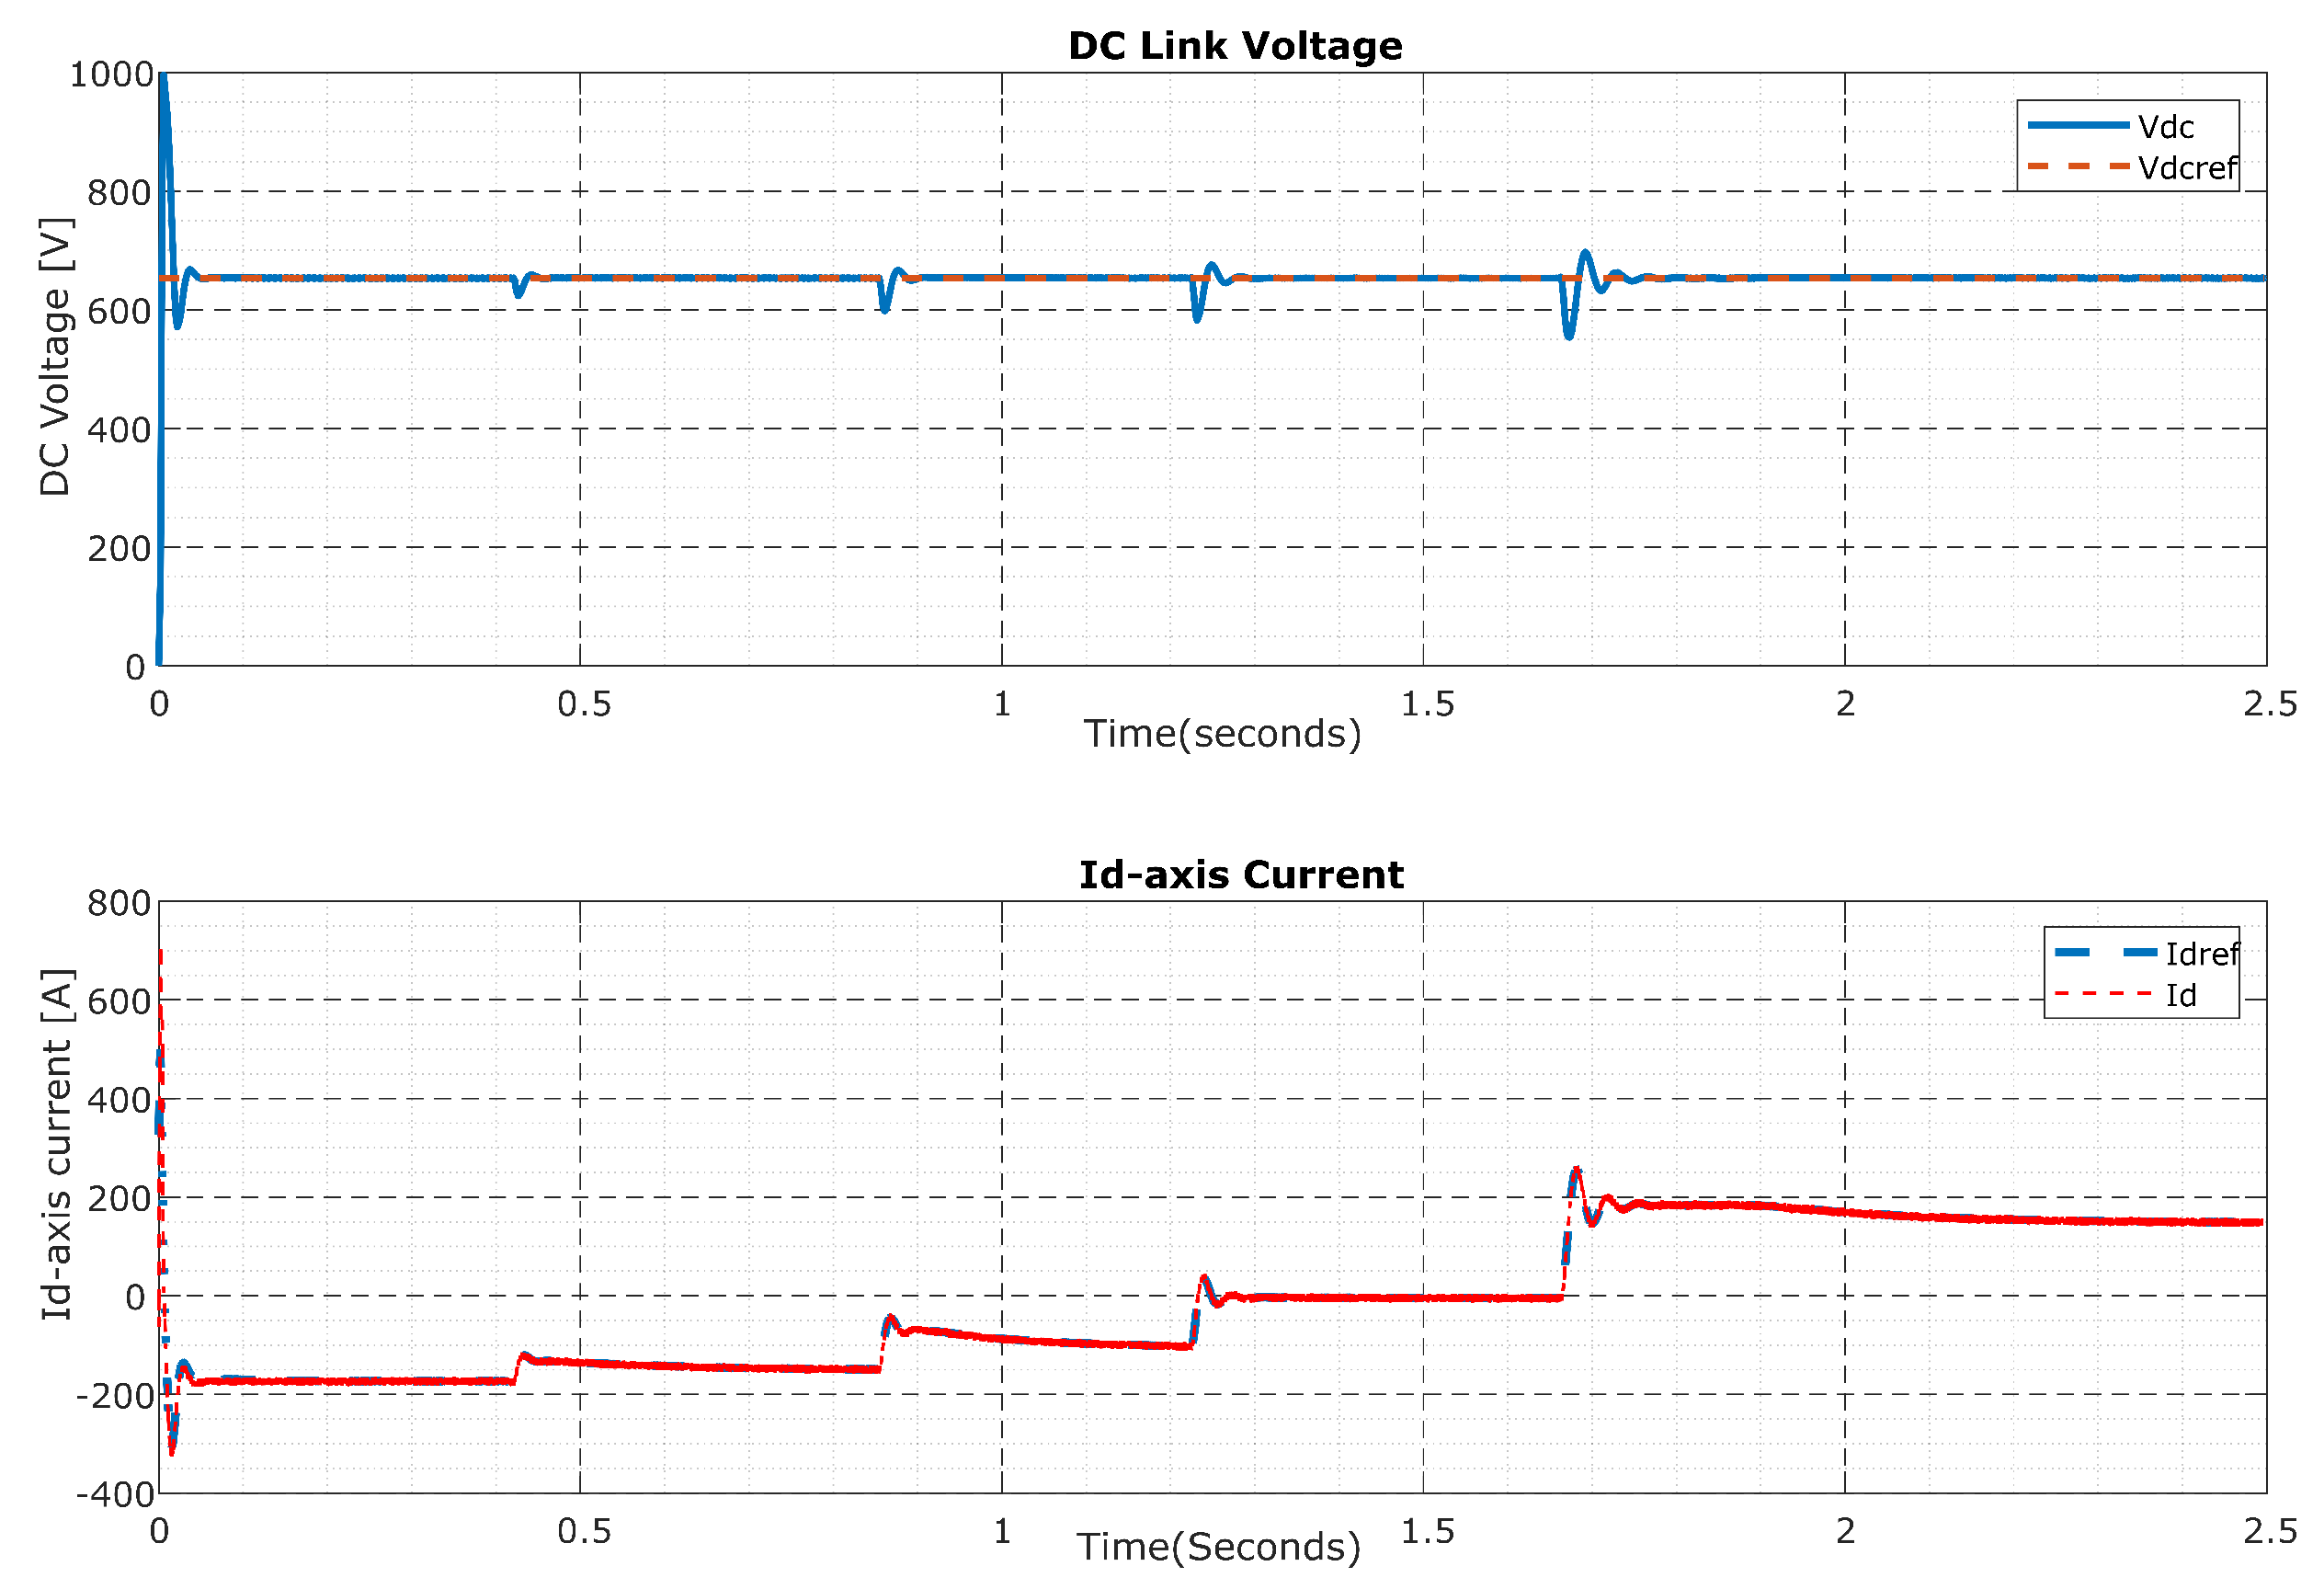
5.2. Simulation Results without Solar Integration

The simulation was run in Simulink for 2.5 s, with a focus on: battery charging and discharging modes (CC and CV), DC-link voltage control and the control of I d and I q -axis current, V2G and G2V as well as the complete power profile of the grid to show the grid behavior.
The Figure 14 demonstrates the CC and CV modes of battery charging and discharging. The EV2 is shown in both Mode 1 and 2, illustrates the fact that the charging current is constant before the voltage reaches the cut-off, after cut-off voltage is constant and current starts decreasing and vice-versa.
Figure 15 and Figure 16 display the behavior of different batteries in both Mode 1 and 2, respective to their Mode change sequence. In the charging of the EV batteries, the voltage increases and the current is negative. When discharging, the voltage decreases and current is positive. In the same figures, the charging and discharging controls are indicated and they respond appropriately.
The stabilization of the DC link was mentioned in this work. It was achieved through the cascaded control in which the inner loop controls the I d -axis current, while the outer loop regulates the DC link voltage. Figure 17 shows the results of both indicated controls and the tracking is as expected.
The grid voltage and current are presented in Figure 18. During the G2V mode, the current and voltage are in phase, and they are 180 out-of-phase in V2G. There is no power supply from the grid when the supply from some EVs in V2G can fulfill the demand of the EVs in G2V and the DC load (charging the EBs and EMBs). In this case, the power from the grid is zero and Vehicle-to-Vehicle (V2V) or Vehicle-to-Load (V2X) as new modes of operation are produced.
The complete active power profile is illustrated in Figure 19. The negative active power from 0 to 1.2 s shows the V2G mode, i.e., the EVs feed the power back to the grid and supply the DC load. The zero active power (from 1.2 to 1.7 s) means that the power from some EVs (in V2G) is enough to sustain the rest of the EVs (in G2V) and the DC load. Hence, there is neither demand from the grid nor the power back to the grid. From 1.7 to 2.5 s, the grid active power is positive. It indicates that the power from some EVs (in V2G) is not enough to sustain the demand from the rest of the EVs (in G2V) and the load. The grid intervention is necessary and it illustrates the G2V mode together with some auxiliary modes: V2V, V2X and G2X.

5.3. Simulation Results with Solar Integration

The Simulink model in this case is built following the Figure 1 and Figure 2, and the solar contribution is considered. The grid and EVs parameters are kept unchanged as before, with the additional contribution of the solar power system. The irradiance rises up to a maximum value of 1 k W m 2 at an average ambient temperature of 25 C . Irradiance and weather temperature are the main input parameters to the PV array, in order for it to generate power. In addition, the solar power generated depends on the PV array structure and parameters.

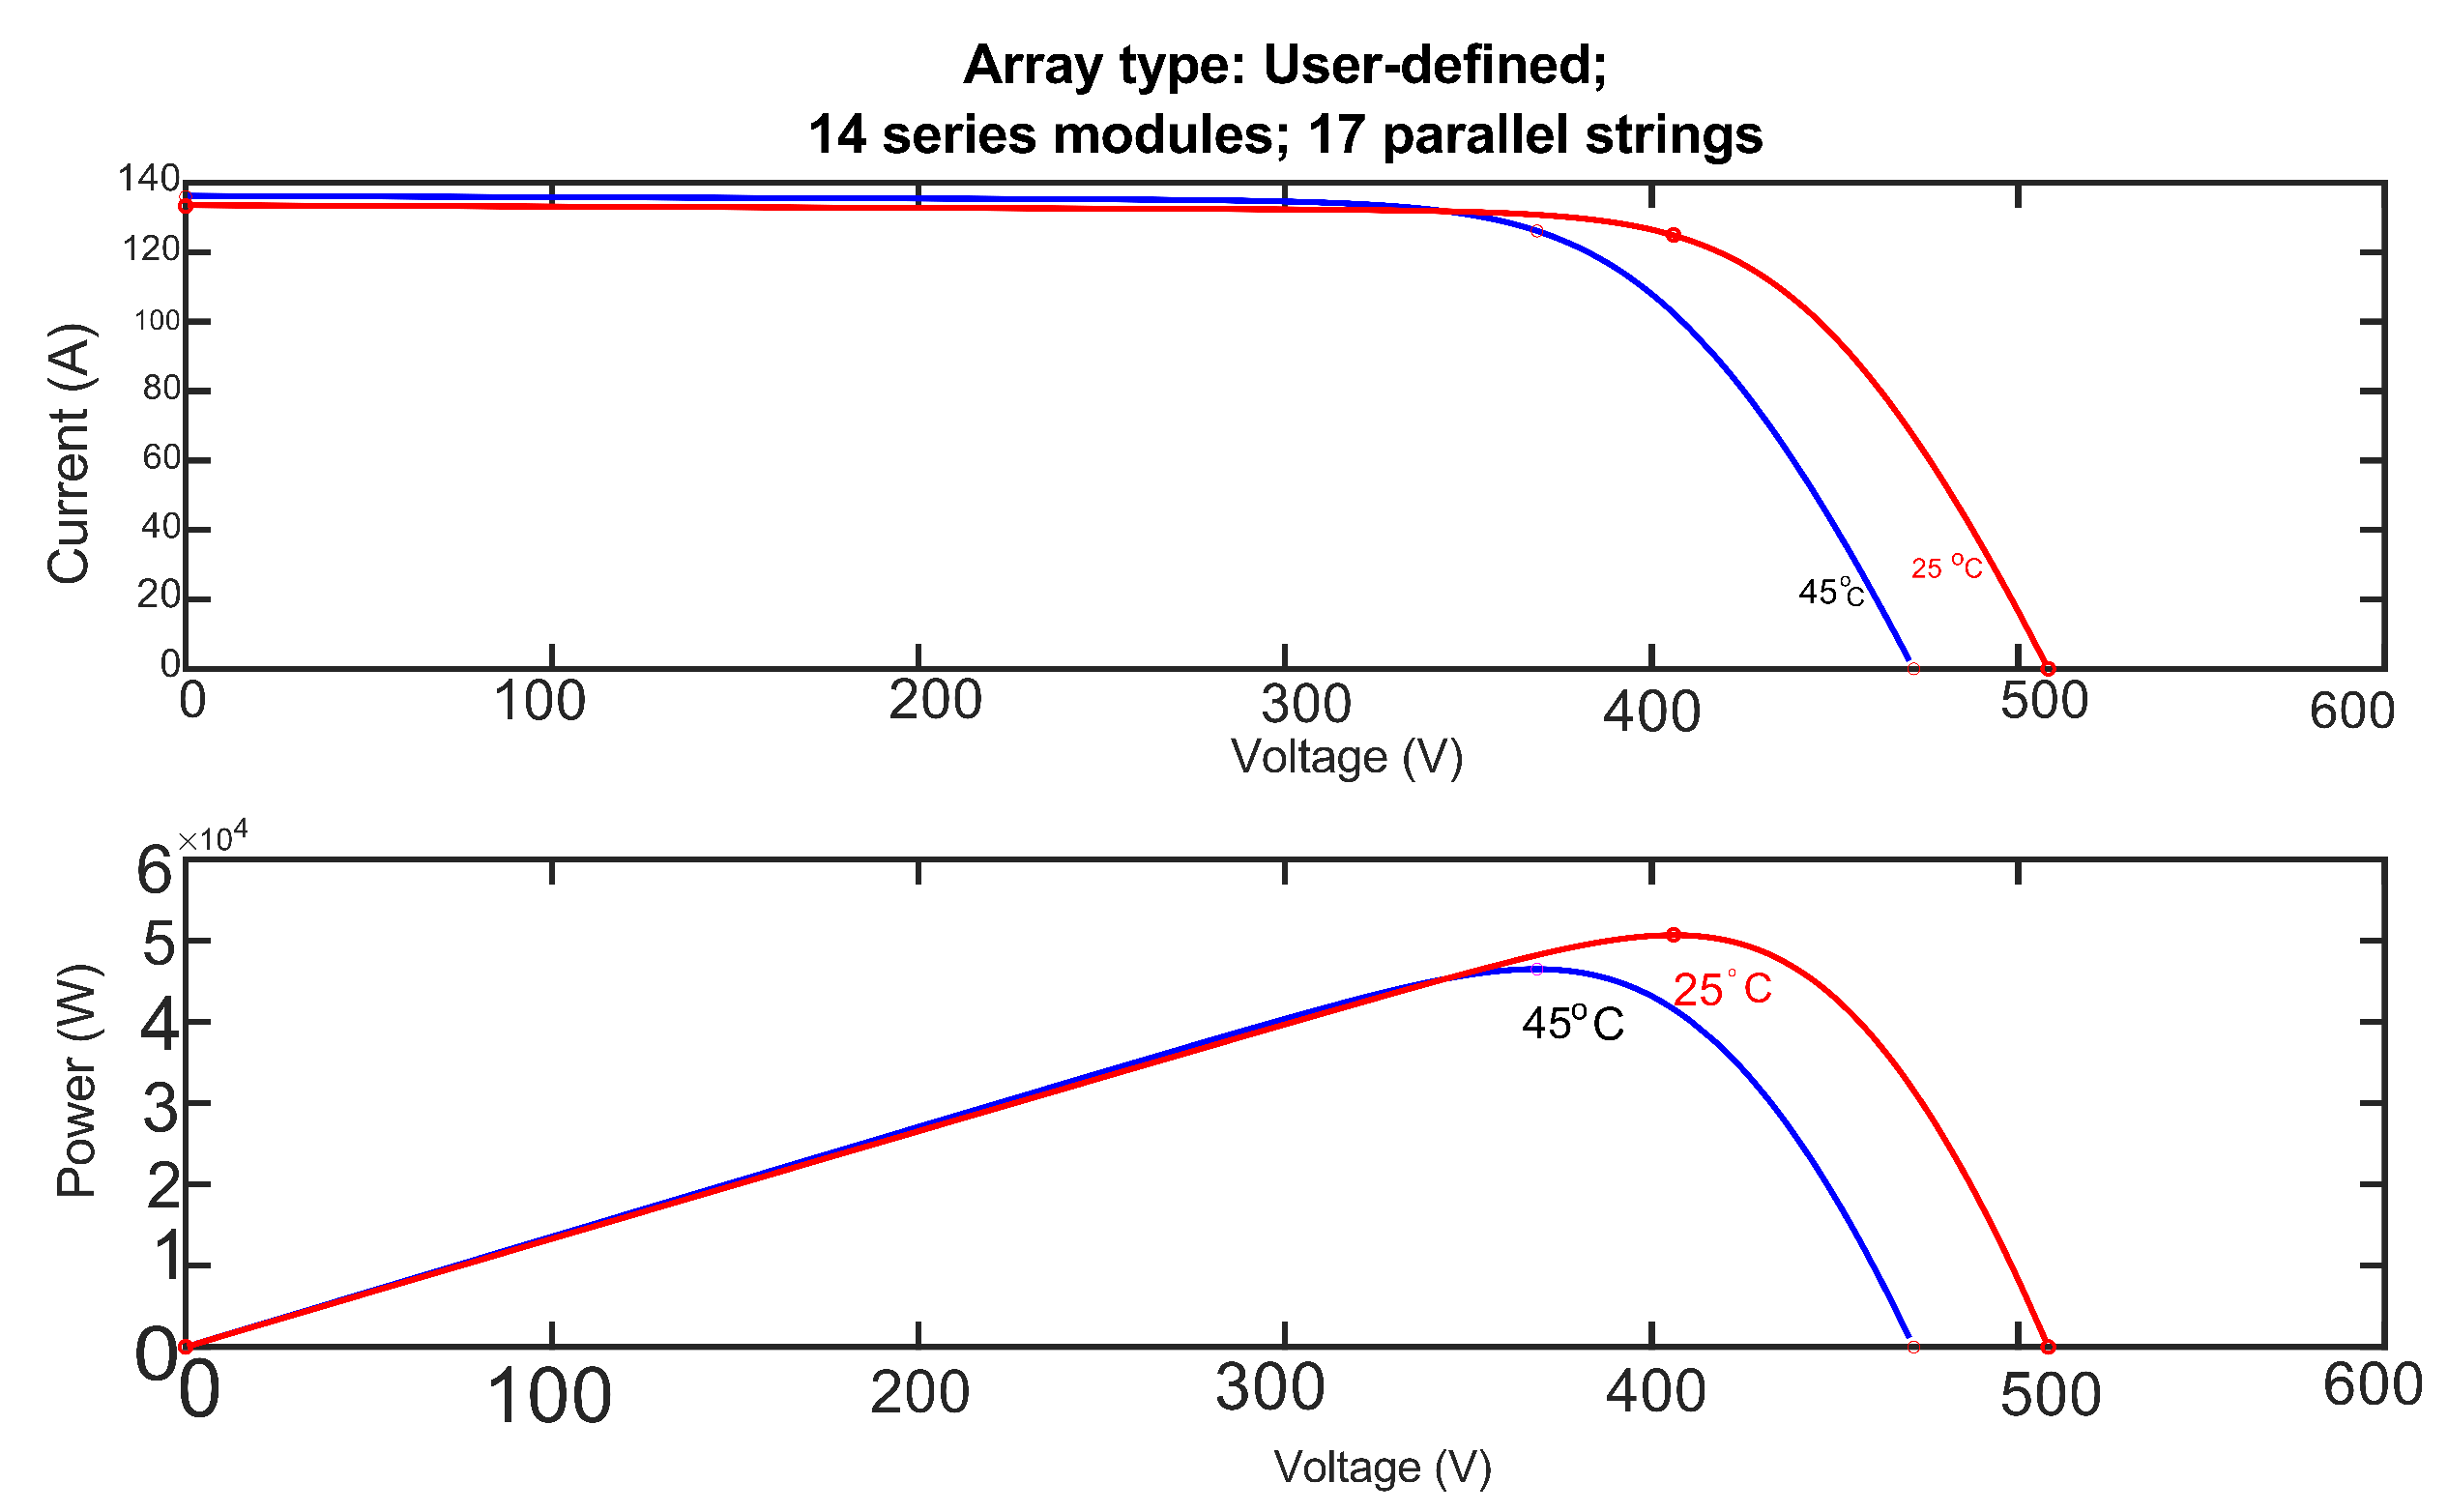
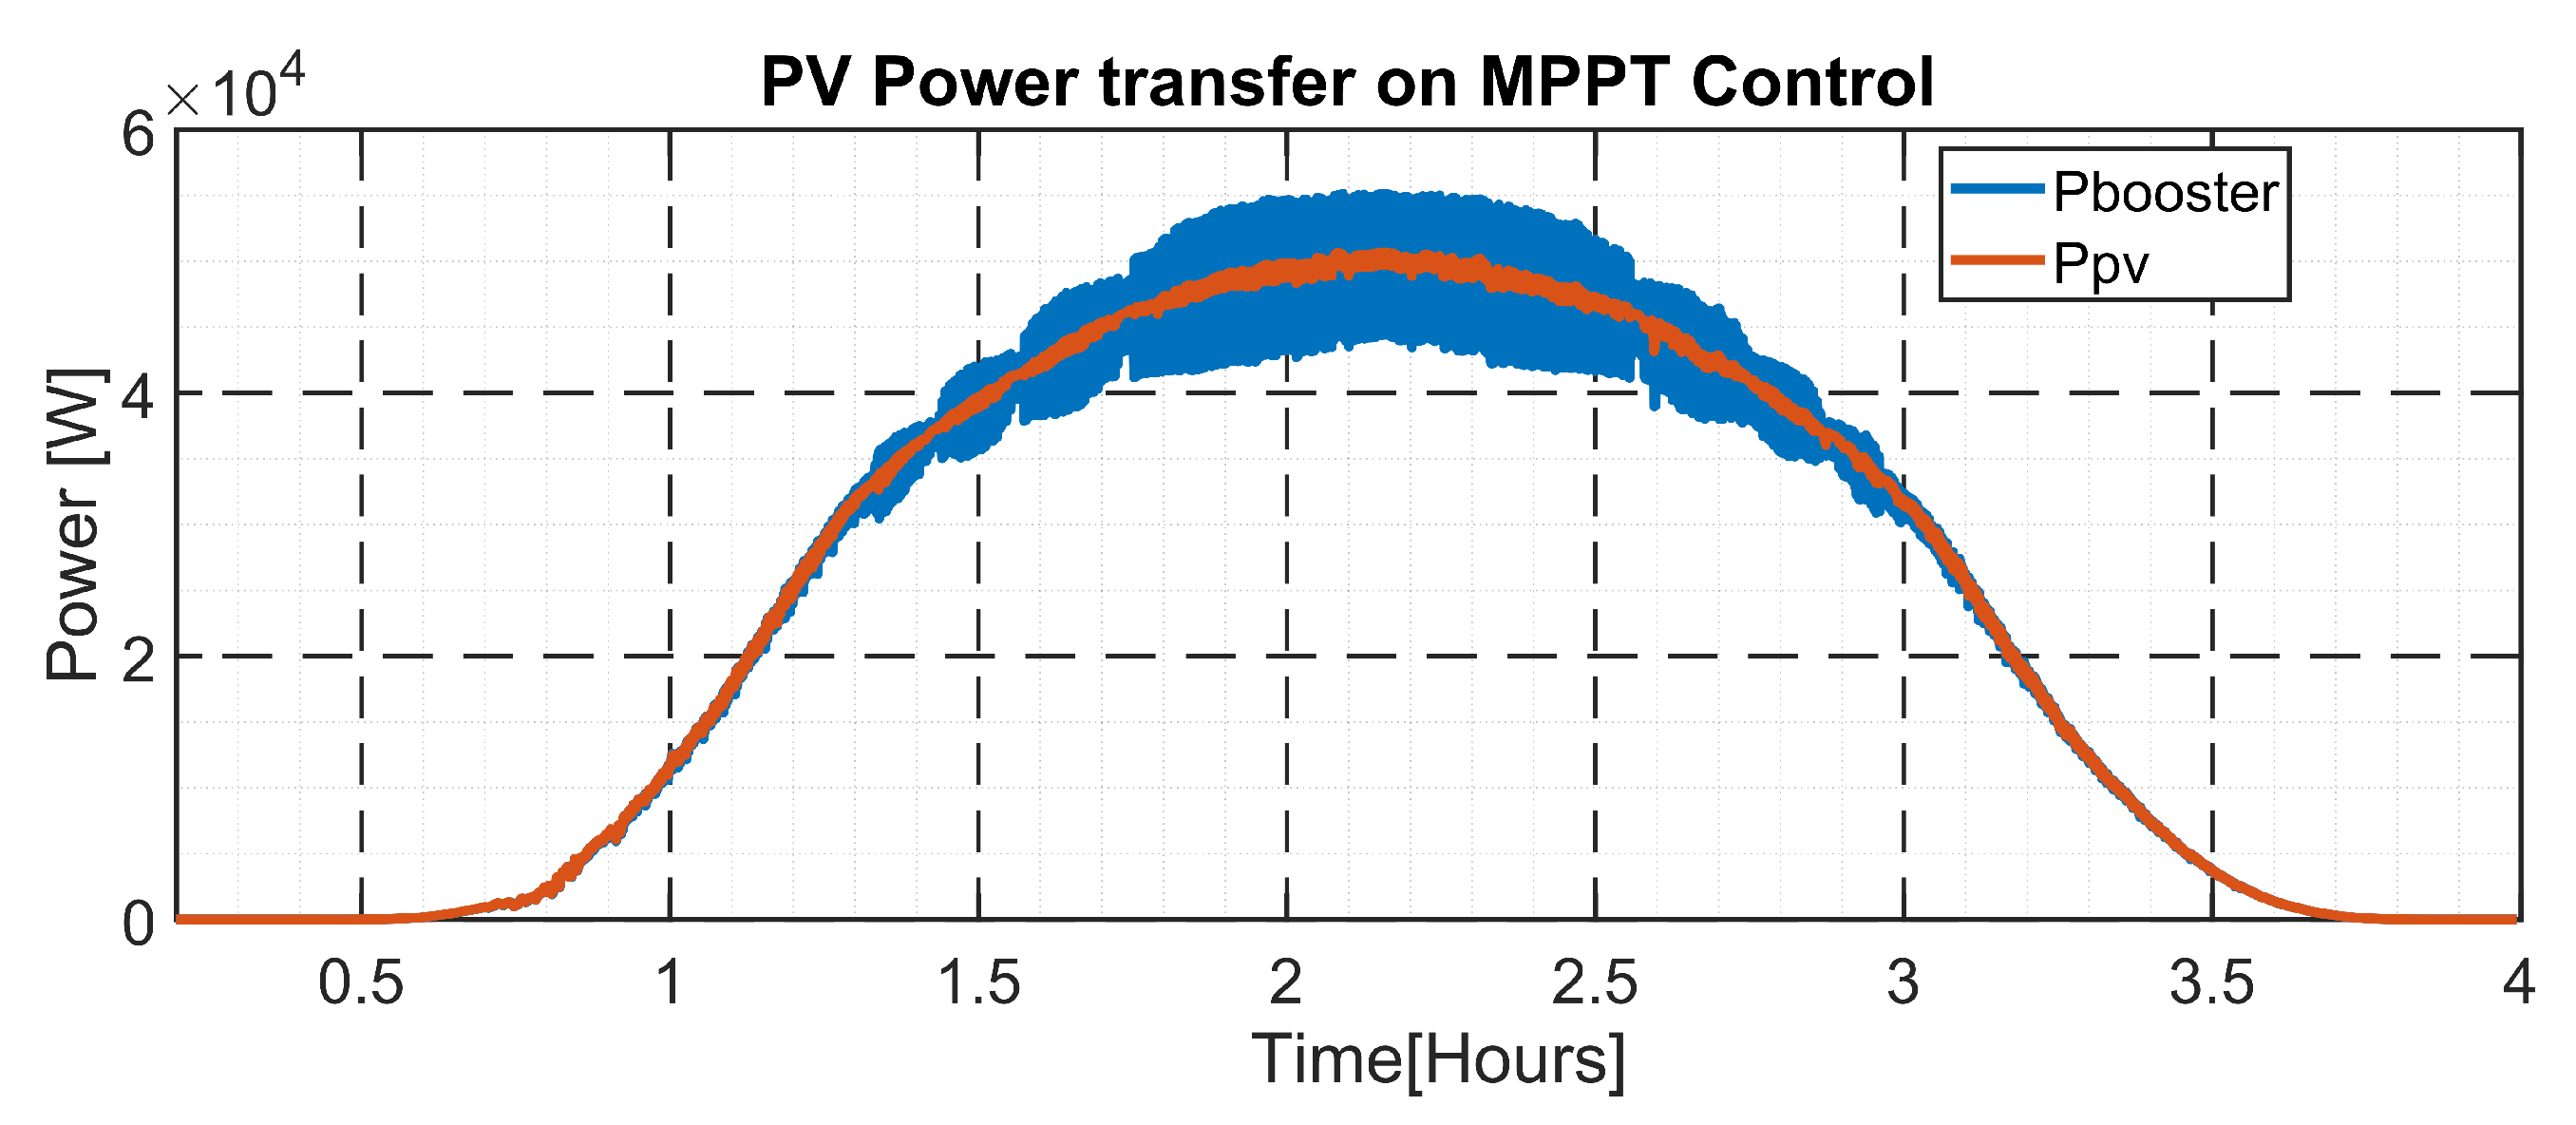
5.3.1. PV Array Structure

The PV array was arbitrarily defined in Simulink. It is a user-defined array type of 14 series-connected modules per string and 17 parallel strings. It is made of strings whose modules’ parameters are detailed in the Table 3.
The I-V and P-V characteristics of the PV array are illustrated on Figure 20. As the weather temperature is expected to remain constant during the complete study time, then the Figure 20 indicates the possible maximum power parameters to be tracked. For the sake of study, the weather temperature is assumed to remain constant (25 C ), during the complete period of the study (4 h). In the same range of time, the irradance varies as detailed on the Figure 21. From the last figure, the irradiance hits its maximum level after two hours. That is the time of maximum energy harvesting. Later on, the irradiance starts decreasing towards zero. The PV array power is directly proportional to the irradiance. Therefore, the power profile will sure track the irradiance profile on Figure 21.

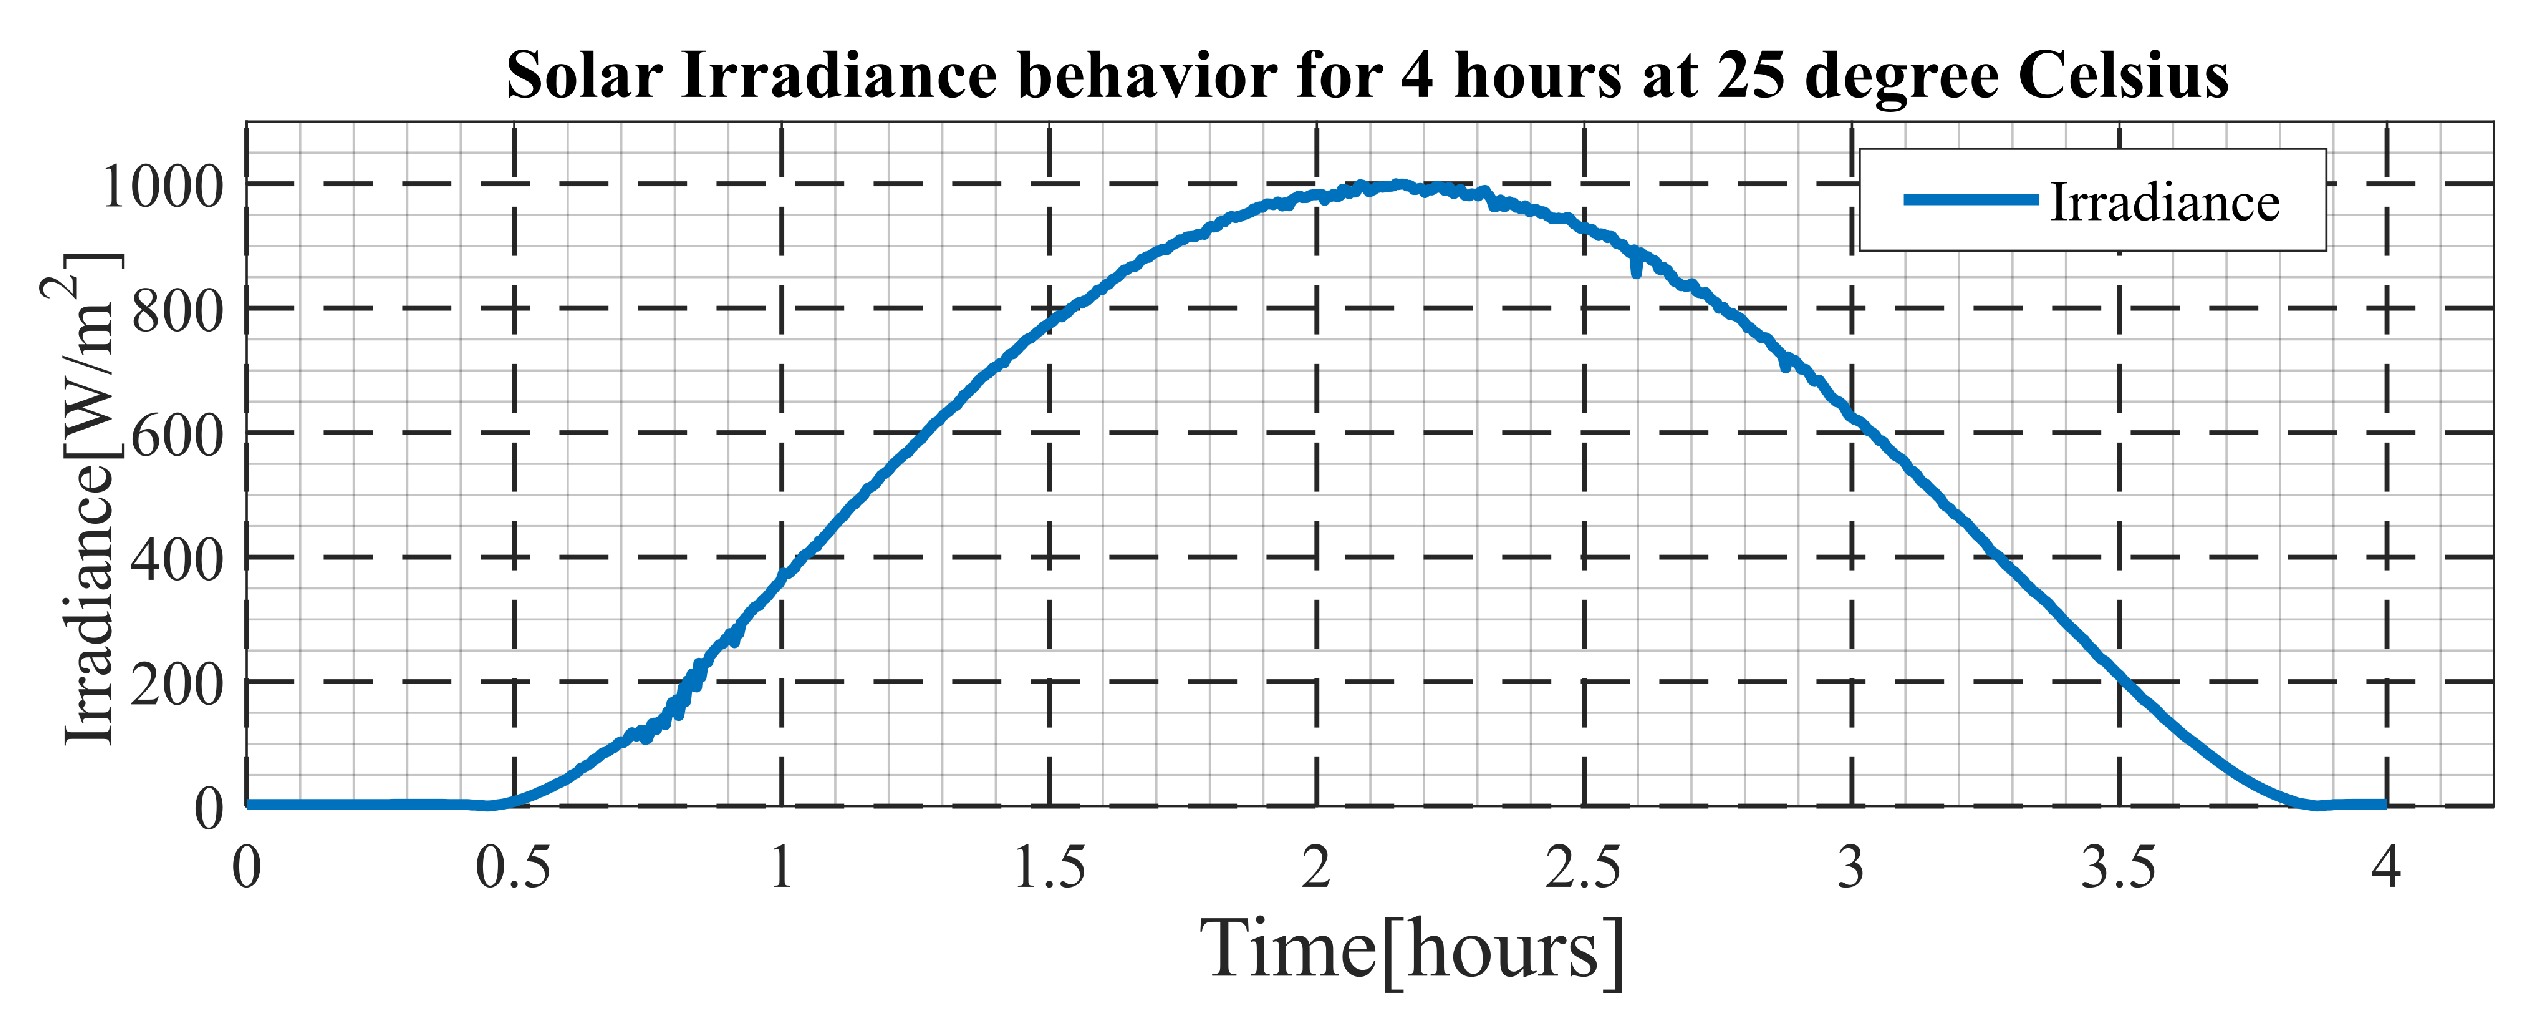
5.3.2. Solar Power Profile

The power generated from the solar PV array is sent to the grid through energy conversion process illustrated in Figure 8. The voltage level at the output of the PV array is smaller as compared to the DC link-required voltage level. Therefore, the booster is used to provide the necessary voltage level from the PV array generated level. The PV array structure and power capacity are defined in Figure 20. The power harvesting and transfer are based on the Maximum Power Point Tracking (MPPT) mechanism. The control is illustrated in Figure 9. The control algorithm applies incremental conductance and its complete structure is shown in Figure 10.
The control algorithm tracks the power transfer as illustrated in the Figure 22. The last confirms the correct performance of the MPPT control.

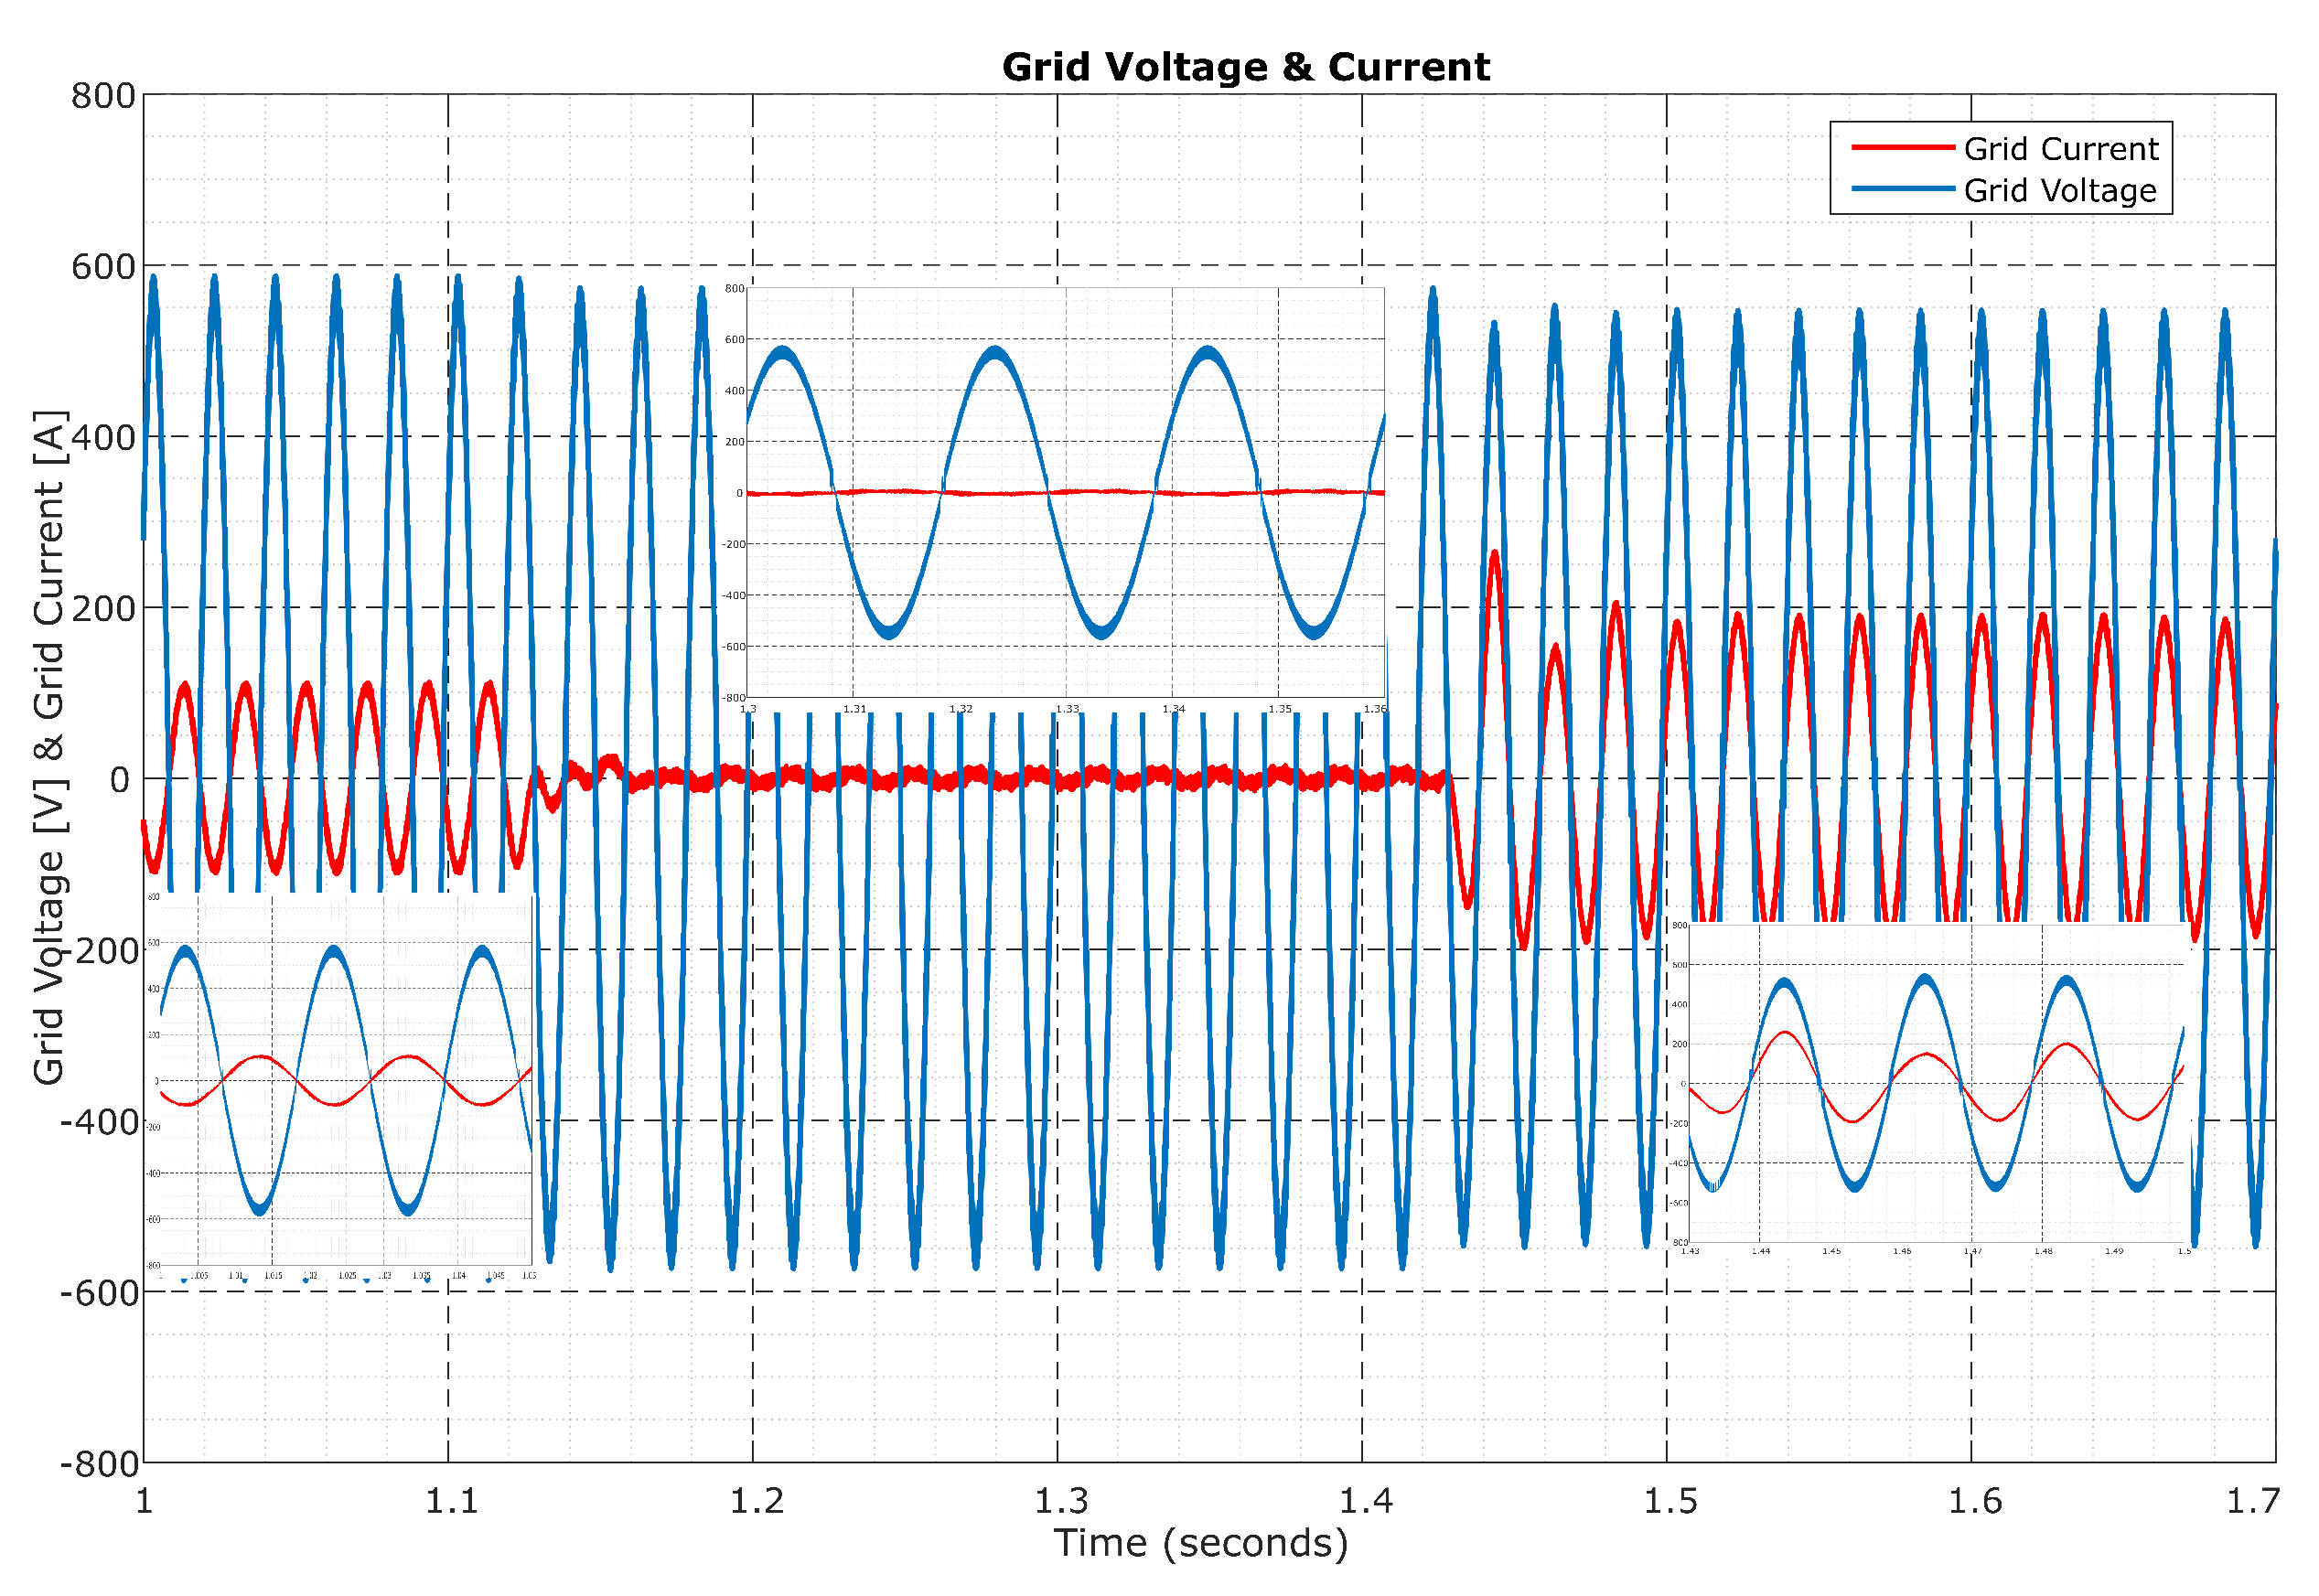
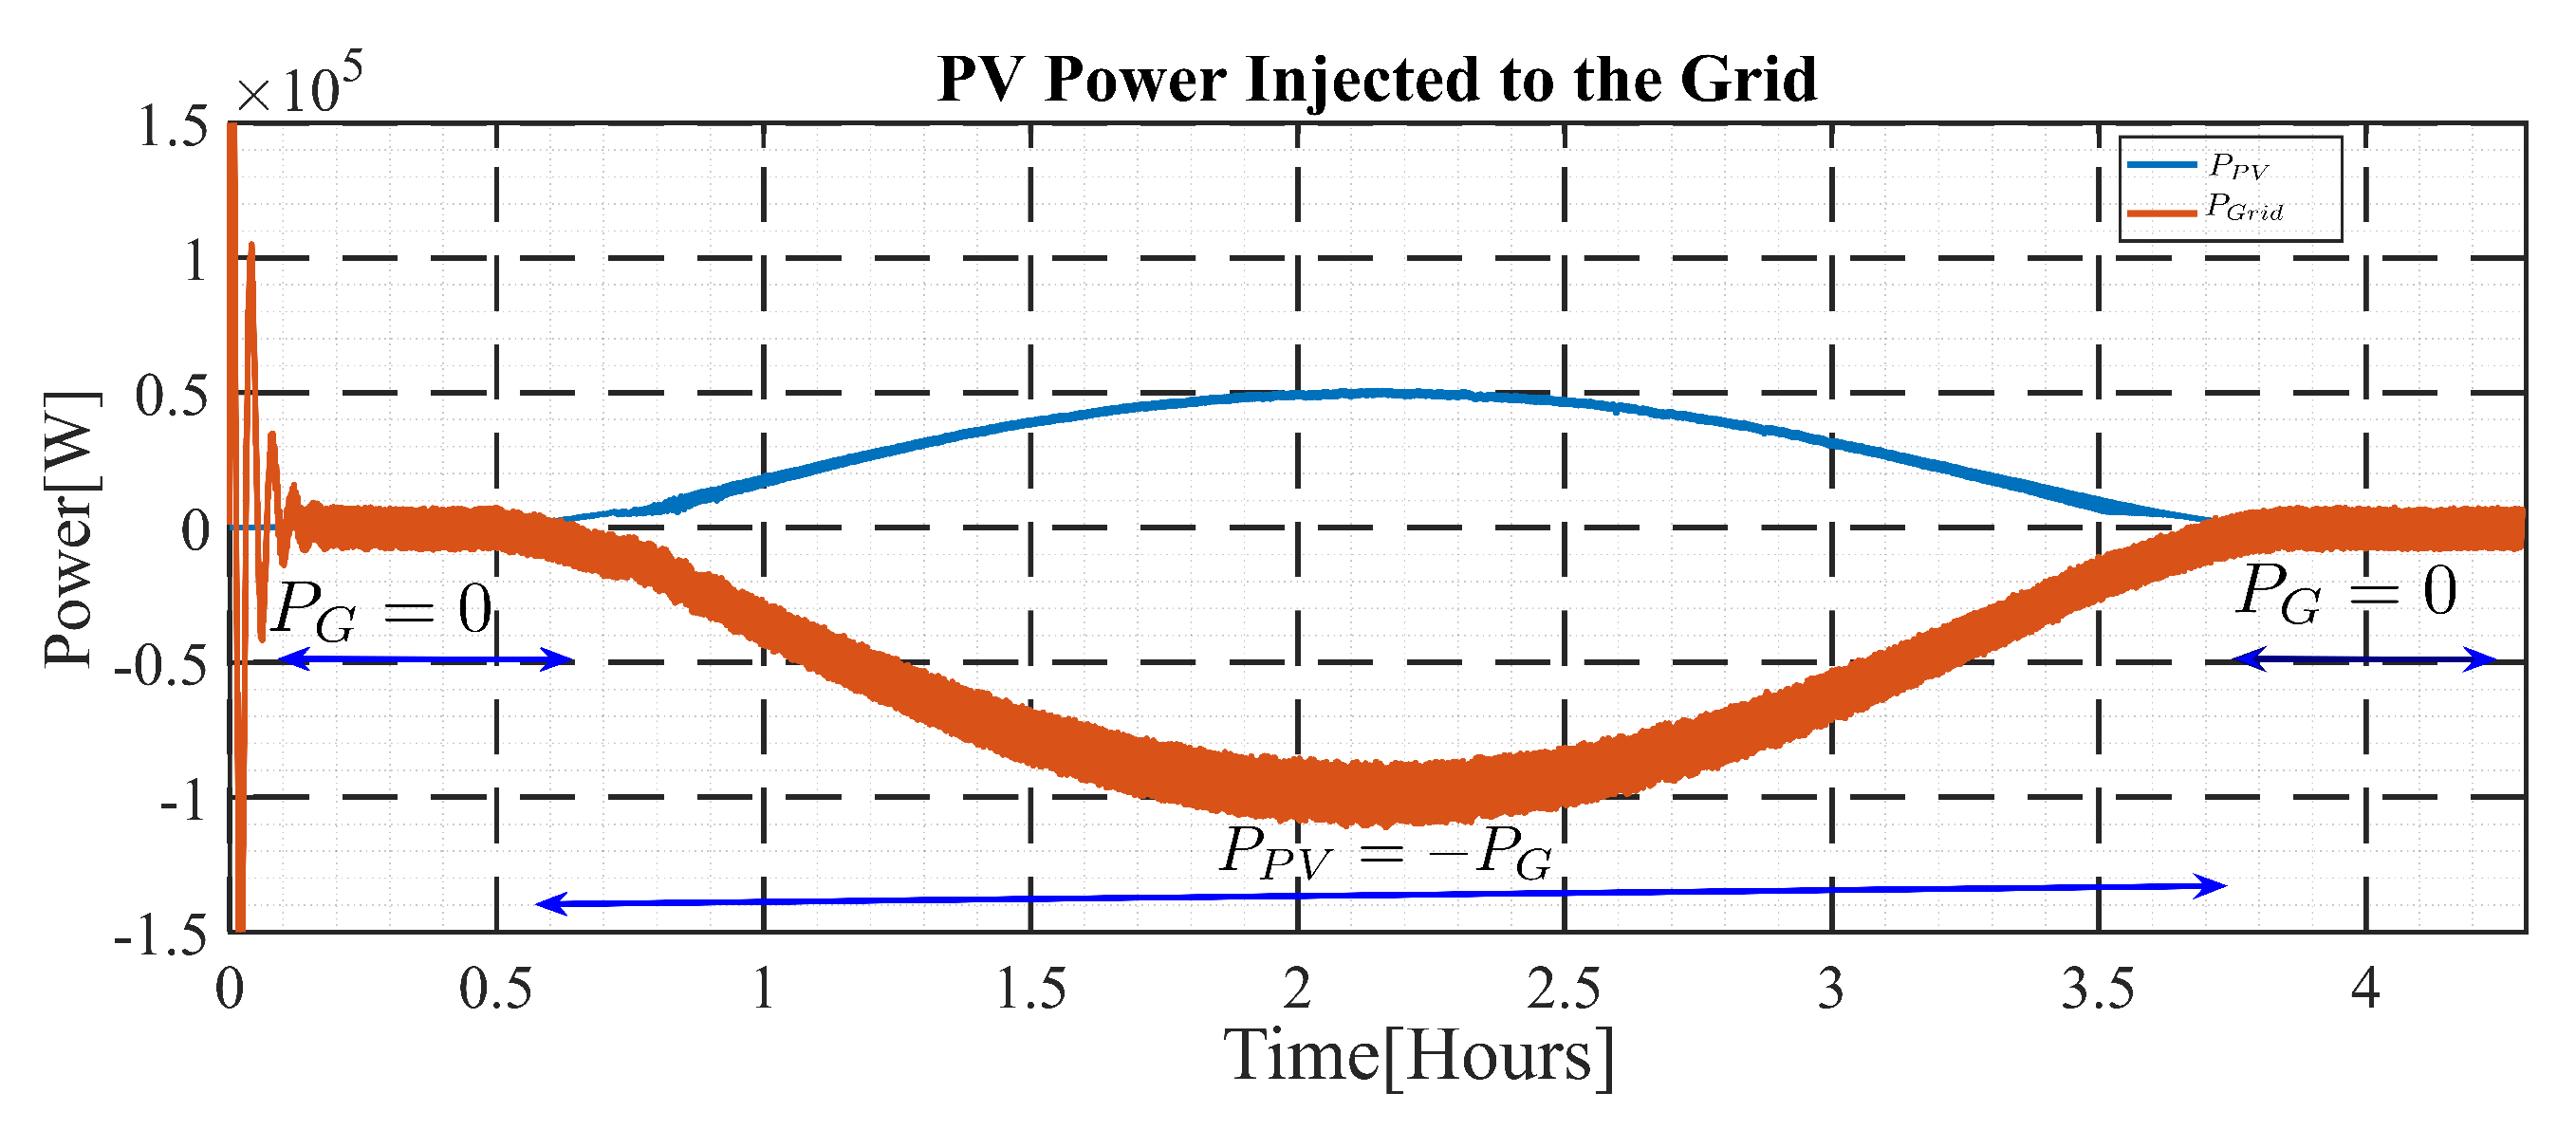
5.3.3. The Grid Behaviors due to Solar Power Injection

In this case, the grid is considered to be at no load, and all of the EVs are not connected to either charge or discharge. The PV power is injected into the grid to assess how it behaves.
In this situation, the grid behavior is illustrated in Figure 23. The last shows, that in the beginning, the solar power is zero. Hence, the grid is on no-load; it is drawing null current. The power in this case is zero too. When the PV array starts injecting power to the grid, the grid current starts increasing, but in 180 out of phase with respect to the grid voltage. The last is an indicator that the grid is receiving power. Therefore, the grid power is negative as shown in the Figure 24.

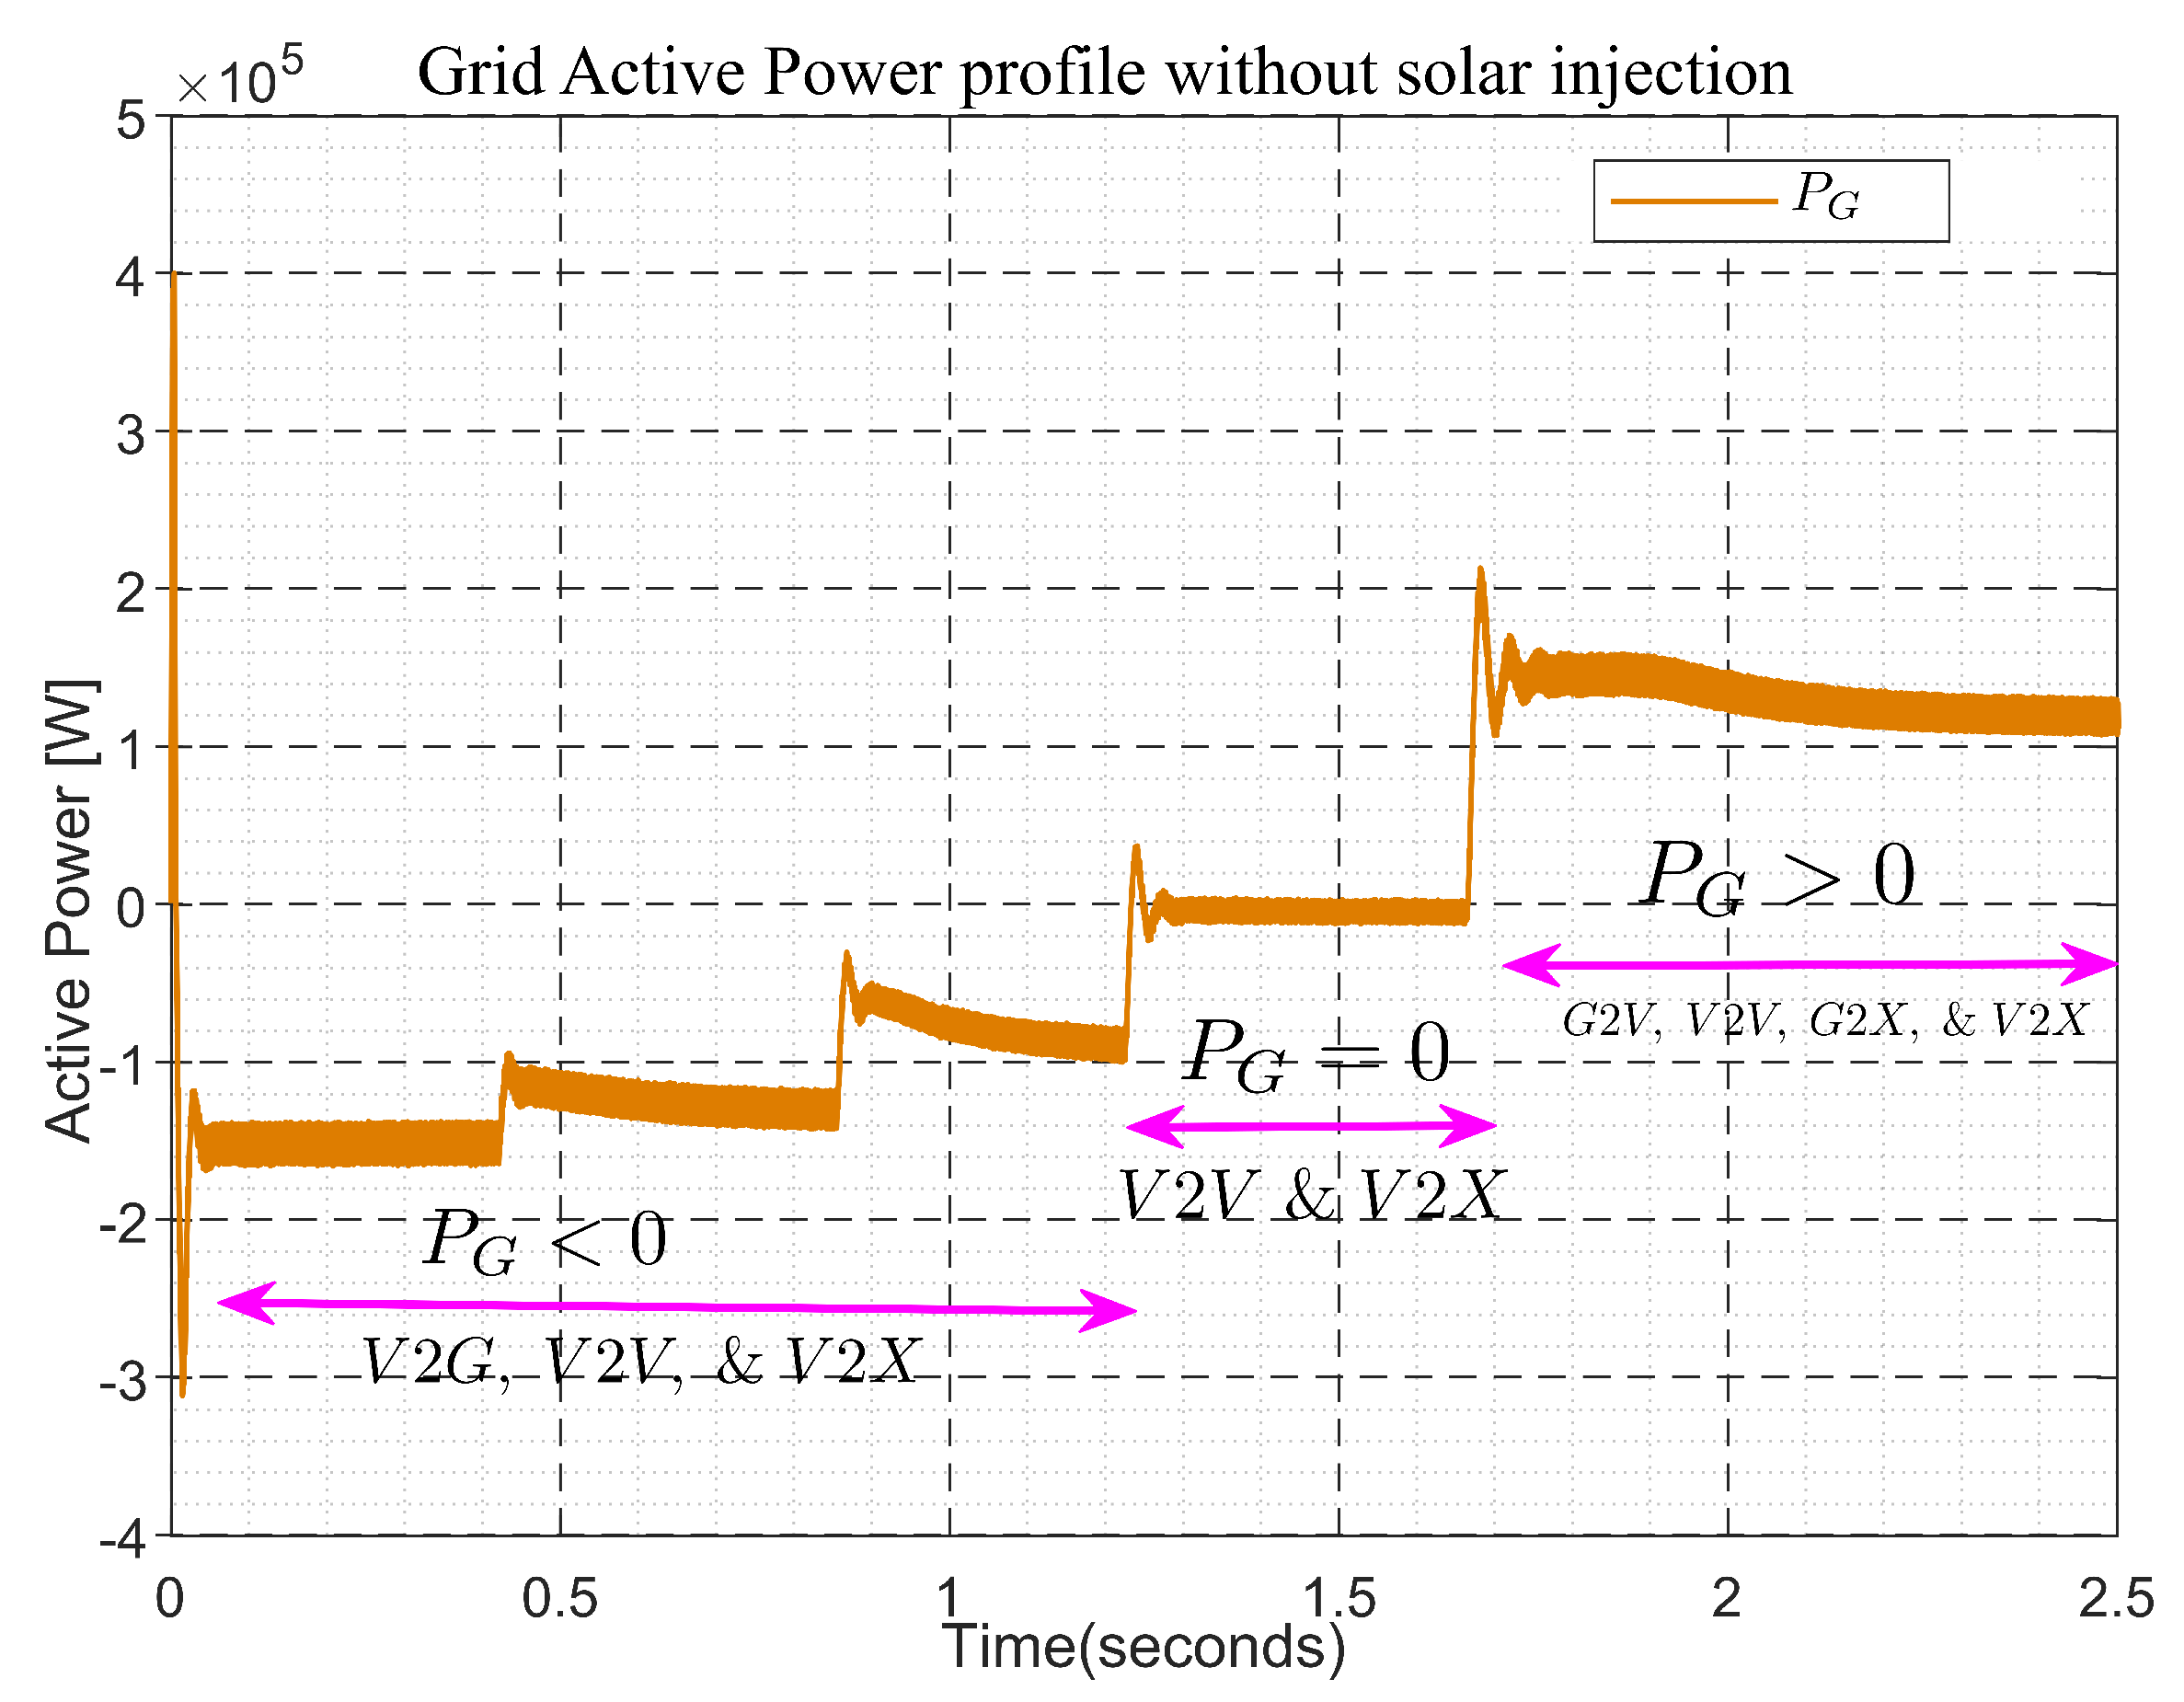
5.3.4. The Grid Profile without EV Integration

Figure 24 shows the grid active power profile when the PV power is injected to the grid at no-load. At the beginning, the PW power P P V = 0 , therefore the grid power P G = 0 too.
When the PV power system starts injecting power into the grid, its power P G < 0 as the grid is receiving. The PV array power P P V > 0 as the PV power system is giving power. This phenomenon results in Equation (9).
P P V = P G

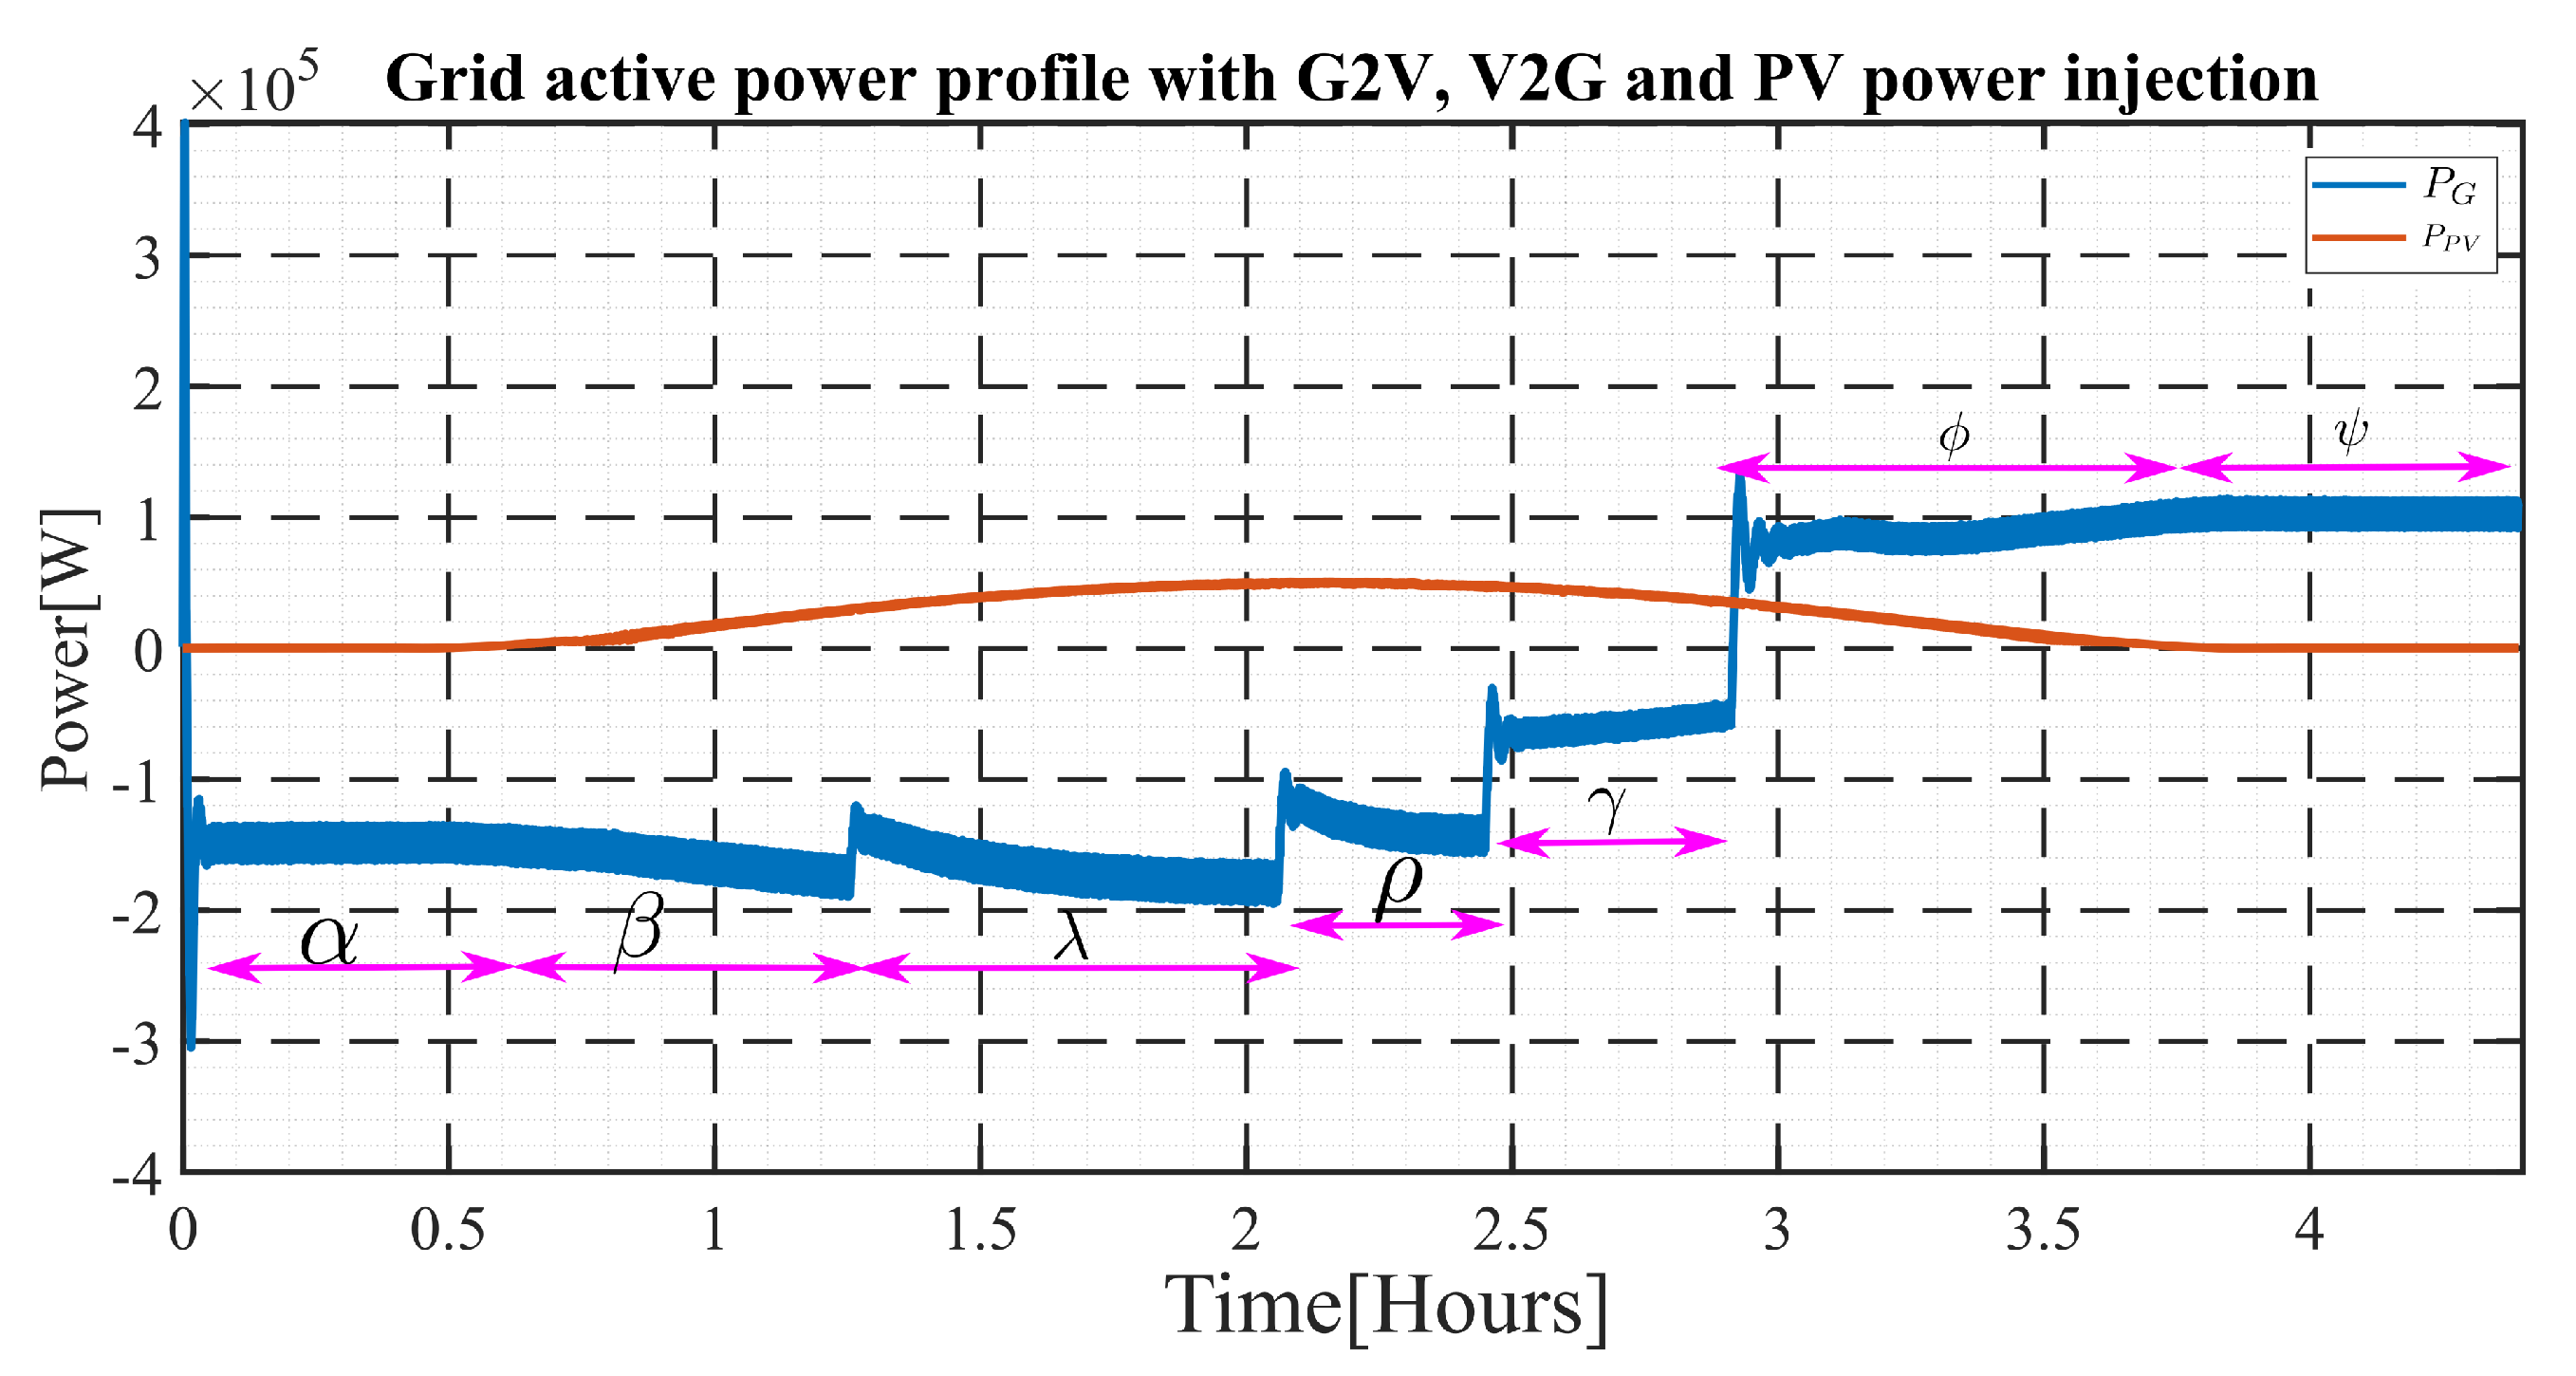
5.3.5. Grid Profile with EV Integration
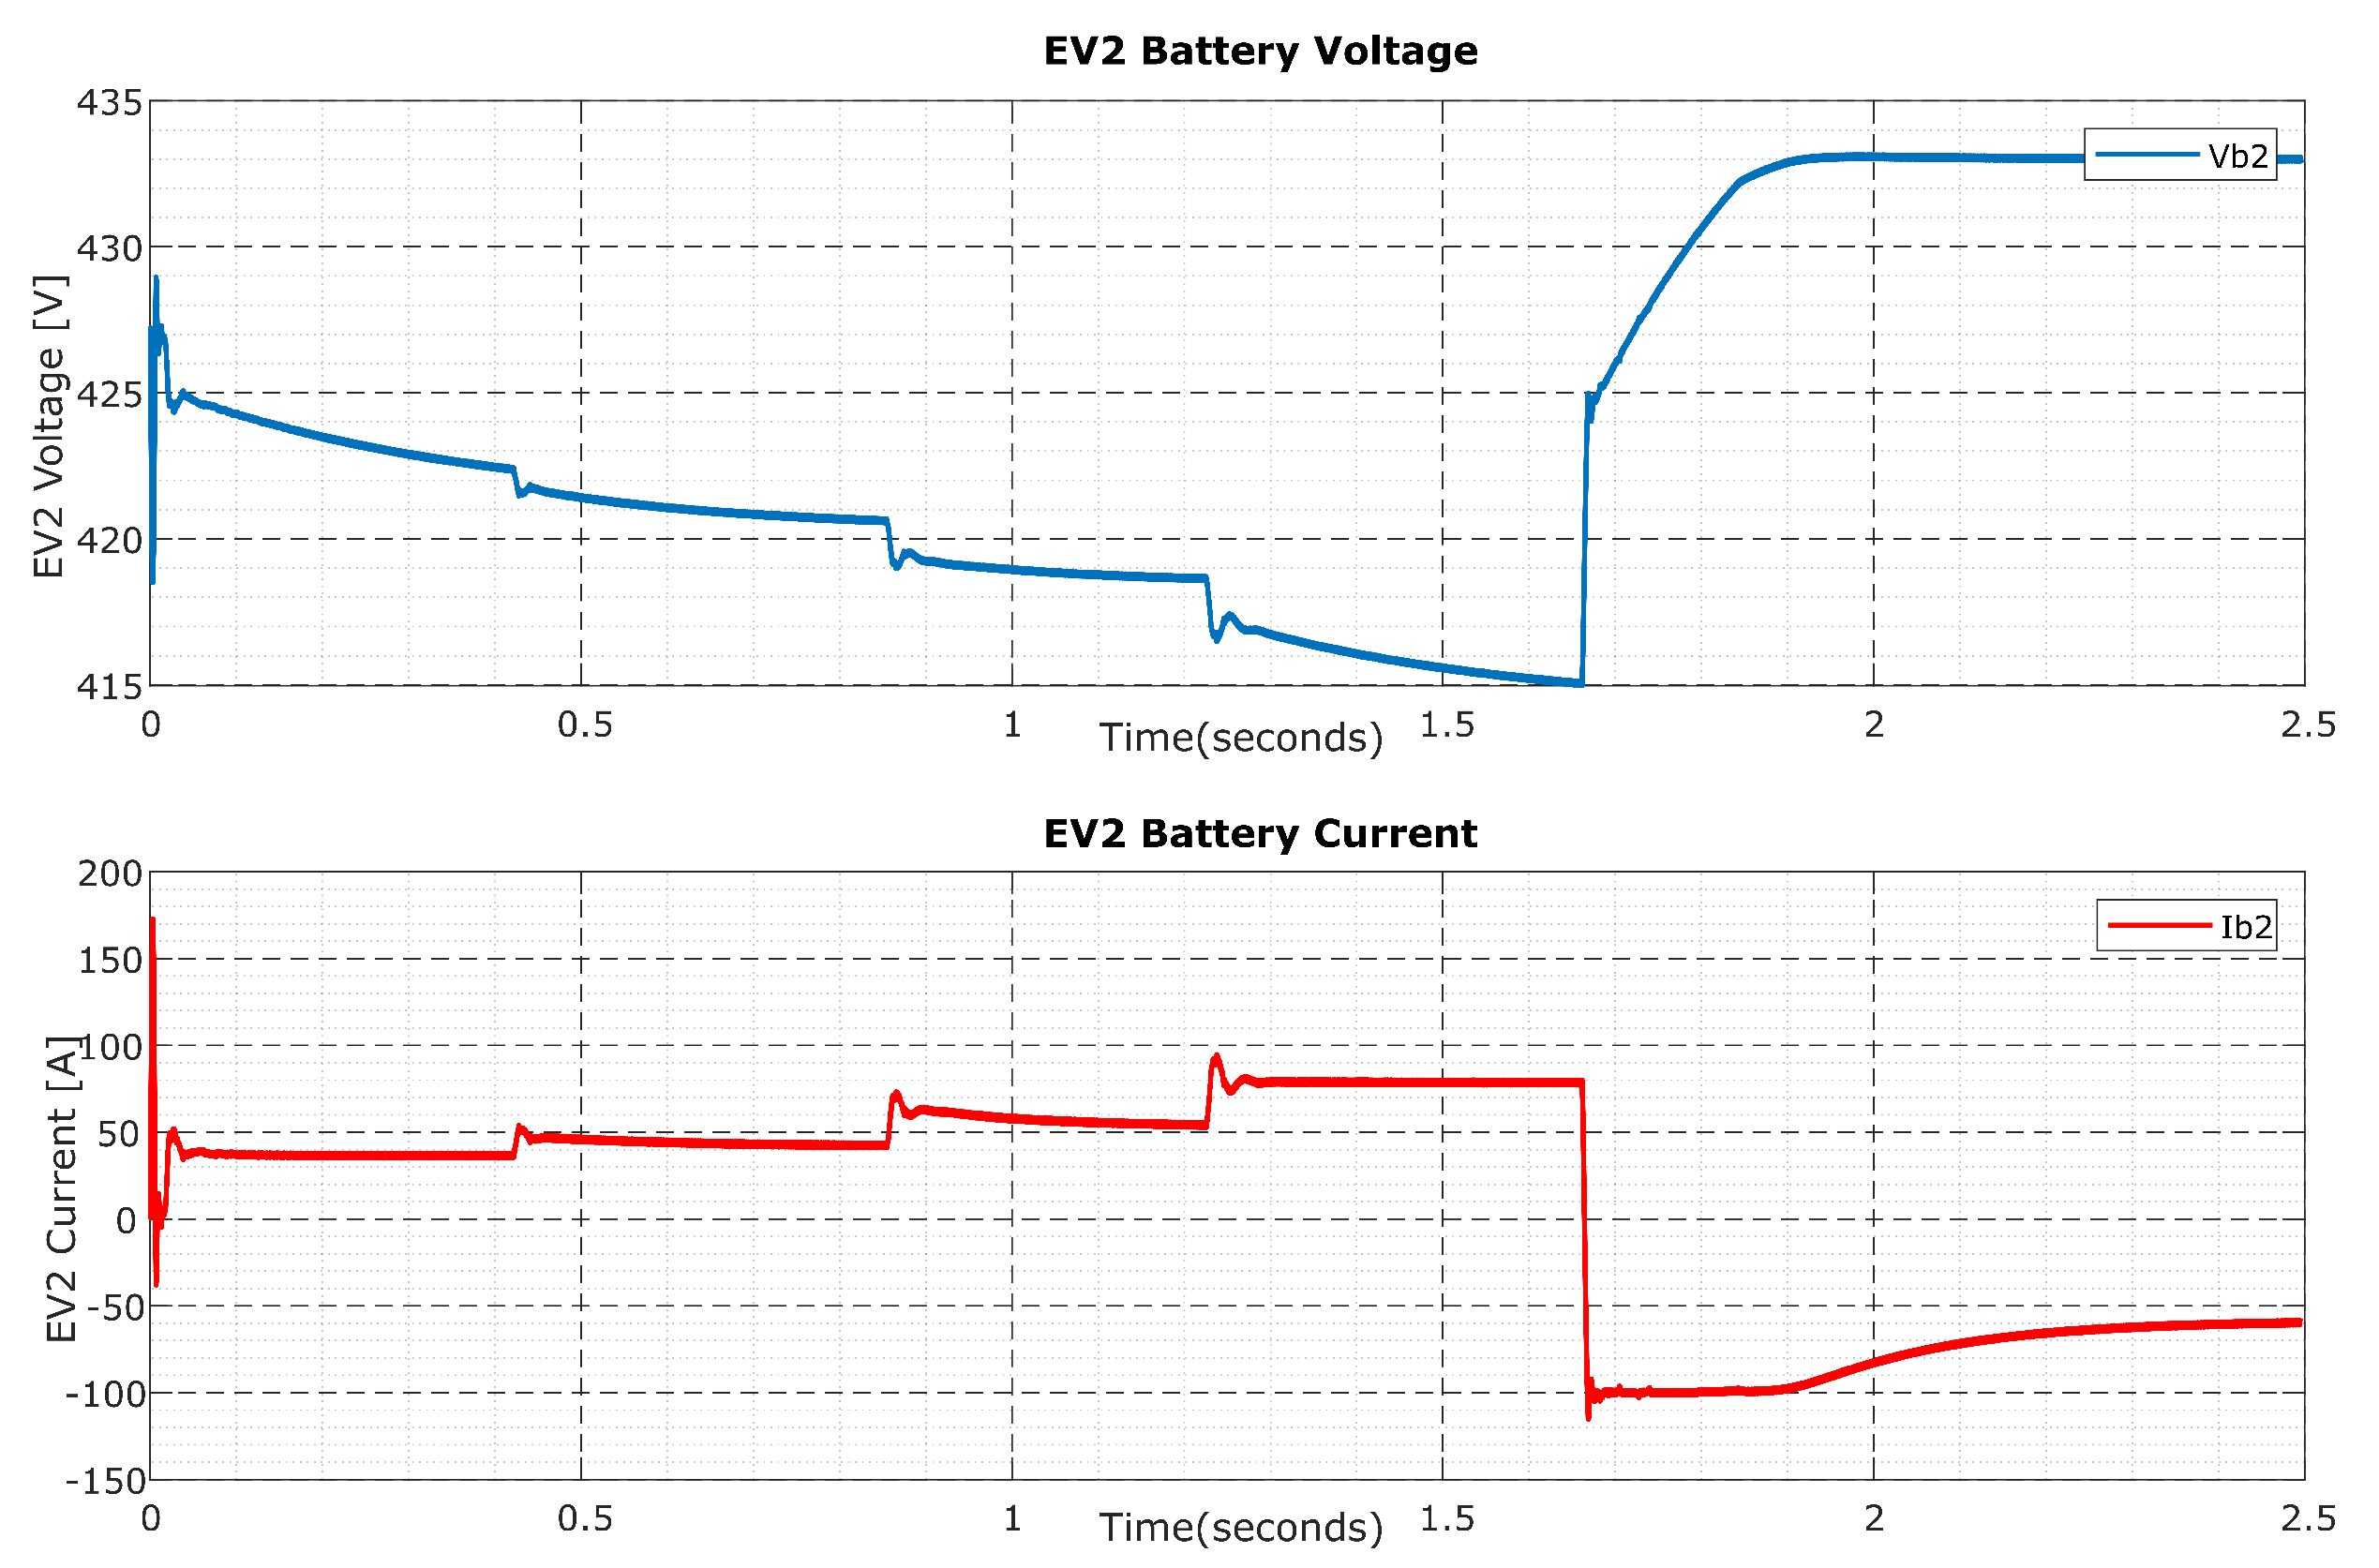
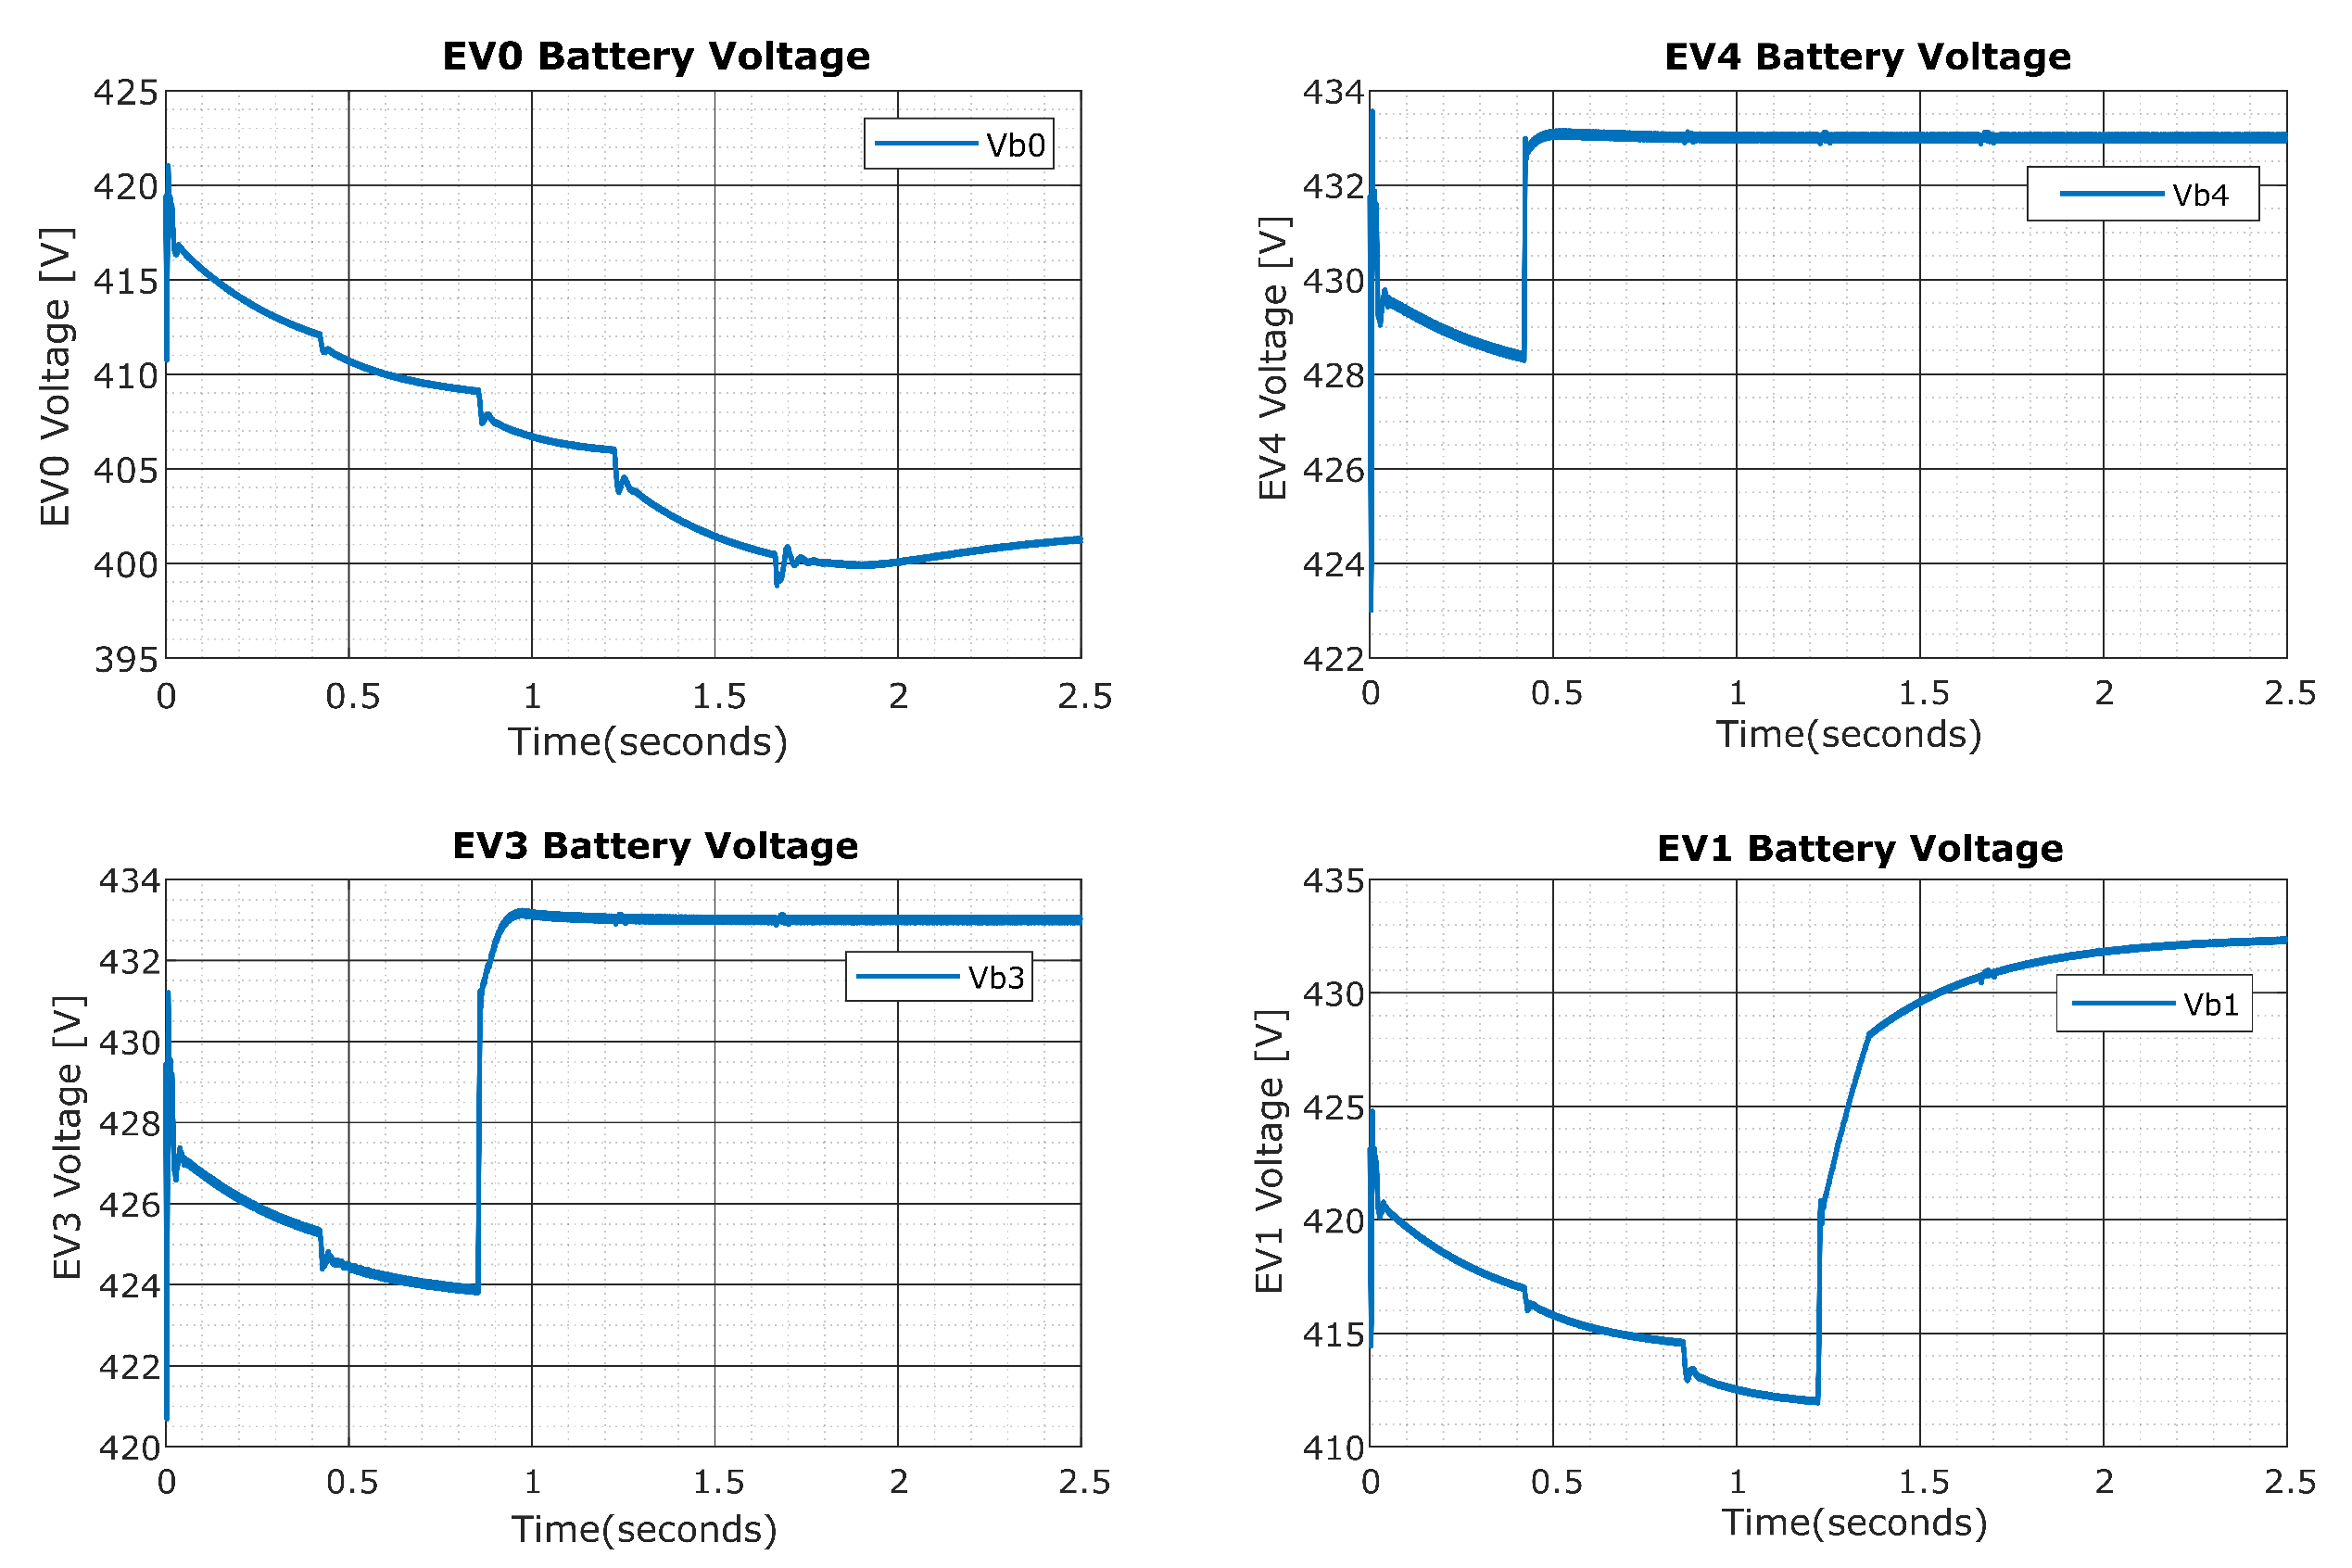
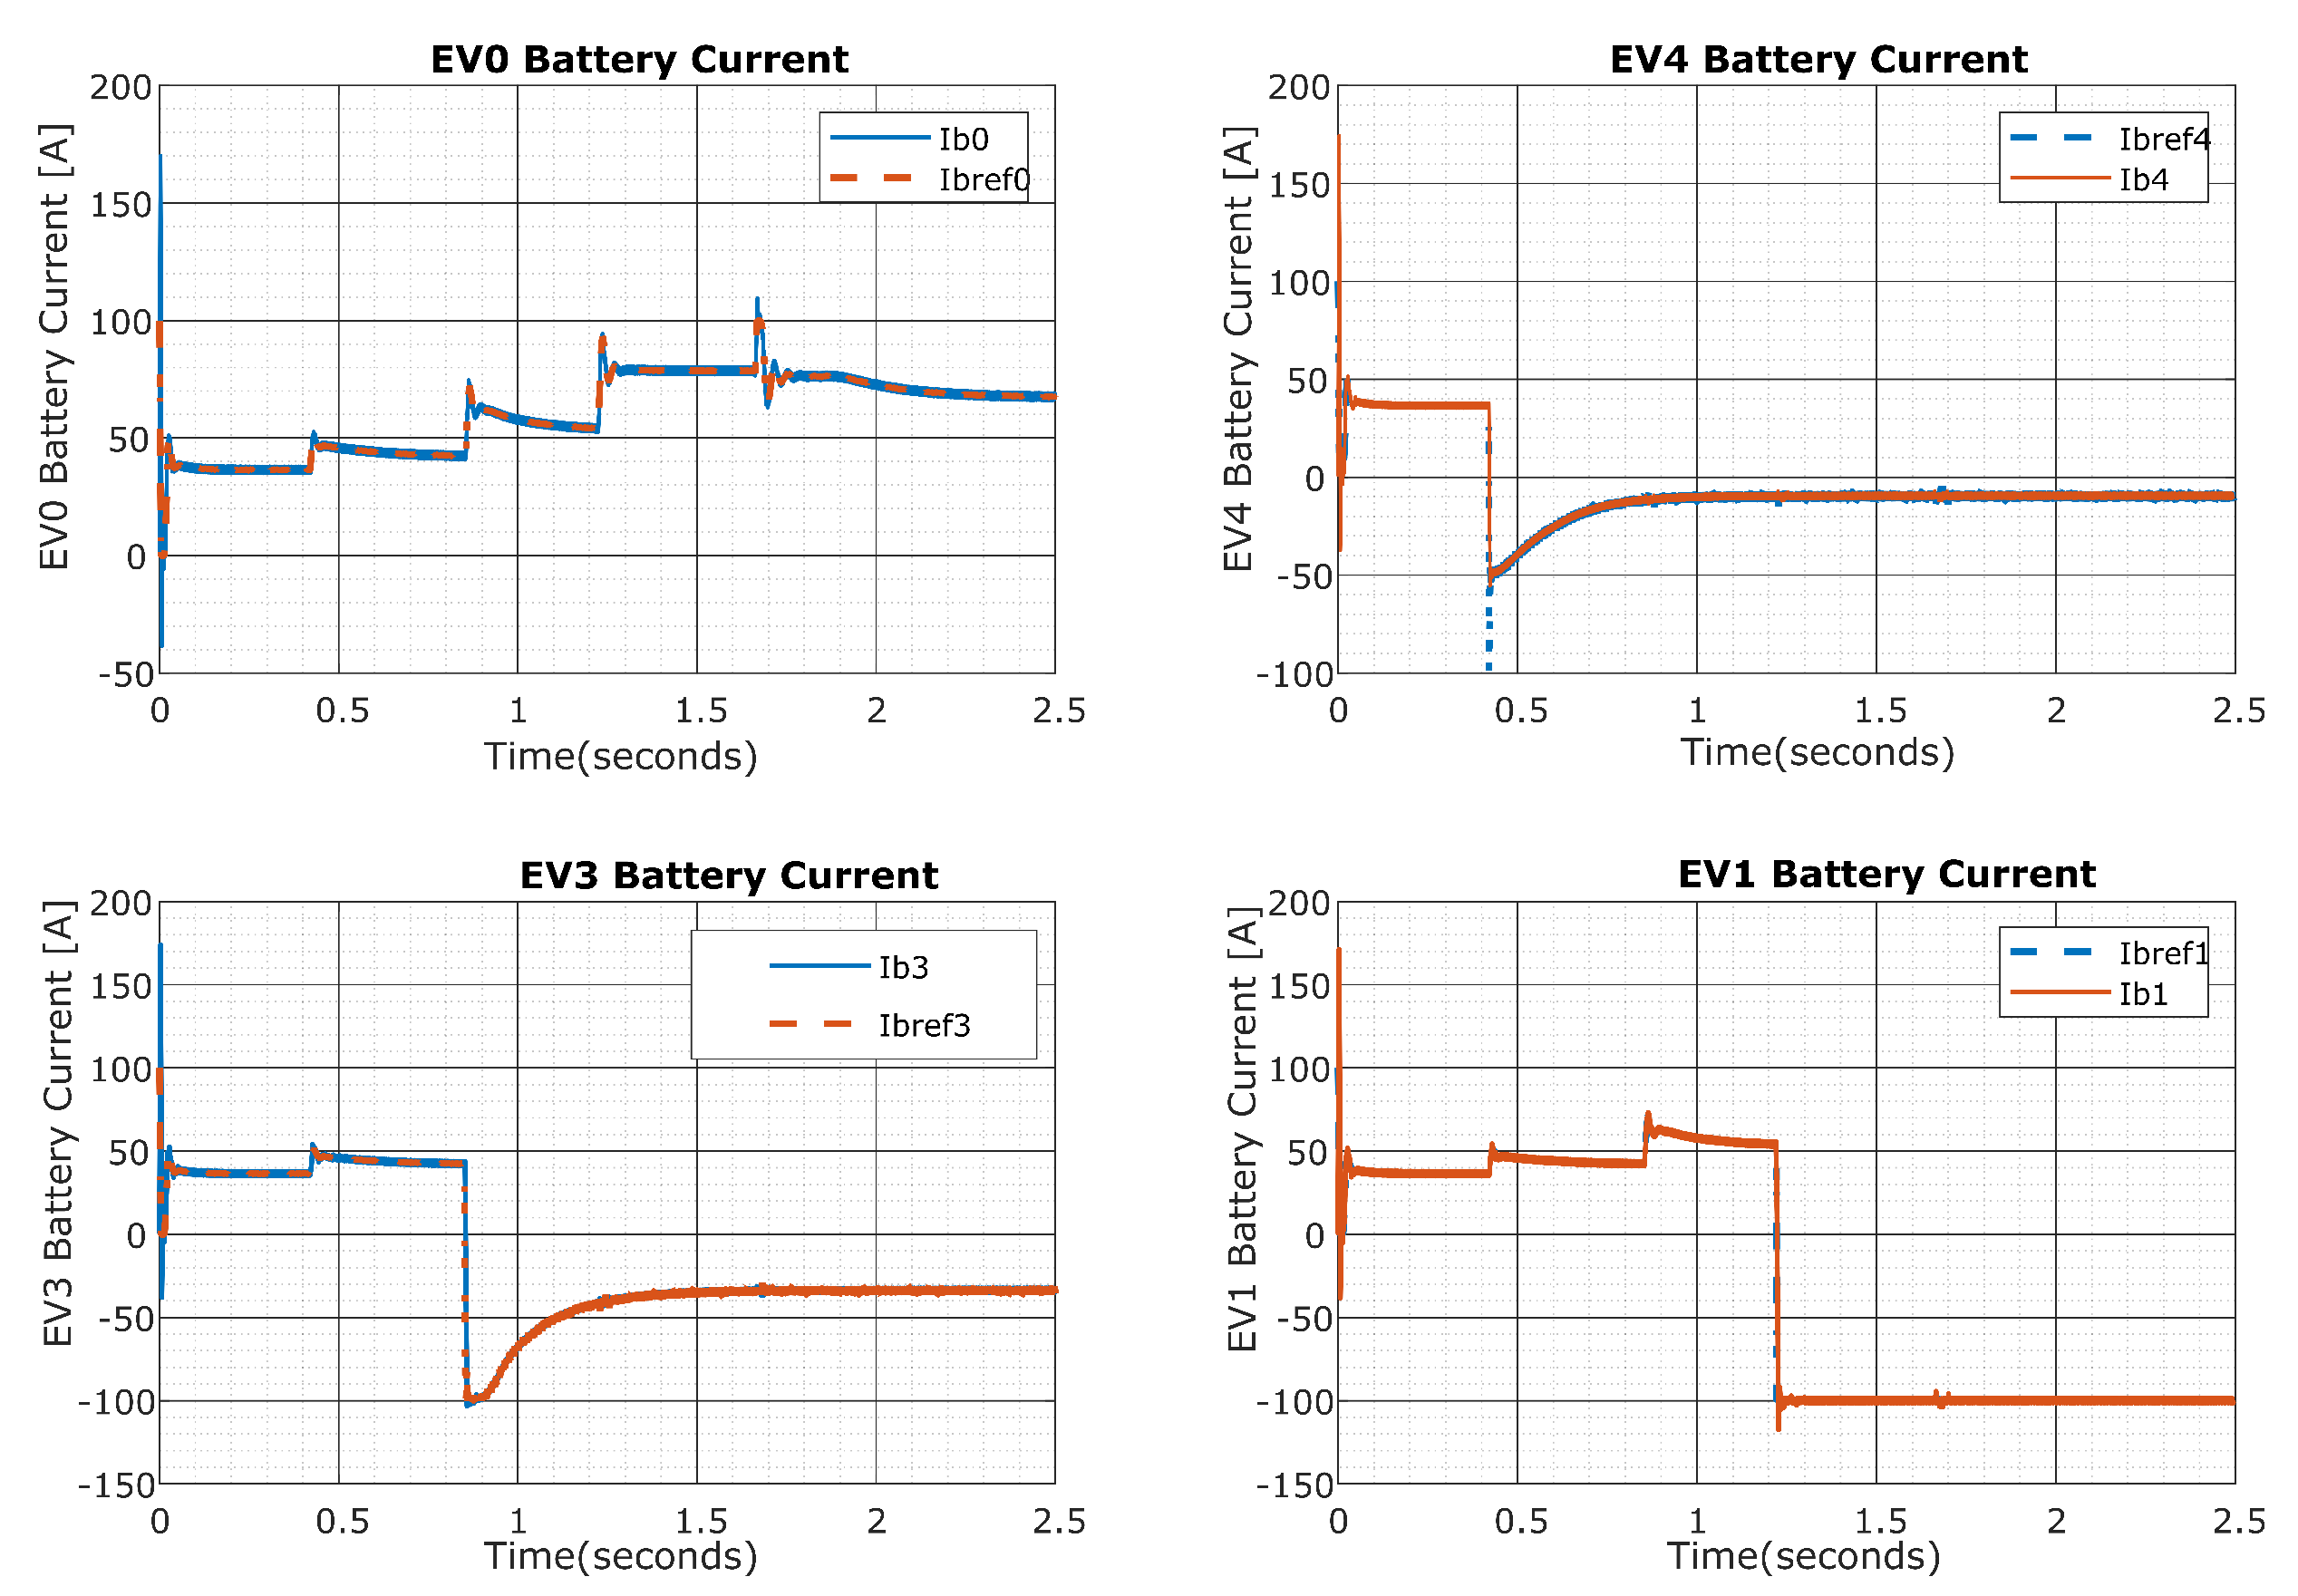
Figure 25 indicates the grid active power profile when the PV power is being injected into the grid and various EVs are being simultaneously charging and discharging. In the beginning, the PV power is injected into the grid and gradually increases. Similarly, all of the EVs are sending power to the grid.
Hence, the power flow direction at the point of common coupling is negative at the beginning; it continues to be negative, as the EVs gradually switch back to charging mode following the sequence shown in Table 2. After that, all of the EVs switched to charging, except EV0, which does not change the state; the power demand from the grid is higher than that injected. Therefore, the grid power becomes positive, as the grid is giving power. During that process, the grid power is intelligently supported by the PV power until the last goes completely off. Therefore, the grid has to fully charge the rest of the EVs supported partially by the EV0.
1.
The α stands for a situation when the PV power system is connected to the grid, but not generating power. While the EVs ( E V 0 , E V 1 , E V 2 , E V 3 & E V 4 ) are sending power to the grid. The mentioned case is demonstrated on the expression in Equation (10).
P G = i = 0 i = 4 P E V i
As the grid is receiving power from the EVs, then this is the V2G scenario. Therefore, the grid active power is negative.
2.
The β stands for a situation where the solar system is connected to the grid, and starting to generate power; the EVs ( E V 0 , E V 1 , E V 2 , E V 3 & E V 4 ) are sending power to the grid. The mentioned case is indicated on the expression in Equation (11).
P G = i = 0 i = 4 P E V i + P P V
The grid is receiving power from both the EVs and PV power system, hence the grid power will be more negative.
3.
The λ ; in this case the E V 0 , E V 1 , E V 2   a n d   E V 3 are sending power to the grid, while the E V 4 started charging. The PV solar systems are connected to the grid and increasingly generating power. The mentioned case is indicated on the expression in Equation (12).
P G = i = 0 i = 3 P E V i P E V 4 + P P V
The grid is receiving power from some of the EVs and PV power system and gives power to the rest of the EVs, hence the grid active power will start slightly to go positive.
4.
The ρ , in this case the E V 0 , E V 1 a n d E V 2 , are sending power to the grid; while the E V 4 a n d E V 3 started charging. The PV solar system is connected to the grid and generating maximum power. The illustrated case is shown on the expression in Equation (13).
P G = i = 0 i = 2 P E V i i = 3 i = 4 P E V i + P P V
The grid is receiving power from some of the EVs and PV power system and gives power to the rest of the EVs, hence the grid active power will more and more go positive.
5.
The γ , in this case the E V 0 a n d E V 1 are sending power to the grid, while the E V 4 , E V 3 a n d E V 2 started charging. The PV solar systems is connected to the grid and the generated power started decreasing. The illustrated case is shown on the expression in Equation (14).
P G = i = 0 i = 1 P E V i i = 2 i = 4 P E V i + P P V
The grid is receiving power from some of the EVs and PV power system and gives power to the rest of the EVs, hence the grid active power will more and more go positive closer to zero. The grid almost starts to send power out instead of receiving.
6.
The φ , in this case the E V 0 are sending power to the grid, while the E V 4 , E V 3 , E V 2 a n d E V 1 started charging. The PV solar system is connected to the grid and the generated power starts tending to zero. The illustrated case is shown on the expression in Equation (15).
P G = P E V 0 i = 1 i = 4 P E V i + P P V
The grid is receiving power from some of the EV0 and PV power system (which is slightly tending to zero) and gives power to the rest of the EVs, hence the grid active power is positive. The grid starts to send power out instead of receiving and the support from the PV power system is almost off.
7.
The ψ , in this case the E V 0 are sending power to the grid, while the E V 4 , E V 3 , E V 2 a n d E V 1 starts charging. The PV solar system is connected to the grid and off. The illustrated case is shown on the expression in the Equation (16).
P G = P E V 0 i = 1 i = 4 P E V i
The grid is receiving power from some of the EV0 and gives power to the rest of the EVs, hence the grid active power is positive. The PV power is connected, but its contribution is zero.

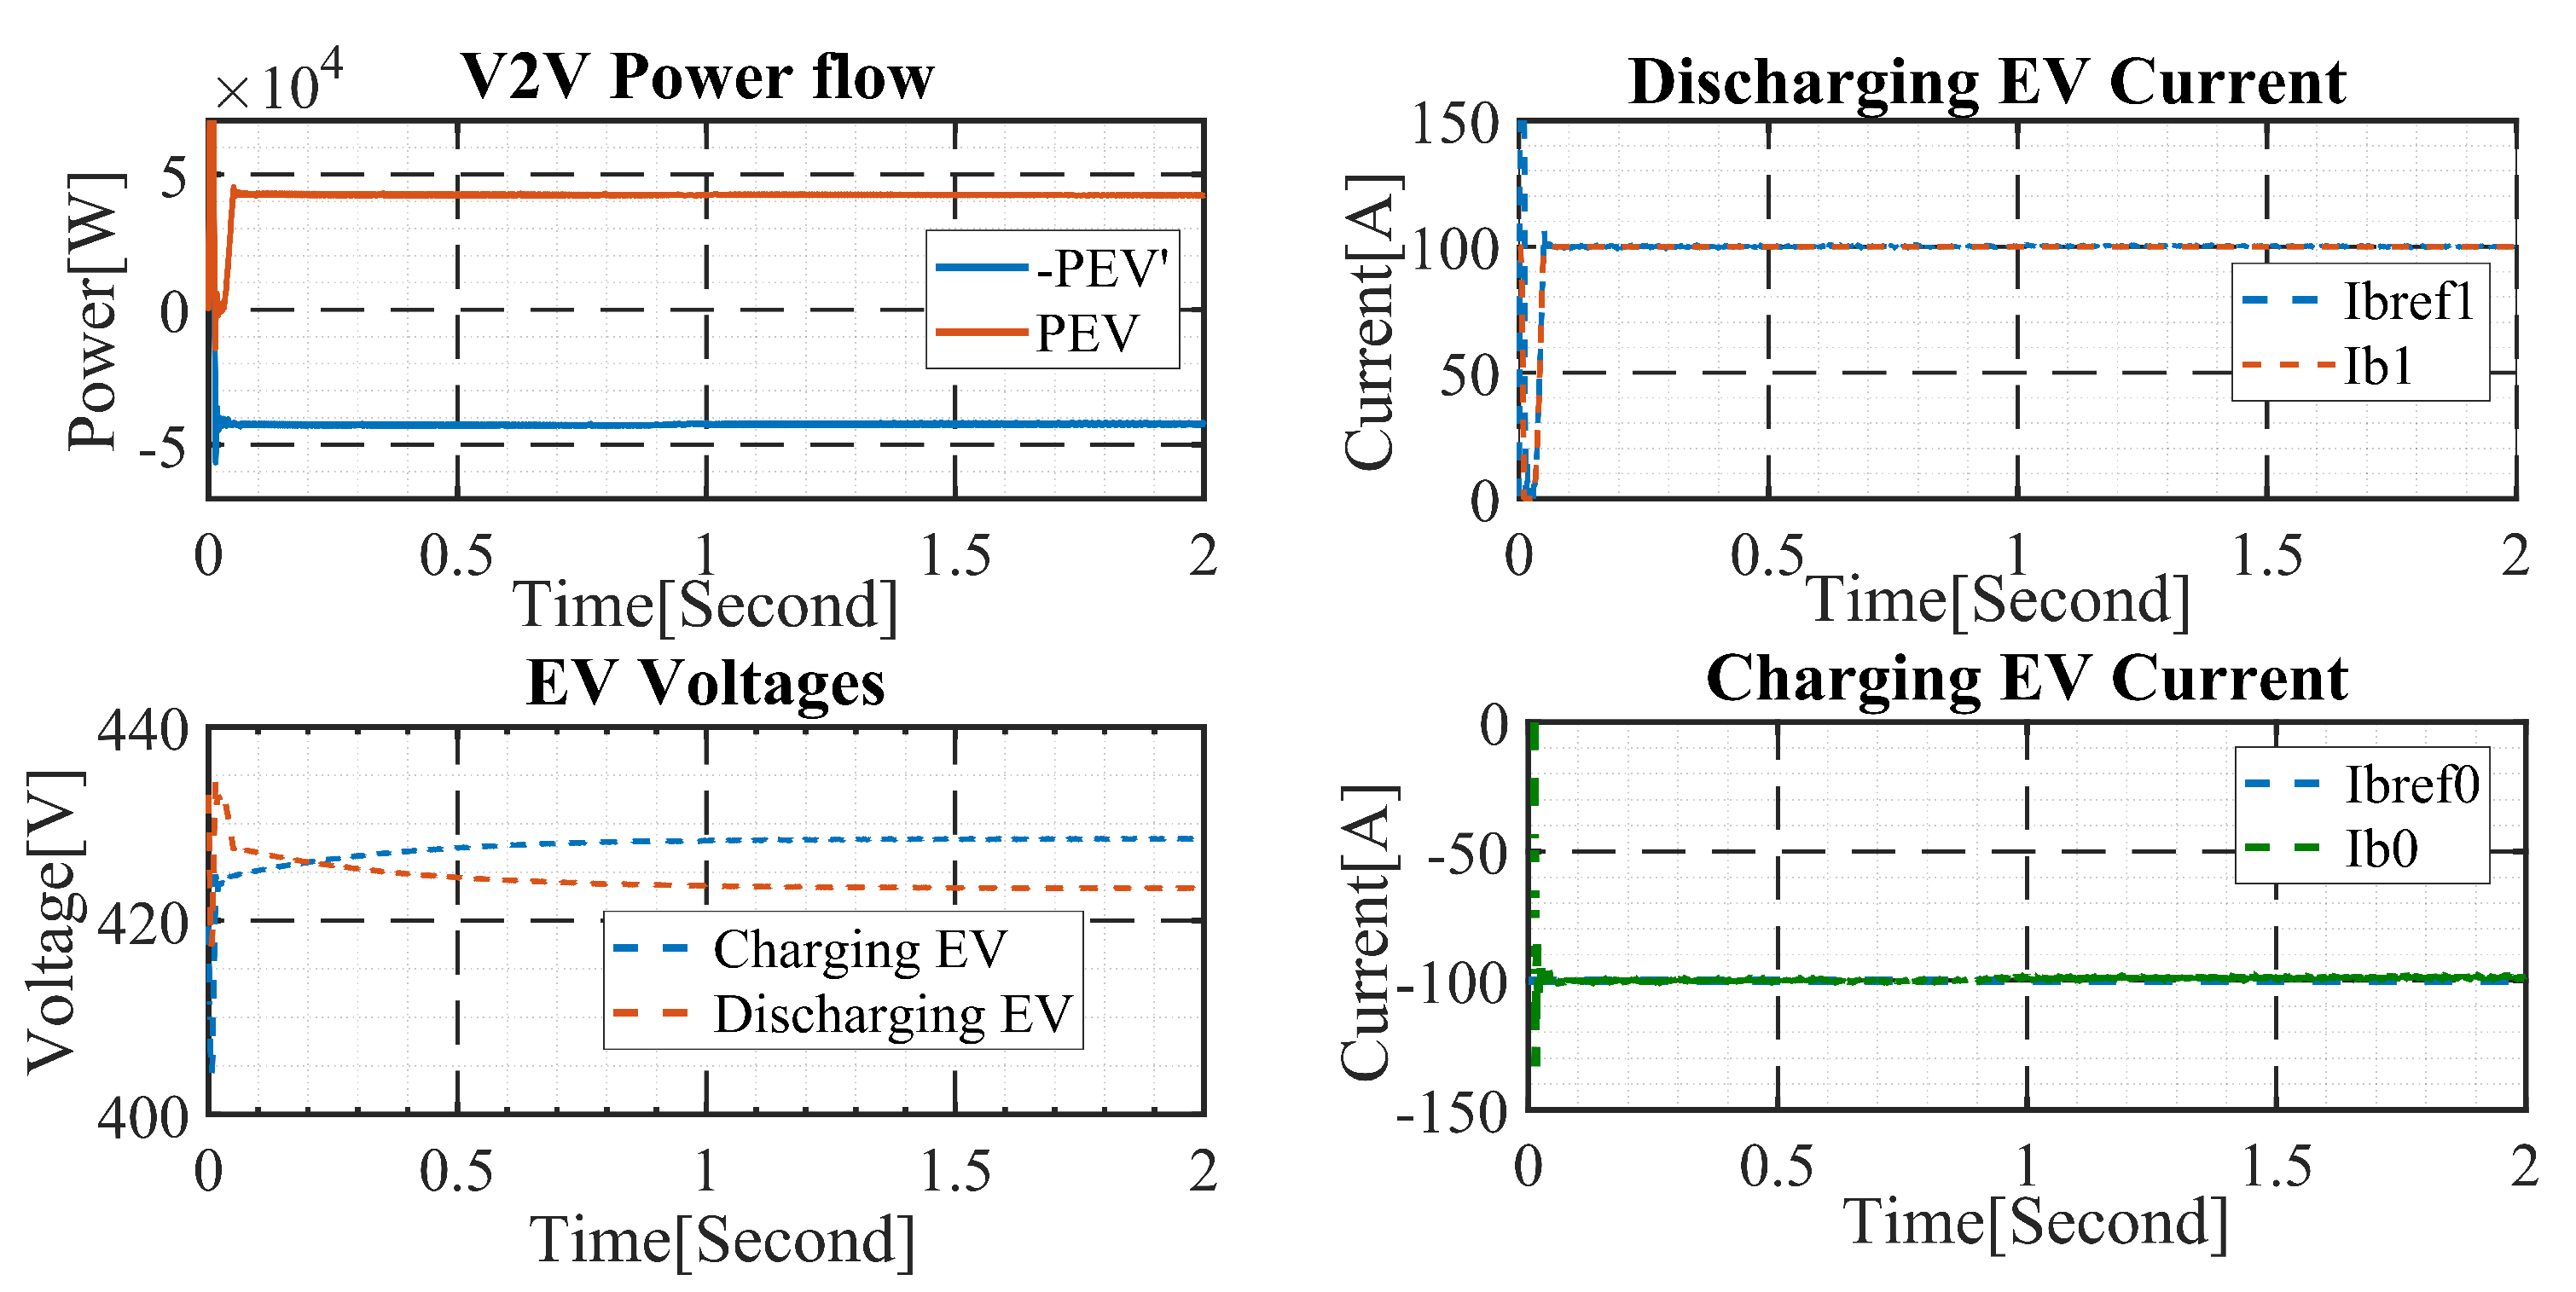
5.4. Simulation Results in Case of V2V

The V2V case is simulated based on the model built in Simulink following the Figure 12 and its results are illustrated in the Figure 26. It considers two EVs mutually interfaced by DC link. One of those is feeding power to the DC link, while another is charging from the DC link. Each EV battery is 400 V and 100 A for each EV. As the charging or discharging current strongly depends on the battery state-of-charge (SOC); the discharging battery SCO is set to 80% (the battery has enough power), and the charging battery SOC is set to 15% (the battery is almost empty).
i = 0 i = n ψ P E V i = i = ψ + 1 i = n P E V i
The Equation (17) illustrates the V2V expression. In this case, the grid and solar contributions are null.
The reactive power injection, regulation and compensation during the AC-DC conversion and vice-versa as well as the effect of power and load imbalance and the effect of branch resistances and inductances are not involved in this study. Further study is being done and these issues will be published in the future works.

6. Conclusions

This work illustrated the micro-grid, made of: extended grid, the EVs bi-directional charging stations, the PV power source, EVs, and the loads like EMBs. The major purpose was to make the EVs part of the grid power management system; on the role of power storage as a response to PV power use. Additionally, it was to ensure that the EVs are not becoming a burden to the grid, but a solution towards closing a net-zero loop. The concern was to understand the behavior of the grid during simultaneous charging and discharging of EVs, as well as the PV power injection to the grid. This work illustrates that simultaneous charging and discharging of EVs on the grid is proven and feasible. The discharging EVs contribute in giving power to the charging ones. In this case, the grid compensates the surplus demand. So, the G2V, V2G, V2V and V2X were clearly proven possible. It was shown that the PV power is first stored in the charging EVs, and the surplus demand is compensated by the grid. It implies that the PV power is intelligently first stored in the EVs. Hence, the EVs charging during PV power generation was shown to be the better option of storing more of PV power in EVs. This work proved that EVs can charge each other, can support the grid in case of peak demand and can supply power to other transport means like EMBs and EVs. Including, the EVs in power management system is: to enhance green power generation, promote green transport, contributing to net-zero and reduce the grid pressure, due to continuously increasing demand. The complete topology was built in Simulink for the ease of the simulation, concept validation and understanding. All of the power flow controls were shown in this work. However, this work ignored the reactive power injection, regulation and compensation during the AC-DC conversion and vice-versa as well as the effect of power and load imbalance and the effect of branch resistances and inductances. All of these points shall be included in the future work.

Author Contributions

This paper makes up part of the research carried out by the research team that will be here mentioned. The respective contributions of each team member will be mentioned as well. E.R. conceptualized the research, made: mathematical models, simulations, equationilization, and writing. J.D.G. supervised, reviewed and validated the resaerch. A.B. suggested the principle, supervised and corrected the work done. All authors have read and agreed to the published version of the manuscript.

Funding

This project was supported by: Africa Improved Foods https://africaimprovedfoods.com (accessed on: 22 February 2022), in the skills development program. Africa Energy Sevices Group https://africaesg.com/ (accessed on: 15 March 2022).

Institutional Review Board Statement

Not applicable.

Informed Consent Statement

Not applicable.

Data Availability Statement

Not applicable.

Conflicts of Interest

The authors declare no conflict of interest. The funders had no role in the design of the study; in the collection, analysis, or interpretation of data; in the writing of the manuscript, or in the decision to publish the results.

Abbreviations

The following abbreviations are used in this manuscript:
G2VGrid to Vehicle
V2GVehicle to Grid
V2VVehicle to Vehicle
V2XVehicle to Load
EVsElectric Vehicles

References

  1. Ürge-Vorsatz, D.; Khosla, R.; Bernhardt, R.; Chan, Y.C.; Vérez, D.; Hu, S.; Cabeza, L.F. Advances toward a net-zero global building sector. Annu. Rev. Environ. Resour. 2020, 45, 227–269. [Google Scholar] [CrossRef]
  2. Vella, H. Ten Steps to net zero: As the goal to reach net zero in the UK rapidly approaches, we examine Boris Johnson’s 10-point plan for a green industrial revolution. Eng. Technol. 2021, 16, 20–25. [Google Scholar] [CrossRef]
  3. Abdou, N.; El Mghouchi, Y.; Hamdaoui, S.; Mhamed, M. Optimal Building Envelope Design and Renewable Energy Systems Size for Net-zero Energy Building in Tetouan (Morocco). In Proceedings of the 2021 9th International Renewable and Sustainable Energy Conference (IRSEC), Virtual, 23–27 November 2021; pp. 1–6. [Google Scholar]
  4. Kaloti, S.; Kamal, F.; Al Mamun, A.; Chowdhury, B. Is Achieving Net-Zero Carbon Emissions Possible for Electric Utilities with Current Technology? In Proceedings of the 2021 North American Power Symposium (NAPS), College Station, TX, USA, 14–16 November 2021; pp. 1–6. [Google Scholar]
  5. Arita, M.; Nakamura, Y.; Ishida, S.; Arakawa, Y. ZEL: Net-Zero-Energy Lifelogging System using Heterogeneous Energy Harvesters. In Proceedings of the 2022 IEEE International Conference on Pervasive Computing and Communications (PerCom), Pisa, Italy, 21–25 March 2022; pp. 172–179. [Google Scholar]
  6. Lowe, C.; Stanley, J.; Alosaimi, F.; Yousf, M.; Bordelon, J.; Karayaka, H.B. Load Following Capability for Hybrid Nuclear and Solar Photovoltaic Power Plants with an Energy Storage System. In Proceedings of the 2020 52nd North American Power Symposium (NAPS), Tempe, AZ, USA, 11–13 April 2021; pp. 1–6. [Google Scholar]
  7. Saw, S.K.; Navada, H.G.; Shubhanga, K.N. Power Flow Analysis of Power Distribution System Integrated with Solar Photovoltaic Based Distributed Generation. In Proceedings of the 2022 International Conference on Intelligent Controller and Computing for Smart Power (ICICCSP), Hyderabad, India, 21–23 July 2022; pp. 1–6. [Google Scholar]
  8. Boutasseta, N.; Bouakkaz, M.S.; Attoui, I.; Fergani, N.; Bouraiou, A.; Necaibia, A. Implementation of MPPT Methods for improving the Performance of Photovoltaic Systems. In Proceedings of the 2021 International Conference on Recent Advances in Mathematics and Informatics (ICRAMI), Tebessa, Algeria, 21–22 September 2021; pp. 1–4. [Google Scholar]
  9. Lian, H.; Hu, S.; Meng, Y. Research on Supporting Control Technology of Wind driven generator Auxiliary Power Grid Based on Energy Storage DC Access. In Proceedings of the 2021 International Conference on Advanced Electrical Equipment and Reliable Operation (AEERO), Beijing, China, 15–17 October 2021; pp. 1–4. [Google Scholar]
  10. Khatibi, M. Investigating the Impact of Wind Farms Energy Yields on Reduction of Power Plants Natural Gas Consumptions and CO2 Emissions: A Practical Case Study in Iran. In Proceedings of the 7th Iran Wind Energy Conference (IWEC2021), Shahrood, Iran, 17–18 May 2021; pp. 1–4. [Google Scholar]
  11. Malik, M.Z.; Baloch, M.H.; Ali, B.; Khahro, S.H.; Soomro, A.M.; Abbas, G.; Zhang, S. Power Supply to Local Communities Through Wind Energy Integration: An Opportunity Through China-Pakistan Economic Corridor (CPEC). IEEE Access 2021, 9, 66751–66768. [Google Scholar] [CrossRef]
  12. Abomazid, A.M.; El-Taweel, N.A.; Farag, H.E. Optimal energy management of hydrogen energy facility using integrated battery energy storage and solar photovoltaic systems. IEEE Trans. Sustain. Energy 2022, 13, 1457–1468. [Google Scholar] [CrossRef]
  13. Stoyanov, L. Modeling of Hybrid System with Photovoltaic Panels-Fuel cells Generation and Hydrogen Storage Using Electrolyzer. In Proceedings of the 2021 17th Conference on Electrical Machines, Drives and Power Systems (ELMA), Sofia, Bulgaria, 1–4 July 2021; pp. 1–4. [Google Scholar]
  14. Li, Z.; Zhang, W.; Zhang, R.; Sun, H. Development of renewable energy multi-energy complementary hydrogen energy system (A Case Study in China): A review. Energy Explor. Exploit. 2020, 38, 2099–2127. [Google Scholar] [CrossRef]
  15. Salman, A.A.; Soon, C.F.; Salem, A.A.; Al-Sharai, A.A. Modelling Of Grid Connected Photovoltaic System. In Proceedings of the 2021 IEEE 19th Student Conference on Research and Development (SCOReD), Online, 23–25 November 2021; pp. 42–46. [Google Scholar]
  16. Chen, T.; Jin, Y.; Lv, H.; Yang, A.; Liu, M.; Chen, B.; Xie, Y.; Chen, Q. Applications of lithium-ion batteries in grid-scale energy storage systems. Trans. Tianjin Univ. 2020, 26, 208–217. [Google Scholar] [CrossRef] [Green Version]
  17. Heilmann, C.; Friedl, G. Factors influencing the economic success of grid-to-vehicle and vehicle-to-grid applications—A review and meta-analysis. Renew. Sustain. Energy Rev. 2021, 145, 111115. [Google Scholar] [CrossRef]
  18. Pinto, J.G.; Monteiro, V.; Gonçalves, H.; Exposto, B.; Pedrosa, D.; Couto, C.; Afonso, J.L. Bidirectional battery charger with grid-to-vehicle, vehicle-to-grid and vehicle-to-home technologies. In Proceedings of the IECON 2013—39th Annual Conference of the IEEE Industrial Electronics Society, Vienna, Austria, 10–13 November 2013; pp. 5934–5939. [Google Scholar]
  19. Liu, C.; Chau, K.T.; Wu, D.; Gao, S. Opportunities and challenges of vehicle-to-home, vehicle-to-vehicle, and vehicle-to-grid technologies. Proc. IEEE 2013, 101, 2409–2427. [Google Scholar] [CrossRef] [Green Version]
  20. Das, S.; Acharjee, P.; Bhattacharya, A. Charging scheduling of electric vehicle incorporating grid-to-vehicle and vehicle-to-grid technology considering in smart grid. IEEE Trans. Ind. Appl. 2020, 57, 1688–1702. [Google Scholar] [CrossRef]
  21. Evode, R. Modeling of Electric Grid Behaviors having Electric Vehicle charging stations with G2V and V2G Possibilities. In Proceedings of the 2021 International Conference on Electrical, Computer, Communications and Mechatronics Engineering (ICECCME), Mauritius, 7–8 October 2021; pp. 1–5. [Google Scholar]
  22. Tostado-Véliz, M.; Kamel, S.; Hasanien, H.M.; Arévalo, P.; Turky, R.A.; Jurado, F. A stochastic-interval model for optimal scheduling of PV-assisted multi-mode charging stations. Energy 2022, 253, 124219. [Google Scholar] [CrossRef]
  23. Goel, S.; Sharma, R.; Rathore, A.K. A review on barrier and challenges of electric vehicle in India and vehicle to grid optimisation. Transp. Eng. 2021, 4, 100057. [Google Scholar] [CrossRef]
  24. Engel, B.; Di Modica, G.L.; Gartner, J.; Pronobis, O.; Wussow, J. Technology and Challenges with Fleet Grid Integration. In Electric Vehicles in Shared Fleets: Mobility Management, Business Models, and Decision Support Systems; World Scientific: Singapore, 2022; pp. 31–50. [Google Scholar]
  25. Cui, S.; Liu, X.; Tian, D.; Zhang, Q.; Song, L. The construction and simulation of V2G system in micro-grid. In Proceedings of the 2011 International Conference on Electrical Machines and Systems, Beijing, China, 20–23 August 2011; pp. 1–4. [Google Scholar]
  26. Sahoo, B.; Routray, S.K.; Rout, P.K. AC, DC, and hybrid control strategies for smart microgrid application: A review. Int. Trans. Electr. Energy Syst. 2020, 31, e12683. [Google Scholar] [CrossRef]
  27. Uko, C.; Egbue, O.; Naidu, D.S. Economic Dispatch of a Smart Grid with Vehicle-to-Grid Integration. In Proceedings of the 2020 IEEE Green Technologies Conference (GreenTech), Oklahoma City, OK, USA, 1–3 April 2020; pp. 148–152. [Google Scholar]
  28. Kuruvilla, V.; Kumar, P.V.; Selvakumar, A.I. Challenges And Impacts of V2g Integration—A Review. In Proceedings of the 2022 8th International Conference on Advanced Computing and Communication Systems (ICACCS), Coimbatore, India, 25–26 March 2022; pp. 1938–1942. [Google Scholar] [CrossRef]
  29. Bimenyimana, S.; Asemota, G.N.; Li, L. The state of the power sector in Rwanda: A progressive sector with ambitious targets. Front. Energy Res. 2018, 6, 68. [Google Scholar] [CrossRef]
  30. Gohari, H.S.; Abbaszadeh, K. A novel controllable bidirectional switching-capacitor based Buck-Boost charger for EVs. In Proceedings of the 2020 11th Power Electronics, Drive Systems, and Technologies Conference (PEDSTC), Tehran, Iran, 4–6 February 2020; pp. 1–6. [Google Scholar]
  31. Shakeel, F.M.; Malik, O.P. Vehicle-To-Grid Technology in a Micro-grid Using DC Fast Charging Architecture. In Proceedings of the 2019 IEEE Canadian Conference of Electrical and Computer Engineering (CCECE), Edmonton, AB, Canada, 5–8 May 2019; pp. 1–4. [Google Scholar]
  32. Balakhontsev, A.; Beshta, O.; Boroday, V.; Khudolii, S.; Pirienko, S. A Review of Topologies of Quick Charging Stations for Electric Vehicles. In Proceedings of the 2021 IEEE International Conference on Modern Electrical and Energy Systems (MEES), Kremenchuk, Ukraine, 21–24 September 2021; pp. 1–4. [Google Scholar]
  33. Thanakam, T.; Kumsuwan, Y. A Novel On-Board Battery Charger Configuration Based on Nine-Switch Converter fed Open-End Winding AC Motor Drive for Plug-In Electric Vehicles. In Proceedings of the 2021 24th International Conference on Electrical Machines and Systems (ICEMS), Gyeongju, Korea, 31 October–3 November 2021; pp. 988–991. [Google Scholar]
  34. Hwang, S.H.; Chen, Y.; Zhang, H.; Lee, K.Y.; Kim, D.H. Reconfigurable Hybrid Resonant Topology for Constant Current/Voltage Wireless Power Transfer of Electric Vehicles. Electronics 2020, 9, 1323. [Google Scholar] [CrossRef]
  35. Eidiani, M.; Ghavami, A. New network design for simultaneous use of electric vehicles, photovoltaic generators, wind farms and energy storage. In Proceedings of the 2022 9th Iranian Conference on Renewable Energy & Distributed Generation (ICREDG), Mashhad, Iran, 23–24 February 2022; pp. 1–5. [Google Scholar]
Figure 1. Illustration of microgrid that involves the vehicle simultaneous charging–discharging [21], © 2021 IEEE.
Electricity 03 00028 g001
Figure 2. Illustration of microgrid that involves the vehicle simultaneous charging and discharging.
Electricity 03 00028 g002
Figure 3. Block diagram of the DC link voltage and line current control [21], © 2021 IEEE.
Electricity 03 00028 g003
Figure 4. Illustration of transformation and PLL [21], © 2021 IEEE.
Electricity 03 00028 g004
Figure 5. Equivalent circuit of the bi-directional off-board charger.
Electricity 03 00028 g005
Figure 6. Block diagram of EV charging or discharging selection and control [21], © 2021 IEEE.
Electricity 03 00028 g006
Figure 7. Illustration of constant current and constant voltage charging or discharging mode of batteries [34].
Electricity 03 00028 g007
Figure 8. Representation of the PV power system supply to the grid.
Electricity 03 00028 g008
Figure 9. Block diagram indicating the MPPT control structure.
Electricity 03 00028 g009
Figure 10. Illustration of the Incremental conductance algorithm.
Electricity 03 00028 g010
Figure 11. Bi-directional flow of power: G2V and V2G illustration.
Electricity 03 00028 g011
Figure 12. Illustration of V2V or vehicle to Vehicle mode, in which one vehicle charges another.
Electricity 03 00028 g012
Figure 13. Illustration of V2X or the case where the vehicle supplies various loads on the same bus.
Electricity 03 00028 g013
Figure 14. Illustration of CC and CV in both Mode1 and Mode2 [21], © 2021 IEEE.
Electricity 03 00028 g014
Figure 15. Battery voltage in both Mode 1 and Mode 2 [21], © 2021 IEEE.
Electricity 03 00028 g015
Figure 16. Battery current controls in Mode 1 and Mode 2 [21], © 2021 IEEE.
Electricity 03 00028 g016
Figure 17. Vdc link and Id-axis current controls [21], © 2021 IEEE.
Electricity 03 00028 g017
Figure 18. Grid voltage V a and grid current I a [21], © 2021 IEEE.
Electricity 03 00028 g018
Figure 19. Grid active power profile.
Electricity 03 00028 g019
Figure 20. Illustration of PV array power generation with respect to irradiance and weather temperature.
Electricity 03 00028 g020
Figure 21. Illustration of the irradiance behavior for 4 h at 25 degree weather temperature.
Electricity 03 00028 g021
Figure 22. PV power transfer profile from the PV power system to the grid.
Electricity 03 00028 g022
Figure 23. Grid voltage and current with PV Power injection.
Electricity 03 00028 g023
Figure 24. PV power injected into the grid.
Electricity 03 00028 g024
Figure 25. Grid active power profile with the PV power injection, G2V and V2G illustration.
Electricity 03 00028 g025
Figure 26. Illustration of V2V process in the micro-grid.
Electricity 03 00028 g026
Table 1. The Simulink model parameters.
Parameters
ItemValueUnit
Grid choke
R 1 μ Ω
L 500 μ H
Φ
V g r i d 400 V r m s
f r 50 H z
For the Source
R s o u r c e 100 m Ω
L s o u r c e 40 μ H
Weather conditions
Temp25 C
Irrad0 to 1 to 0 k W / m 2
For Booster
R b o o s t 100 μ Ω
L b o o s t 1.6 m H
C b o o s t 100 μ F
Off-board charger
L b a t t 5.76 m H
C b a t t 5.6 μ F
For EV battery
V b a t t 400 V n o m
I b a t t 80 A
Table 2. Illustration of the EVs SOC and states [21], © 2021 IEEE.
EVSOCSequenceMode 1Mode 2
EV015%5V2G-
EV120%4V2GG2V
EV230%3V2GG2V
EV340%2V2GG2V
EV460%1V2GG2V
Load-6Off-
Table 3. Illustration of a user defined module parameters in Simulink.
Module: User Defined Module
ItemsValues
Maximum Power [W]213.15
Cells per Module (Ncells)60.00
Open Circuit Voltage (VoC) [V]36.30
Voltage at Max Power Point [V]29.00
Current at Max Power Point [A]7.35
Temperature Coeff. of VoC [%/°C]−0.36099
Temperature coeff. of Isc (%/°C)0.102
Publisher’s Note: MDPI stays neutral with regard to jurisdictional claims in published maps and institutional affiliations.

