Article

Mercury Accumulation in Food Crops and Phytoremediation Potential of Wild Plants Thriving in Artisanal and Small-Scale Gold Mining Areas in Uganda

by
Jamilu E. Ssenku
1,
Betty Naziriwo
2,
Jennifer Kutesakwe
3,
Abubakar Sadik Mustafa
1,
Derrick Kayeera
2 and
Emmanuel Tebandeke
2,*
1
Department of Plant Sciences, Microbiology and Biotechnology, College of Natural Sciences, Makerere University, Kampala 7062, Uganda
2
Department of Chemistry, College of Natural Sciences, Makerere University, Kampala 7062, Uganda
3
National Environment Management Authority, Kampala 22255, Uganda
*
Author to whom correspondence should be addressed.
Pollutants 2023, 3(2), 181-196; https://doi.org/10.3390/pollutants3020014
Submission received: 20 October 2022 / Revised: 31 January 2023 / Accepted: 1 February 2023 / Published: 23 March 2023

Abstract

:
Mercury (Hg) has been used for millennia in artisanal and small-scale gold mining (ASGM) to extract gold from ore as an amalgam that is heated to recover gold. Since there is hardly any sustainable technology that can be used to recover it, the vast percentage of released Hg finds its way into the environment. Currently, ASGM is the largest source of mercury pollution on Earth. Mercury (Hg) is listed among the top 10 most harmful metals by the World Health Organization (WHO), and it is known to cause several neurological disorders in humans. Thus, Hg levels in environmental systems surrounding pollution hotspots such as ASGM mines need to be monitored to ensure their proper management and protect vulnerable ecosystems and human health. This work was aimed to study the level of Hg pollution in soils and plants thriving around ASGM mines in Eastern Uganda and to evaluate the Hg phytoremediation potential of the plants. The total Hg contents were determined for soils, food crops and wild plants growing around ASGM mines. The results for the pH, organic carbon (OC) and electric conductivity (EC) of the soils in the study area were comparable to those of the control soils. The soils in the studied ASGM areas exhibited high Hg concentrations ranging between 723 and 2067 folds more than those of the control soils. All soils were moderately to heavily contaminated according to geoaccumulation (Igeo) index values that ranged between 1.16 and 3.31. The results of this study also showed that the food crops and wild plants accumulated Hg levels that were above the 20 ng/g (0.02 ppm) permissible limit. This study revealed relatively higher levels of Hg in the aerial parts of the plants compared with the underground organs, which can be attributed to Hg deposition, entry through stomata and foliar adsorption. Mercury levels in 47% of the food crop samples were above the FAO/WHO permissible mercury limit of 0.5 µg/g. Similarly, medicinal plants accumulated Hg to levels that were several folds higher than the 0.2 ppm permissible limit of mercury in herbal materials of Canada. Interestingly, this study showed that some wild plant species, especially sedges, exhibited relatively higher levels of mercury accumulation than others thriving in the same environment, an indication that such plants could be utilized in the phytoremediation of Hg-contaminated sites.

1. Introduction

Artisanal and small-scale gold mining (ASGM) is a major human health concern, especially in developing countries such as Uganda due to the extensive usage of mercury (Hg) in the mining process [1]. ASGM refers to the informal mining activities that involve the use of rudimentary technologies to explore, extract, and process gold ore. For millennia, ASGM miners have depended on Hg to recover gold from the ore through the amalgamation process [2]. The amalgamation method is perceived by ASG miners to be the most efficient method and requires only minimal investment to operationalize. Currently, more than 15 million people, including women and children, are engaged in ASGM activities in more than 70 countries [3,4], producing 20% of the world’s annual gold on the market. Gold extraction is typically performed with little to no mechanical equipment and without proper occupational and environmental safeguards [5]. With next to no technology in place to recover the mercury used in gold extraction, the vast percentage of it is released into the environment [6].
Through ASGM practices, gold is extracted from crushed rocks or soils using mercury in the presence of water. The resultant amalgam is recovered by hand and heated to evaporate the mercury using open fires or blowtorches, ultimately leaving the final gold product [7,8]. Sometimes, the heating takes place in cooking areas of the home and in the presence of house dwellers. Moreover, mercury is also released into the environment through the discharged wastewater that drains into nearby streams, swamps, or soils, where the potential for conversion into the more toxic methyl mercury is highly likely. The release of mercury from tailings into soil and water is a serious hazard to human health because it can contaminate drinking water [9], find its way into the food chain, and compromise food safety [10]. The ASGM activities in many developing countries threaten the health of the miners and their families through the inhalation of mercury vapor, as well as the surrounding communities who consume mercury-contaminated foodstuffs [11]. Despite the aims of the Minamata Convention on Mercury, which came into force in 2017, to curb Hg emissions through, among other actions, the reduction or elimination of its use in artisanal and small-scale gold mining [12,13], ASGM is still the largest anthropogenic source of Hg pollution on Earth [3,14]. It is estimated that about 3000 tons of mercury from ASGM, accounting for 39% of the global mercury pollution, are annually released directly into the environment [15], leading to the pollution of several environmental systems [11].
Mercury is listed among the top 10 most harmful metals by the World Health Organization (WHO), and all its common chemical forms including methylmercury (CH3Hg), elemental or metallic mercury (Hg0), and inorganic mercury are considered a public health concern [16,17]. Mercury can be harmful at very low concentrations because of its high toxicity and ability to bioaccumulate [18,19]. Its bioaccumulation in living organisms is attributed to its strong binding power with the thiol residues in proteins, making it difficult to eliminate from living organisms [20]. Subsequently, in animal bodies, mercury inactivates sulfur, which leads to the inhibition of various enzymes, cofactors, and hormones and, eventually, the development of many ailments [20] such as severe neurological disorders in children and adults [18,21,22]. Mercury can also lead to tremors, movement disorders, psychosis and memory impairment, kidney damage, renal failures, liver and intestinal ulceration, respiratory distress and even death in extreme cases [23,24,25,26,27,28]. In the physical environment, elevated concentrations of mercury threaten ecosystem health by affecting seed germination, plant morbidity and microbial activity [29]. Despite its ecological and toxicological effects to humans, many ASGM miners are still utilizing mercury in gold recovery due to a lack of alternative cost-effective, sustainable, and efficient alternatives [2].
In Uganda, ASGM provides an important source of livelihood for over 20,000 miners in rural communities located in different parts of the country. The use of mercury in ASGM is projected to rise since its use has been perceived to be more profitable than other techniques [2]. As in other developing countries, despite measures to reduce the use of mercury in ASGM, challenges usually emerge that thwart the efforts to regulate this ancestral practice [30]. Moreover, many strategies to avert mercury pollution from ASGM gold mining such as decreasing the direct release of Hg [22], reducing the production of MeHg by dredging Hg-contaminated sediment [31], using in situ capping [32], and converting Hg into less bioaccessible forms [33,34,35] have failed, resulting in their abandonment [36]. The situation has been exacerbated by poor policies for the increasing mercury pollution problem in the ASGM mining sector [37]. Although the use of mercury in ASGM is unlikely to be abandoned in Uganda and several other developing countries, the state of mercury levels in arable soils, plants, and other biota needs to be assessed to ensure the protection of the environment and human health. Here, we present findings of mercury pollution around ASGM mines in Eastern Uganda and the phytoremediation potential of plants thriving in these areas.

2. Materials and Methods
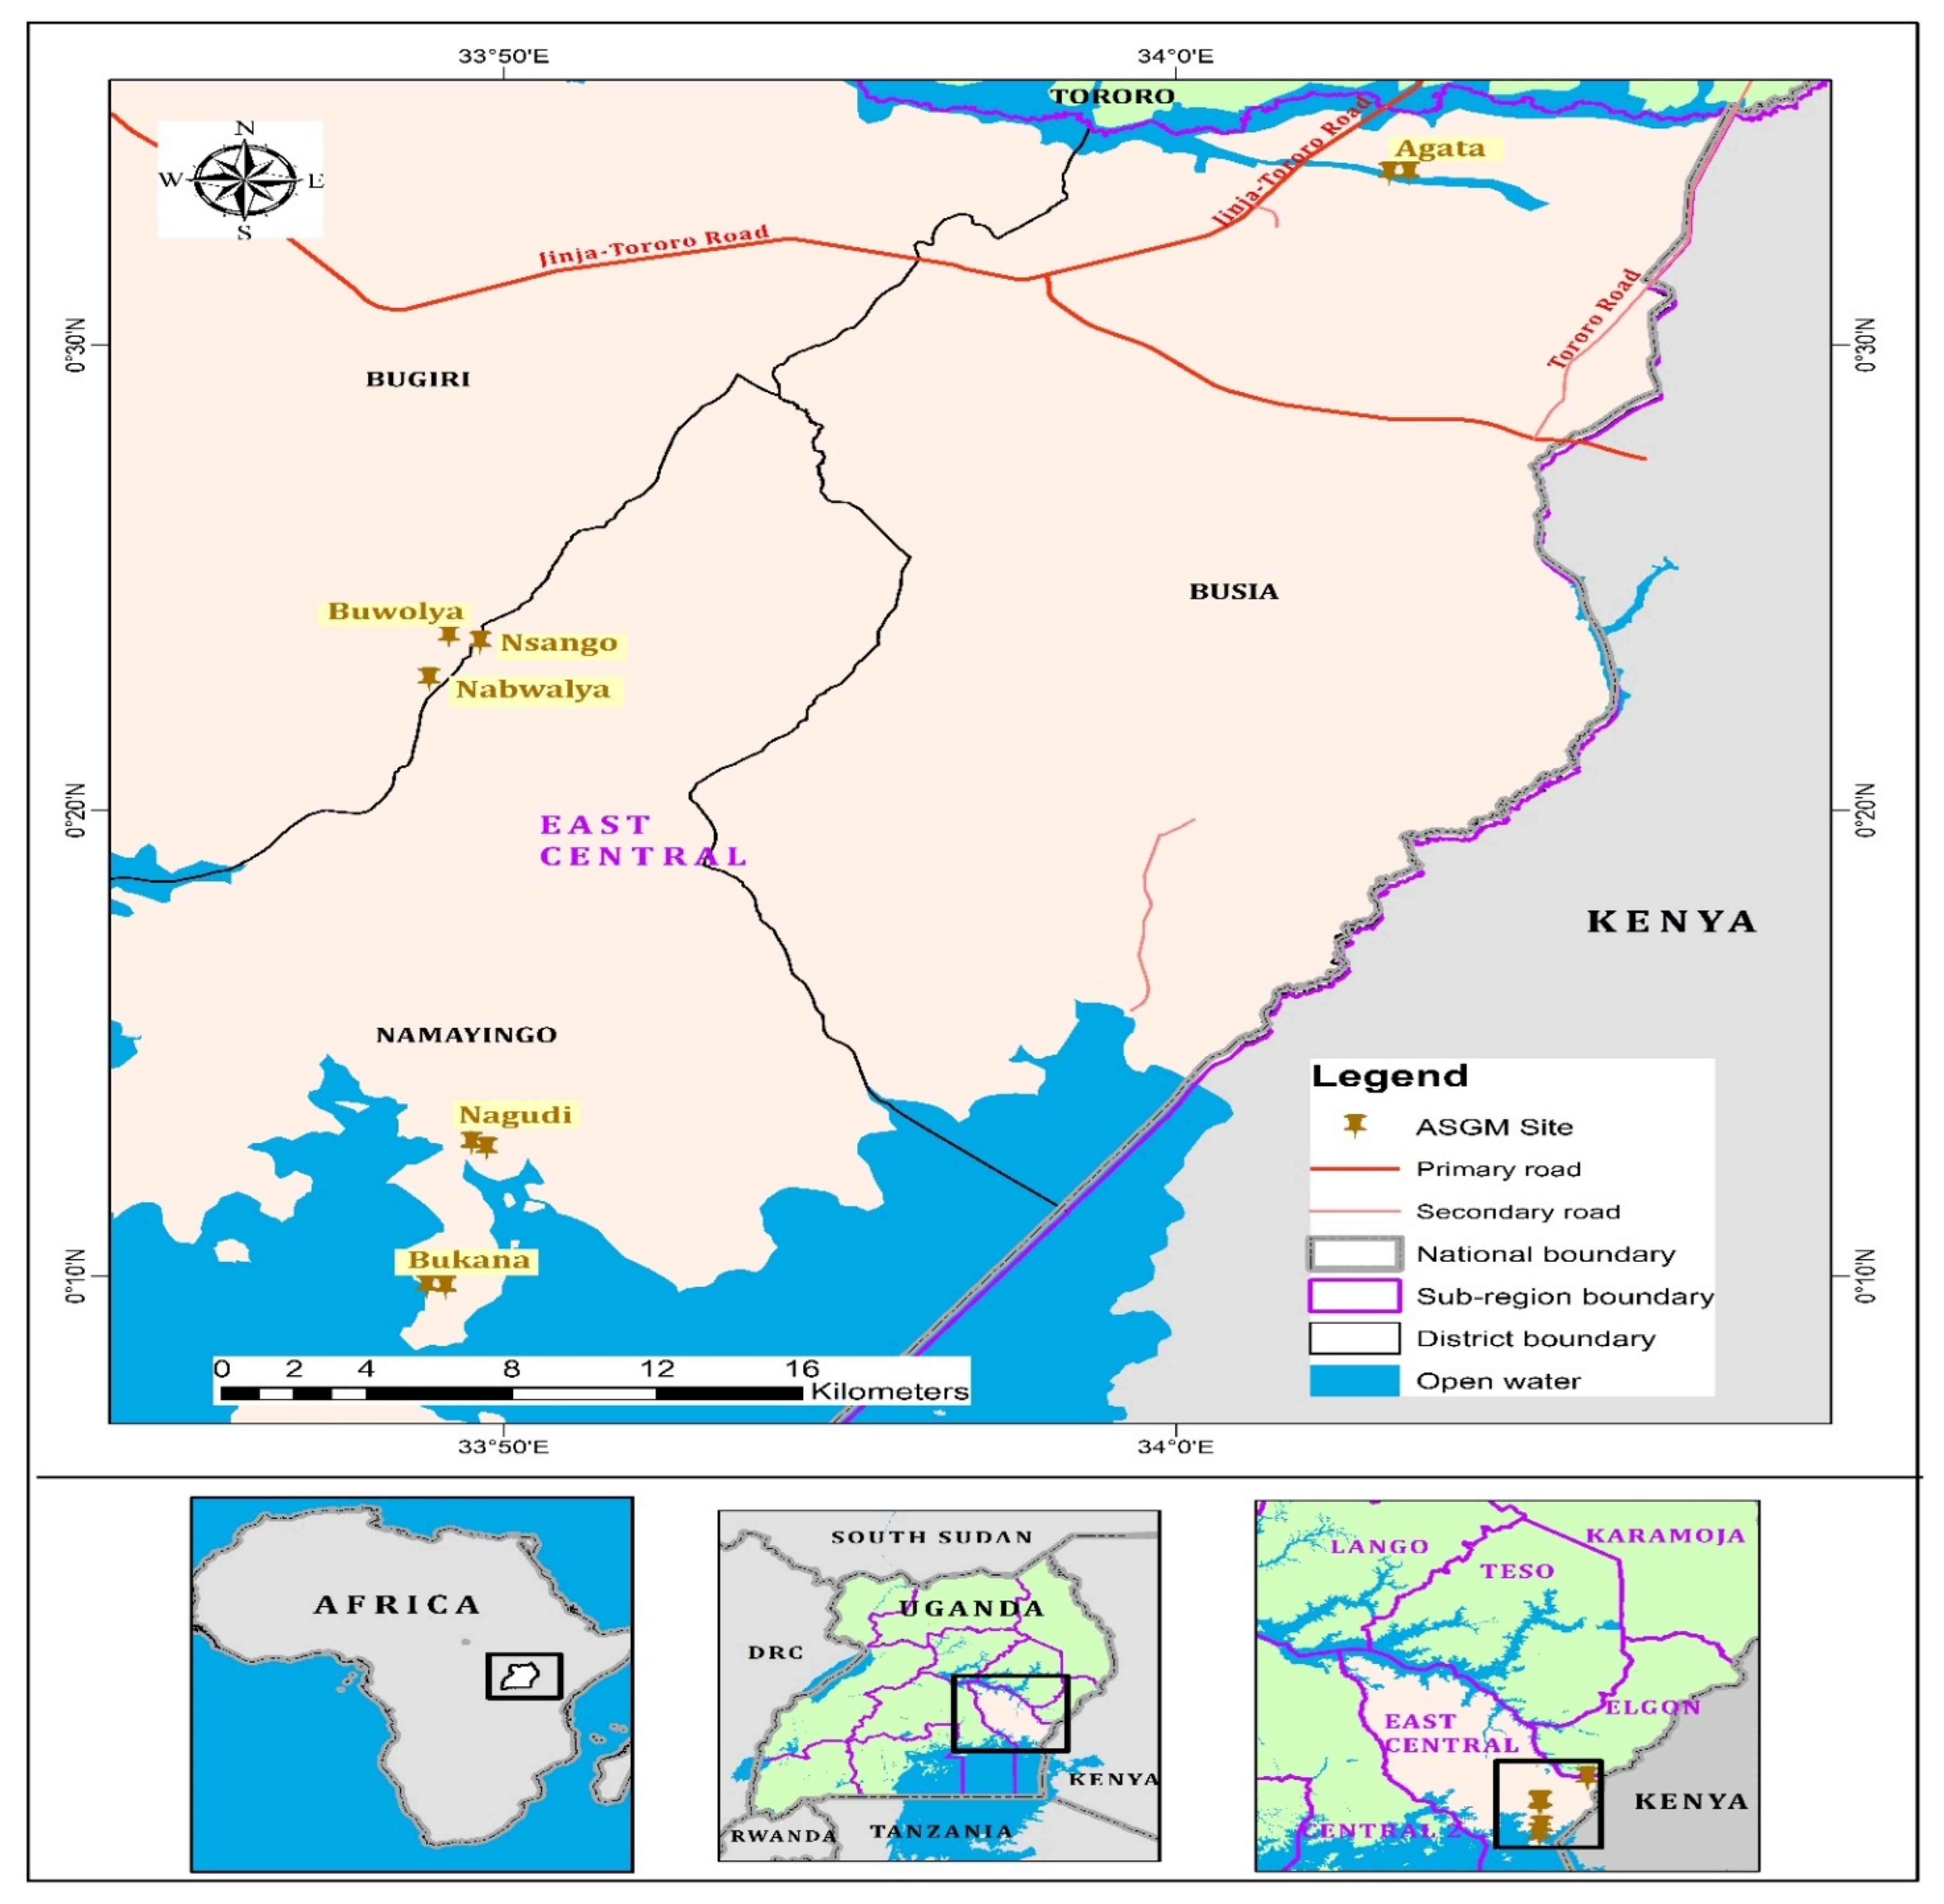
2.1. Study Area

The study was carried out in ASGM sites located in the Bugiri, Busia and Namayingo districts, Eastern Uganda (Figure 1). The area lies within the geographical coordinates of 0°18’58.61” N and 32°34’55.88” E and has an average elevation of 1071 m above sea level. The area experiences a tropical climate, receiving an annual rainfall of about 1000 mm, that is bi-modally distributed, with the wetter periods occurring from March to May and August to November. They experience a mean minimum temperature of 18.5 °C and a mean maximum temperature of 30.8 °C.

2.2. Sampling

Sampling was undertaken between July 2020 and March 2021 in conformity to the national guidelines for the conduction of research in the COVID-19 era established by the Uganda National Council for Science and Technology [38]. Soil, food crops and wild plant samples were collected from sites known to have substantial ASGM activities, including Agata, Bukana, Buwolya, Nabwalya, Nagudi and Nsango, located in the Busia, Namayingo, and Bugiri districts, Eastern Uganda. Soil samples were collected from purposively selected sites in gardens, wetlands and control sites within a radius of 500 m of ASGM activities. For each site, five spots were purposively selected, and soil samples were collected within a depth of 0 to 15 cm using a stainless-steel soil auger and trowel. Similarly, control soil samples were picked from the nearby unpolluted sites, at least 1000 m away from the polluted sites [39]. For each spot, 500 g of the soil sample was transferred into well-labeled sterile zip-lock bag, immediately sealed off and transferred into a cold box. Plant species that were thriving within the polluted areas of the site with potential for phytoremediation or channeling Hg into the food chain were collected following standard procedures described by Martin [40] and then taken to the Makerere University herbarium for identification, where their names were verified using the Plant List database [41]. Within the same radius of 500 m, the edible parts (leaves, tubers, grains, stems and fruits) of food crops were sampled; for wild plants (forage and medicinal plants), leaves were collected since they are the major organs targeted by grazers and herbalists. Each sampled plant part was placed into a well-labelled polythene bag. The plant and soil samples were then transported to the Department of Chemistry and Department of Geology and Petroleum Studies, analytical laboratories, Makerere University, for chemical analysis.

2.3. Preparation of Soil and Plant Sample for Analysis

The soil samples were dried in an oven at 40 °C for several days until they reached a constant dry weight. The dried samples were pulverized to pass through a 2 mm sieve to remove any coarse particles. The plant samples were gently washed with tap water and rinsed several times with de-ionized water to remove all adhering soil particles. After the removal of the impurities, the samples were dried at 40 °C for several days until they reached a constant dry weight. The dry samples were pulverized into fine-grained fractions in a metal free grinding mill and sieved through a 2 mm mesh sieve.

2.4. Determination of pH, EC and OC of Soils

The sieved soil samples were homogenized and then subjected to physico-chemical analysis following the standard methods described by Okalebo et al., 2002 [42]. The soil pH and electrical conductivity (EC) were both measured in a soil:water mixture ratio of 1:2.5. The organic carbon (OC) was determined using the potassium dichromate wet acid oxidation method, followed by titration with ferrous ammonium sulphate [42].

2.5. Determination of Total Mercury Concentration in Plant Samples

Each sieved plant sample (0.250 g) was transferred into a 250 mL conical flask, followed by the addition of concentrated nitric acid (15 mL). The mixture was heated in a fume hood at 80 °C for 1 h, and then it was evaporated until 5 mL was left. The resultant mixture was cooled to room temperature, followed by the addition of H2O2 (30% w/v, 1 mL), and then it was further heated for another 15 min. This procedure was repeated to complete the digestion of the organic matter. The digested sample was cooled and diluted with deionized water to the 100 mL mark. The total Hg concentration in the samples was determined using hydride generation atomic absorption spectroscopy on an Agilent 240 FS spectrophotometer equipped with a hydride generator. All plant samples were analyzed in triplicate. The coefficient of variation for each triplicate was under 10%. The total mercury recovery rate for the plant samples was 90–112%.

2.6. Determination of the Total Mercury Concentration in Soil Samples

Each sieved dry soil sample (1.250 g) was transferred into a 250 mL conical flask, followed by the addition of deionized water (50 mL) and Aqua regia (50 mL). The resultant mixture was heated in a fume hood at 80 °C for 1 h and then evaporated until 5 mL of the mixture was left. The mixture was then cooled to room temperature, followed by the addition of H2O2 (30% w/v, 1 mL), and heated again for another 15 min. This procedure was repeated twice to ensure the complete digestion of the organic matter. The digested sample was cooled, diluted with deionized water to the 100 mL mark, and filtered before final analysis. The total Hg concentration was determined using hydride generation atomic absorption spectroscopy using an Agilent 240FS spectrophotometer equipped with a hydride generator. All soil samples were analyzed in triplicate. The coefficient of variation for each triplicate was within 7%. The total mercury recovery rate for the soil samples was in the range 92–108%.

2.7. Data Analysis

2.7.1. Assessment of Mercury Pollution of Soils

The degree of contamination of soils by Hg was assessed by determining the geoaccumulation index (Igeo). This index has been used to assess heavy metal sediment contamination by Muller [43], Santos Bermejo, Beltrán [44], Saleem, Iqbal [45], Barbieri [46] and Vannini, Grattacaso [47]. The geoaccumulation indices (Igeo) of the soils were determined using Equation (1) in order to characterize them according to their respective mercury pollution levels.
I geo = log   ( C n 1.5   B n )
where Cn is the concentration of Hg in soil (µg/g), 1.5 is the background matrix correction factor introduced to minimize the possible variations in the background values that may be qualified to the lithogenic effect [48], and Bn is the background concentration value of Hg (25 µg/g as quoted by EPA was used). We adopted the geoaccumulation index (Igeo) value scale of Igeo ≤ 0—practically uncontaminated; 0 ≤ Igeo ≤ 1—uncontaminated to moderately contaminated; 1 ≤ Igeo ≤ 2—moderately contaminated; 2 ≤ Igeo ≤ 3—moderately to heavily contaminated; 3 ≤ Igeo ≤ 4—heavily contaminated; 4 ≤ Igeo ≤ 5—heavily to extremely contaminated; and 5 < Igeo—extremely contaminated, as used by Ali, Ali [48].

2.7.2. Statistical Data Analysis

Statistical analyses were performed using R statistical package 4.0.2 [49] and GraphPad Prism 8.0 (GraphPad Software, Inc., San Diego, CA, USA). Prior to any statistical analyses, data distributions were checked for the normality and homogeneity of variances. In case of deviations from normality or homoscedasticity, the statistical assumptions of the analysis were fulfilled by log-transformation, but actual values are used in data presentation. Variability in means among parameters was analyzed with an analysis of variance (ANOVA), followed by a post-hoc test (Tukey’s Honest Significant Multiple Comparison) in case of significant variations, with means considered to be significantly different at p < 0.05.

3. Results

3.1. Physico-Chemical Characteristics of the Soils

The soil pH insignificantly varied (df = 6, F = 1.929, p= 0.128) among the samples, ranging between 6.27 and 6.70 (Table 1). However, significant variations were observed for organic carbon content (df = 6, F= 3.774, p = 0.012) and electrical conductivity (df = 6, F = 66.7, p < 0.01), which, respectively, ranged between 1.19 and 2.53 g/100 g and between 82.17 and 387.38 mS/cm for the different soils.

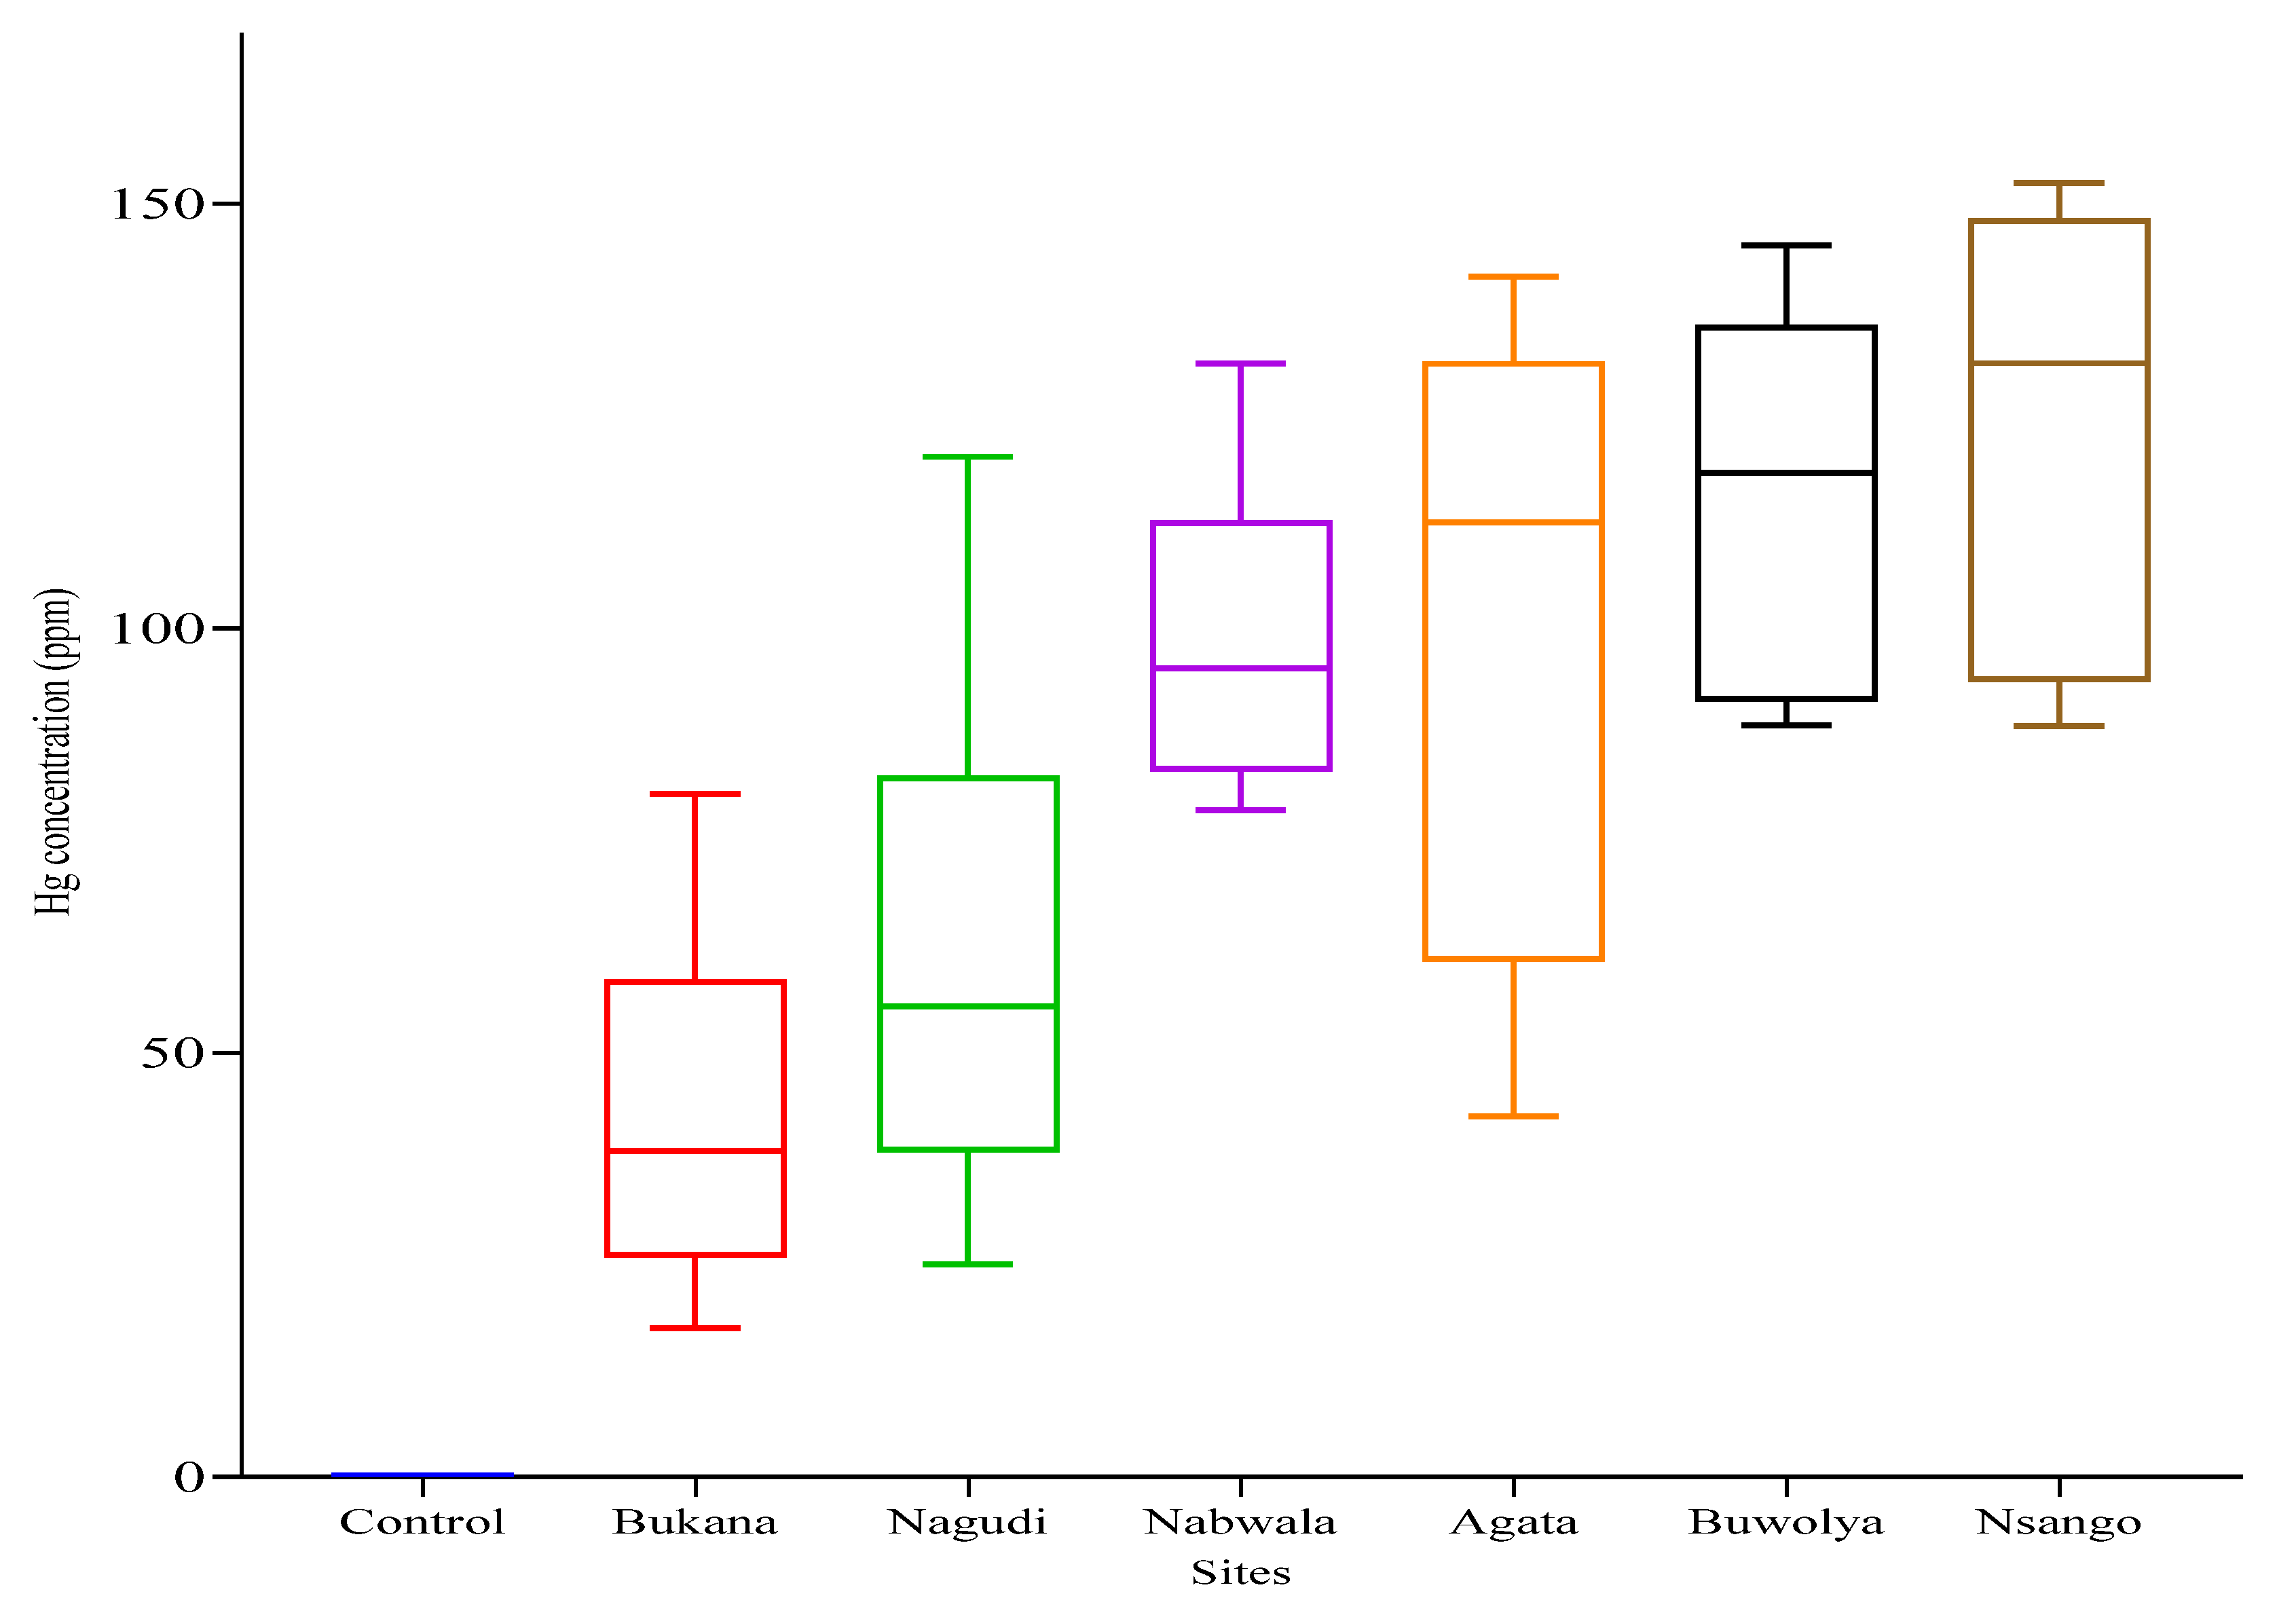
3.2. Mercury Levels in Soils

Results for the levels of mercury in the different soil samples are presented in Figure 2. Soils picked from the studied ASGM sites had high median concentrations of mercury that were 723.7–2067.2 folds higher than that of the control soil that was picked 1000 m away from the mining sites. The total concentration of mercury significantly varied across the sites (one-way ANOVA, p < 0.01), with the lowest total median mercury concentration recorded at the Bukana site and highest at the Nsango site (Figure 2). At the control, Bukana, Nagudi, Nabwala, Agatta, Buwolya and Nsango sites, the mercury concentrations, respectively, ranged between 0.032 and 0.091 ppm, 17.5 and 80.5 ppm, 25.0 and 120.2 ppm, 78.6 and 131.2 ppm, 42.5 and 141.4 ppm, 88.6 and 145.1 ppm, and 88.6 and 146.7 ppm. The median mercury soil concentrations were, respectively, 144.7, 203.9, 328.7, 336.6, 386.3, and 413.4 folds higher for the Bukana, Nagudi, Nabwala, Agata, Buwolya and Nsango sites than the permissible level of 0.3 ppm [50].

3.3. Geoaccumulation Index (Igeo) for the Soils

The geoaccumulation index (Igeo) values for the different sites were in the range of 1.1–3.3, indicating the moderate to heavy mercury contamination of the soils. According to the indices presented in Table 2, soils from Agata, Buwolya, Nabwala and Nsango were heavily contaminated with mercury and those from Bukana and Nagudi were moderately contaminated with mercury.

3.4. Mercury Levels in Food Crops

A total of nine edible plant species were identified from the study area and harvested, mainly targeting the edible parts. The total concentration of mercury in the edible plants varied widely across the species, mining site, and organs of the species, ranging between 0.004 and 133.18 ppm, as shown in Table 3. Significantly higher concentrations of mercury were recorded in both the leaves and tubers of Colocassia esculentum at Agata and in the tubers of the same species at Nagudi. Surprisingly, the mercury content in the tubers of C. esculentum at Nagudi was significantly (Tukey’s HSD test, p < 0.05) and several folds lower than that of the leaves compared with the levels at Nsango and Agata, where the contents were comparable for the two organs. At the Agata site, the total mercury concentration in the edible plant tissues significantly varied (one-way ANOVA, df = 6, F = 4.42, p = 0.007), with the highest concentration recorded in the tubers of Colocassia esculentum and the lowest concentration recorded in the grains of Zea mays.
The mercury concentrations in Amaranthus dubius, C. esculentum, and Ipomoea batatas were, respectively, 51, 133, and 36 folds higher than the upper limit of the total permissible mercury levels in food (0.5–1 ppm—Codex Alimentarius; 0.1 ppm—European Union). The rest of the plant species sampled from Agata had concentrations that were within permissible mercury levels for food crops. The mercury levels in the food crops collected from Bukana also varied significantly (df = 8, F = 2.36, p = 0.05), ranging between 0.044 ppm for Amaranthus dubius leaves and 50.33 ppm for Ipomoea batatas tubers. The results showed that with the exception of Amaranthus dubius, all the food plant species sampled at this site had concentrations that were 28 to 50 folds higher than the permissible levels of mercury in food. At Nagudi (df = 10, F = 381, p < 0.0001) and Nsango (df = 6 F = 2.50.9, p < 0.0001), the mercury levels in food crops also varied significantly, with isolated higher levels in C. esculentum leaves and Saccharum officinarum stems at Nagudi and Ipomoea batatas leaves at Nsango. The other food plant species at Nagudi and Nsango had mercury concentrations that were within the permissible levels. It is worth mentioning that the areal parts of some food crops exhibited higher mercury levels than the roots. For example, compare the levels of mercury in the leaves and tubers for Colocassia esculentum at Nagudi and Ipomoea batatas at Nsango (Table 3). The observed higher levels of mercury in the exposed parts could be partly attributed to atmospheric deposition.

3.5. Mercury Levels in Wild Plant Species

A total of 21 wild plant species were collected from spots drained by wastewaters released from the gold extraction process and areas close to active ASG mines. The total mercury content in the wild plants varied widely, ranging from 0.027 ppm in Hyptis suaveolens at Nagudi to 868 ppm for Guizotia scabra at Agata (Table 4). The study revealed significant variations in the mercury levels of wild plants at the Nabwala (df = 3 F = 680.3, p < 0.0001), Bukana (df = 7 F = 984.1, p < 0.0001), Agata (df = 7 F = 529, p < 0.001), and Nagudi sites (df = 4 F = 2263.9, p < 0.0001). At the Agata site, Guizotia scabra accumulated the highest concentration of mercury, which was significantly higher than that of all the other species (Tukey’s test, p < 0.05), followed by Fuirena umbellate, Cyperus difforms, Cyperus fuuminalis, Cyperus digitatus, Cycnium tenuisectum and Typha domingensis. Many of the encountered species were sedges thriving in the stagnant, polluted water that were released after washing. Wider variations in mercury accumulation were also evident for the Bukana site, ranging between 0.028 for Conyza sumatrensis and 91.70 ppm for Typha capensis. The species of Cyperus fuuminalis, Cyperus articulates and Solanum incanum had higher concentrations of mercury but were not significantly different (Tukey’s test, p < 0.05). The species encountered at the Nagudi site accumulated concentrations of mercury that were several folds lower than those accumulated by species collected from the Agatta and Bukana sites, ranging between 0.027 ppm for Hyptis suaveolens and 0.59 ppm for Ricinus communis. At the Nabwala site, the total mercury accumulation levels were lower for Cynodon dactylon and Cyperus dives, but the results for Cyperus difforms and Hyggrophila sp. were comparable and within the accumulation ranges of the Agatta and Bukana sites.

4. Discussion

4.1. Soil Physico-Chemical Characteristics

The mean soil pH range of 6.27 to 6.70 recorded in this study was within the range characterized to be neutral [51,52] and known to limit the desorption and availability of mercury [53,54]. The minimal variation in the soil pH of the polluted and control soils could suggest that ASGM activities do not significantly affect the soil pH and, therefore, the bioavailability of mercury for absorption into plant species. This study revealed significant variations in organic carbon and electrical conductivity. However, the variations could not be associated with ASGM activities since the control site had OC and EC values that were comparable to those of polluted sites. With a nearly neutral soil pH, sites such as Agata, Bukana, and Nagudi with significantly higher OC values could have a significant amount of the mercury released onto their soil immobilized due to S-Hg binding and decreased Hg solubility and availability.

4.2. Mercury Accumulation in Food Crops and Wild Plants

This study revealed soil mercury levels that were 723.7–2067.2 folds higher than those of the unpolluted soils. The soil mercury levels were also 144.7–413.4 folds higher than the permissible level of 0.3 ppm set by the FAO and WHO [50]. Mercury is naturally present in soils at concentrations ranging between 0.003 and 4.6 mg kg−1 [55] and, in most cases, below 0.5 mg kg−1 [56]. Thus, the median mercury concentrations of the site were also several folds higher that natural mercury concentration. Based on the mercury concentration ranges for each site, the distribution of mercury was highly heterogenous, with highest mercury concentrations observed in samples picked from discharge points and drained wetland spots. Soil plays an important role in biogeochemical Hg circulation because it accumulates this element and is a source of other environmental components [57]. Thus, soil mercury pollution mitigation measures should be scaled up to minimize the widespread contamination of other ecosystems within ASGM mining areas.
Plants are widely used in the environmental monitoring of Hg pollution [58] since they can accumulate mercury through multiple pathways such as stomatal and cuticular uptake in foliage [59,60,61], the surface adsorption of atmospheric Hg to foliage [62], and the soil uptake of Hg through roots [63,64,65]. In the current study, we strategically sampled plants that were growing at ASGM areas, including food crops, medicinal plants and forage plants, to determine their mercury accumulation levels and potential for channeling mercury into the human food chain. The study revealed elevated concentrations of mercury in most of the plants sampled and analyzed, with the leaves of most species exhibiting higher concentrations than the underground organs. The same pattern of mercury accumulation was reported in medicinal plants that were analyzed by Ordak, Wesolowski [66] in Poland. Studies have shown that the main source of Hg observed in plant leaves is air pollution with Hg0 and not soil contamination [67,68,69]. Thus, the observed higher leaf contents of mercury could be attributed to the vaporization of mercury by heating during the recovery of gold from the amalgam, which is then accumulated in the leaves through the stomata from the atmosphere and through the foliar adsorption of wet and dry deposited Hg [70]. This argument is supported by evidence from flux measurements [69,71,72,73] and stable Hg isotope analyses [74,75,76] that revealed approximately 90% of Hg in leaves to be derived from the atmospheric uptake of gaseous Hg(0) and that the translocation of Hg from soils to above-ground tissues is limited [77]. This is also supported by earlier findings by Ericksen and Gustin [78] that more than 95−99% of Hg taken up by the roots remains in them and is not translocated to the leaves. Thus, this presupposes that limiting the release of gaseous mercury to the atmosphere could substantially reduce the mercury accumulation in economically important plants and thus reduce the health risk they pose to human beings.
Some studies have reported that crops such as vegetables are potential sources of Hg exposure for people living in Hg mining areas [79]. In the current study, edible portions of the crops commonly grown around ASGM sites were analyzed for mercury accumulation to evaluate their Hg exposure risk for humans. The study revealed severe contamination in 47% of the crops that were analyzed to levels that were exceedingly higher than the FAO/WHO permissible mercury level of 0.5 µg/g of w.w [80,81]. This is in accordance with earlier studies by Hindersah, Risamasu [82], Mahmud, Lihawa [83], and Sari, Inoue [84] which reported the excessive accumulation of mercury (also above the FAO/WHO and other international regulatory limits) in vegetable and other plants growing near ASGM sites. Notably high accumulations were recorded in habitually consumed vegetables of Amaranthus dubius and Brassica oleracea and tubers of Colocassia esculentum and Ipomoea batatas, thus posing a higher risk of exposure for the communities surrounding ASGM activities who consume contaminated foodstuffs. The cultivation of crops within and close to polluted ASGM sites could be caused by the lack of information among miners and non-miners about the toxicological effects mercury, which calls for the massive sensitization of these communities about the consequences of the consumption of mercury-contaminated foods and enforcement of compliance to regulatory policies.
According to the critical limits for Hg related to ecotoxicological effects on plants, the Hg levels in forage plants can be divided into three categories: high (>3 µg/g), low–moderate (0.1–3.0 µg/g), and low (0.1 µg/g) [85]. With the exception of Typha domingensis at Agata and Conyza sumatrensis and Tilliodes corchorus at Bukana, all wild plants species at the two sites had Hg forage concentrations that were above the high ecotoxicological limit. At the Nagudi ASGM site, all wild plants species exhibited Hg forage levels below the high ecotoxicological limit. A similar trend was observed at the Nsango ASGM site, with the exception of Cyperus difforms Hyggrophila sp. Furthermore, the level of mercury in a plant should not be higher than 20 ng/g (0.02 ppm) [86,87], and all the analyzed plant species had Hg concentrations that were well above this limit, so they were classified as polluted. The contaminated wild plants could channel mercury into the human food chain when used as medicinal plants and when grazed on by domestic animals. Medicinal plants have been reported to introduce toxic elements to the human body and impair its normal function [66]. The present study was conducted in poor rural ASGM communities that heavily depend on medicinal plants for their primary healthcare due to limited access to medical facilities and the high cost of medical supplies. Most of the medicinal plants such as Guizotia scabra (868.33 ppm), Solanum macranthum (65.20 ppm), Typha capensis (91.70 ppm) and Sida rhombifolia (22.7 ppm) exhibited concentrations that were several folds higher than the national limits of mercury in herbal materials of 0.2 ppm for Canada and 0.5 ppm for China, Malaysia, and Singapore [88]. Thus, the utilization of the medicinal plants thriving around ASGM areas pose a risk of mercury bioaccumulation in humans, which could lead to the emergence of severe neurological disorders and immune-deficiencies even at very low levels of long-term exposure [89].

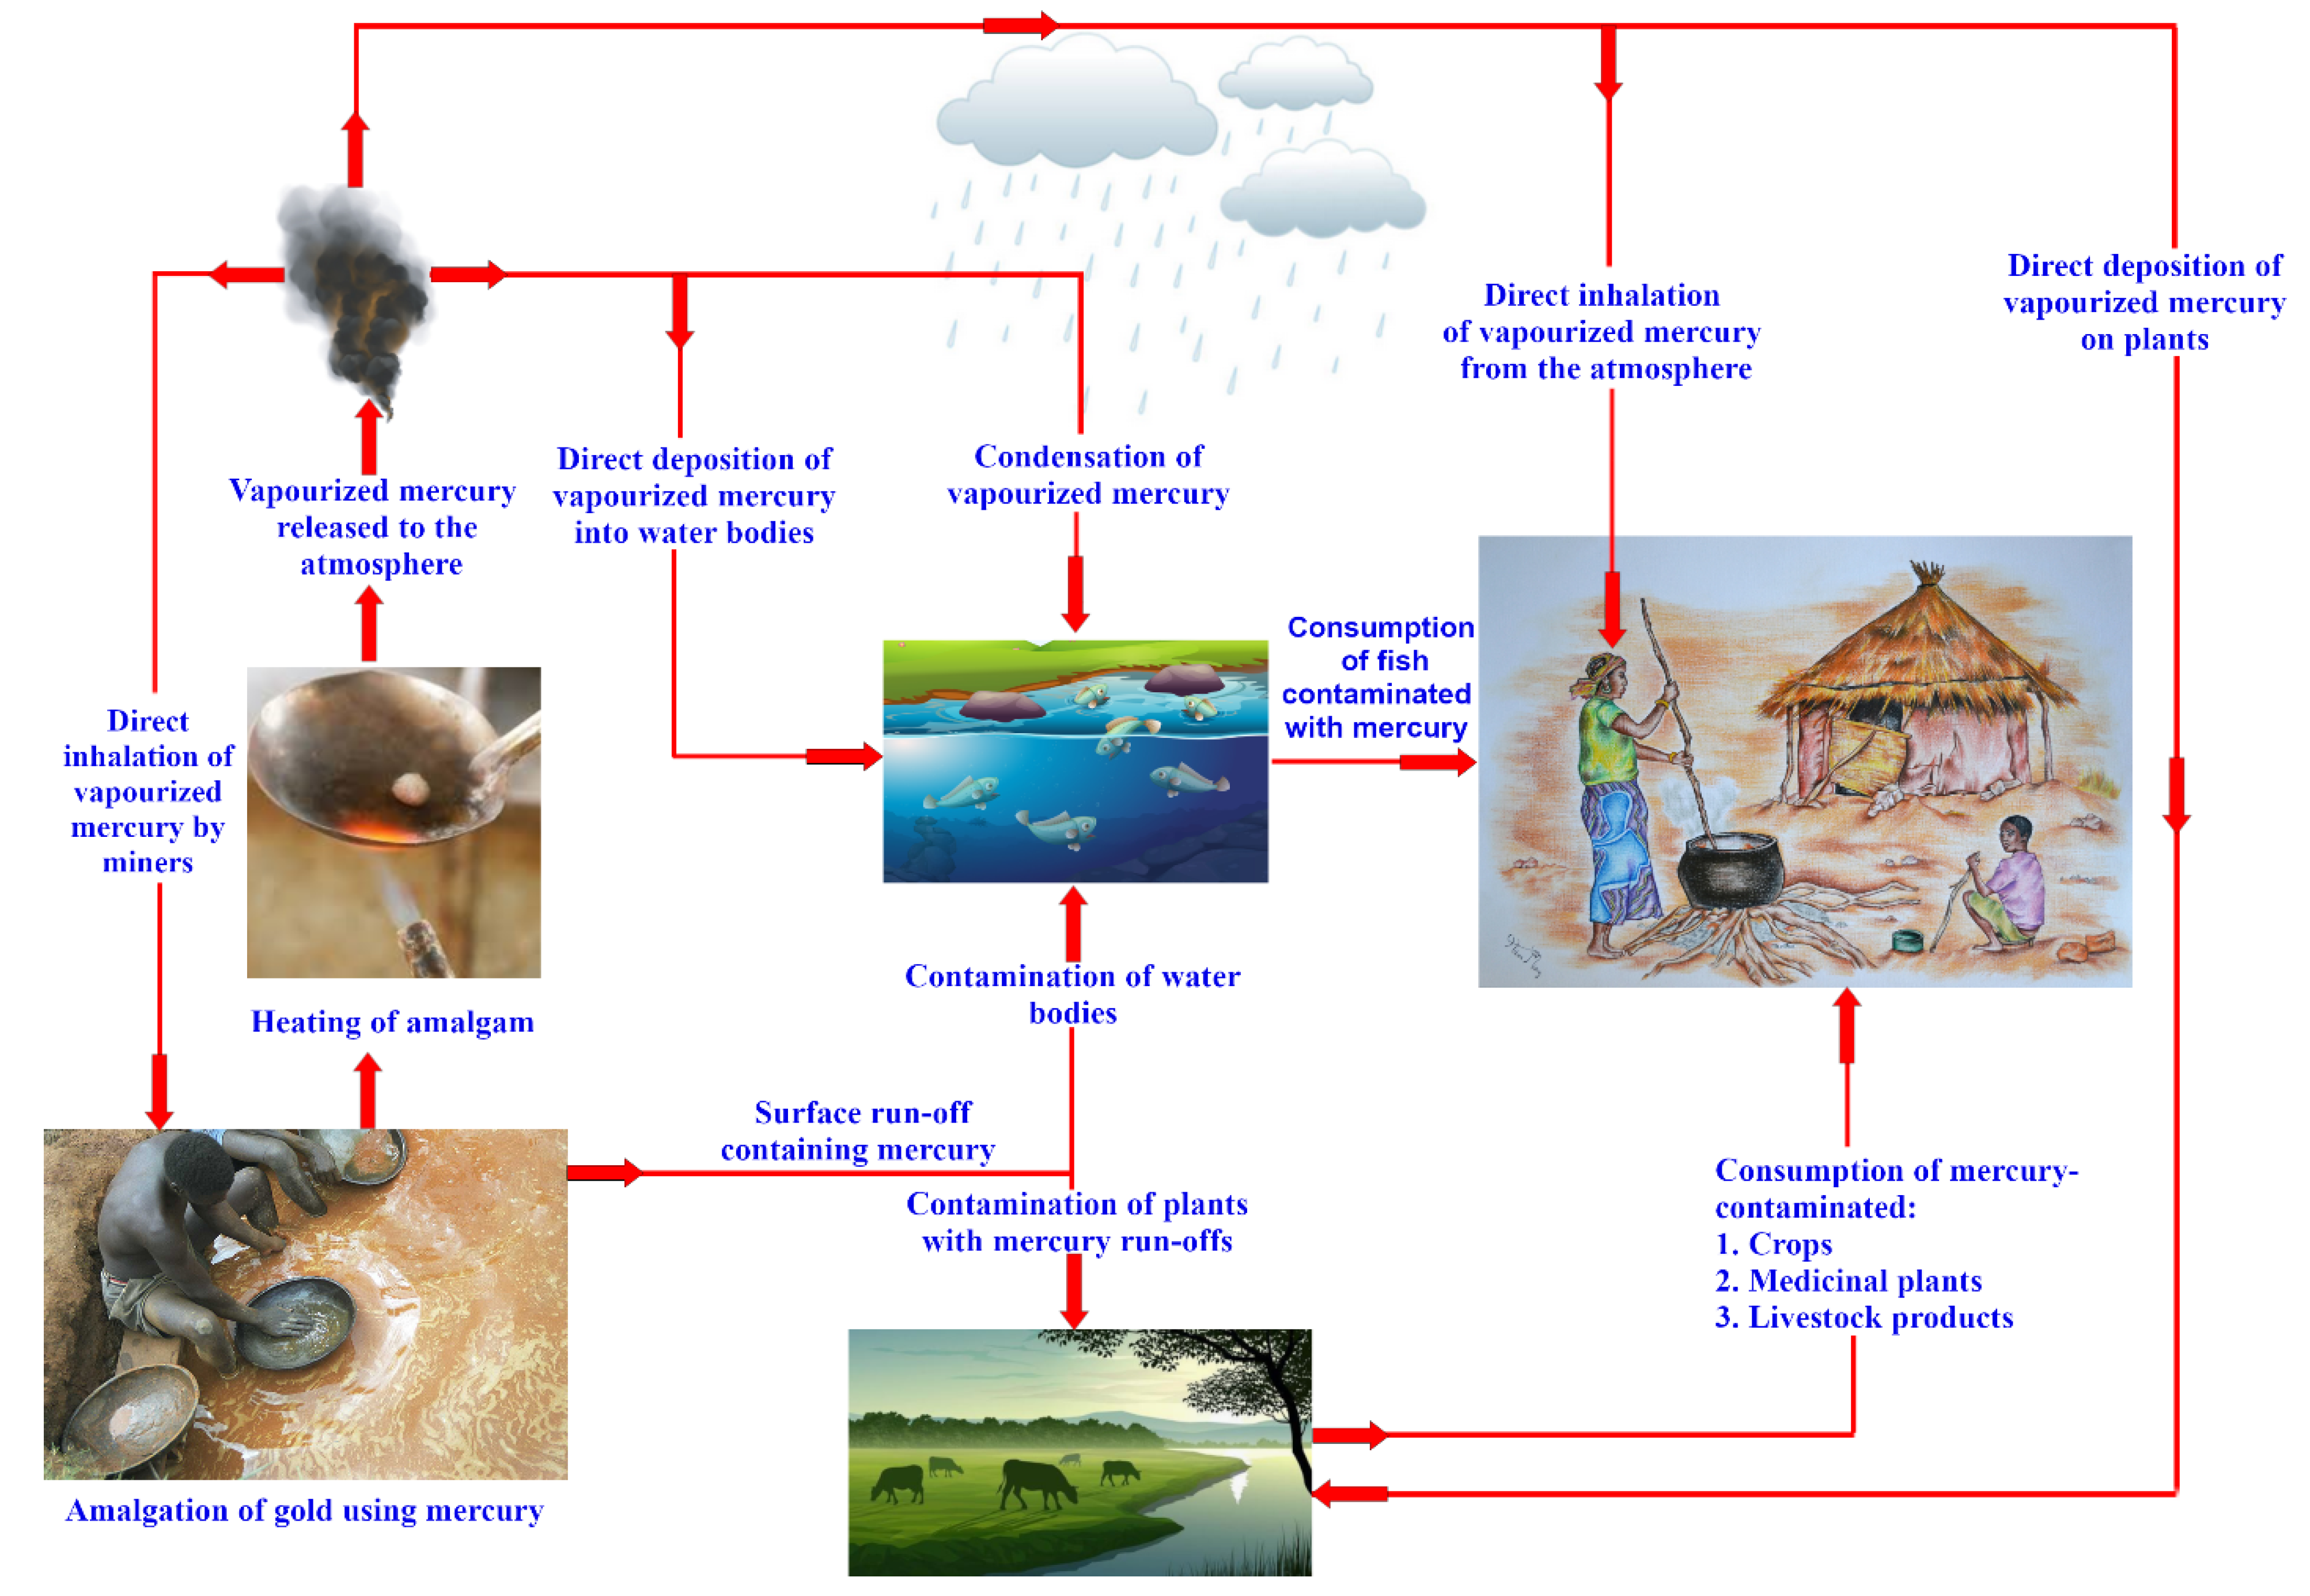
4.3. Mercury Exposure Routes in ASGM Areas

According to Koch, Haller [90], occupational and environmental exposure to metallic Hg can occur during various steps in the mining process and along multiple exposure pathways. We observed a number of ASGM activities through which mercury was released to the environment and potential exposure routes through which mercury could be channeled into the bodies of both miners and non-miners, as illustrated in Figure 3.
The direct inhalation of mercury during the roasting of the amalgam to recover gold without any protective equipment such as respirators, gloves, and chemical protective clothes was evident. In the ASGM process, the inhalation of mercury vapor during amalgamation burning has been pointed out to be the most critical exposure rout to the miners [85]. As it is everywhere in Africa and many parts of Asia, ASGM is practiced by poor rural communities in Uganda who are known to depend on household farming for food and medicinal plants for the management of ailments. This study revealed the higher mercury contamination of these communities’ cultivated fields, crops, and forage and medicinal plants.

4.4. Potential of Wild Plants in Phytoremediation of Mercury Contaminated Soils

Evident from the study was that a number of sedge species were thriving in sites flooded with wastewaters released from ASGM activities. These included Cyperus articulates, Cyperus difforms, Cyperus digitatus, Cyperus dives, Cyperus fuuminalis, Cyperus rotundus, Fuirena umbellata and Typha capensis. Generally, these sedges exhibited significantly higher mercury levels compared with other plant species growing in the same locality (Table 4). Indeed, sedges have been identified as the one suitable plant species that can be adopted to design engineered wetlands to remove pollutants from wastewaters [91,92,93]. These species are potential plant candidates for use in engineered wetlands to remove mercury from wastewaters through different phytoremediation approaches including phytoextraction, rhizofiltration and phytostabilization. Unfortunately, their phytoremediation role has not been well-explored [94]. Thus, studies aimed at establishing their mercury phytoremediation potential are still required. This could pave way for designing wetland technologies that could be adopted to remove mercury from wastewaters at the many ASGM sites in Uganda and other developing countries to control the currently obstinate mercury pollution problem.

5. Concluding Remarks

This study demonstrates minimal compliance to mercury usage and management guidelines in ASGM areas, which suggests a high risk of mercury exposure to the miners and nearby non-miners. The discernible key exposure routes in the studied ASGM areas were the vaporization of mercury during the heating of the amalgam to recover gold and the consumption of contaminated foodstuffs. The results of this study showed that soils, food crops and medicinal plants in the studied ASGM areas were contaminated with mercury to levels that were well above the international regulatory and ecotoxicological limits. Interestingly, a number of sedges thriving in spots drained by mercury-polluted wastewaters from ASGM activities exhibited a higher mercury accumulation potential than other plants growing in the same area. These sedges are suitable candidate species for the design of wetland ecosystems that can be rolled out to ASGM sites in Uganda and other developing countries to remove mercury through a combination of rhizofiltration, phytoextraction and phytostabilization, before the final release of wastewaters into the environment. Further, teaching communities about mercury’s toxicological effects and enforcing mercury-use regulation should be emphasized to minimize environmental pollution in ASGM areas.

Author Contributions

J.E.S., B.N. and E.T. participated in the experimental design and coordination of laboratory activities. J.E.S., D.K. and E.T. participated in the sample preparation and sample analysis. J.E.S., B.N., J.K., A.S.M., D.K. and E.T. participated in the data analysis and writing of the manuscript. All authors have read and agreed to the published version of the manuscript.

Funding

The work was financially supported by the Government of Uganda and Makerere University under the Makerere University Research and Innovation Fund (Mak-RIF).

Institutional Review Board Statement

Not appliable.

Informed Consent Statement

Not appliable.

Data Availability Statement

The data will be made available on request.

Conflicts of Interest

The authors declare that they have no competing interests or relationships that could have influenced the work reported in this article.

References

  1. Wanyana, M.W.; Agaba, F.E.; Sekimpi, D.K.; Mukasa, V.N.; Kamese, G.N.; Douglas, N.; Ssempebwa, J.C. Mercury Exposure Among Artisanal and Small-Scale Gold Miners in Four Regions in Uganda. J. Health Pollut. 2020, 10, 200613. [Google Scholar] [CrossRef] [PubMed]
  2. NAPE. Promoting Mercury-Free Technology in Small-Scale Gold Mining (SGMS) Sector in Uganda. 2018. Available online: https://nape.or.ug/publications/chemical-management/84-promoiting-mercury-free-technology-in-asgm-sactor-in-uganda/file (accessed on 22 June 2022).
  3. Esdaile, L.J.; Chalker, J.M. The mercury problem in artisanal and small-scale gold mining. Chem.–A Eur. J. 2018, 24, 6905–6916. [Google Scholar] [CrossRef] [PubMed] [Green Version]
  4. Krisnayanti, B.D. ASGM status in West Nusa Tenggara Province, Indonesia. J. Degrad. Min. Lands Manag. 2018, 5, 1077. [Google Scholar] [CrossRef] [Green Version]
  5. Pavilonis, B.; Grassman, J.; Johnson, G.; Diaz, Y.; Caravanos, J. Characterization and risk of exposure to elements from artisanal gold mining operations in the Bolivian Andes. Environ. Res. 2017, 154, 1–9. [Google Scholar] [CrossRef] [PubMed]
  6. Clifford, M.J. Assessing releases of mercury from small-scale gold mining sites in Ghana. Extr. Ind. Soc. 2017, 4, 497–505. [Google Scholar] [CrossRef]
  7. Gibb, H.; O’Leary, K.G. Mercury exposure and health impacts among individuals in the artisanal and small-scale gold mining community: A comprehensive review. Environ. Health Perspect. 2014, 122, 667–672. [Google Scholar] [CrossRef]
  8. Harari, R.; Harari, F.; Gerhardsson, L.; Lundh, T.; Skerfving, S.; Stromberg, U.; Broberg, K. Exposure and toxic effects of elemental mercury in gold-mining activities in Ecuador. Toxicol. Lett. 2012, 213, 75–82. [Google Scholar] [CrossRef]
  9. Salazar-Camacho, C.; Salas-Moreno, M.; Marrugo-Madrid, S.; Marrugo-Negrete, J.; Diez, S. Dietary human exposure to mercury in two artisanal small-scale gold mining communities of northwestern Colombia. Environ. Int. 2017, 107, 47–54. [Google Scholar] [CrossRef]
  10. Riaz, A.; Khan, S.; Muhammad, S.; Liu, C.; Shah, M.T.; Tariq, M. Mercury contamination in selected foodstuffs and potential health risk assessment along the artisanal gold mining, Gilgit-Baltistan, Pakistan. Environ. Geochem. Health 2018, 40, 625–635. [Google Scholar] [CrossRef]
  11. Gyamfi, O.; Sørensen, P.B.; Darko, G.; Ansah, E.; Vorkamp, K.; Bak, J.L. Contamination, exposure and risk assessment of mercury in the soils of an artisanal gold mining community in Ghana. Chemosphere 2021, 267, 128910. [Google Scholar] [CrossRef]
  12. Coulter, M.A. Minamata convention on mercury. Int. Leg. Mater. 2016, 55, 582–616. [Google Scholar] [CrossRef]
  13. Qi, J.; Wang, Y.; Liang, S.; Li, Y.; Li, Y.; Feng, C.; Xu, L.; Wang, S.; Chen, L.; Wang, D.; et al. Primary Suppliers Driving Atmospheric Mercury Emissions through Global Supply Chains. One Earth 2019, 1, 254–266. [Google Scholar] [CrossRef] [Green Version]
  14. USEPA. Mercury Emissions: The Global Context. 2020. Available online: https://www.epa.gov/international-cooperation/mercury-emissions-global-context (accessed on 19 June 2021).
  15. Appel, P.W.; Esbensen, K.H. Reducing global mercury pollution with simultaneous gold recovery from small-scale mining tailings. TOS Forum 2019, 2020, 3–9. [Google Scholar] [CrossRef]
  16. Kessler, R.C.; Aguilar-Gaxiola, S.; Alonso, J.; Benjet, C.; Bromet, E.J.; Cardoso, G.; Degenhardt, L.; de Girolamo, G.; Dinolova, R.V.; Ferry, F.; et al. Trauma and PTSD in the WHO World Mental Health Surveys. Eur. J. Psychotraumatology 2017, 8, 1353383. [Google Scholar] [CrossRef] [PubMed] [Green Version]
  17. Soe, P.S.; Kyaw, W.T.; Arizono, K.; Ishibashi, Y.; Agusa, T. Mercury Pollution from Artisanal and Small-Scale Gold Mining in Myanmar and Other Southeast Asian Countries. Int. J. Environ. Res. Public Health 2022, 19, 6290. [Google Scholar] [CrossRef] [PubMed]
  18. Ronchetti, R.; Zuurbier, M.; Jesenak, M.; Koppe, J.G.; Ahmed, U.F.; Ceccatelli, S.; Villa, M.P. Children’s health and mercury exposure. Acta Paediatr. 2006, 95, 36–44. [Google Scholar] [CrossRef]
  19. Sharma, A.; Sharma, A.; Arya, R.K. Removal of Mercury (II) from Aqueous Solution: A Review of Recent Work. Sep. Sci. Technol. 2015, 50, 1310–1320. [Google Scholar] [CrossRef]
  20. Mathieson, P.W. Mercury: God of Th2 cells? Clin. Exp. Immunol. 1995, 102, 229–230. [Google Scholar] [CrossRef]
  21. Rice, K.M.; Walker, E.M., Jr.; Wu, M.; Gillette, C.; Blough, E.R. Environmental mercury and its toxic effects. J. Prev. Med. Public Health 2014, 47, 74–83. [Google Scholar] [CrossRef]
  22. Liu, P.; Ptacek, C.J.; Blowes, D.W.; Finfrock, Y.Z.; Gordon, R.A. Stabilization of mercury in sediment by using biochars under reducing conditions. J. Hazard. Mater. 2017, 325, 120–128. [Google Scholar] [CrossRef] [Green Version]
  23. Park, J.-D.; Zheng, W. Human exposure and health effects of inorganic and elemental mercury. J. Prev. Med. Public Health 2012, 45, 344–352. [Google Scholar] [CrossRef] [PubMed]
  24. Bose-O’Reilly, S.; Schierl, R.; Nowak, D.; Siebert, U.; William, J.F.; Owi, F.T.; Ir, Y.I. A preliminary study on health effects in villagers exposed to mercury in a small-scale artisanal gold mining area in Indonesia. Environ. Res. 2016, 149, 274–281. [Google Scholar] [CrossRef] [PubMed] [Green Version]
  25. Solis, M.T.; Yuen, E.; Cortez, P.S.; Goebel, P.J. Family poisoned by mercury vapor inhalation. Am. J. Emerg. Med. 2000, 18, 599–602. [Google Scholar] [CrossRef]
  26. Shahid, M.; Khalid, S.; Bibi, I.; Bundschuh, J.; Niazi, N.K.; Dumat, C. A critical review of mercury speciation, bioavailability, toxicity and detoxification in soil-plant environment: Ecotoxicology and health risk assessment. Sci. Total Environ. 2020, 711, 134749. [Google Scholar] [CrossRef]
  27. Mahbub, K.R.; Krishnan, K.; Naidu, R.; Andrews, S.; Megharaj, M. Mercury toxicity to terrestrial biota. Ecol. Indic. 2017, 74, 451–462. [Google Scholar] [CrossRef]
  28. Jyothi, N.R.; Farook, N.A.M. Mercury toxicity in public health. Heavy Met. Toxic. Public Health 2020, 1–12. [Google Scholar] [CrossRef] [Green Version]
  29. Liu, S.; Wang, X.; Guo, G.; Yan, Z. Status and environmental management of soil mercury pollution in China: A review. J. Environ. Manag. 2021, 277, 111442. [Google Scholar] [CrossRef]
  30. Diaz, F.A.; Katz, L.E.; Lawler, D.F. Mercury pollution in Colombia: Challenges to reduce the use of mercury in artisanal and small-scale gold mining in the light of the Minamata Convention. Water Int. 2020, 45, 730–745. [Google Scholar] [CrossRef]
  31. Bloom, N.; Lasorsa, B.K. Changes in mercury speciation and the release of methyl mercury as a result of marine sediment dredging activities. Sci. Total Environ. 1999, 237, 379–385. [Google Scholar] [CrossRef]
  32. Randall, P.M.; Fimmen, R.; Lal, V.; Darlington, R. In-situ subaqueous capping of mercury-contaminated sediments in a fresh-water aquatic system, Part I—Bench-scale microcosm study to assess methylmercury production. Environ. Res. 2013, 125, 30–40. [Google Scholar] [CrossRef]
  33. Serrano, S.; Vlassopoulos, D.; Bessinger, B.; O’Day, P.A. Immobilization of Hg (II) by coprecipitation in sulfate-cement systems. Environ. Sci. Technol. 2012, 46, 6767–6775. [Google Scholar] [CrossRef] [PubMed]
  34. Gilmour, C.C.; Riedel, G.S.; Riedel, G.; Kwon, S.; Landis, R.; Brown, S.S.; Menzie, C.A.; Ghosh, U. Activated carbon mitigates mercury and methylmercury bioavailability in contaminated sediments. Environ. Sci. Technol. 2013, 47, 13001–13010. [Google Scholar] [CrossRef] [PubMed]
  35. Gomez-Eyles, J.L.; Yupanqui, C.; Beckingham, B.; Riedel, G.; Gilmour, C.; Ghosh, U. Evaluation of biochars and activated carbons for in situ remediation of sediments impacted with organics, mercury, and methylmercury. Environ. Sci. Technol. 2013, 47, 13721–13729. [Google Scholar] [CrossRef]
  36. Schwartz, M.; Smits, K.; Smith, N.; Phelan, T. How lessons from an evolving comprehensive approach for water and sanitation can improve artisanal and small-scale mining environmental initiatives. J. Clean. Prod. 2021, 282, 124457. [Google Scholar] [CrossRef]
  37. Hinton, J.J.; Hinton, B.E.; Veiga, M.M. Women in artisanal and small-scale mining in Africa. In Women Miners in Developing Countries; Routledge: Oxfordshire, UK, 2017; pp. 209–226. [Google Scholar]
  38. UNCST. National Guidelines for Conduct of Research during Coronavirus Disease (COVID-19) Pandemic. 2020. Available online: www.uncst.go.ug (accessed on 15 May 2021).
  39. Okoye, A.U.; Chikere, C.B.; Okpokwasili, G.C. Isolation and characterization of hexadecane degrading bacteria from oil-polluted soil in Gio community, Niger Delta, Nigeria. Sci. Afr. 2020, 9, e00340. [Google Scholar] [CrossRef]
  40. Martin, G.J. Ethnobotany: A Methods Manual; Springer: Berlin/Heidelberg, Germany, 1995. [Google Scholar] [CrossRef]
  41. The Plant List. The Plant List Published on the Internet. 2021. Available online: http://theplantlist.org (accessed on 10 March 2021).
  42. Okalebo, J.R.; Gathua, K.W.; Woomer, P.L. Laboratory Methods of Soil and Plant Analysis: A Working Manual, 2nd ed.; Sacred Africa: Nairobi, Kenya, 2002; Volume 21, pp. 25–26. [Google Scholar]
  43. Muller, G. Index of geoaccumulation in sediments of the Rhine River. Geojournal 1969, 2, 108–118. [Google Scholar] [CrossRef] [Green Version]
  44. Santos Bermejo, J.C.; Beltrán, R.; Gómez Ariza, J.L. Spatial variations of heavy metals contamination in sediments from Odiel river (Southwest Spain). Environ. Int. 2003, 29, 69–77. [Google Scholar] [CrossRef] [PubMed]
  45. Saleem, M.; Iqbal, J.; Shah, M.H. Geochemical speciation, anthropogenic contamination, risk assessment and source identification of selected metals in freshwater sediments—A case study from Mangla Lake, Pakistan. Environ. Nanotechnol. Monit. Manag. 2015, 4, 27–36. [Google Scholar] [CrossRef] [Green Version]
  46. Barbieri, M. The importance of enrichment factor (EF) and geoaccumulation index (Igeo) to evaluate the soil contamination. J. Geol. Geophys. 2016, 5, 1–4. [Google Scholar] [CrossRef]
  47. Vannini, A.; Grattacaso, M.; Canali, G.; Nannoni, F.; Di Lella, L.A.; Protano, G.; Biagiotti, S.; Loppi, S. Potentially Toxic Elements (PTEs) in Soils and Bulbs of Elephant Garlic (Allium ampeloprasum L.) Grown in Valdichiana, a Traditional Cultivation Area of Tuscany, Italy. Appl. Sci. 2021, 11, 7023. [Google Scholar] [CrossRef]
  48. Ali, M.M.; Ali, M.L.; Islam, M.S.; Rahman, M.Z. Preliminary assessment of heavy metals in water and sediment of Karnaphuli River, Bangladesh. Environ. Nanotechnol. Monit. Manag. 2016, 5, 27–35. [Google Scholar] [CrossRef] [Green Version]
  49. R-Development Core Team. R: A Language and Environment for Statistical Computing; R Foundation for Statistical Computing: Vienna, Austria, 2020; ISBN 3-900051-07-0. Available online: http://www.R-project.org/ (accessed on 12 May 2020).
  50. FAO/WHO; Codex Alimentarius Commission. Food Additives and Contaminants. In Joint FAO/WHO Food Standards Programme; ALINORM 01/12A, 1-289; World Health Organization: Geneva, Switzerland, 2001. [Google Scholar]
  51. Slessarev, E.W.; Lin, Y.; Bingham, N.L.; Johnson, J.E.; Dai, Y.; Schimel, J.P.; Chadwick, O.A. Water balance creates a threshold in soil pH at the global scale. Nature 2016, 540, 567–569. [Google Scholar] [CrossRef] [PubMed] [Green Version]
  52. Queensland Government. “Soil pH”. 2013. Available online: www.qld.gov.auw (accessed on 10 July 2022).
  53. Jing, Y.D.; He, Z.L.; Yang, X.E. Effects of pH, organic acids, and competitive cations on mercury desorption in soils. Chemosphere 2007, 69, 1662–1669. [Google Scholar] [CrossRef] [PubMed]
  54. Soares, L.C.; Egreja Filho, F.B.; Linhares, L.A.; Windmoller, C.C.; Yoshida, M.I. Accumulation and oxidation of elemental mercury in tropical soils. Chemosphere 2015, 134, 181–191. [Google Scholar] [CrossRef]
  55. Steinnes, E.; Krog, H. Mercury, arsenic and selenium fall-out from an industrial complex studied by means of lichen transplants. Oikos 1977, 28, 160–164. [Google Scholar] [CrossRef]
  56. Schlüter, K. The Fate of Mercury in Soil (A Review of Current Knowledge); Office for Official Publications of the European Communities: Luxembourg City, Luxembourg, 1993. [Google Scholar]
  57. Gworek, B.; Dmuchowski, W.; Baczewska-Dąbrowska, A.H. Mercury in the terrestrial environment: A review. Environ. Sci. Eur. 2020, 32, 128. [Google Scholar] [CrossRef]
  58. Lodenius, M. Use of plants for biomonitoring of airborne mercury in contaminated areas. Environ. Res. 2013, 125, 113–123. [Google Scholar] [CrossRef]
  59. Arnold, J.; Gustin, M.S.; Weisberg, P.J. Evidence for Nonstomatal Uptake of Hg by Aspen and Translocation of Hg from Foliage to Tree Rings in Austrian Pine. Environ. Sci. Technol. 2018, 52, 1174–1182. [Google Scholar] [CrossRef]
  60. Peckham, M.A.; Gustin, M.S.; Weisberg, P.J.; Weiss-Penzias, P. Results of a controlled field experiment to assess the use of tree tissue concentrations as bioindicators of air Hg. Biogeochemistry 2019, 142, 265–279. [Google Scholar] [CrossRef]
  61. Greger, M.; Wang, Y.; Neuschütz, C. Absence of Hg transpiration by shoot after Hg uptake by roots of six terrestrial plant species. Environ. Pollut. 2005, 134, 201–208. [Google Scholar] [CrossRef]
  62. Stamenkovic, J.; Gustin, M.S. Nonstomatal versus Stomatal Uptake of Atmospheric Mercury. Environ. Sci. Technol. 2009, 43, 1367–1372. [Google Scholar] [CrossRef] [PubMed]
  63. Juillerat, J.I.; Ross, D.S.; Bank, M.S. Mercury in litterfall and upper soil horizons in forested ecosystems in Vermont, USA. Environ. Toxicol. Chem. 2012, 31, 1720–1729. [Google Scholar] [CrossRef] [PubMed]
  64. Obrist, D.; Johnson, D.W.; Edmonds, R.L. Effects of vegetation type on mercury concentrations and pools in two adjacent coniferous and deciduous forests. J. Plant Nutr. Soil Sci. 2012, 175, 68–77. [Google Scholar] [CrossRef]
  65. Laacouri, A.; Nater, E.A.; Kolka, R.K. Distribution and Uptake Dynamics of Mercury in Leaves of Common Deciduous Tree Species in Minnesota, U.S.A. Environ. Sci. Technol. 2013, 47, 10462–10470. [Google Scholar] [CrossRef] [Green Version]
  66. Ordak, M.; Wesolowski, M.; Radecka, I.; Muszynska, E.; Bujalska-Zazdrozny, M. Seasonal Variations of Mercury Levels in Selected Medicinal Plants Originating from Poland. Biol. Trace Elem. Res. 2016, 173, 514–524. [Google Scholar] [CrossRef] [Green Version]
  67. Gustin, M.S.; Ericksen, J.A.; Schorran, D.E.; Johnson, D.W.; Lindberg, S.E.; Coleman, J.S. Application of Controlled Mesocosms for Understanding Mercury Air−Soil−Plant Exchange. Environ. Sci. Technol. 2004, 38, 6044–6050. [Google Scholar] [CrossRef]
  68. Frescholtz, T.F.; Gustin, M.S.; Schorran, D.E.; Fernandez, C.J. Assessing the source of mercury in foliar tissue of quaking aspen. Environ. Toxicol. Chem. 2003, 22, 2119. [Google Scholar] [CrossRef]
  69. Assad, M.; Parelle, J.; Cazaux, D.; Gimbert, F.; Chalot, M.; Tatin-Froux, F. Mercury uptake into poplar leaves. Chemosphere 2016, 146, 1–7. [Google Scholar] [CrossRef]
  70. Dombaiová, R. Mercury and methylmercury in plants from differently contaminated sites in Slovakia. Plant Soil Environ. 2005, 51, 456–463. [Google Scholar] [CrossRef] [Green Version]
  71. Fay, L.; Gustin, M. Assessing the Influence of Different Atmospheric and Soil Mercury Concentrations on Foliar Mercury Concentrations in a Controlled Environment. Water Air Soil Pollut. 2007, 181, 373–384. [Google Scholar] [CrossRef]
  72. Niu, Z.; Zhang, X.; Wang, S.; Zeng, M.; Wang, Z.; Zhang, Y.; Ci, Z. Field controlled experiments on the physiological responses of maize (Zea mays L.) leaves to low-level air and soil mercury exposures. Environ. Sci. Pollut. Res. 2014, 21, 1541–1547. [Google Scholar] [CrossRef] [Green Version]
  73. Millhollen, A.G.; Gustin, M.S.; Obrist, D. Foliar Mercury Accumulation and Exchange for Three Tree Species. Environ. Sci. Technol. 2006, 40, 6001–6006. [Google Scholar] [CrossRef] [PubMed]
  74. Yuan, W.; Sommar, J.; Lin, C.-J.; Wang, X.; Li, K.; Liu, Y.; Zhang, H.; Lu, Z.; Wu, C.; Feng, X. Stable Isotope Evidence Shows Re-emission of Elemental Mercury Vapor Occurring after Reductive Loss from Foliage. Environ. Sci. Technol. 2019, 53, 651–660. [Google Scholar] [CrossRef]
  75. Sun, L.; Lu, B.; Yuan, D.; Hao, W.; Zheng, Y. Variations in the isotopic composition of stable mercury isotopes in typical mangrove plants of the Jiulong estuary, SE China. Environ. Sci. Pollut. Res. 2017, 24, 1459–1468. [Google Scholar] [CrossRef] [PubMed]
  76. Olson, C.L.; Jiskra, M.; Sonke, J.E.; Obrist, D. Mercury in tundra vegetation of Alaska: Spatial and temporal dynamics and stable isotope patterns. Sci. Total Environ. 2019, 660, 1502–1512. [Google Scholar] [CrossRef]
  77. Zhou, J.; Obrist, D.; Dastoor, A.; Jiskra, M.; Ryjkov, A. Vegetation uptake of mercury and impacts on global cycling. Nat. Rev. Earth Environ. 2021, 2, 269–284. [Google Scholar] [CrossRef]
  78. Ericksen, J.A.; Gustin, M.S. Foliar exchange of mercury as a function of soil and air mercury concentrations. Sci. Total Environ. 2004, 324, 271–279. [Google Scholar] [CrossRef] [PubMed]
  79. Zhang, H.; Feng, X.; Larssen, T.; Qiu, G.; Vogt, R.D. In Inland China, Rice, Rather than Fish, Is the Major Pathway for Methylmercury Exposure. Environ. Health Perspect. 2010, 118, 1183–1188. [Google Scholar] [CrossRef] [Green Version]
  80. Rajaee, M.; Obiri, S.; Green, A.; Long, R.; Cobbina, S.J.; Nartey, V.; Buck, D.; Antwi, E.; Basu, N. Integrated Assessment of Artisanal and Small-Scale Gold Mining in Ghana—Part 2: Natural Sciences Review. Int. J. Environ. Res. Public Health 2015, 12, 8971–9011. [Google Scholar] [CrossRef] [Green Version]
  81. Codex Alimentarius. FAO/WHO Codex General Standard for Contaminants and Toxins in Food and Feed. Codex Stan. 2013, pp. 1–48. Available online: https://www.google.co.jp/url?sa=t&rct=j&q=&esrc=s&source=web&cd=&cad=rja&uact=8&ved=2ahUKEwicx5qxy739AhVVrlYBHR4IBk4QFnoECAoQAQ&url=https%3A%2F%2Fwww.fao.org%2Ffao-who-codexalimentarius%2Fsh-proxy%2Fen%2F%3Flnk%3D1%26url%3Dhttps%25253A%25252F%25252Fworkspace.fao.org%25252Fsites%25252Fcodex%25252FStandards%25252FCXS%252B193-1995%25252FCXS_193e.pdf&usg=AOvVaw3T4KjPqJsHVlAzuHiXIP-e (accessed on 10 July 2022).
  82. Hindersah, R.; Risamasu, R.; Kalay, A.M.; Dewi, T.; Makatita, I. Mercury contamination in soil, tailing and plants on agricultural fields near closed gold mine in Buru Island, Maluku. J. Degrad. Min. Lands Manag. 2018, 5, 1027. [Google Scholar] [CrossRef] [Green Version]
  83. Mahmud, M.; Lihawa, F.; Saleh, Y.; Desei, F.; Banteng, B. Study of mercury concentration in plants in Traditional Buladu Gold Mining. In IOP Conference Series: Earth and Environmental Science; IOP Publishing: Bristol, UK, 2019. [Google Scholar]
  84. Sari, M.M.; Inoue, T.; Matsumoto, Y.; Yokota, K.; Isrun, I. Assessing a Mercury Affected Area from Small-scale Gold Mining in Poboya, Central Sulawesi, Indonesia. Environ. Ecol. Res. 2016, 4, 223–230. [Google Scholar] [CrossRef] [Green Version]
  85. Basri; Sakakibara, M.; Sera, K. Mercury in Soil and Forage Plants from Artisanal and Small-Scale Gold Mining in the Bombana Area, Indonesia. Toxics 2020, 8, 15. [Google Scholar] [CrossRef] [PubMed] [Green Version]
  86. Guédron, S.; Grangeon, S.; Jouravel, G.; Charlet, L.; Sarret, G. Atmospheric mercury incorporation in soils of an area impacted by a chlor-alkali plant (Grenoble, France): Contribution of canopy uptake. Sci. Total Environ. 2013, 445–446, 356–364. [Google Scholar] [CrossRef]
  87. Silva-Filho, E.V.; Machado, W.; Oliveira, R.R.; Sella, S.M.; Lacerda, L.D. Mercury deposition through litterfall in an Atlantic Forest at Ilha Grande, Southeast Brazil. Chemosphere 2006, 65, 2477–2484. [Google Scholar] [CrossRef]
  88. WHO. WHO Guidelines for Assessing Quality of Herbal Medicines with Reference to Contaminants and Residues; World Health Organization: Geneva, Switzerland, 2007. [Google Scholar]
  89. de Vries, W.; Schütze, G.; Lofts, S.; Meili, M.; Römkens, P.; Farret, R.; De Temmerman, L.; Jakubowski, M. Critical limits for cadmium, lead and mercury related to ecotoxicological effects on soil organisms, aquatic organisms, plants, animals and humans. In Proceedings of the Expert Meeting on Critical Limits for Heavy Metals and Methods for Their Application, Berlin, Germany, 2–4 December 2002. [Google Scholar]
  90. Koch, H.M.; Haller, A.; Weiss, T.; Käfferlein, H.-U.; Stork, J.; Brüning, T. Phthalate exposure during cold plastisol application—A human biomonitoring study. Toxicol. Lett. 2012, 213, 100–106. [Google Scholar] [CrossRef] [PubMed]
  91. Zhang, B.Y.; Zheng, J.S.; Sharp, R.G. Phytoremediation in Engineered Wetlands: Mechanisms and Applications. Procedia Environ. Sci. 2010, 2, 1315–1325. [Google Scholar] [CrossRef] [Green Version]
  92. Davis, L. A Handbook of Constructed Wetlands: A Guide to Creating Wetlands for: Agricultural Wastewater, Domestic Wastewater, Coal Mine Drainage, Stormwater in the Mid-Atlantic Region; USDA-Natural Resources Conservation Service: Alexandria, LA, USA, 1995; Volume 1. [Google Scholar]
  93. Ahmad, S.S.; Reshi, Z.A.; Shah, M.A.; Rashid, I. Constructed Wetlands: Role in Phytoremediation of Heavy Metals. In Phytoremediation: Management of Environmental Contaminants; Ansari, A.A., Gill, S.S., Gill, R., Lanza, G.R., Newman, L., Eds.; Springer International Publishing: Cham, Switzerland, 2016; Volume 3, pp. 291–304. [Google Scholar]
  94. Mishra, S.; Tripathi, A.; Tripathi, D.K.; Chauhan, D.K. Role of sedges (Cyperaceae) in wetlands, environmental cleaning and as food material. In Plant-Environment Interaction; Wiley: Hoboken, NJ, USA, 2016; pp. 327–338. [Google Scholar]
Figure 1. Location of the study area.
Pollutants 03 00014 g001
Figure 2. Concentration of mercury in soils collected from different ASGM areas. Whiskers show minimum and maximum values, while horizontal lines in the boxes show medians.
Pollutants 03 00014 g002
Figure 3. Human mercury exposure routes in ASGM areas.
Pollutants 03 00014 g003
Table 1. Mean ( x ¯ ± sd, n = 5) of pH, organic carbon (OC) and Electrical conductivity (EC) of the soils.
SitepHOC (g/100 g)EC (mS/cm)
Control6.60 ± 0.10 a2.53 ± 0.25 b82.17 ± 3.07 a
Agata6.57 ± 0.05 a2.44 ± 0.65 b95.38 ± 10.57 a
Bukana6.83 ± 0.15 a2.38 ± 0.11 b122.17 ± 26.93 a
Buwolya6.63 ± 0.06 a1.19 ± 0.22 a87.70 ± 15.36 a
Nabwalya6.27 ± 0.45 a1.88 ± 0.45 ab387.33 ± 43.66 c
Nagudi6.70 ± 0.25 a2.09 ± 0.41 ab267.40 ± 39.98 b
Nsango6.60 ± 0.30 a1.95 ± 0.24 ab109.34 ± 19.14 a
Means in each column followed by the different letters of the alphabet are significantly different (Tukey’s test, p < 0.05).
Table 2. Geoaccumulation index (Igeo) values for the mercury-contaminated sites.
SiteAverage Total Hg Concentration (ppm)IgeoPollution Status
Agata100.972.69Heavily contaminated
Bukana43.421.16Moderately contaminated
Buwolya115.583.08Heavily contaminated
Nabwala96.622.58Heavily contaminated
Nagudi61.191.63Moderately contaminated
Nsango124.033.31Heavily contaminated
Control0.060.0016Uncontaminated
Table 3. Mean ( x ¯ ± sd, n = 3) total mercury concentration (ppm) for food crops harvested from the different ASGM areas.
SpeciesOrganAgata
(ppm)
Bukana
(ppm)
Nagudi
(ppm)
Nsango
(ppm)
Amaranthus dubius L.Leaves51.00 ± 5.14 ab0.044 ± 0.007 a0.11 ± 0.06 a
Brassica oleraceaLeaves 47.80 ± 4.65 ab
Colocassia esculentumTuber133.18 ± 95.41 b41.98 ± 10.30 ab0.06 ± 0.065 a0.025 ± 0.01 a
Colocassia esculentumLeaves122.80 ± 7.45 b 103.06 ± 14.85 c0.019 ± 0.003 a
Corchorus olitorius L.Leaves 37.00 ± 6.94 ab
Ipomoea batatasLeaves 35.30 ± 11.25 ab0.54 ± 0.47 a54.27 ± 6.01 b
Ipomoea batatasTuber36.76 ± 6.01 ab50.33 ± 5.29 b0.10 ± 0.011 a0.027 ± 0.005 a
Manihot esculentumLeaves0.05 ± 0.01 a 0.15 ± 0.13 a0.14 ± 0.01 a
Manihot esculentumTuber0.004 ± 0.00 a 0.004 ± 0.004 a0.042 ± 0.01 a
Musa sapientumFruit 0.021 ± 0.04 a
Musa sapientumLeaves 0.017 ± 0.02 a
Ocimum gratismumLeaves 28.76 ± 6.07 ab
Oryza sativaGrains0.078 ± 0.001 a
Saccharum officinarumStem 60.80 ± 6.70 b
Zea maysGrains0.004 ± 0.001 a46.10 ± 36.31 b0.014 ± 0.014 a0.012 ± 0.01 a
Zea maysLeaves 29.20 ± 3.52 ab
Means in each column followed by different letters of the alphabet are significantly different (Tukey’s HSD test, p < 0.05).
Table 4. Mean ( x ¯ ± sd, n = 3), total mercury concentration (ppm) for wild plant species collected from the different ASGM areas.
SpeciesAgata
(ppm)
Bukana
(ppm)
Naguddi
(ppm)
Nabwala
(ppm)
Conyza sumatrensis 0.028 ± 0.006 a
Cycnium tenuisectum25.93 ± 4.25 b
Cynodon dactylon 0.034 ± 0.007 a
Cyperus articulatus 73.43 ± 6.12 de
Cyperus difforms65.27 ± 6.34 d 23.63 ± 7.20 b
Cyperus digitatus26.80 ± 7.65 b
Cyperus dives 0.12 ± 0.014 a
Cyperus fuuminalis42.67 ± 6.44 c
Cyperus rotundus 78.50 ± 4.25 de
Datura stromonium 0.17 ± 0.006 c
Fuirena umbellata101.67 ± 0.65 e
Guizotia scabra868.33 ± 149.16 f
Hyggrophila sp. 71.93 ± 5.58 c
Hyptis suaveolens 0.027 ± 0.002 a
Lantana camara 43.63 ± 7.19 c0.071 ± 0.008 b
Ricinus communis 0.59 ± 0.016 d
Sida rhombifolia 22.07 ± 5.40 b
Solanum macranthum 65.20 ± 4.12 d
Tilliodes corchorus 0.037 ± 0.007 a
Typha capensis 91.70 ± 4.68 e
Typha domingensis0.044 ± 0.013 a
Means in each column (at a particular site) followed by different letters of the alphabet are significantly different (Tukey’s HSD test, p < 0.05).
Disclaimer/Publisher’s Note: The statements, opinions and data contained in all publications are solely those of the individual author(s) and contributor(s) and not of MDPI and/or the editor(s). MDPI and/or the editor(s) disclaim responsibility for any injury to people or property resulting from any ideas, methods, instructions or products referred to in the content.

