Article

Pollution Status, Source Apportionment, Ecological and Human Health Risks of Potentially (Eco)toxic Element-Laden Dusts from Urban Roads, Highways and Pedestrian Bridges in Uganda

1
Department of Chemistry, Faculty of Science, Mbarara University of Science and Technology, Mbarara P.O. Box 1410, Uganda
2
Institute of Chemistry of Renewable Resources, Department of Chemistry, University of Natural Resources and Life Sciences Vienna (BOKU), Konrad-Lorenz-Straße 24, 3430 Tulln, Austria
3
Chemistry Division, Testing Department (Standards Directorate), Uganda National Bureau of Standards, Bweyogerere Industrial and Business Park, Kampala P.O. Box 6329, Uganda
*
Authors to whom correspondence should be addressed.
Pollutants 2023, 3(1), 74-88; https://doi.org/10.3390/pollutants3010007
Submission received: 27 November 2022 / Revised: 3 January 2023 / Accepted: 10 January 2023 / Published: 20 January 2023

Abstract

:
The occurrence of potentially (eco)toxic elements (PTEs) in street, indoor and roadside dusts have been associated with potential human health risks. For the first time, the pollution levels of PTEs—copper (Cu), nickel (Ni), manganese (Mn), zinc (Zn), lead (Pb), cadmium (Cd) and chromium (Cr)—were investigated in 24 dust samples from eight selected sampling sites on urban roads, highways and pedestrian bridges constructed over River Manafwa, a flood-prone river in Eastern Uganda. Concentration of PTEs in the sample digests were quantified by atomic absorption spectrometry. Multivariate geostatistical (Pearson’s Correlation, Principal Components and Hierarchical Cluster) analyses were used to apportion sources of the contaminants. Contamination, ecological and human health assessment indices and models were employed to establish any potential risks the elements could pose to the environment and humans. The study revealed that there is severe PTE pollution of dusts from roads, highways and pedestrian bridges in Eastern Uganda when compared with their crustal averages, except for Cu, Ni and Cr. The mean concentrations (mg kg−1) of Cu (11.4–23.2), Ni (0.20–23.20), Mn (465.0–2630.0), Zn (26.8–199.0), Pb (185.0–244.0), Cd (0.178–1.994) and Cr (5.40–56.60) were highest in samples obtained near high-traffic areas. Source apportionment studies suggested that Cu, Ni, Mn and Cr are from combustion processes and vehicular traffic, whereas Pb, Zn and Cd came from traffic and geogenic contributions. Assessment using the pollution load index indicated that only dust from Zikoye–Bushika road, the junction of Zikoye–Bushika and Bududa–Manafwa roads and Manafwa town were substantially polluted as the indices were greater than 1. Further assessment of pollution degree of the dust samples using index of geo-accumulation revealed that the dusts were practically uncontaminated to medium-to-strongly contaminated. Health risk assessment showed that there are non-carcinogenic health risks that could emanate from direct ingestion of PTEs in dusts by children. This study therefore opens the lead for investigation of the contamination levels and the health risks of PTEs in dusts from industrial areas as well as busy Ugandan cities such as Kampala, Jinja, Mbarara and Gulu.

1. Introduction

The upward trend in economic growth, industrialization, rising energy consumption and urbanization with weak regulatory instruments has caused unprecedented environmental pollution [1]. This points to the need for more research to provide a basis on which policy formulation and enforcement are grounded to mitigate pollution [2,3,4]. According to recent estimates by the World Health Organization (WHO), approximately 99% of the world’s human population breathe air with pollution parameters surpassing WHO permissible limits [5]. From this standpoint, air pollution has attracted research interest because it has been incriminated in the etiology, progression and aggravation of airborne diseases (e.g., COVID-19, tuberculosis, ischemic heart disease), as well as neurodevelopmental and neuropsychiatric conditions, e.g., depression, bipolar and autism spectrum disorders [6,7,8]. Moreover, the WHO has substantiated that the burden of diseases emanating from inhalation of polluted air is currently almost equivalent to those from major global health risks such as unhealthy diets and tobacco smoking [9].
Air pollutants are known to contain a cocktail of hazardous materials, including aerosols of toxic elements (such as mercury, arsenic, chromium, lead, cadmium and nickel); pathogenic bacteria, viruses and fungi (yeast and molds); ozone; pollen; particulate matter; and acidic oxides [10]. Among atmospheric contaminants, particles in sizes less than 2.5 µm or 10 µm have been a subject of intensive research [11]. However, studies on the occurrence of particulates with larger grain sizes, e.g., dusts from roads, streets, highways, indoor environments and bridges, have not been explored in most countries [12,13,14]. One of the contaminants of concern in particulate matter is potentially (eco)toxic elements (PTEs). Available literature shows that exposure to PTEs, especially heavy metals (HMs): copper (Cu), iron (Fe), chromium (Cr), mercury (Hg), nickel (Ni), cadmium (Cd), zinc (Zn), lead (Pb) and arsenic (As) in roadside, foliage and pedestrian bridge dusts can pose health threats [15,16]. In most reports, the background concentrations of the elements in roadside dusts surpassed their mean concentrations in the upper continental crust. Nazzal et al. [17], for instance, found HMs in dusts from some Canadian highways to range from 0.51 to 40,052 mg kg−1. Similar studies in the tourist city (Guilin) of China [18], Central Scotland [19], Dhanbad (India) [20] and Luanda (Angola) [21] have reported HMs in street and roadside dusts at levels above background concentrations.
PTEs can exert deleterious health effects. Zn, for instance, is an indispensable ion that is required in multiple metabolic processes, including protein synthesis and immunity construction. In addition, it constitutes over 1000 transcription factors and is a structural and regulatory component of up to 300 in vivo enzymes [22]. However, excessive intake of Zn induces diarrhea, inappetence, abdominal cramps and headache. Chronic effects, such as low Cu status, altered Fe function and reduced immune function, have also been associated with excessive Zn intake. In supplements, continuous intake of Zn by men was cited to potentially increase the risk of and mortalities from prostatic adenocarcinoma [23]. For the most part, HMs exert their toxicity through inducing reactive oxygen species generation, oxidative stress and DNA wreckage; enzyme inactivation; and disruption/weakening of the antioxidant defense system. On the other hand, some HMs mediate their toxicity through selective binding to specific macromolecule or cellular reductants, producing intermediates responsible for Fenton-type reactions that generate free radicals [24]. Overall, the toxicity of PTEs depends on their bioavailability, ionic forms (valence states), chemical forms, dose, route and time of exposure, as well as the age, sex and nutritional status of an organism or individual. For instance, Fe can induce cell death by generating free radicals as it interconverts between ferrous (Fe2+) and ferric (Fe3+) forms [25]. Similarly, Cr in the trivalent state (Cr3+) is less mobile and toxic than the highly mobile hexavalent chromium (Cr6+). Water-soluble hexavalent Cr is extremely irritating and toxic to human tissues as its solubility facilitates ionic active transport across biological membranes [26]. Other examples are cited herein with (i) mercury (Hg), which is capable of exerting toxic effects in its vapor (elemental or metallic mercury; Hg0) form. It is most toxic in its organic form as methyl or ethyl mercury (Me-Hg and Et-Hg) than the vapor and inorganic mercury forms (Hg+ and Hg2+) [24]. Additionally, another example is (ii) arsenic, which exists as a metalloid (As0), inorganic (As3+ and As5+), organic arsenic and arsine (AsH3), with known toxicity arranged as organic arsenicals < As0 < inorganic species (As5+ < As3+) < arsine [24].
There has been increased publicity on the occurrence of PTEs in road and street dusts of megacities [27]. In Africa, however, there are hardly any reports on the levels of PTEs in highway and pedestrian bridge dusts, except for some earlier reports from Angola [21], Ghana [28,29] and Nigeria [10]. Given the exponential rise in urbanization and industrialization activities, there is potential exposure to PTEs in dusts especially by pedestrians, cyclists and children. This study was therefore undertaken to quantify the levels, sources and the associated health risks of PTEs in dust from selected urban roads, highways and pedestrian bridges in Uganda.

2. Materials and Methods

2.1. Study Area

This contribution considered Eastern Uganda as a case study. It was of interest in this study for several reasons. First of all, it is made up of 32 districts, which represent 23.9% of the total number of districts in Uganda. Secondly, it is densely populated, with an estimated number of 10,836,500 people as of 2020 [30]. Thirdly, this region has Malaba and Busia One-Stop Border Posts, which are by far the busiest border crossings on the Northern Corridor [31,32]. Thus, roads, highways and bridges in this region has one of the highest traffic in Uganda, especially with cargo trailers from Mombasa port (Kenya), which handles roughly 60% of the regional imports. Both imports and exports for Democratic Republic of Congo also pass through these border posts [33]. Fourthly, the region has some distinct tourist attraction sites in Uganda, such as the source of the Nile River (the longest river in the world) and Itanda falls, with six whitewater rafting levels in Jinja, Nabugoye Synagogue and Mt. Elgon (with the largest volcanic base of 4000 km2 in the world) in Mbale district. Other attractions include Nyero Rock Paintings (Uganda’s oldest rock-art site) in Kumi district, the Tororo rock (with various caves and ancestral paintings) in Tororo, Kagulu hill (a 3048 m high rocky prominence) in Buyende district, Sipi falls in Kapchorwa district, and Dolwe Island (Jewel of Lake Victoria) in Namayingo district [34]. These tourist activities could potentially increase emission of PTEs due to increased vehicular activities. Fifth, the region has three prominent cement-producing factories in Tororo district (viz; Tororo Cement, Simba Cement and Hima Cement), which release industrial smoke, cement and quarrying dusts directly into the atmosphere [35,36]. According to Guinness World Records, Tororo is the most thundery place on earth as it thunders 251 days per annum [37,38]. This can increase weathering processes and hence the release of PTEs into the atmosphere as well as facilitate their long-range transport. Lastly, the region has been the epicenter of flash flood inundations and landslides, especially in the Manafwa watershed [39,40,41].
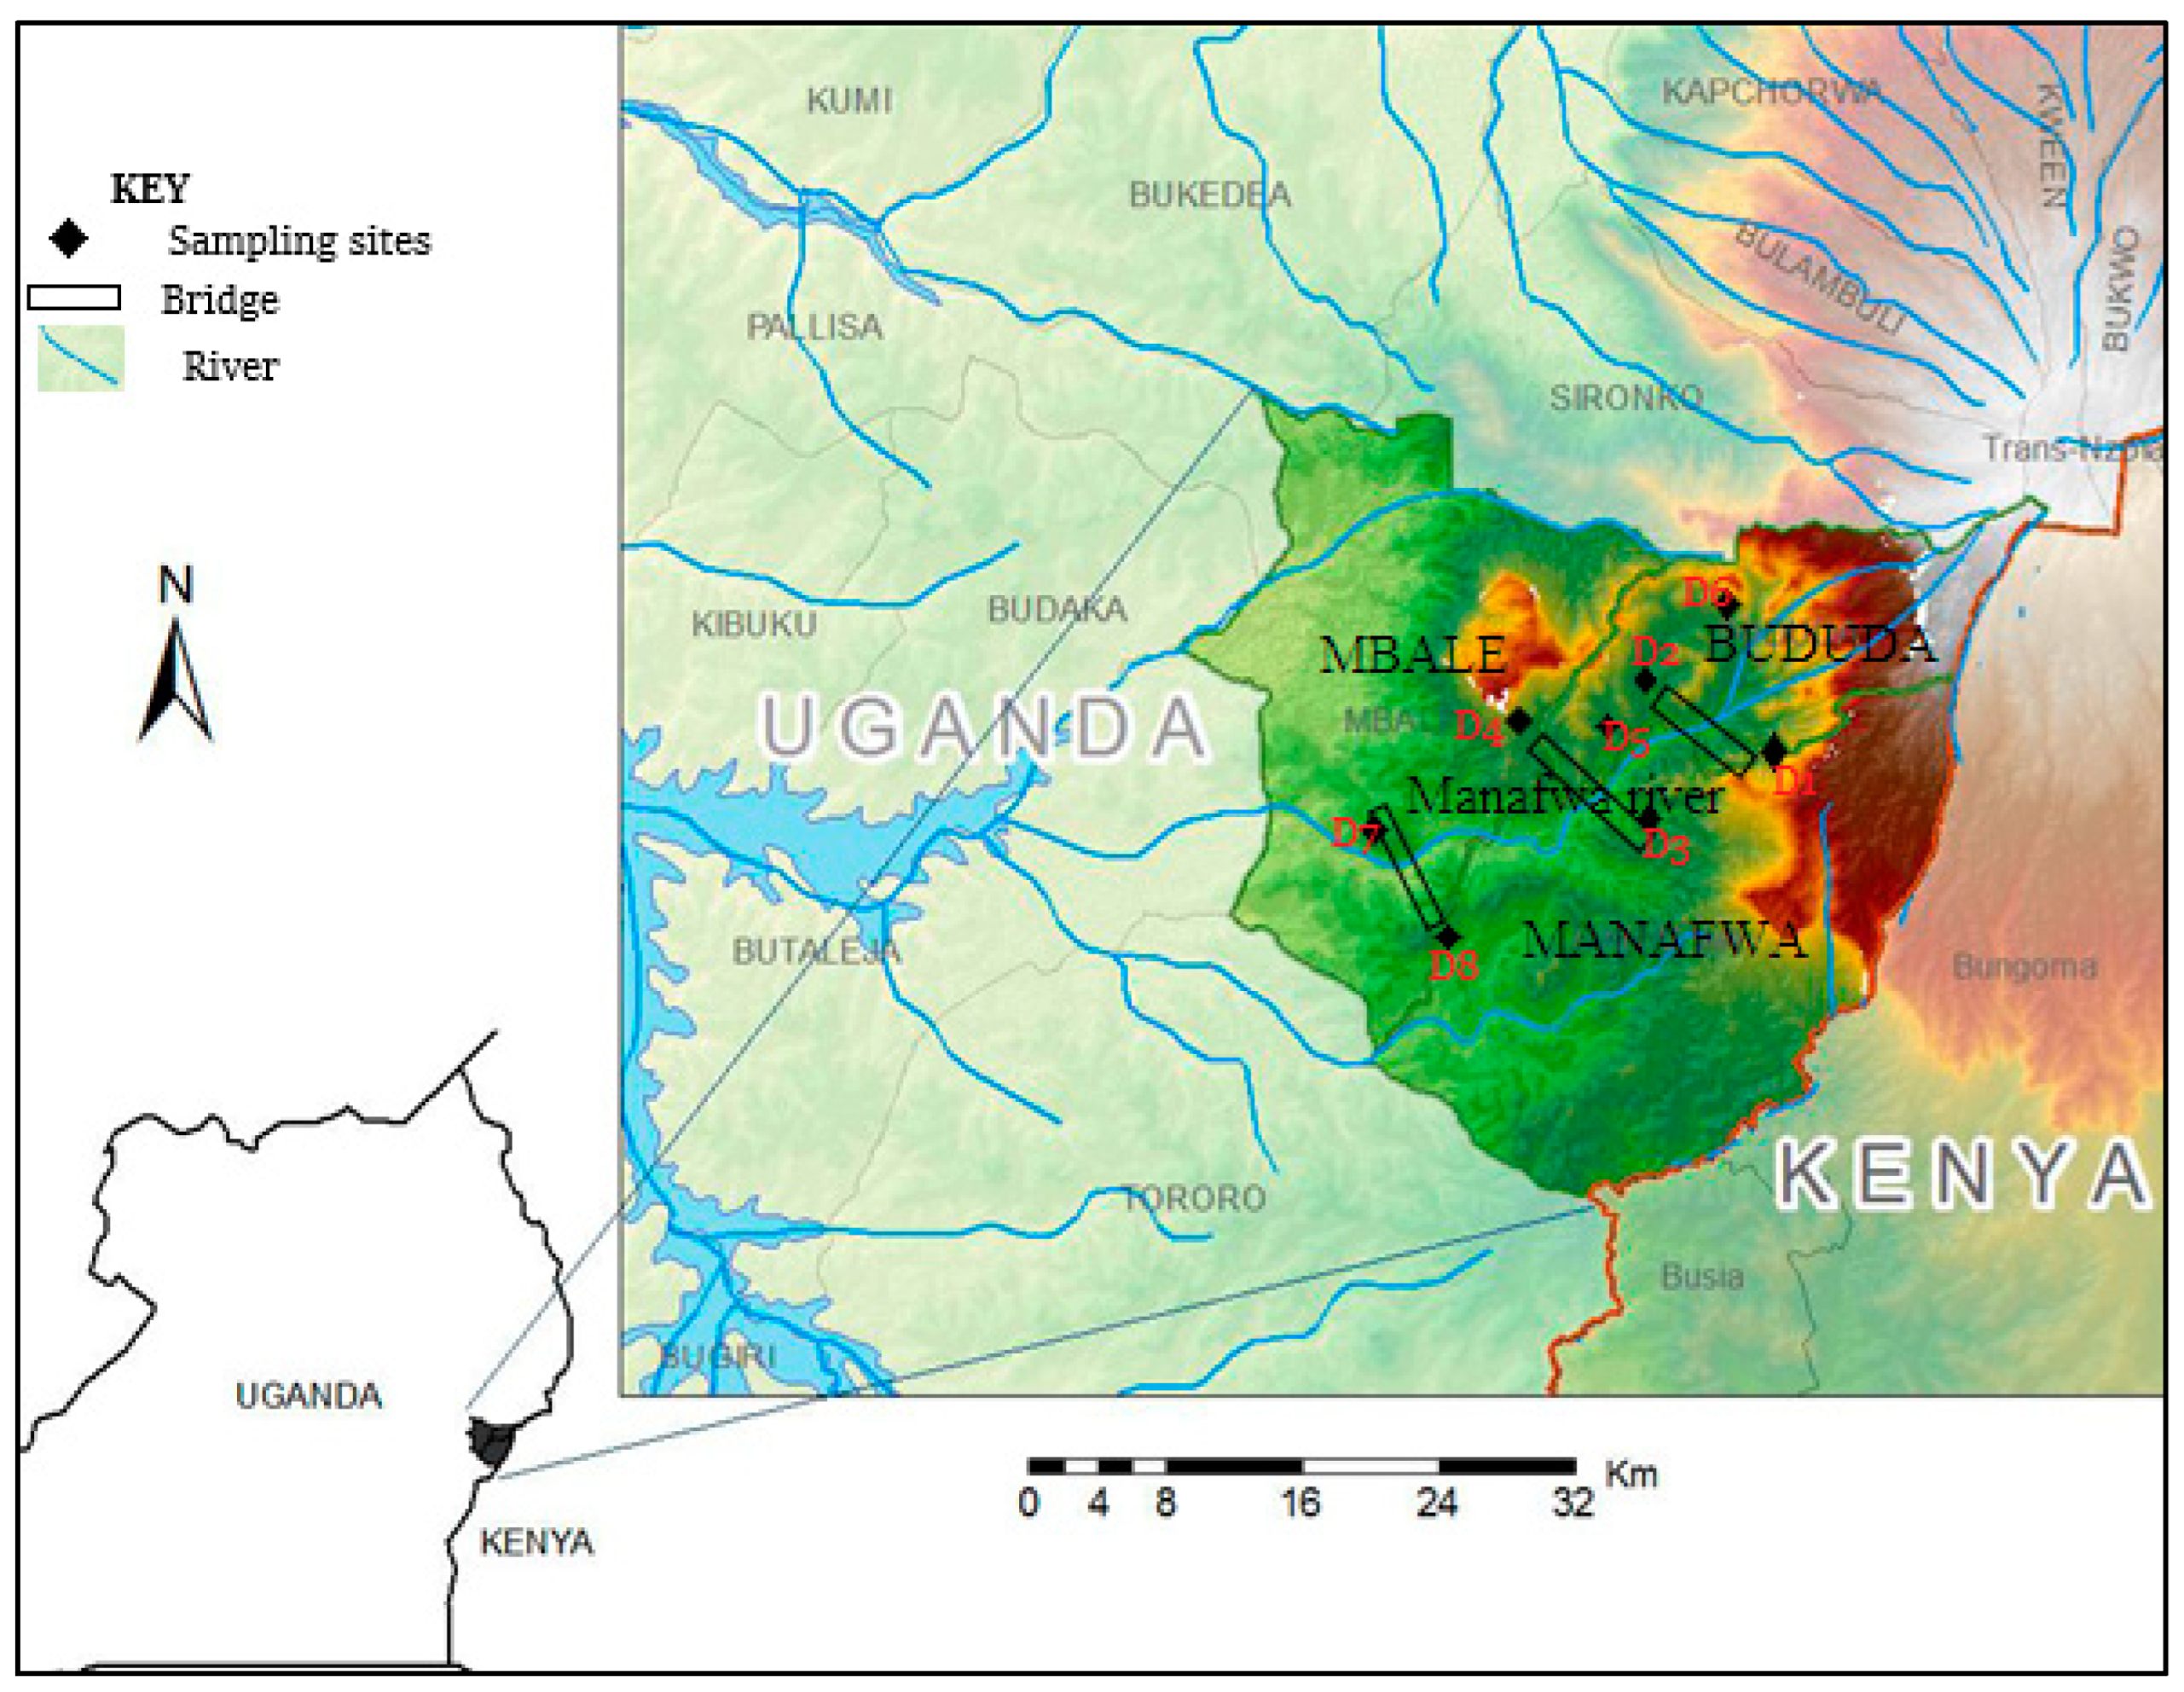
The dusts were sampled from selected urban roads, highways and pedestrian bridges constructed over Manafwa River (0.9420° N 33.920° E), the longest river that flows through Mbale and Butaleja districts of Eastern Uganda (Figure 1). The river is fed by various tributaries (such as Sala, Liisi, Wukha, Tsutsu, Pasa, Kufu, Nambale and Makhuba) and small streams from the transboundary Mt. Elgon [42]. Manafwa River is about 14.63 km long, and its water quality has been degraded due to economic activities such as sand mining and frequent floods.

2.2. Sample Collection

To minimize the effects of turbulence from rain and wind, the samples were taken following seven days of continuous sunshine [18] in December 2019. Protective gears (face masks, gloves and an overall) were worn to eliminate potential exposure to the HMs in the dust samples. A total of 24 dust samples were taken in triplicate (Figure 1 and Table 1) from selected urban roads, highways and pedestrian bridges built over Manafwa River (viz; Manafwa historic bridge, Bushika bridge and Bubulo bridge). Briefly, the samples were collected from areas of 2 m2 to 10 m2 of roadside/pedestrian bridge areas. Each sample was approximately 100 g of the settled dust on cemented floor of the bridge pavement or highway side. Samples were collected using plastic brushes and scoops, and then wrapped in aluminum foil. They were transferred into polyethylene bags and taken to Kasese Cobalt Company analytical laboratory for spectroscopic analysis.

2.3. Spectroanalytical Procedure

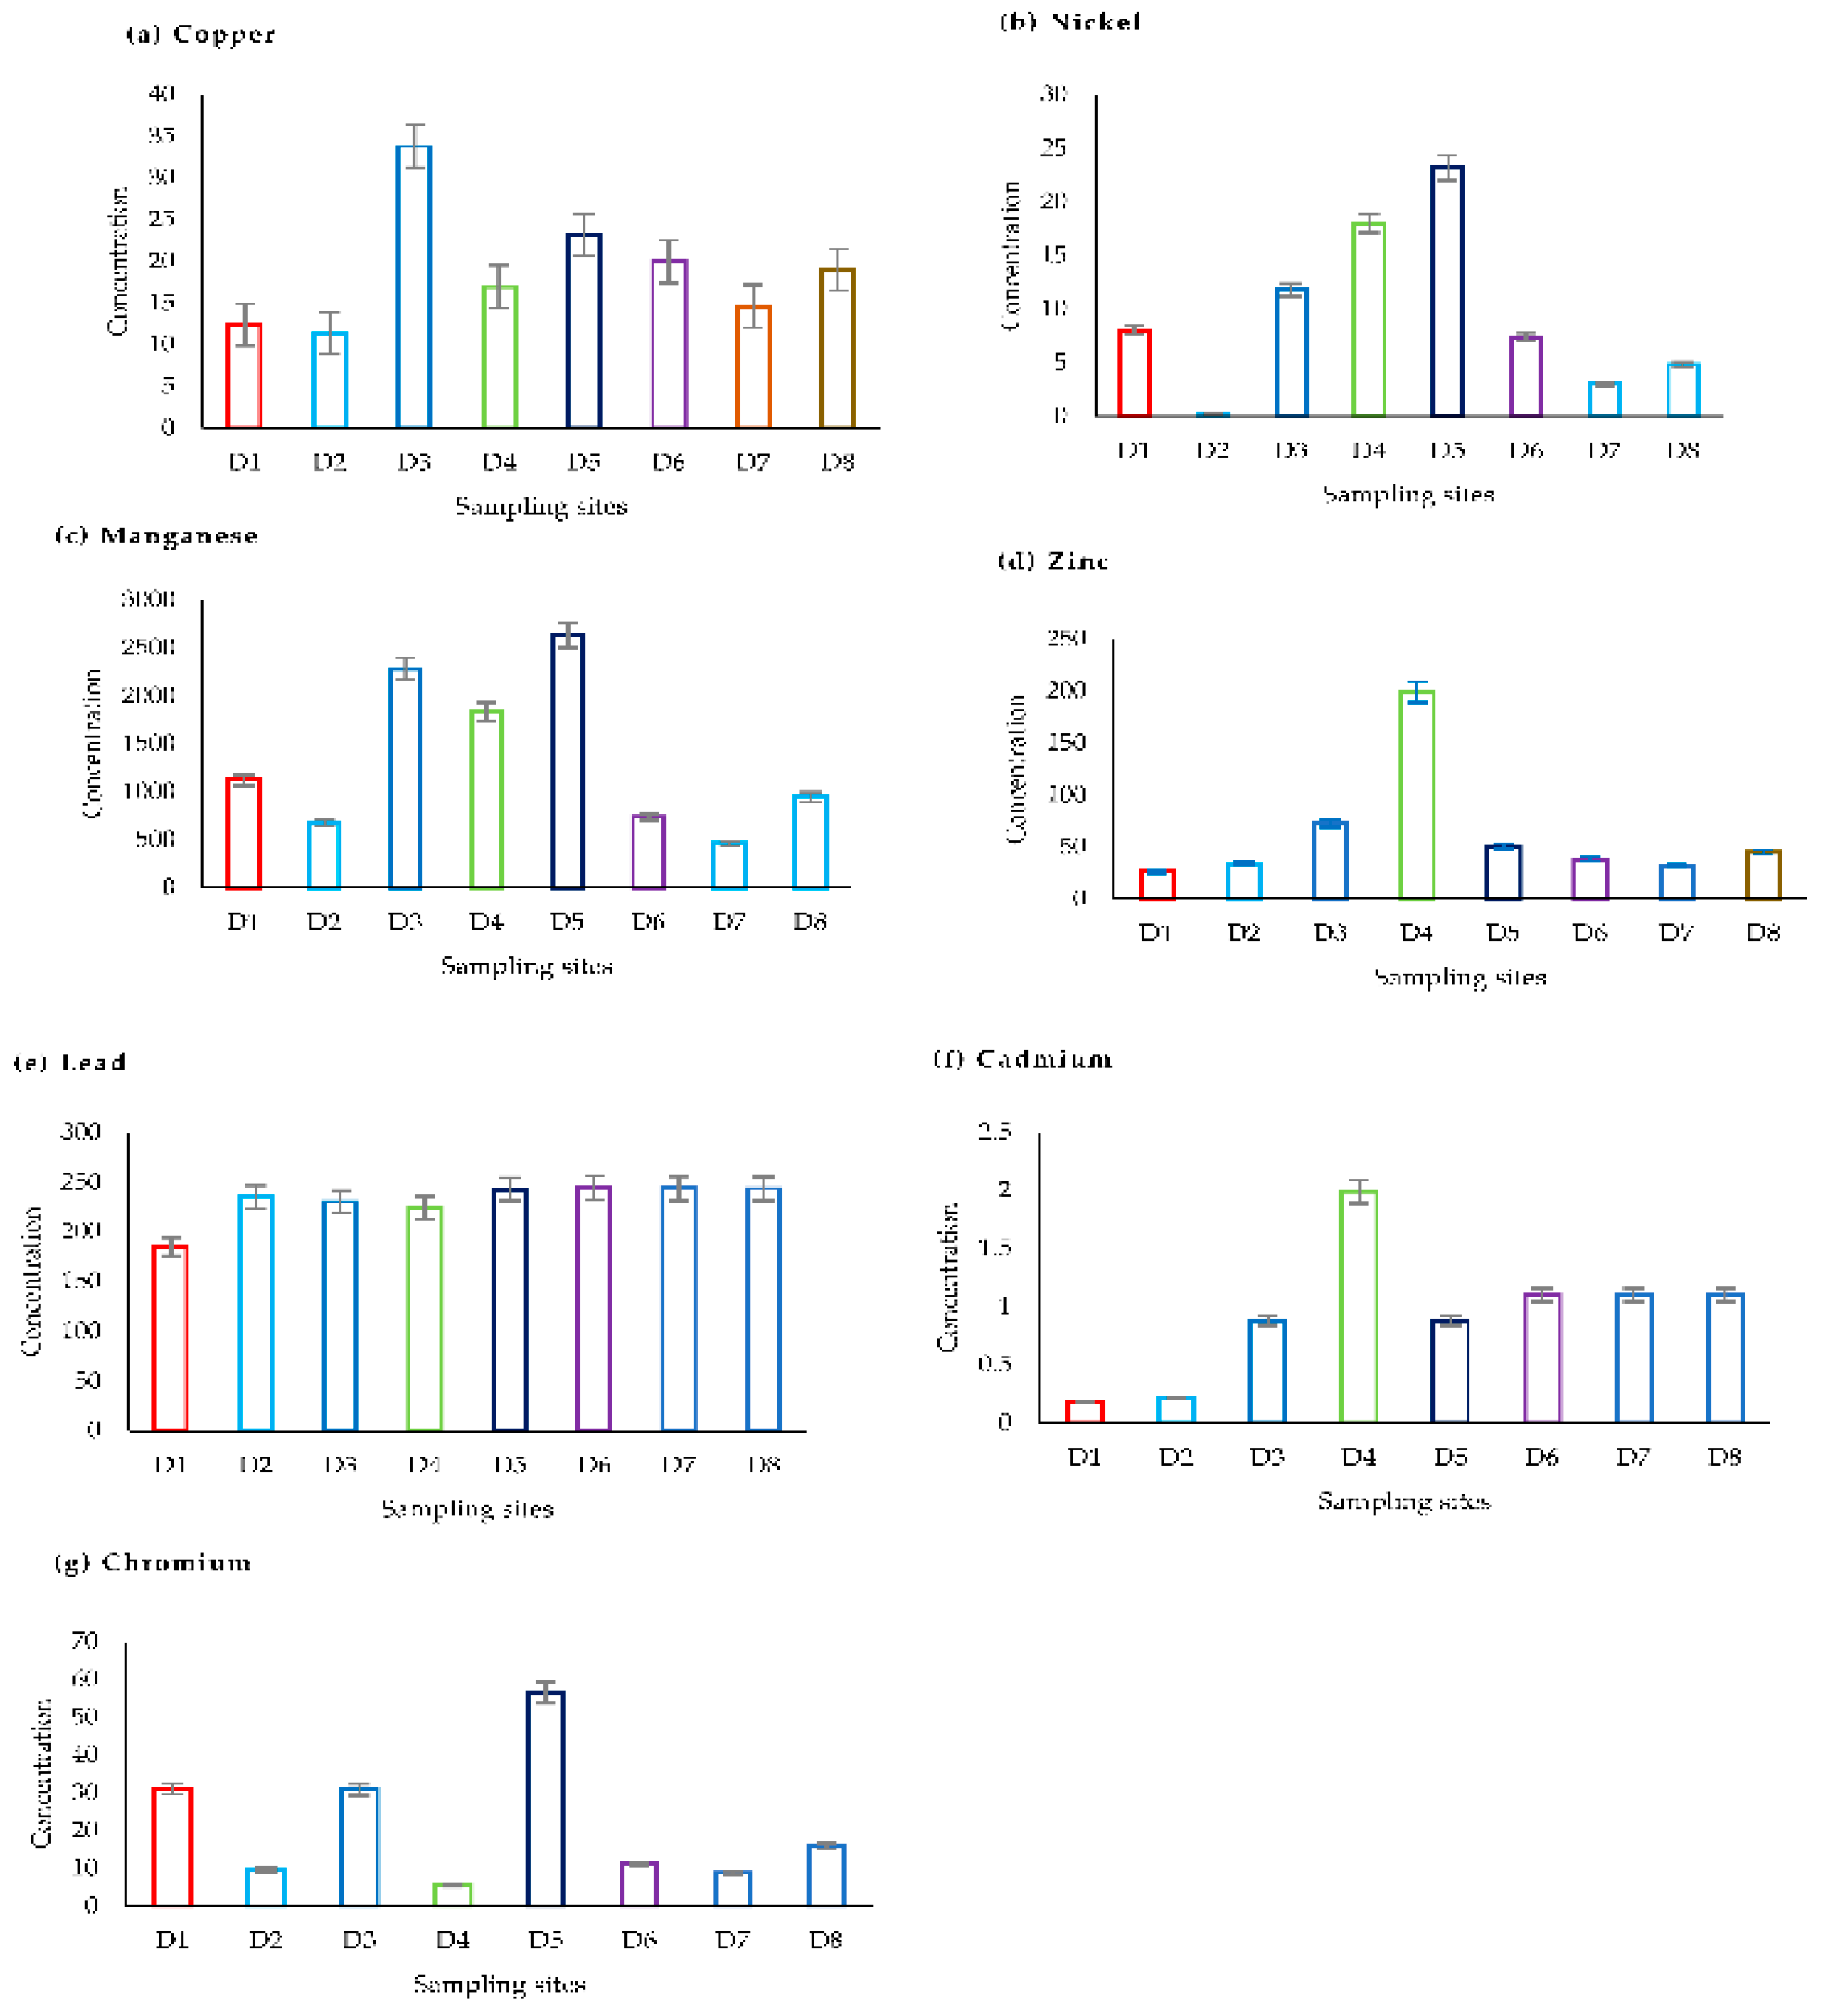
Samples were initially dried at 100 ± 5 °C for 5 h in an oven and later cooled in a desiccator. Measured 1 g of the samples were digested with 20 mL of aqua-regia (1:3 v/v HNO3:HCl) until dryness. Thereafter, they were diluted to 10 mL with 1% nitric acid. The resultant mixture was cooled and filtered through Whatman filter papers into 50 mL sample vials. The resultant solutions were analyzed using atomic absorption spectrophotometer (AAS, Perkin Elmer Analyst 100) to determine the concentration of seven selected PTEs: Cu, Ni, manganese (Mn), Zn, Pb, Cd and Cr. The wavelengths used were 324.7, 232.0, 279.5, 213.9, 238.3, 357.9, 228.8 and 248.3 nm, respectively.
Working standards prepared from dilution of 1000 ppm stock solution of the nitrate and chloride salts of the PTEs were used to construct calibration curves. The concentration of the elements in the digests were determined from the calibration curves in mg/L, and thereafter converted into mg kg−1. The curves had acceptable linearity (R2 > 0.995). Quality control in the analysis was achieved by analyzing procedural blanks and spiked samples, and the recoveries obtained were in range (96 to 101%). The relative standard deviations from the experiments (as a measure of analytical precision) ranged from 3.1% to 4.8%. The method detection limits (in mg kg−1) were 0.01, 0.03, 0.05, 0.02, 0.05, 0.12, 0.002, and 0.08 for Cu, Ni, Mn, Zn, Pb, Cd and Cr, respectively.

2.4. Assessment of Dust Contamination and Toxicity Levels

To date, the undeniably most explored indices for evaluation of contamination risks and pollution extent of dusts are contamination factor, enrichment factor, geo-accumulation index, pollution load index and potential ecological risk index. They are, by and large, computed with respect to the crustal concentrations of the metals. In consequence, such assessments are invariably reliant on the values of the crustal concentrations chosen. Due to paucity of data on background values of PTEs in roadside dusts from Uganda, the concentrations used herein are global averages of the upper continental crust reported by previous authors [43,44], which respectively are 38.9, 29.0, 571.0, 64.0, 27.0, 0.40 and 59.5 mg kg−1 for Cu, Ni, Mn, Zn, Pb, Cd and Cr.
Thus, the contamination factor (CF) was computed using Equation (1) advanced by Hakanson [45]. Secondly, the index of geo-accumulation (Igeo), applied by Müller [46] in the first instance, was also used (Equation (2)).
CF = C d C B
I geo = Log 2   C d 1.5   C B
From which Cd = element concentration in the sample, CB = continental crustal average value of the same element and 1.5 is the background matrix correction factor [47,48]. The classification values and pollution extents based on CF and Igeo are detailed in Supplementary Materials Table S1. For Igeo, the PTE pollution is categorized into seven distinguished enrichment classes (0 to 6), corresponding with normal background value to extreme metalliferous contamination.
To establish the cumulative pollution load in a particular dust sample, the pollution load index (PLI) was computed (Equation (3)).
Pollution load index = (CF1 × CF2 × CF3 × CF4 × CF5 × CF6 × CF7)1/7
From which CF1 to CF7 are the contamination factors for the seven PTEs.
Finally, the potential ecological risk index technique established by Hakanson [45] was applied in this study. It was used to indicate the sensitivity of the biotic community to the PTEs and exemplifies the risk index caused by the overall contamination. The potential ecological risk coefficient ( E R i ) and potential ecological risk index (PERI) were computed (using Equations (4) and (5)) to obtain a clear evaluation of the ecological risks related to the PTE contamination by dusts per sampling site.
E R i = T R i   ×   CF
PERI = i = 1 i = n E R i
wherein T R i = biological toxic factor of PTEs: Cu = Ni = Pb = 5, Zn = Mn = 1, Cd = 30 and Cr = 2 [20]. The risk characterization criterion is elaborated in Supplementary Materials Table S1.

2.5. Assessment of Potential Human Health Risks

Health risk assessments establishes the relationship between the environment and human health. Herein, the assertions detailed by the US Environmental Protection Agency (US EPA) [49] were assumed (Supplementary Materials Table S2). The risks were categorized into carcinogenic and non-cancer risks. The average daily doses (mg kg−1 day−1) were estimated to discern human exposure through direct ingestion (ADDingestion), inhalation (ADDinhalation) and dermal contact (ADDdermal contact) with the dust samples (Equations (6)–(8)) [50,51].
ADD ingestion = C × I n g R × E f × E d W a b × T a e t   × 10 6
ADD inhalation = C × I n h R × E f × E d P E F × W a b × T a e t
ADD dermal contact = C × S A F × C F × A F × D A F × E f × E d W a b × T a e t
The hazard quotient (HQ) was calculated to establish non-cancer risks from the PTEs (Equation (9)). Since contaminants like PTEs can elicit augmentative effects, the hazard index (HI) was calculated (Equation (10)) [51].
HQ = A D D R f D
HI = i = 1 n = 7 HQ
where RfD is the oral (direct ingestion), inhalation or dermal reference dose of the specific element (Supplementary Materials Table S3).
Carcinogenic health risk (CR) estimated as the incremental lifetime cancer risk for the carcinogenic elements (Ni, Pb, Cd and Cr) (Equations (11)–(13)) [21,51,52].
CRingestion = ADDingestion × CSF
CR inhalation = ADD inhaltion   ×   IRF 24   ×   10 3   ×   CSF
CRdermal contact = ADDdermal contact × CSF
where IRF is the chronic inhalation unit risk factor = 1.5 × 10⁻⁴, 1.2 × 10⁻⁵, 4.9 × 10⁻⁴ and 1.2 × 10⁻² per μgm−3 for Ni, Pb, Cd and Cr, respectively [52,53,54]; CSF is the ingestion cancer slope factor for respective metal under consideration = 3.0 × 10⁻⁴, 8.5 ×10⁻⁶, 5.0 ×10⁻⁴ and 3.8 ×10⁻⁴ mg kg−1 day−1 for Ni, Pb, Cd and Cr, respectively [55].

2.6. Statistical Analysis

Quantitative data from experimental analyses performed in triplicate were captured in Microsoft Excel 2016 (version 2211, Microsoft Corporation, Washington, DC, USA) where they were averaged and expressed as means ± standard deviations of replicates. Significant differences in the mean concentration of the PTEs among the sites was established using one-way analysis of variance, followed by Tukey’s test. Pearson’s bivariate correlation analysis was performed to test for the association between the PTEs in the dust samples. Principal component analysis (PCA) was harnessed to group the PTEs and apportion their origins [
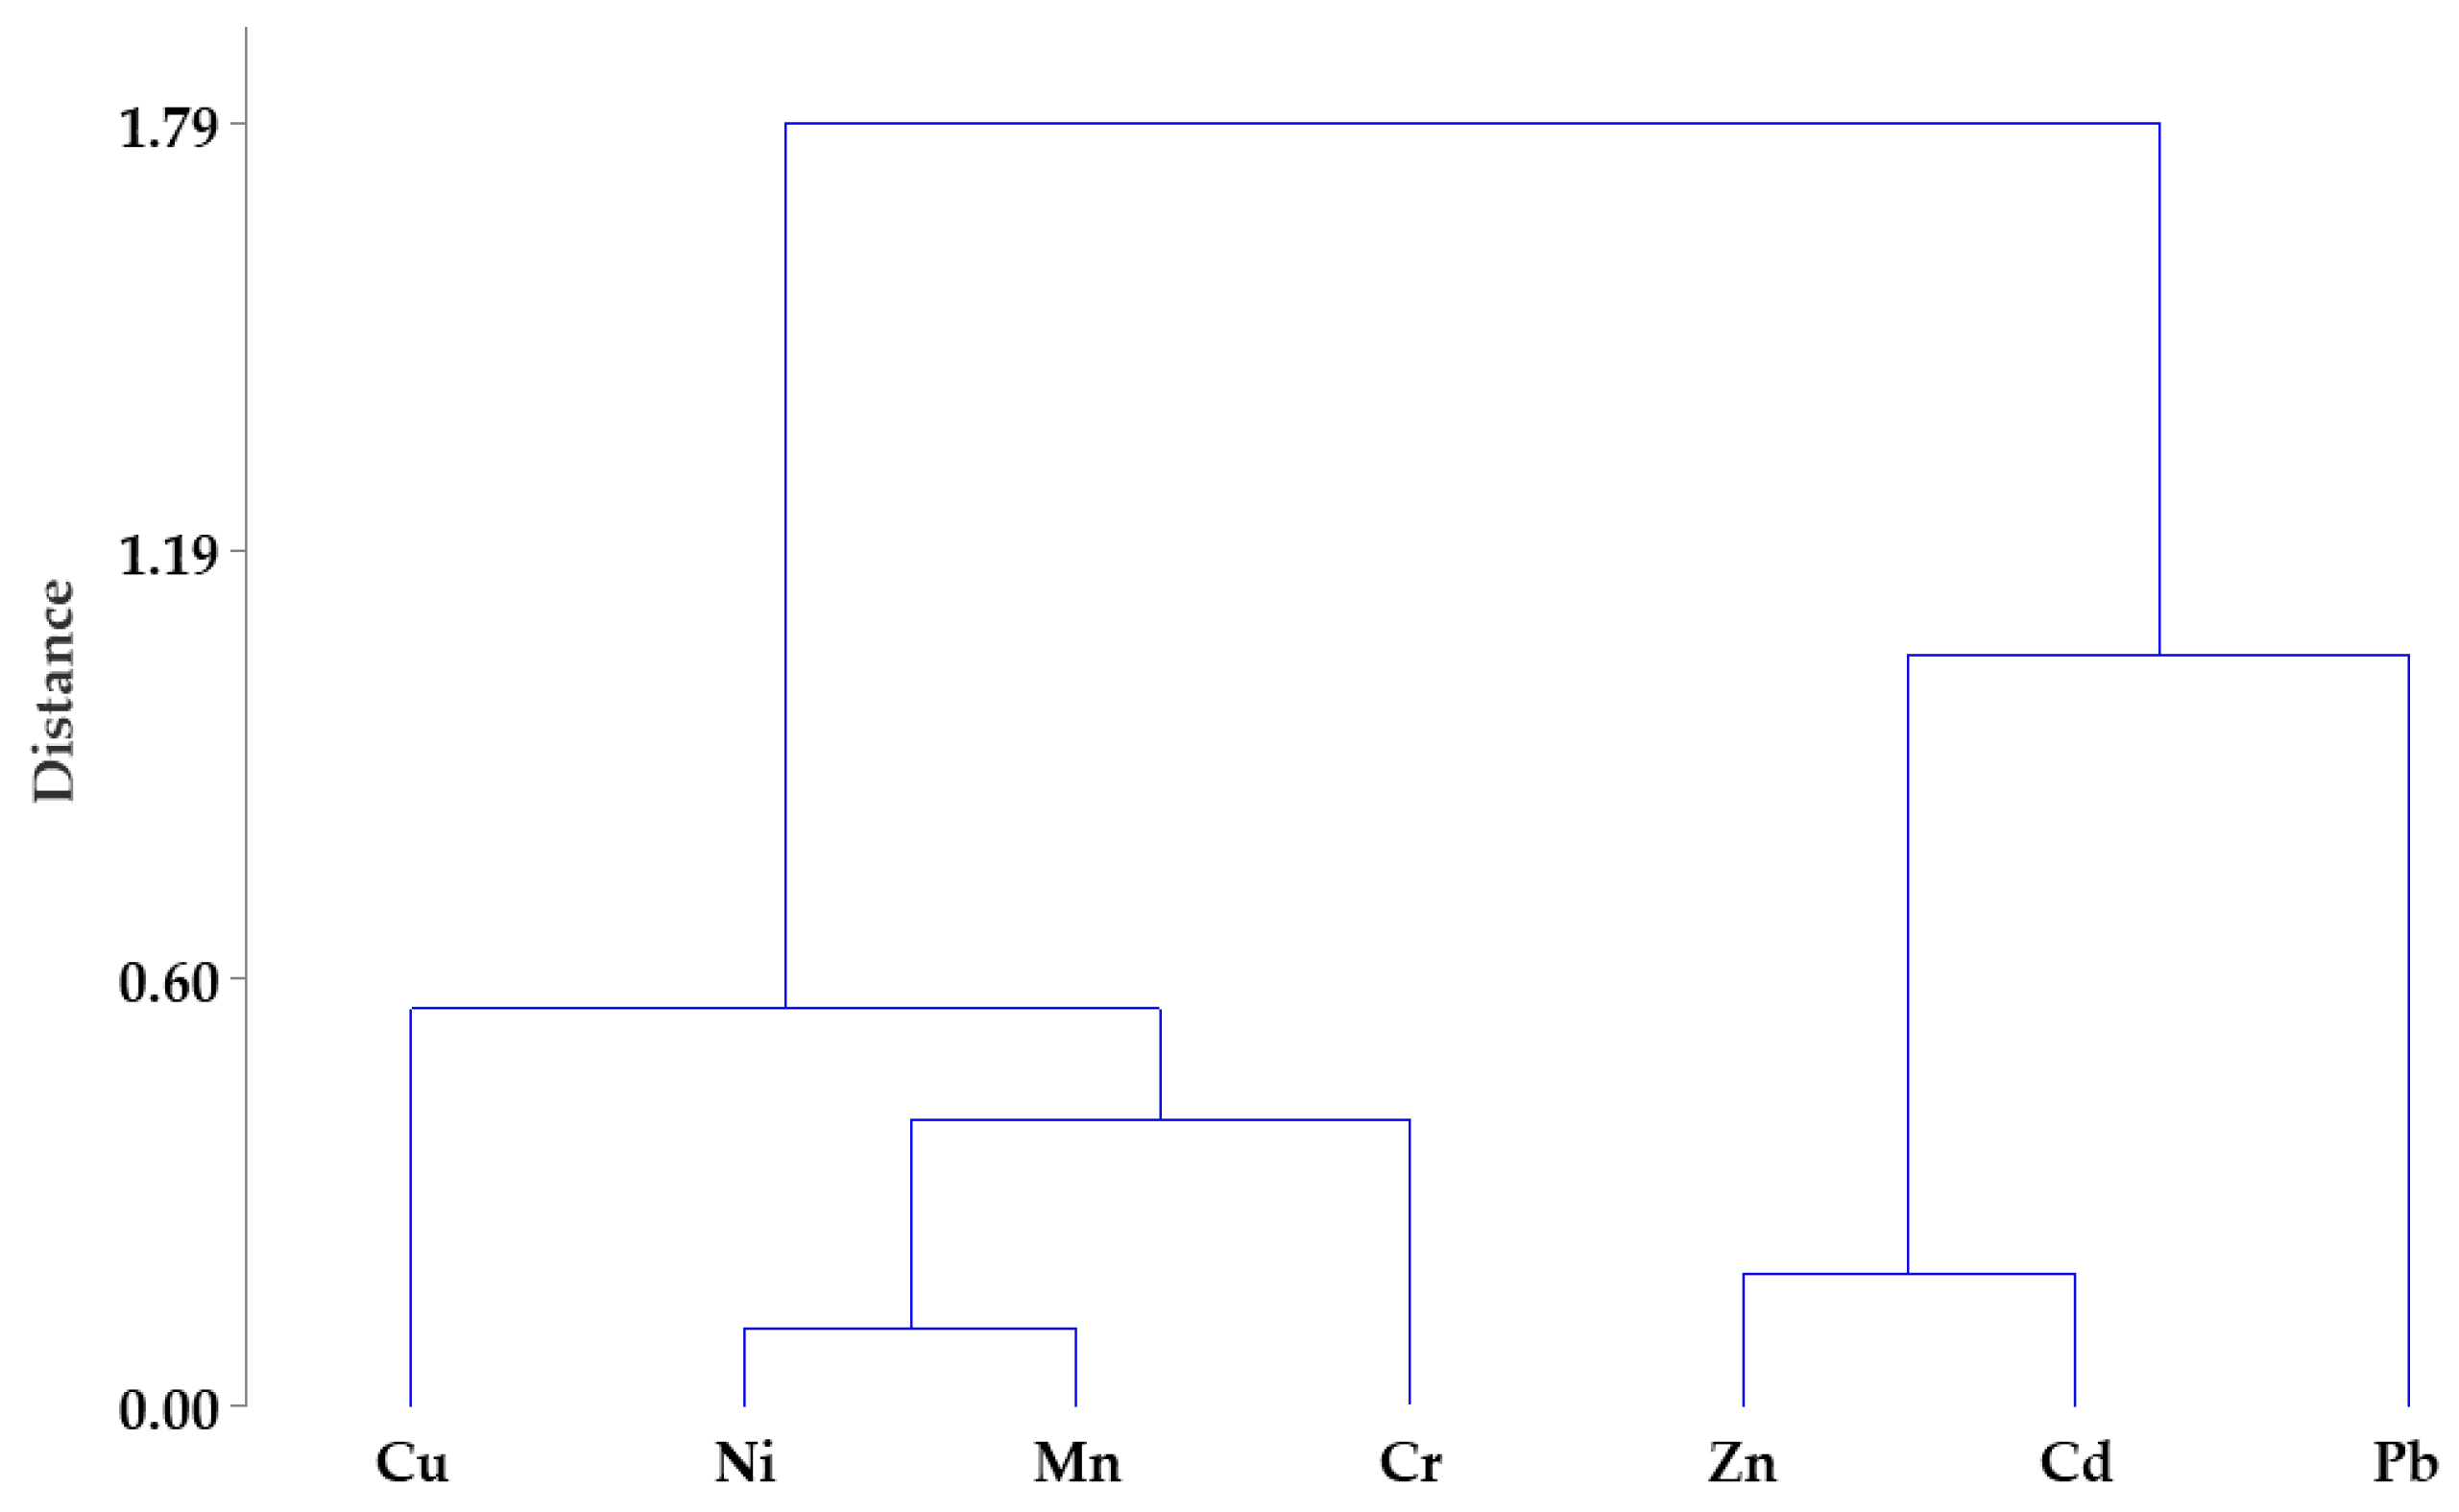
13]. Further, PCA components were transformed using a varimax rotation with Kaiser normalization post analysis. Cluster analysis was harnessed to establish the different geochemical groups by clustering samples with similar PTE content. The analyses were executed at 95% confidence interval in GraphPad Prism statistical software (version 9.3.1, GraphPad software, San Diego, CA, USA).

3. Results and Discussion

3.1. Distribution of Toxic Elements in the Samples

The levels of PTEs in the samples are depicted in Figure 2. The levels followed the chemical sequence Cd < Ni < Cu < Cr < Zn < Pb < Mn. Only the mean levels of Mn showed significant differences with the other PTEs as per ANOVA results (p = 0.000). The study revealed that with the exception of Cu, Ni and Cr, there is severe PTE pollution of dusts from urban roads, highways and pedestrian bridges in Eastern Uganda vis-à-vis their crustal averages. The mean concentrations (in mg kg−1) of Cu (11.4–23.2), Ni (0.20–23.20), Mn (465.0–2630.0), Zn (26.8–199.0), Pb (185.0–244.0), Cd (0.178–1.994) and Cr (5.40–56.60) in the dusts were elevated in samples obtained from sites with high vehicular traffic flow. This observation implies that most PTEs (excluding Cu, Ni and Cr) could have come from anthropomorphic contributions [15,16,44,56].
The concentration of Pb was almost the same across the sampled sites, with the exception of sample from Bushika bridge at the crossing from Bubulo to Busiu (D1). The high concentration of these PTEs in the dust samples may be attributed to vehicular activities such as tire wear and tear of brake linings [57,58,59]. Brake linings release Cu while tire wear releases Zn. On the other hand, Pb is a toxic metal mainly used as an anti-knock agent in gasoline, batteries and solder (an alloy used in welding, a major activity along the roadside in urban centers in Uganda). Lead–acid batteries being recharged along roadsides, waste battery acid being replaced and disposed with domestic wastes, disposed lead–acid batteries and municipal wastes may all be the cause of the high concentration of Pb along the Mbale–Tororo highway (where samples D7 and D8 were collected) and Manafwa–Bududa road at the areas within Manafwa and Bududa towns where samples D5 and D6 were collected, respectively.
The results of this study are lower than those reported in most countries (Table 2). For example, Kabir et al. [52] found very high concentrations of Cu (82.6 mg kg−1), Ni (14.1 mg kg−1), Pb (50.8 mg kg−1), Zn (126.2 mg kg−1), Cd (0.18 mg kg−1) and Cr (20.1 mg kg−1) in dust from the Kushtia–Jhenaidah national highway, Bangladesh. Similar reports have been made for roadside dusts in Luanda (Angola, Africa) [21], Accra (Ghana, Africa), Islamabad Expressway (Pakistan, Asia) [60] and Dhanbad (India, Asia) [20]. Nevertheless, a study of dust from Tiruchirappalli city, India [57] reported lower PTE levels, which are comparable to those obtained in this investigation.

3.2. Source Apportionment

Apportioning of the origins of PTEs in the dusts was achieved using Pearson’s correlation analysis. There were weak to strong positive correlations between Cu and Mn (p = 0.058); Mn and Ni (p = 0.003); Cr and Ni (p = 0.095); and Cr and Mn (p = 0.040). On the other hand, Pb and Ni; Pb and Mn; Pb and Zn; Pb and Cr; Cr and Cd; and Cr and Zn showed weak insignificant negative correlations (Table 3). Such positive correlations have been reported in previous studies on PTEs in roadside dusts, for example, Cu and Mn as well as Cr and Ni observed by Mondal and Singh [20], and Cr and Ni observed by Atiemo et al. [28]. As a rule, significant correlations between pairs of PTEs suggest that they originate from a common or combined origin, whereas weak correlations indicate different origins [4,17]. Thus, the positive correlation between the metal pairs is suggestive that they have common sources of origins, mutual dependences and identical behaviors during the transport, which may be anthropogenic and similar pathways into the terrestrial environment. Moreover, Mn, Ni and Cr belong to the geochemical group of siderophilic elements, and therefore might have been from metallurgical works [62].
Owing to the correlation complexity, PCA was performed and superseded by extraction of the eigenvalues and eigenvectors from the correlation matrix, so as to establish the number of significant principal components and the percentage of the total variance that they explained. Evidently, Cu and Mn; Cu and Ni; Mn and Cr; and Cd and Zn exhibited notable correlations in the first principal component. Based on eigenvalues greater than 1 at p < 0.05 [17,20], the results (Table 4) show that they could account for 91.4% of the total variance. The eigenvalue (1.200) of PC3 explained about 17.1% of the total variance, and was mainly loaded with Cu, Pb, Cd and Cr. These could plausibly be attributed to vehicular traffic [17]. The second component (PC2) is loaded with Cu, Ni, Mn and Cr, accounting for 28.5% of the overall percentage variance. This could be apportioned to geogenic activities in soils from those sites with moderate to heavy vehicular traffic flows. Cu, for example, is a major element of vehicle parts (tires and brakes), which on wearing can lead to its inevitable emission in dusts [20]. For highways, previous studies have also offered compelling evidence that increase in Mn concentrations in dusts from them is related to the high road traffic flow [61,63]. The first principal component (PC1) was loaded with all the PTEs, but correlated very strongly with Ni and Mn, which individually contributed high loading values (0.533 and 0.525, respectively) and explained 45.8% of the total variance. The source of this factor may be contributions mainly from traffic, especially heavy trucks and cars passing through the one-stop border points. Figure 3 is the variable factor map depicting the quadrant in which the individual PTEs belonged in the PCA.
Cluster analysis was further performed to establish any existing similarities among the PTEs in the dust samples. The dendrogram of different PTEs and the sampling stations obtained by Ward’s method is illustrated in Figure 4. The results showed that PTEs in the samples were grouped into two major clusters. Cluster 1 was formed with Cu, Ni, Mn and Cr, while cluster 2 was composed of Pb, Cd and Zn. The results indicated that the elements in a given cluster were possibly derived from analogous anthropogenic sources [52].

3.3. Environmental and Ecological Risk Assessment Results

Pertaining to the calculated contamination factors, obtained values ranged from 0.007 for Ni in sample D2 (from Bushika bridge at the junction with Bududa–Manafwa road) to 9.037 for Pb in sample D6 from Bududa town (Table 5). According to the classification advanced by Hakanson [45] (Table S1), there is low to very high contamination of dust from the studied parts of Eastern Uganda, particularly with regard to Pb, Mn and Cd. Assessment using PLI indicated that only dust samples from Zikoye–Bushika road (D3), the junction of Zikoye–Bushika and Bududa–Manafwa roads (D4) and Manafwa town (D5) were substantially polluted as the indices were greater than 1. These values are lower than reported in similar investigations on street, highway, roadside and pedestrian bridge dusts. For example, Mondal and Singh [20] reported PLIs of 5.62 to 8.22 in road dust of Dhanbad, India, while Gope et al. computed the PLI as 4.78 for Asansol city of India [64]; Faiz et al. arrived at PLI = 3.5 for dust from Islamabad Expressway of Pakistan [60]. The differences in the PLI obtained in this study and previous reports can be attributed to the differences in the traffic on the different roads and highways, as well as variations in PTEs content of soils in different parts of the world.
Further assessment of pollution degree of the dust samples was performed using the geo-accumulation index. The computed Igeo for the samples varied from −7.765 for Ni in sample D2 (from Bushika bridge at the junction with Bududa–Manafwa road) to 2.591 for Pb in sample D6 from Bududa town (Table 5). These, according to the categorization suggested by Müller [46] (Supplementary Materials: Table S1), correspond to practically uncontaminated to median to strongly contaminated dusts.
The E R i and PERI, on the other hand, proved that there is low to considerable ecological risks imposed by dust in the studied sites, specifically with respect to Cd and Pb (Table 6). The risk in order of severity followed the concatenation: Cr < Zn < Ni <Cu < Mn < Pb < Cd. The high levels of Cd and Pb in environmental compartments can be attributed to the use of leaded petrol and lead-based paints as well as disposal of dead nickel–cadmium batteries and lead–acid accumulators [65,66]. Altogether, these results attest to the fact that the ecological biodiversity of the studied sites is at low to moderate risk.

3.4. Health Risks Assessment Results

The daily dose through ingestion span from 0.3 × 10⁻⁶ mg kg−1 day−1 for Cd ingested by adults at D1 to 36,068.6 × 10−6 mg kg−1 day−1 for Mn ingested by children at D5. Through inhalation, the values were from 0.00003 × 10⁻⁶ mg kg−1 day−1 for Cd ingested by adults at D1 to 0.9837 × 10⁻⁶ mg kg−1 day−1 for Mn ingested by children at D5 (Table S3). Through dermal contact, the corresponding values were 0.0038 × 10⁻⁶ to 56.11 × 10⁻⁶ mg kg−1 day−1. These values never surpassed the reference doses for all the exposure routes. Thus, the hazard quotients were less than 1.0 for all the sampling sites. However, the hazard index surpassed 1.0 for all the sampling points for ingestion of PTEs in dust by children. Precisely, Pb and Mn were the major contributors to the non-carcinogenic effects that could be experienced in the studied parts. Except for health risk assessments, Pb initially had no tolerable reference dose via ingestion, indicating that the risks associated with its ingestion may be higher than found in this study.
For the incremental life cancer risks, the risk values of the individual groups at different locations were computed and are summarized in the Supplementary Materials (Table S4). For the ingestion pathway, the values ranged from 0.0090 × 10⁻⁸ for Ni at D2 to 3.583 × 10⁻⁸ for Cr at D5. Via inhalation, the values span from 0.0056 × 10⁻⁸ for Ni at D2 to 176.700 × 10⁻⁸ for Cr at D5. Through dermal contact, the cancer risk values were from 0.0003 × 10⁻⁸ for Ni at D2 to 0.1092 × 10⁻⁸ for Cr at D5. For all the three exposure pathways, the risk values were lower than 1 × 10⁻⁶. Conclusively, these results suggest that carcinogenic risks from PTEs in the dusts are negligible.

4. Conclusions

This study showed that there is severe PTEs pollution of dusts from roads, highways and pedestrian bridges in Eastern Uganda when compared with their crustal averages, with the exception for Cu, Ni and Cr. Though, there is no Ugandan standard for PTEs concentration in road dusts, the concentrations of the elements found in Eastern Uganda are relatively lower when compared to previous studies around the world. Source apportionment studies suggests that the higher PTEs concentrations are due to a combination of both anthropogenic (combustion processes and vehicular traffic) and geogenic contributions. With regards to CF, there is low to very high contamination of dust from the studied parts of urban roads, highways and bridges, particularly with regard to Pb, Mn and Cd. Assessment using PLI indicated that dust from Zikoye–Bushika road, the junction of Zikoye–Bushika and Bududa–Manafwa roads and Manafwa town were substantially polluted as the indices were greater than 1. Further assessment of pollution degree of the dust samples using Igeo revealed that the dusts showed practically uncontaminated to medium-to-strong contamination. Health risks assessment showed that there are discernable non-carcinogenic health risks that could arise from ingestion of PTEs in dusts from the studied areas of Eastern Uganda by children. This study, therefore, opens the lead for investigation of the occurrence and health risks from PTEs in road dusts of busy Ugandan cities, highways and industrial areas.

Supplementary Materials

The following supporting information can be downloaded at: https://www.mdpi.com/article/10.3390/pollutants3010007/s1. Table S1. Classification values of pollution and risk indices and their description; Table S2. Values of exposure factors for children and adults used in health risk assessments; Table S3. Average daily dose, hazard quotient and indices through ingestion, inhalation and dermal adsorption of PTEs in dust from selected urban roads, highways and pedestrian bridges in Eastern Uganda; Table S4. Carcinogenic risks due to ingestion, dermal contact and inhalation of carcinogenic PTEs in dusts sampled from selected urban roads, highways and pedestrian bridges in Eastern Uganda [67,68,69,70,71,72,73].

Author Contributions

Conceptualization, M.O., C.A. and E.N.; methodology, M.O. and T.O.; software, T.O.; validation, T.O., C.A. and E.N.; formal analysis, M.O.; investigation, M.O.; resources, M.O.; data curation, M.O. and T.O.; writing—original draft preparation, M.O. and T.O.; writing—review and editing, T.O., C.A. and E.N.; visualization, T.O.; supervision, C.A. and E.N. All authors have read and agreed to the published version of the manuscript.

Funding

This research received no external funding.

Data Availability Statement

Data supporting the conclusions of this study are available on request from the authors.

Acknowledgments

Timothy Omara acknowledges Austrian Partnership Program in Higher Education and Research (APPEAR) for the doctoral fellowship awarded to him through its academic partnership project 249 “Environmental Chemistry for Sustainable Development (ECSDevelop)’’ hosted at Makerere University, Uganda which made this collaborative communication possible. APPEAR is a program of the Austrian Development Cooperation (ADC) and is implemented by Austria’s Agency for Education and Internationalization (OeAD-GmbH). OEZA Project number: 0894-01/2020.

Conflicts of Interest

The authors declare no conflict of interest.

References

  1. Radoine, H.; Bajja, S.; Chenal, J.; Ahmed, Z. Impact of urbanization and economic growth on environmental quality in western africa: Do manufacturing activities and renewable energy matter? Front. Environ. Sci. 2022, 10, 1012007. [Google Scholar] [CrossRef]
  2. Li, C.; McLinden, C.; Fioletov, V.; Krotkov, N.; Carn, S.; Joiner, J.; Streets, D.; He, H.; Ren, X.; Li, Z.; et al. India Is Overtaking China as the World’s Largest Emitter of Anthropogenic Sulfur Dioxide. Sci. Rep. 2017, 7, 14304. [Google Scholar] [CrossRef] [Green Version]
  3. Abdul Jabbar, S.; Tul Qadar, L.; Ghafoor, S.; Rasheed, L.; Sarfraz, Z.; Sarfraz, A.; Sarfraz, M.; Felix, M.; Cherrez-Ojeda, I. Air Quality, Pollution and Sustainability Trends in South Asia: A Population-Based Study. Int. J. Environ. Res. Public Health 2022, 19, 7534. [Google Scholar] [CrossRef] [PubMed]
  4. Baguma, G.; Musasizi, A.; Twinomuhwezi, H.; Gonzaga, A.; Nakiguli, C.K.; Onen, P.; Angiro, C.; Okwir, A.; Opio, B.; Otema, T.; et al. Heavy Metal Contamination of Sediments from an Exoreic African Great Lakes’ Shores (Port Bell, Lake Victoria), Uganda. Pollutants 2022, 2, 407–421. [Google Scholar] [CrossRef]
  5. WHO. Air Pollution. 2021. Available online: https://www.who.int/health-topics/air-pollution (accessed on 2 October 2022).
  6. Shao, L.; Ge, S.; Jones, T.; Santosh, M.; Silva, L.F.O.; Cao, Y.; Oliveira, M.L.S.; Zhang, M.; BéruBé, K. The role of airborne particles and environmental considerations in the transmission of SARS-CoV-2. Geosci. Front. 2021, 12, 101189. [Google Scholar] [CrossRef]
  7. Khan, A.; Plana-Ripoll, O.; Antonsen, S.; Brandt, J.; Geels, C.; Landecker, H.; Sullivan, P.F.; Pedersen, C.B.; Rzhetsky, A. Environmental pollution is associated with increased risk of psychiatric disorders in the US and Denmark. PLoS Biol. 2019, 17, e3000353. [Google Scholar] [CrossRef] [Green Version]
  8. Weitekamp, C.A.; Hofmann, H.A. Effects of air pollution exposure on social behavior: A synthesis and call for research. Environ. Health 2021, 20, 72. [Google Scholar] [CrossRef]
  9. WHO. WHO Global Air Quality Guidelines: Particulate Matter (PM2.5 and PM10), Ozone, Nitrogen Dioxide, Sulfur Dioxide and Carbon Monoxide. 2021. Available online: https://www.who.int/publications/i/item/9789240034228 (accessed on 2 October 2022).
  10. Mohammed, F.S.; Crump, D. Characterization of Indoor/Outdoor Settled Dust and Air Pollutants in Damaturu, Nigeria. Int. J. Eng. Technol. 2013, 5, 104–108. [Google Scholar] [CrossRef] [Green Version]
  11. Daellenbach, K.R.; Uzu, G.; Jiang, J.; Cassagnes, L.E.; Leni, Z.; Vlachou, A.; Stefenelli, G.; Canonaco, F.; Weber, S.; Segers, A.; et al. Sources of particulate-matter air pollution and its oxidative potential in Europe. Nature 2020, 587, 414–419. [Google Scholar] [CrossRef]
  12. Xiao, K.; Yao, X.; Zhang, X.; Fu, N.; Shi, Q.; Meng, X.; Ren, X. Pollution Characteristics, Source Apportionment, and Health Risk Assessment of Potentially Toxic Elements (PTEs) in Road Dust Samples in Jiayuguan, Hexi Corridor, China. Toxics 2022, 10, 580. [Google Scholar] [CrossRef]
  13. Zheng, Y.; Gao, Q.; Wen, X.; Yang, M.; Chen, H.; Wu, Z.; Lin, X. Multivariate statistical analysis of heavy metals in foliage dust near pedestrian bridges in Guangzhou, South China in 2009. Environ. Earth Sci. 2013, 70, 107–113. [Google Scholar] [CrossRef] [Green Version]
  14. Jeong, H.; Ra, K. Source apportionment and health risk assessment for potentially toxic elements in size-fractionated road dust in Busan Metropolitan City, Korea. Environ. Monit. Assess. 2022, 194, 350. [Google Scholar] [CrossRef] [PubMed]
  15. Li, H.H.; Chen, L.J.; Yu, L.; Guo, Z.B.; Shan, C.Q.; Lin, J.Q.; Gu, Y.G.; Yang, Z.B.; Yang, Y.X.; Shao, J.R.; et al. Pollution characteristics and risk assessment of human exposure to oral bioaccessibility of heavy metals via urban street dusts from different functional areas in Chengdu, China. Sci. Total Environ. 2017, 586, 1076–1084. [Google Scholar] [CrossRef]
  16. Wei, X.; Gao, B.; Wang, P.; Zhou, H.; Lu, J. Pollution characteristics and health risk assessment of heavy metals in street dusts from different functional areas in Beijing, China. Ecotoxicol. Environ. Saf. 2015, 112, 186–192. [Google Scholar] [CrossRef]
  17. Nazzal, Y.; Ghrefat, H.; Rosen, M.A. Heavy Metal Contamination of Roadside Dusts: A Case Study for Selected Highways of the Greater Toronto Area, Canada Involving Multivariate Geostatistics. Res. J. Environ. Sci. 2014, 8, 259–273. [Google Scholar] [CrossRef] [Green Version]
  18. Shahab, A.; Zhang, H.; Ullah, H.; Rashid, A.; Rad, S.; Li, J.; Xiao, H. Pollution characteristics and toxicity of potentially toxic elements in road dust of a tourist city, Guilin, China: Ecological and health risk assessment. Environ. Pollut. 2020, 266, 115419. [Google Scholar] [CrossRef]
  19. Cowan, N.; Blair, D.; Malcolm, H.; Graham, M. A survey of heavy metal contents of rural and urban roadside dusts: Comparisons at low, medium and high traffic sites in Central Scotland. Environ. Sci. Pollut. Res. Int. 2021, 28, 7365–7378. [Google Scholar] [CrossRef] [PubMed]
  20. Mondal, S.; Singh, G. Pollution evaluation, human health effect and tracing source of trace elements on road dust of Dhanbad, a highly polluted industrial coal belt of India. Environ. Geochem. Health 2021, 43, 2081–2103. [Google Scholar] [CrossRef] [PubMed]
  21. Ferreira-Baptista, L.; De Miguel, E. Geochemistry and risk assessment of street dust in Luanda, Angola: A tropical urban environment. Atmos. Environ. 2005, 39, 4501–4512. [Google Scholar] [CrossRef] [Green Version]
  22. Li, J.; Cao, D.; Huang, Y.; Chen, B.; Chen, Z.; Wang, R.; Dong, Q.; Wei, Q.; Liu, L. Zinc Intakes and Health Outcomes: An Umbrella Review. Front. Nutr. 2022, 9, 798078. [Google Scholar] [CrossRef]
  23. Zhang, Y.; Song, M.; Mucci, L.A. Zinc Supplement Use and Risk of Aggressive Prostate Cancer: A 30-Year Follow-Up Study. Eur. J. Epidemiol. 2022, 37, 1251–1260. [Google Scholar] [CrossRef] [PubMed]
  24. Balali-Mood, M.; Naseri, K.; Tahergorabi, Z.; Khazdair, M.R.; Sadeghi, M. Toxic Mechanisms of Five Heavy Metals: Mercury, Lead, Chromium, Cadmium, and Arsenic. Front. Pharmacol. 2021, 12, 643972. [Google Scholar] [CrossRef]
  25. Eid, R.; Arab, N.T.; Greenwood, M.T. Iron mediated toxicity and programmed cell death: A review and a re-examination of existing paradigms. Biochim. Biophys. Acta Mol. Cell. Res. 2017, 1864, 399–430. [Google Scholar] [CrossRef] [PubMed]
  26. Ray, R.R. Adverse hematological effects of hexavalent chromium: An overview. Interdiscip. Toxicol. 2016, 9, 55–65. [Google Scholar] [CrossRef] [PubMed] [Green Version]
  27. Moskovchenko, D.; Pozhitkov, R.; Ukarkhanova, D. Geochemistry of street dust in Tyumen, Russia: Influence of traffic load. Environ. Sci. Pollut. Res. 2022, 29, 31180–31197. [Google Scholar] [CrossRef] [PubMed]
  28. Atiemo, S.M.; Ofosu, G.F.; Kuranchie-Mensah, H.; Osei Tutu, A.; Linda Palm, N.D.M.; Blankson, S.A. Levels and sources of heavy metal contamination in road dust in selected major highways of Accra, Ghana. Xray Spectrom. 2012, 41, 105–110. [Google Scholar] [CrossRef]
  29. Bampoe, E.; Cobbina, S.J.; Doke, D.A. Assessment of heavy metal levels and associated human health risk in dust from high and low traffic transport stations in the Tamale metropolis, in the northern region of Ghana. Int. J. Environ. Sci. Technol. 2022. [Google Scholar] [CrossRef]
  30. City Population. Uganda (Eastern). Available online: https://www.citypopulation.de/en/uganda/admin/EAS__eastern/ (accessed on 12 November 2022).
  31. Nugent, P.; Soi, I. One-stop border posts in East Africa: State encounters of the fourth kind. J. East. Afr. Stud. 2020, 14, 433–454. [Google Scholar] [CrossRef]
  32. Fitzmaurice, M.; Hartmann, O. Border Crossing Monitoring along the Northern Corridor. The International Bank for Reconstruction and Development/The World Bank. 2013. Available online: https://www.ssatp.org/sites/ssatp/files/publications/SSATPWP96-border-crossing_1.pdf (accessed on 12 November 2022).
  33. Collins, T. East African Community Battles Trade Disruption. 2020. Available online: https://african.business/2020/08/trade-investment/east-african-community-battles-trade-disruption/ (accessed on 12 November 2022).
  34. Joshua. Places to visit in Eastern Uganda. 2022. Available online: https://toptenuganda.com/places-to-visit-in-eastern-uganda/ (accessed on 12 November 2022).
  35. Turyahabwe, R.; Asaba, J.; Mulabbi, A.; Osuna, C. Environmental and Socio-economic Impact Assessment of Stone Quarrying in Tororo District, Eastern Uganda. East Afr. J. Environ. Nat. Res. 2021, 4, 1–14. [Google Scholar] [CrossRef]
  36. Omollo, J. Tororo Locals Fault Cement Factory over Air Pollution. 2022. Available online: https://www.monitor.co.ug/uganda/news/national/tororo-locals-fault-cement-factory-over-air-pollution-4011252 (accessed on 12 November 2022).
  37. Hartston, W. Top 10 Facts about Thunder. 2014. Available online: https://www.express.co.uk/life-style/top10facts/480476/Top-10-facts-about-thunder (accessed on 10 July 2020).
  38. Guinness World Records. Most Thunder Days per Year. Available online: https://www.guinnessworldrecords.com/world-records/66531-most-thunder-days-per-year#:~:text=Thunder%2Ddays%20%2D%20world%20In%20Tororo,%2Dyear%20period%201967%2D76 (accessed on 12 November 2022).
  39. Atuyambe, L.M.; Ediau, M.; Orach, C.G.; Musenero, M.; Bazeyo, W. Land slide disaster in eastern Uganda: Rapid assessment of water, sanitation and hygiene situation in Bulucheke camp, Bududa district. Environ. Health 2011, 10, 38. [Google Scholar] [CrossRef]
  40. Broeckx, J.; Maertens, M.; Isabirye, M.; Vanmaercke, M.; Namazzi, B.; Deckers, J.; Tamale, J.; Jacobs, L.; Thiery, W.; Kervyn, M.; et al. Landslide susceptibility and mobilization rates in the Mount Elgon region, Uganda. Landslides 2019, 16, 571–584. [Google Scholar] [CrossRef]
  41. Opedes, H.; Mücher, S.; Baartman, J.E.M.; Nedala, S.; Mugagga, F. Land Cover Change Detection and Subsistence Farming Dynamics in the Fringes of Mount Elgon National Park, Uganda from 1978–2020. Remote Sens. 2022, 14, 2423. [Google Scholar] [CrossRef]
  42. Love Uganda Safaris. River Manafwa. 2022. Available online: https://www.loveugandasafaris.com/river-manafwa.html/ (accessed on 22 September 2022).
  43. Kabata-Pendias, A. Trace elements in soils and plants. In Trace Elements in Soils and Plants; Kabata-Pendias, A., Pendias, H.K., Eds.; Taylor & Francis: London, UK, 2011; Volume 548, p. 2010. [Google Scholar]
  44. Xiao, X.; Zhang, J.; Wang, H.; Han, X.; Ma, J.; Ma, Y.; Luan, H. Distribution and health risk assessment of potentially toxic elements in soils around coal industrial areas: A global meta-analysis. Sci. Total Environ. 2020, 713, 135292. [Google Scholar] [CrossRef] [PubMed]
  45. Hakanson, L. An ecological risk index for aquatic pollution control. A sedimentological approach. Water Res. 1980, 14, 975–1001. [Google Scholar] [CrossRef]
  46. Müller, G. Die Schwermetallbelastung der Sedimenten des Neckars und Seiner Nebenflüsse. Chem.-Zeitung. 1981, 6, 157–164. [Google Scholar]
  47. Chen, C.; Kao, C.; Chen, C.; Dong, C. Distribution and accumulation of heavy metals in the sediments of Kaohsiung harbor, Taiwan. Chemosphere 2007, 66, 1431–1440. [Google Scholar] [CrossRef]
  48. Zhang, W.; Feng, H.; Chang, J.; Qu, J.; Xie, H.; Yu, L. Heavy metal contamination in surface sediments of Yangtze river intertidal zone: An assessment from different indexes. Environ. Pollut. 2009, 157, 1533–1543. [Google Scholar] [CrossRef]
  49. US EPA. Risk Assessment Guidance for Superfund, Vol. I: Human Health Evaluation Manual (EPA/540/1–89/002); Office of Solid Waste and Emergency Response: Washington, DC, USA, 1989.
  50. Wang, S.; Wang, L.; Huan, Y.; Wang, R.; Liang, T. Concentrations, spatial distribution, sources and environmental health risks of potentially toxic elements in urban road dust across China. Sci. Total Environ. 2022, 805, 150266. [Google Scholar] [CrossRef]
  51. Ali, M.U.; Liu, G.; Yousaf, B.; Abbas, Q.; Ullah, H.; Munir, M.; Fu, B. Pollution characteristics and human health risks of potentially (eco)toxic elements (PTEs) in road dust from metropolitan area of Hefei, China. Chemosphere 2017, 181, 111–121. [Google Scholar] [CrossRef]
  52. Kabir, M.H.; Kormoker, T.; Shammi, R.S.; Tusher, T.R.; Islam, M.S.; Khan, R.; Omor, M.Z.U.; Sarker, M.E.; Yeasmin, M.; Idris, A.M. A comprehensive assessment of heavy metal contamination in road dusts along a hectic national highway of Bangladesh: Spatial distribution, sources of contamination, ecological and human health risks. Toxin Rev. 2022, 41, 860–879. [Google Scholar] [CrossRef]
  53. Haney, I.j., Jr. Development of an inhalation unit risk factor for cadmium. Reg. Toxicol. Pharmacol. 2016, 77, 175–183. [Google Scholar] [CrossRef] [PubMed]
  54. US EPA. Chromium(VI). CASRN 18540-29-9|DTXSID7023982. 2017. Available online: https://cfpub.epa.gov/ncea/iris2/chemicallanding.cfm?substance_nmbr=144 (accessed on 16 November 2022).
  55. Alidadi, H.; Tavakoly Sany, S.B.; Zarif Garaati Oftadeh, B.; Mohamad, T.; Shamszade, H.; Fakhari, M. Health risk assessments of arsenic and toxic heavy metal exposure in drinking water in northeast Iran. Environ. Health Prevent. Med. 2019, 24, 59. [Google Scholar] [CrossRef] [PubMed] [Green Version]
  56. Nteziyaremye, P.; Omara, T. Bioaccumulation of priority trace metals in edible muscles of West African lungfish (Protopterus annectens Owen, 1839) from Nyabarongo River, Rwanda. Cogent Environ. Sci. 2020, 6, 1779557. [Google Scholar] [CrossRef]
  57. Suvetha, M.; Partheeban, E.C.; Anbazhagan, V.; Rajendran, R.; Bilal, A.P.; Sajad, A. Are we at risk because of road dust? An ecological and health risk assessment of heavy metals in a rapid growing city in South India. Environ. Adv. 2022, 7, 100165. [Google Scholar] [CrossRef]
  58. Adamiec, E.; Jarosz-Krzemińska, E.; Wieszała, R. Heavy metals from non-exhaust vehicle emissions in urban and motorway road dusts. Environ. Monit. Assess. 2016, 188, 369. [Google Scholar] [CrossRef] [Green Version]
  59. Zhang, C.X.; Qiao, Q.; Appel, E.; Huang, B. Discriminating sources of anthropogenic heavy metals in urban street dusts using magnetic and chemical methods. J. Geochem. Explor. 2012, 119, 60–75. [Google Scholar] [CrossRef]
  60. Faiz, Y.; Tufail, M.; Javed, M.T.; Chaudhry, M.M.; Naila, S. Road dust pollution of Cd, Cu, Ni, Pb and Zn along Islamabad expressway Pakistan. Microchem. J. 2009, 92, 186–192. [Google Scholar] [CrossRef]
  61. Al-Taani, A.A.; Nazzal, Y.; Howari, F.M. Assessment of heavy metals in roadside dust along the Abu Dhabi–Al Ain National Highway, UAE. Environ. Earth Sci. 2019, 78, 411. [Google Scholar] [CrossRef]
  62. Žibret, G.; Rokavec, D. Household dust and street sediment as an indicator of recent heavy metals in atmospheric emissions: A case study on a previously heavily contaminated area. Environ. Earth Sci. 2010, 61, 443–453. [Google Scholar] [CrossRef]
  63. Chen, H.; Zhan, C.; Liu, S.; Zhang, J.; Liu, H.; Liu, Z.; Liu, T.; Liu, X.; Xiao, W. Pollution Characteristics and Human Health Risk Assessment of Heavy Metals in Street Dust from a Typical Industrial Zone in Wuhan City, Central China. Int. J. Environ. Res. Public Health 2022, 19, 10970. [Google Scholar] [CrossRef]
  64. Gope, M.; Masto, R.E.; George, J.; Hoque, R.R.; Balachandran, S. Bioavailability and health risk of some potentially toxic elements (Cd, Cu, Pb and Zn) in street dust of Asansol, India. Ecotoxicol. Environ. Saf. 2017, 138, 231–241. [Google Scholar] [CrossRef] [PubMed]
  65. Huang, X.; Luo, D.; Zhao, D.; Li, N.; Xiao, T.; Liu, J.; Wei, L.; Liu, Y.; Liu, L.; Liu, G. Distribution, Source and Risk Assessment of Heavy Metal(oid)s in Water, Sediments, and Corbicula Fluminea of Xijiang River, China. Int. J. Environ. Res. Public Health 2019, 16, 1823. [Google Scholar] [CrossRef] [Green Version]
  66. Algül, F.; Beyhan, M. Concentrations and sources of heavy metals in shallow sediments in Lake Bafa, Turkey. Sci. Rep. 2020, 10, 11782. [Google Scholar] [CrossRef] [PubMed]
  67. The Risk Assessment Information System. Chemical Toxicity Values. Available online: https://rais.ornl.gov/cgi-bin/tools/TOX_search?select=chemtox (accessed on 3 December 2022).
  68. US EPA. Child-Specific Exposure Factors Handbook. EPA-600-P-00–002B. National Center for Environmental Assessment: Washington, DC, USA, 2001. [Google Scholar]
  69. US EPA. Child-Specific Exposure Factors Handbook. EPA-600-P-00–002B. National Center for Environmental Assessment: Washington, DC, USA, 2002. [Google Scholar]
  70. US EPA. Risk Assessment Guidance for Superfund: Volume III-part A. EPA540-R-02–002. Process for Conducting Probabilistic Risk Assessment: Washington, DC, USA, 2001. [Google Scholar]
  71. Li, X.D.; Poon, C.S.; Hui, P.S. Heavy metal contamination of urban soils and street dust in Hong Kong. Appl. Geochem. 2001, 16, 1361–1368. [Google Scholar] [CrossRef]
  72. Omara, T.; Karungi, S.; Kalukusu, R.; Nakabuye, B.; Kagoya, S.; Musau, B. Mercuric pollution of surface water, superficial sediments, Nile tilapia (Oreochromis nilotica Linnaeus 1758 [Cichlidae]) and yams (Dioscorea alata) in auriferous areas of Namukombe stream, Syanyonja, Busia, Uganda. PeerJ 2019, 7, e7919. [Google Scholar] [CrossRef] [PubMed] [Green Version]
  73. Zheng, N.; Liu, J.; Wang, Q.; Liang, Z. Health risk assessment of heavy metal exposure to street dust in the zinc smelting district, Northeast of China. Sci. Total Environ. 2010, 408, 726–733. [Google Scholar] [CrossRef] [PubMed]
Figure 1. Map of Eastern Uganda showing where dust samples were taken. Further details on the description of the sampling sites (D1 to D8) are given in Table 1.
Pollutants 03 00007 g001
Figure 2. Concentration of potentially ecotoxic elements (mg kg−1) in dust samples from urban roads, highways and pedestrian bridges in Eastern Uganda. Sampling sites are: D1 = Bushika bridge crossing from Bubulo to Busiu; D2 = Roadside of Bushika bridge at the junction with Bududa–Manafwa road; D3 = Zikoye–Bushika road but within the Bubulo bridge; D4 = Junction of Zikoye–Bushika and Bududa–Manafwa roads of Bubulo bridge; D5 = Manafwa town (Bududa–Manafwa highway); D6 = Bududa town (Bududa–Manafwa highway); D7 = Manafwa bridge (Mbale–Tororo highway); D8 = Mbale–Tororo highway.
Pollutants 03 00007 g002
Figure 3. Loadings of principal components for the seven potentially (eco)toxic elements in dust samples from selected highways, pedestrian bridges and urban roads in Eastern Uganda. PC1 = First principal component, and PC2 = Second principal component.
Pollutants 03 00007 g003
Figure 4. Hierarchical dendrogram for the seven PTEs in dust from selected highways, pedestrian bridges and urban roads in Eastern Uganda.
Pollutants 03 00007 g004
Table 1. Sites where dust samples were obtained in Eastern Uganda.
Sample IDSampling Site DescriptionCoordinatesSamples TakenTraffic Load
D1Bushika bridge crossing from Bubulo to Busiu0°56′56.904″ N 34°16′36.408″ E3Moderate traffic flow
D2Roadside of Bushika bridge at the junction with Bududa–Manafwa road1°0′31.932″ N 34°19′53.22″ E3High traffic flow
D3 Zikoye–Bushika road but within the Bubulo bridge 1°4′12.216″ N 34°20′6.6408″ E3Low traffic flow
D4Junction of Zikoye–Bushika and Bududa–Manafwa roads of Bubulo bridge1°4′12.211″ N 34°20′6.6405″ E3Low traffic flow
D5 Manafwa town (Bududa–Manafwa highway) 0°56′56.904″ N 34°16′36.408″ E3High vehicular traffic
D6Bududa town (Bududa–Manafwa highway) 1°0′31.932″ N 34°19′53.22″ E3High traffic flow
D7Manafwa bridge (Mbale–Tororo highway)0°41′35.268″ N 34°10′51.6″ E3Bridge was under repair
D8Mbale–Tororo highway1°08′20.0″ N 34°09′54.0″ E3Light traffic flow
Table 2. Comparison of PTE concentrations (mg kg−1) in dust from urban roads, highways and pedestrian bridges in Eastern Uganda with previous studies.
Location (Country)CuNiMnZnPbCdCrReferences
Eastern Uganda11.4–23.20.20–23.20465.0–2630.026.8–199.0185.0–244.00.178–1.9945.40–56.60This study
Tamale metropolis (Ghana)44.7–67.611.5–18.5423.2–581.6165.7–254.416.7–17.721.0–28.8Bampoe et al. [29]
Damaturu (Nigeria) 8.16–68.405.75–14.990.83–1.1515.43–89.724.22–15.66Mohammed and Crump [10]
Accra (Ghana)29.01–76.536.46–15.88235.93–379.63124.52–371.6633.64–117.45123.75–220.37Atiemo et al. [28]
Luanda (Angola)18.0–118.06.2–32.0157.0–728.0142.0–1412.074.0–1856.00.7–4.017.0–37.0Ferreira-Baptista et al. [21]
Islamabad Expressway (Pakistan)30.0–80.010.0–30.064.3–169.060.0–150.04.5–6.8Faiz et al. [60]
Dhanbad (India)169.02626.03458.0230.063.0394.03.23Nondal and Singh [20]
Kushtia–Jhenaidah highway(Bangladesh)82.614.1126.250.80.1820.1Kabir et al. [52]
Tiruchirappalli city (India)11.8447.080.2411.47Suvetha et al. [57]
Edinburgh (United Kingdom)81.5–107.664.2–101.4112–2683.3–4.1Cowan et al. [19]
Abu Dhabi–Al Ain National Highway (UAE)0.1–0.7227.9–276537.4–398.620.1–1230.3–0.719–1540Al-Taani et al. [61]
—means not determined.
Table 3. Pearson’s bivariate correlation matrix for PTEs in dust from Eastern Uganda.
VariablesCuNiMnZnPbCdCr
Cu1
Ni0.4651
Mn0.690 10.896 1,21
Zn0.1370.5390.4251
Pb0.277−0.034−0.050−0.0591
Cd0.2320.4400.2260.787 10.3761
Cr0.4470.6280.729 1−0.257−0.139−0.3301
1 Significant at the 0.05 level (two-tailed). 2 Correlation is also significant at 0.01 level (two-tailed).
Table 4. Total variance explained and rotated component matrices for the PTEs in the dusts.
VariablePrincipal Component
PC1PC2PC3
Cu0.3980.1040.424
Ni0.5250.030−0.166
Mn0.5330.171−0.059
Zn0.314−0.492−0.369
Pb0.048−0.2520.805
Cd0.273−0.5920.051
Cr0.3260.5500.041
Initial eigenvalues3.20281.99321.2000
Explained variance (%)45.828.517.1
Cumulative variance (%)45.874.291.4
Table 5. Contamination assessment indices for dusts from selected urban roads, highways and pedestrian bridges in Eastern Uganda.
Sampling Site CuNiMnZnPbCdCrPLI
CFIgeoCFIgeoCFIgeoCFIgeoCFIgeoCFIgeoCFIgeo
D10.319−2.2170.276−2.4431.9700.3930.419−1.8416.8522.1920.445−1.7530.521−1.6190.730
D20.293−2.3560.007−7.7651.182−0.3440.538−1.4818.6852.5390.550−1.4480.161−3.2170.373
D30.869−0.7880.407−1.8823.9931.4131.141−0.3958.5262.5072.2000.5530.518−1.5351.481
D40.437−1.7790.621−1.2733.2141.0993.1091.05178.3042.4694.9851.7330.091−4.0471.394
D50.596−1.3310.800−0.9074.6061.6190.794−0.9188.9932.5842.2001.7330.951−0.6571.647
D60.514−1.5450.255−2.5551.287−0.2210.603−1.3149.0372.5912.7500.8750.188−2.9940.899
D70.375−1.9990.103−3.8580.814−0.8790.497−1.5949.0232.5892.7500.8750.148−3.3420.665
D80.488−1.6200.166−3.1801.6550.1420.703−1.0939.0072.5862.7500.8750.266−2.4980.934
Sampling sites are: D1 = Bushika bridge crossing from Bubulo to Busiu; D2 = Roadside of Bushika bridge at the junction with Bududa–Manafwa road; D3 = Zikoye–Bushika road but within the Bubulo bridge; D4 = Junction of Zikoye–Bushika and Bududa–Manafwa roads of Bubulo bridge; D5 = Manafwa town (Bududa–Manafwa highway); D6 = Bududa town (Bududa–Manafwa highway); D7 = Manafwa bridge (Mbale–Tororo highway); D8 = Mbale–Tororo highway.
Table 6. Ecological risks of PTEs in dust from selected urban roads, highways and pedestrian bridges in Eastern Uganda.
Sampling Site E R i PERIPollution Degree
CuNiMnZnPbCdCr
D11.5951.3801.9700.41934.26013.3501.04254.016Low
D21.4650.0351.1820.53843.42516.5000.32263.467Low
D34.3452.0353.9931.14142.63066.0001.036121.180Moderate
D42.1853.1053.2143.10941.520149.5500.182202.865Considerable
D52.9804.0004.6060.79444.96566.0001.902125.427Moderate
D62.5701.2751.2870.60345.18582.5000.376133.796Moderate
D71.8750.5150.8140.49745.11582.5000.296131.612Moderate
D82.4400.8301.6550.70345.03582.5000.532133.695Moderate
Sampling sites are: D1 = Bushika bridge crossing from Bubulo to Busiu; D2 = Roadside of Bushika bridge at the junction with Bududa–Manafwa road; D3 = Zikoye–Bushika road but within the Bubulo bridge; D4 = Junction of Zikoye–Bushika and Bududa–Manafwa roads of Bubulo bridge; D5 = Manafwa town (Bududa–Manafwa highway); D6 = Bududa town (Bududa–Manafwa highway); D7 = Manafwa bridge (Mbale–Tororo highway); D8 = Mbale–Tororo highway.
Disclaimer/Publisher’s Note: The statements, opinions and data contained in all publications are solely those of the individual author(s) and contributor(s) and not of MDPI and/or the editor(s). MDPI and/or the editor(s) disclaim responsibility for any injury to people or property resulting from any ideas, methods, instructions or products referred to in the content.

