1. Introduction
Water is regarded as a basic requirement for all living organisms. Around 3% of the world’s water resources are obtainable as freshwater. Only 0.01% of the 3% is available for human use. According to a recent study, a projected 1.1 billion people worldwide have no access to safe drinking water. About five million individuals die each year from rheumatoid arthritis. According to a UNO report, freshwater supplies are beginning to decline as global populations have begun to sharply rise [
1].
A recent report published by the Pakistan Medical Association stated that around two thirds of Pakistan’s 200 million people are deprived of clean drinking water, which puts them at greater risk of serious illness. In addition, according to the PMA report, very low water levels also account for 30% of diseases and 40% of deaths occurring in the country. The report spoke of the 2019 XDR-typhoid outbreak in Sindh and a strong poliovirus, yet to be eradicated. It is clear that these health concerns stem from sewage cleaning and poor water quality [
2]. Groundwater pollution in Pakistan is mainly caused by industrial products from, for example, the sugar processing, textile, mortar and cement production, leather, fertilizer, and food processing industries. Industrial pollution flows due to gravity, leading to global water pollution [
3].
Pakistan has the fourth highest water use in the world, while it has the world’s fifth largest population. Negative policies and actions that harm the environment, such as the removal of untreated industrial and domestic waste from water bodies, as well as changes in rainfall patterns, have exacerbated the country’s water shortage. Meanwhile, the rapid and irregular urbanization has exacerbated the country’s water resources, to the point where, in Pakistan’s largest city, several areas have had no choice but to live without a water pump for weeks. The IMF ranks Pakistan third on the list of countries suffering from severe water shortages, while some international organizations have warned that the country could run out of water by 2025 [
2].
Globally, Pakistan is the fourth country most affected by arsenic. Arsenic pollution is most severe in Sindh and rural Punjab. Bone and tooth fluorosis is caused by fluoride. Excess fluoride has been found in groundwater in the provinces of Quetta, Lahore, Kasur, Gujrat, Swabi, Nagarparkar, and Umerkot. The ripening of agricultural water and sanitation are both factors in the presence of nitrates. The provinces of Punjab and Balochistan have very high nitrate concentrations. In addition to anions, metals such as zinc, lead, nickel, and iron have been recorded in various parts of the world [
4].
The increased consumption of goods is the result of today’s growing social demands for economic prosperity and better living conditions. Chemicals have undoubtedly played an important part in many of the world’s main industries, including agriculture, manufacturing, housing, transportation, textiles, and health, significantly contributing to global warming [
5]. However, their use has led to further emissions of natural and human-made pollutants in the air, in water, and on land, containing gasses, heavy metals, organic complexes, solvable compounds, soluble particles, colors, nitrogen, and compounds [
6]. Rapid population growth and industrial development, polluted sewage systems, and the use of pesticides and fertilizers are causing underground water pollution that is not easily visible. Pollutants caused by human activities include bacteria, fertilizers, pesticides, and herbicides. Open sewers used to transport domestic and industrial wastewater are a major source of groundwater pollution. Sewage first enters the groundwater and reaches a layer of groundwater approximately 15 m below ground level [
7].
One of the most effective tools for informing the public and policymakers regarding water quality is the water quality index. It determines the water level by combining many features of water quality using a point system; the higher the score, the better the water quality, while the lower the score, the poorer the water quality [
8,
9]. Conventional drinking water quality assessments are based on testing the parameters of all contributory factors to quality conditions, either individually or in terms of their interaction [
10]. Such analysis requires a complete understanding of the science of drinking water and may not be available for an integrated quantity of drinking water resources [
11,
12]. Appropriate analytical techniques and translational expertise are required to bridge the communication gap regarding water quality that exists between scientists, decision makers, and the general public. To obtain a single number that indicates a lack of quality or fitness for use, water quality indicator (WQI) points combine the results of multiple water quality procedures [
13]. A lack of quality water resource indicators may be due to the status of drinking water sources [
14]. Horton developed a water quality indicator (WQI) model for the classification of water quality in 1965, which assesses the effect of a significant parameter that disturbs the non-standard quality of water. Depending on the parameter effect on water quality, each parameter is measured. The Canadian Council of Ministers of Environment’s Water Quality Index is the most frequently used around the world to measure water quality (CCME WQI). Another effective method is to utilize GIS software and the WQI to determine whether groundwater is suitable for drinking and agricultural use [
15].
The CCME WQI is an adaptable framework by which to develop an indicator that can be used to measure local drinking water quality issues and remediation [
16]. The CCME WQI is an indicator designed to associate average water quality values with standards for scoring from 0 to 100, with 0 being the lowest level and 100 the maximum. Employees are free to choose standards and recommendations that are appropriate for their needs, taking into account area-specific concerns and treatment when assessing drinking water sources [
17].
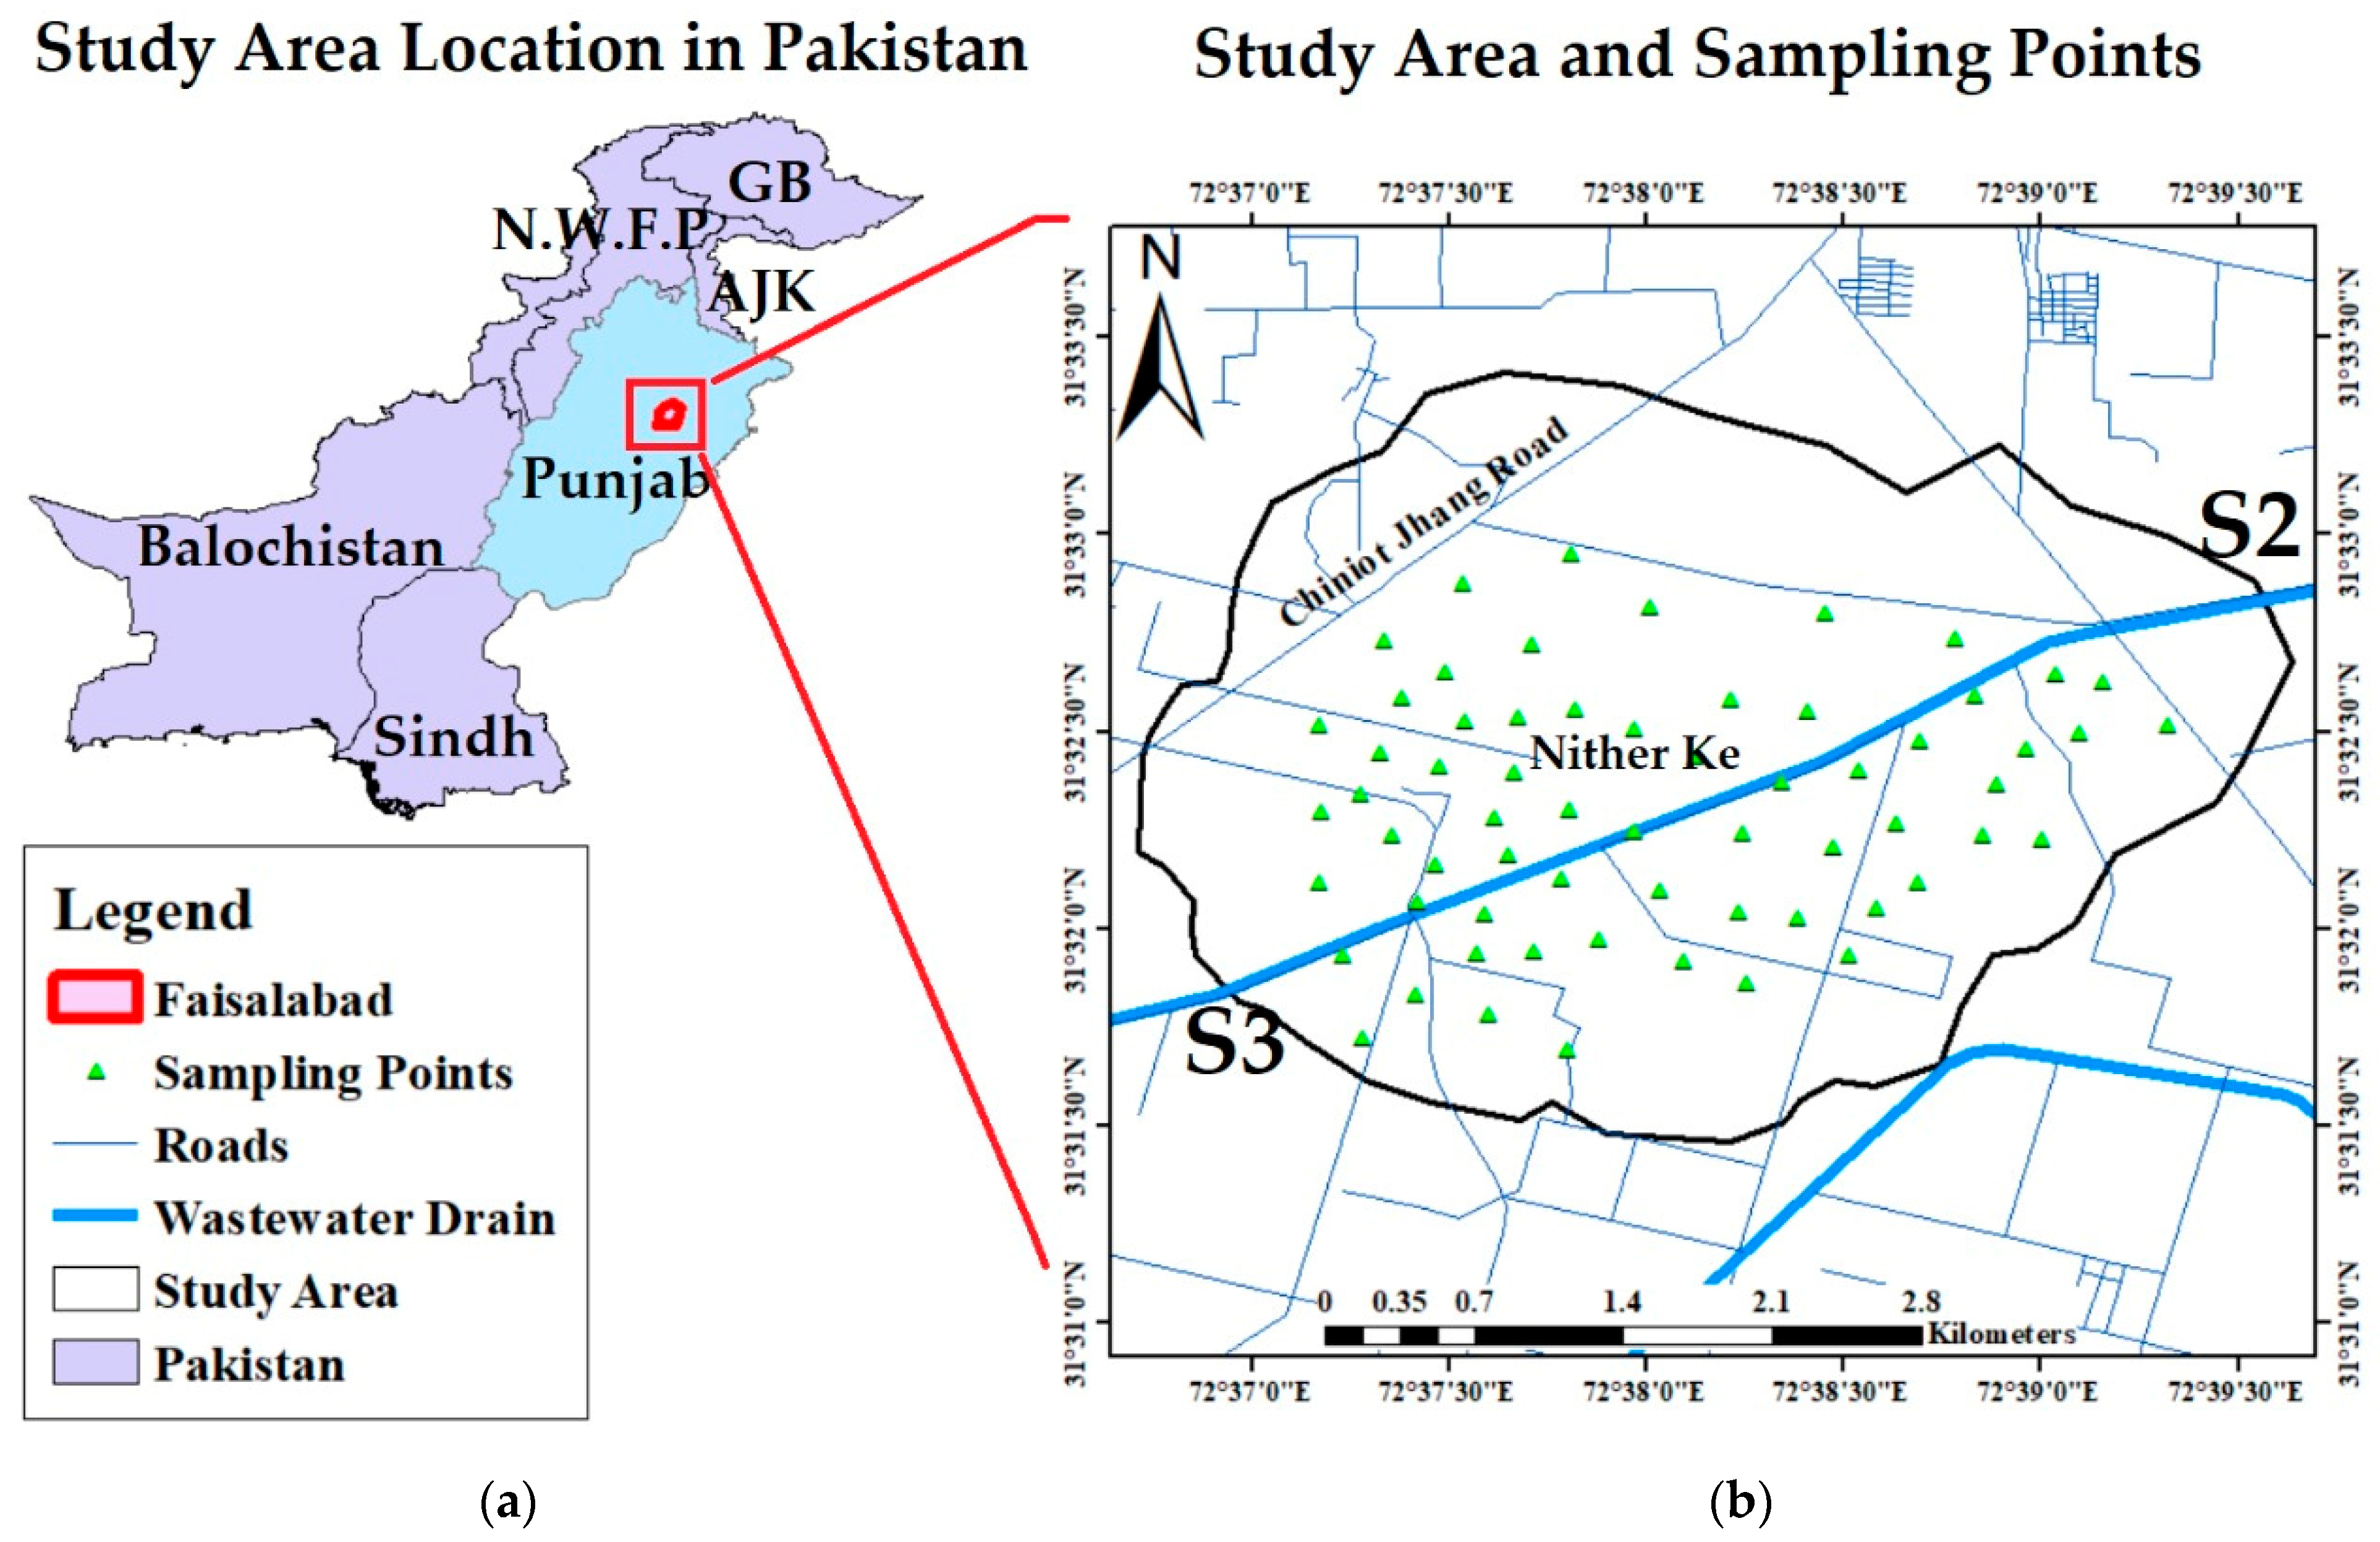
Study Area
Faisalabad is Pakistan’s third-largest city, with over 4 million inhabitants. The city is known for its diverse industries. It is also known as Pakistan’s textile industry hub, which makes up more than 65% of the Pakistani textile market. These industries produce a large amount of wastewater, so wastewater management is one of the main environmental problems of concern in this city. Wastewater discharge from industries passing through the city is, therefore, a major risk to city dwellers living near the canal due to the depletion of groundwater caused by leaking sewage. After flowing in various directions, the Paharang drain falls into the Chenab River. It is a 63.37 km long drain having no lining.
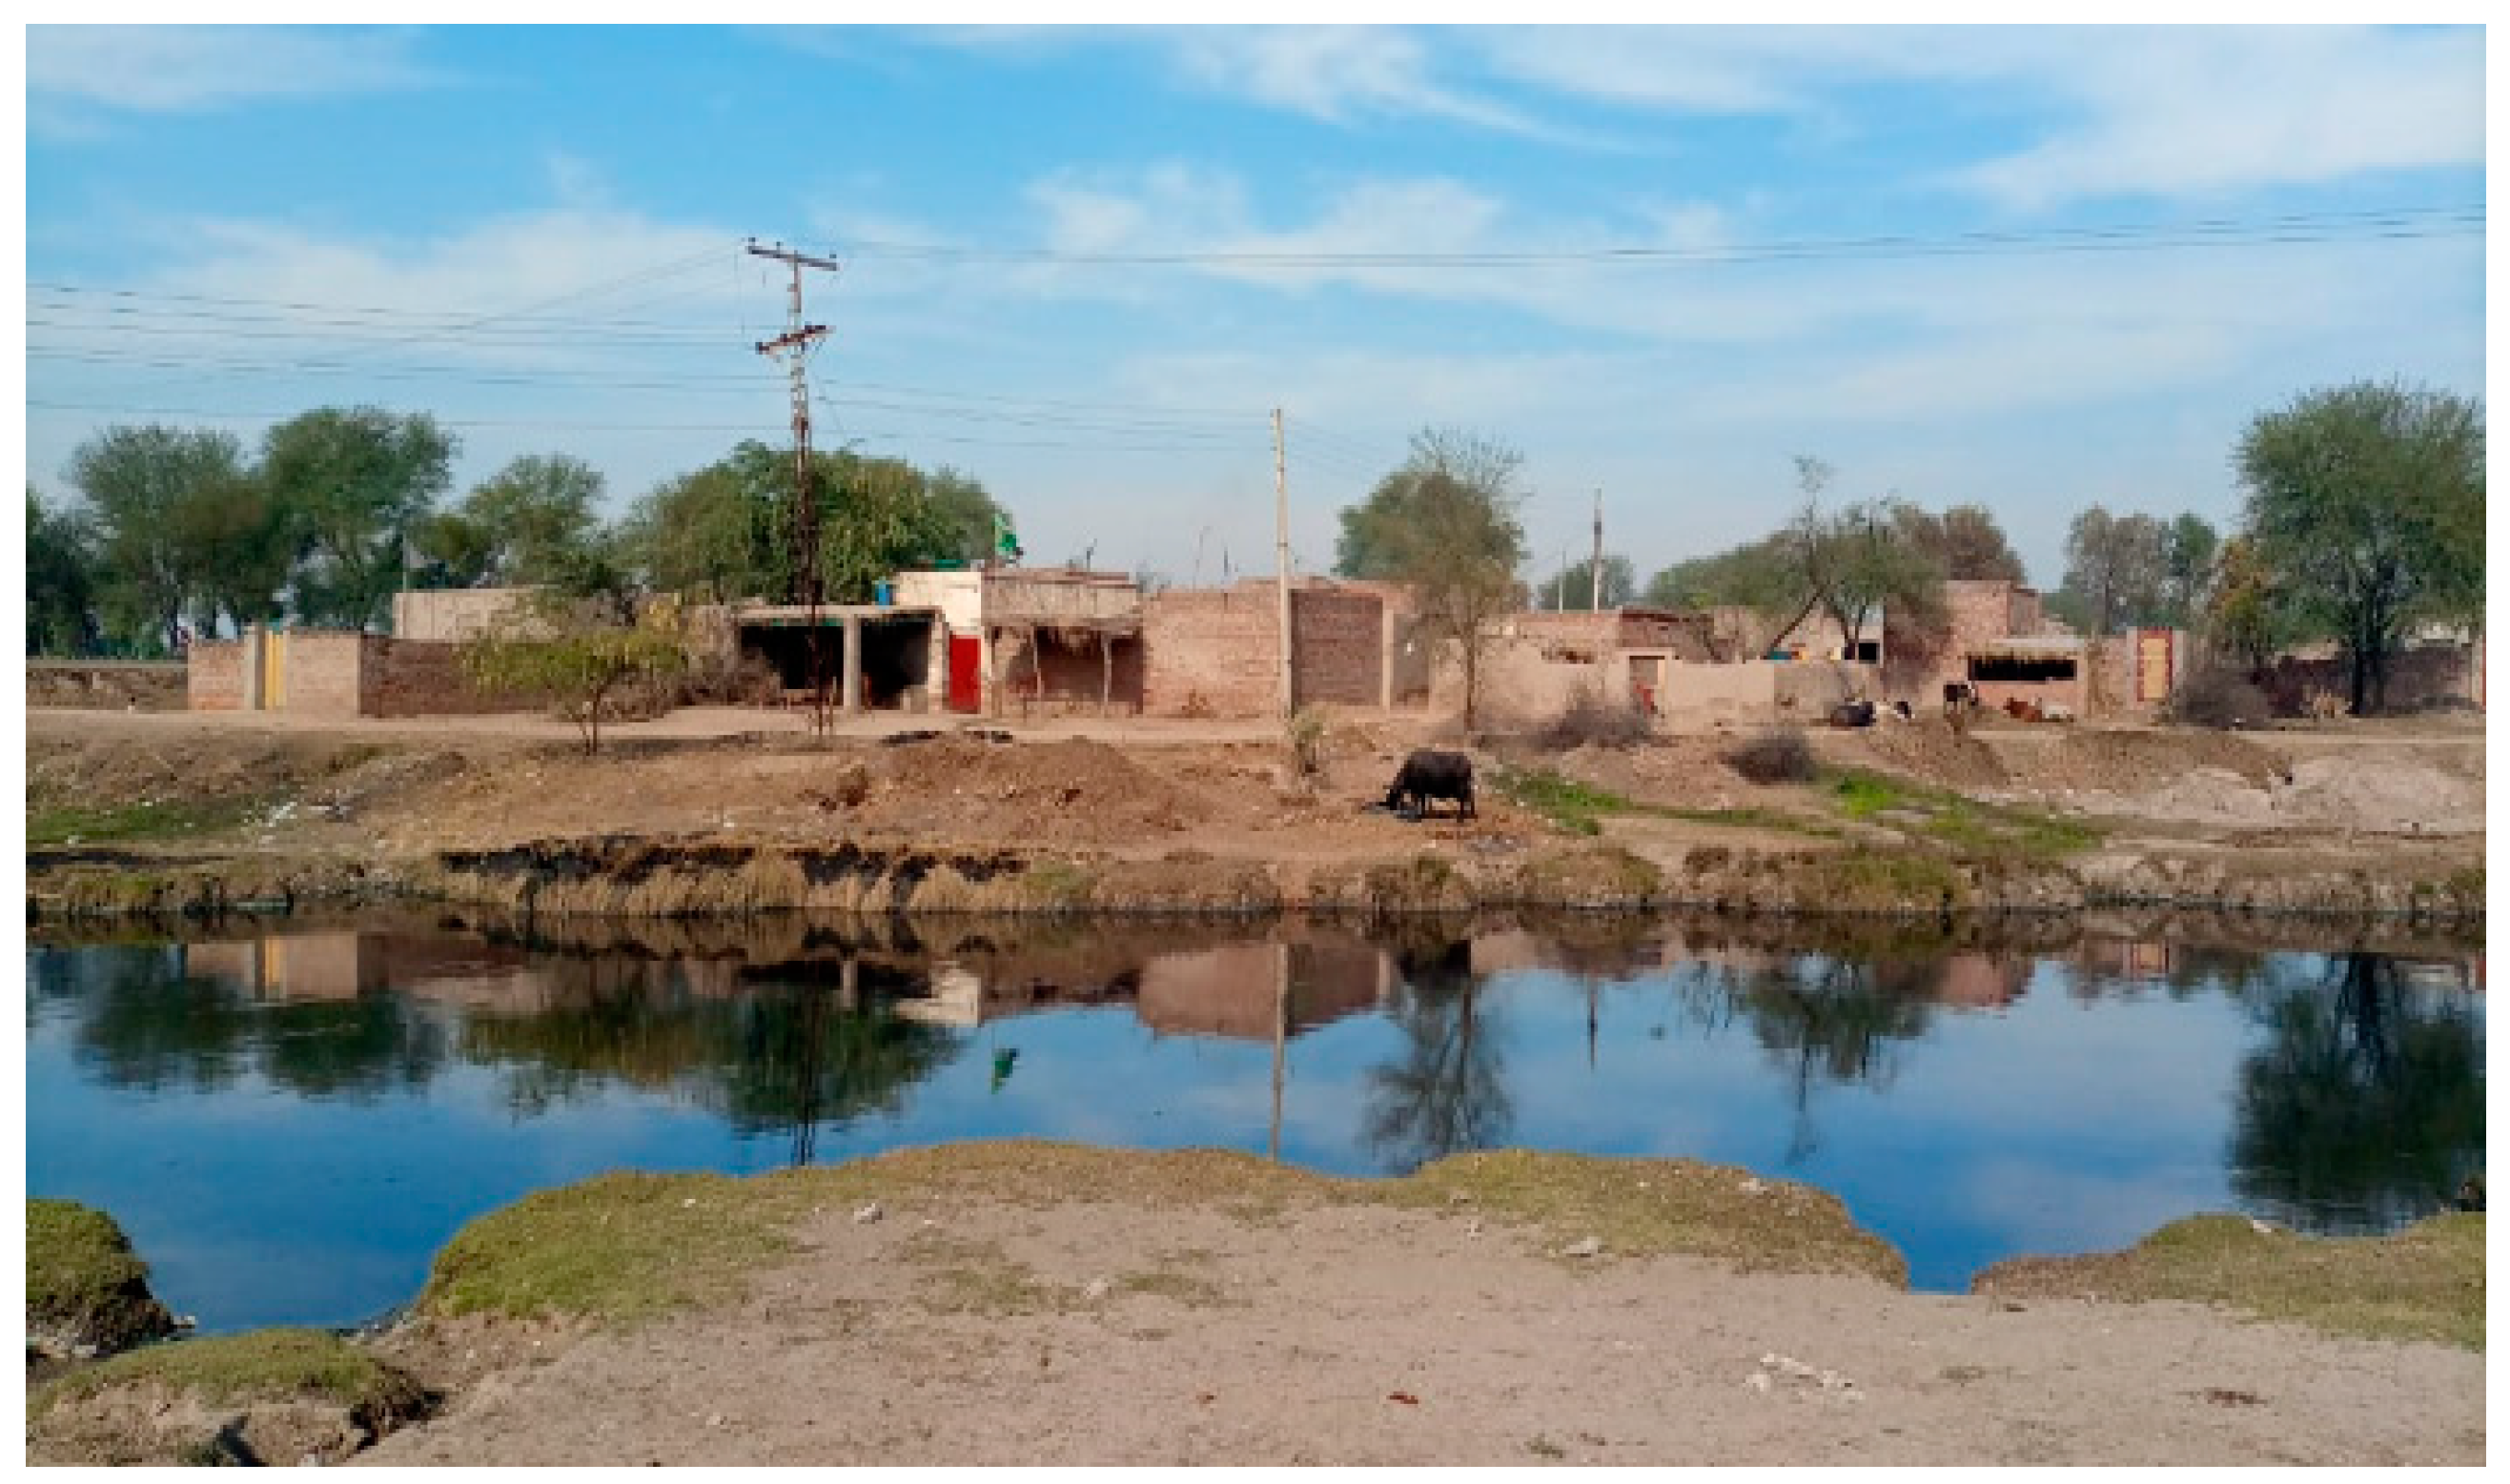
Nithar Ke is a village in Chiniot District, Punjab, Pakistan. It has a population of about 2000 people. People in this area are dependent on groundwater to meet their daily needs. The Paharang drain separates this village. There are residential buildings along the drain bank, as shown in
Figure 1. Local people suffer from various health problems from drinking groundwater, including liver and kidney failure. Groundwater in the area creates taste problems, becomes discolored after exposure to air, and leaves rust spots on clothing, sinks, etc., and discoloration of clothes and utensils is a visible effect.
To investigate the condition of the area regarding the improper handling of wastewater, the following are the objectives of this study:
To carry out the wastewater characterization of the Chiniot Faisalabad drain and groundwater parameter analysis in the study area;
To assess the spatial variability of different parameters in groundwater using GIS maps;
To check the appropriateness of groundwater for drinking purposes, using a water quality index (WQI) developed for the study area.
2. Materials and Methods
The research area is Nithar Ke, Chiniot District, located on the left and right sides of the Chiniot Faisalabad drain. For analysis, sixty groundwater samples were gathered randomly from the study area [
18]. Samples were collected from hand pumps and household pumps. An amount of 500 mL of sample was collected from each respective point [
19].
Figure 2 shows the position of our sampling points according to GPS coordinates that were gathered using a GPS meter [
20].
The only source of wastewater discharge in that area is a nearby sugar mill, around 12 km from the drain. Hence, one sample was taken from the discharging site. Two more composite wastewater samples were taken from the drain at two places [
21]. In groundwater and wastewater samples, pH, EC, TDS, TSS, carbonates, bicarbonates, turbidity, chloride contents, total alkalinity, total hardness, calcium, and magnesium were tested using the standard method [
22,
23]. Heavy metals, including arsenic, iron, manganese, sulfate, copper, chromium, and nickel, were analyzed in the samples using a HANNA HI83399 Multiparameter Photometer [
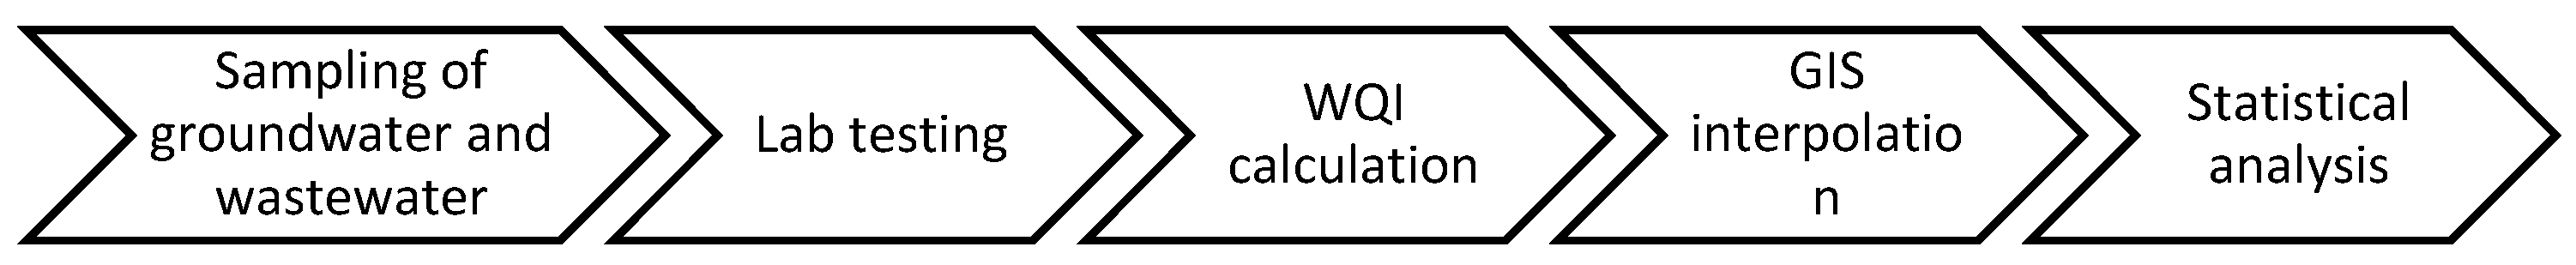
9]. A geographic information system (GIS) was utilized to identify the variation patterns in the concentration of several quality parameters of groundwater. The concentrations of all parameters were analyzed using a statistical technique [
24]. The results of the mentioned parameters were shown in the ArcGIS mapping. Using collection point coordinates, a geographical map was prepared [
25] and then interpolated using the kriging tool. The kriging tool of ArcGIS uses knowledge about the underlying spatial relationships in data collection to interpolate values for points. A summary of the process flow is shown in
Figure 3.
The principal component method shows the relationship between a table’s rows and columns in a two-dimensional graphic called a biplot (PCA biplot). It enables one to quickly view and analyze correlations between variables and create a set of artificial data sets called factors. XLSTAT 2021 software was used to perform the PCA biplot analysis. A PCA biplot shows a projection of the initial variables in the factor space. Correlation coefficients serve as measures of how strongly two variables are related linearly [
26].
CWQI
CWQI was developed by using three factors. These factors are F1 (scope), F2 (frequency), and F3 (amplitude). WHO standards were used to set objective limits. Scope determines the number of parameters whose objective limits are exceeded. Parameters whose value is exceeded are used in the formula to calculate factor 1.
In this expression, the variables were water quality parameters. This factor measures the number of times the tested samples exceeded the permissible limit or standard. This factor includes the number of tests with values exceeding the standard limit. The formula used to calculate this factor is
The number of times the objectives were not met was calculated in three steps. Excursion is a term calculated in this factor: the number of times the concentration is greater or less than the standard value. In cases when the test value did not exceed the objective values, excursion was calculated as
The collective amount was determined in terms of the normalized sum of excursions (nse). It was estimated as follows:
F3 was then calculated by using the expression
The CWQI was estimated using the above three factors, Equations (1), (2) and (5), as
The above expression returned numeric data from 0 to 100 [
26].
3. Results
Groundwater quality mapping is a key tool for obtaining information about a specific area’s actual groundwater quality situation. The GIS study indicates the study zone for determining where the quality is adequate for drinking. After analysis, the results were compared with the WHO and USEPA drinking water and NEQS wastewater standards [
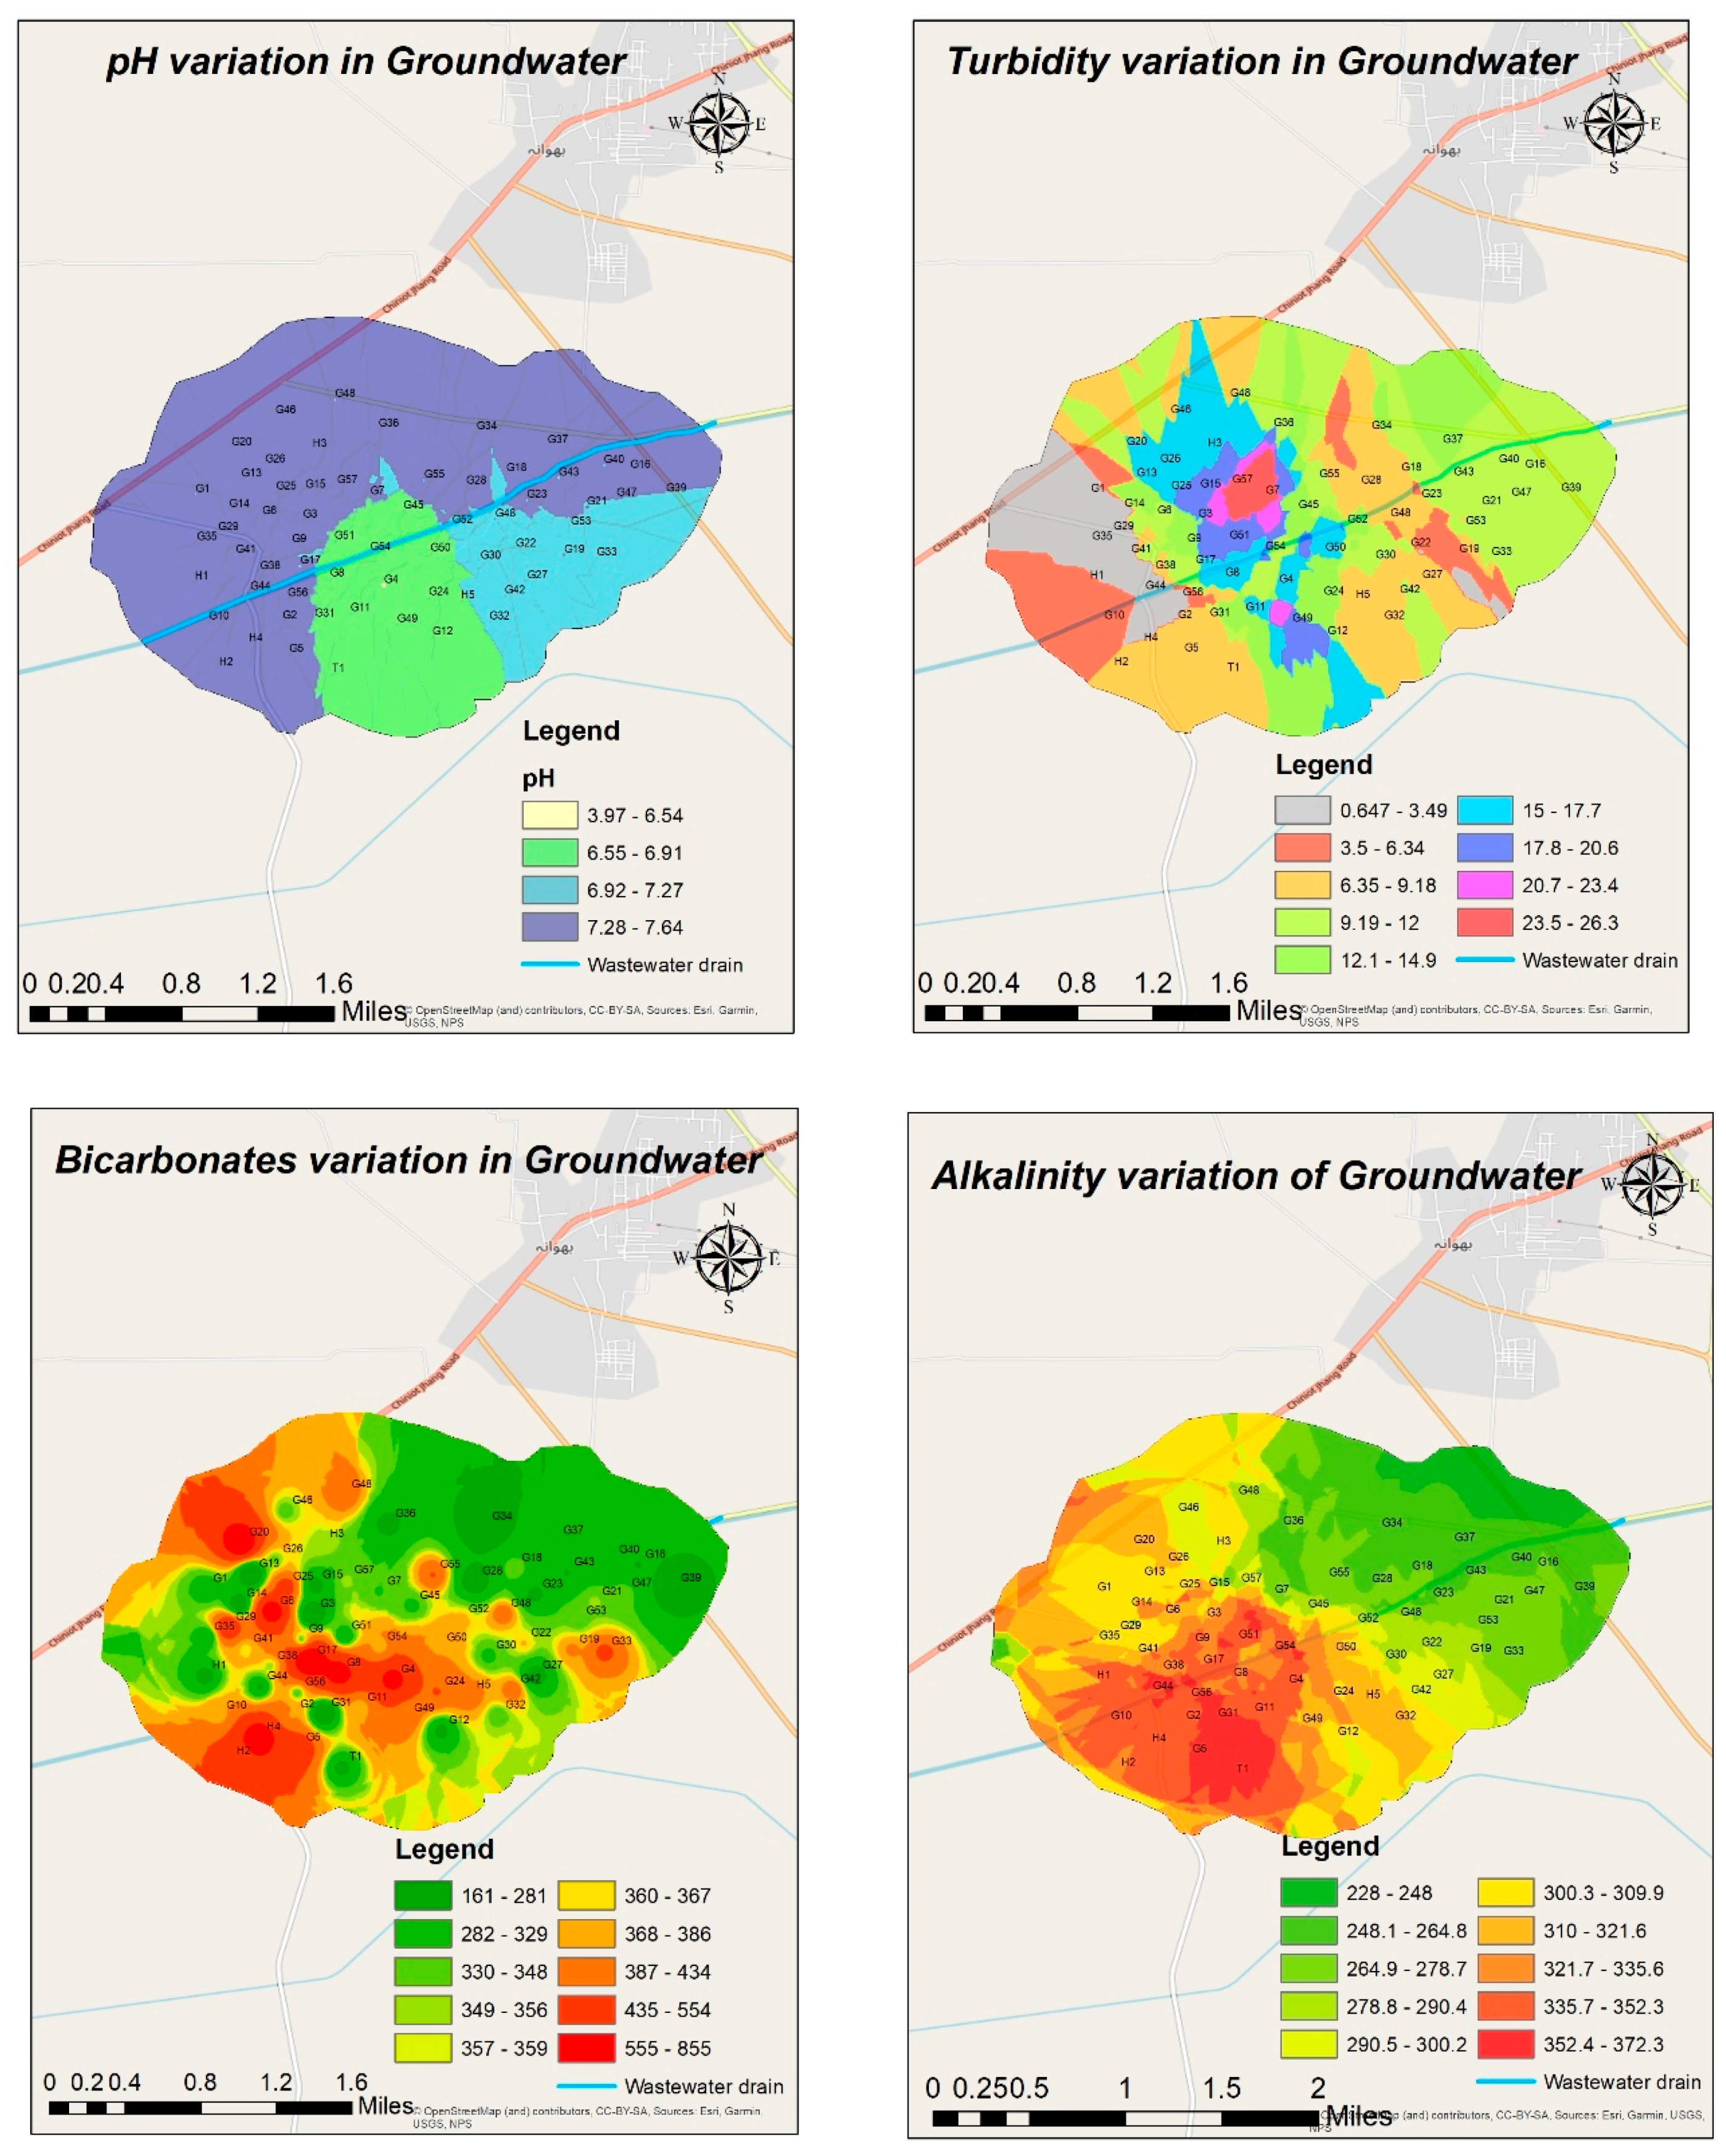
27]. According to WHO recommendations, a drink’s pH should be between 6.5 and 8.5. The results of the GIS analysis show that the pH level of the groundwater is moderate. The pH of the wastewater sample taken from the area is also at this level. The water is almost alkaline, according to the results. According to the GIS map, the groundwater pH is high, in the range of 7.28 to 7.64. The trend of the flow of wastewater particles is northwest of the canal, as shown on the map. EC analysis rates for wastewater range from 10,944 to 12,722 S, with an average value of 12,078.67 + 804.7 S, and EC values for groundwater range from 482 to 4816 S, with an average of 2068 + 54.38 S. The average EC for drinking water is 2000 µS, according to WHO regulations. The GIS analysis results show that the EC level in the groundwater samples is high. Most of the land around the canal has a high EC value in the groundwater. The EC value of groundwater is higher in the upward direction of the drain and decreases in the descending direction. This indicates that the trend is upward. TDS in wastewater range from 5472 mg/L to 6361 mg/L, with a typical value of 6039.3 + 402.4 mg/L, and TDS values in the groundwater range from 244 mg/L to 2408 mg/L, with an average dose of 1078.3 + 487.79 mg/L. According to WHO guidelines, the TDS standard for drinking water is less than 1000 mg/L. The TDS concentration is very high on the side of the water where most of Nithar’s habitat is located. This indicates that this trend is due to the percolation of drain water in the groundwater.
Turbidity in the groundwater ranges from 0 NTU to 91 NTU, with an average value of 12 + 21.33 NTU. The usual turbidity value for drinking water is less than 5 NTU, according to USEPA regulations, and less than 1 NTU, according to WHO regulations. The results of the GIS analysis show that the turbidity level in the groundwater samples is very high in most of the area. As shown on the map in
Figure 4, the drain turbidity trend is similar on both sides. In the upward direction of the drain, the water is more turbid, which then reduces in the downward direction of the drain. The analysis found no carbonate ions in the groundwater. The reason is that the pH is less than 8.3. The concentration of bicarbonate ions in the groundwater ranges from 160 mg/L to 856 mg/L, with an average concentration of 378.68 + 156.46 mg/L. The usual bicarbonate value for drinking water is less than or equal to 350 mg/L, according to WHO regulations. Most of the area on the upward right side of the drain has an acceptable bicarbonate concentration in the groundwater. The concentration of bicarbonates is high in a few select areas near the drain, and this non-symmetric trend of change is attributed to natural geography. Alkalinity in the groundwater ranges from 131.14 mg/L to 701.6 mg/L, with an average mean value of 310.4 + 128.24 mg/L of CaCO
3. The usual alkalinity value for drinking water is less than or equal to 500 mg/L of CaCO
3, according to WHO regulations. GIS analysis revealed that the alkalinity of the groundwater samples is acceptable.
Chloride ions in the groundwater range from 34.31 mg/L to 977.89 mg/L, with an average mean value of 274.21 + 281.14 mg/L. The usual chloride value for drinking water is less than or equal to 250 mg/L, according to WHO regulations. The majority of the area has an acceptable concentration of chlorides. Total hardness in the groundwater ranges from 90 to 780 mg/L of CaCO
3, having an average mean value of 435 + 126.7 mg/L. The majority of samples have a hardness of less than of 500 mg/L of CaCO
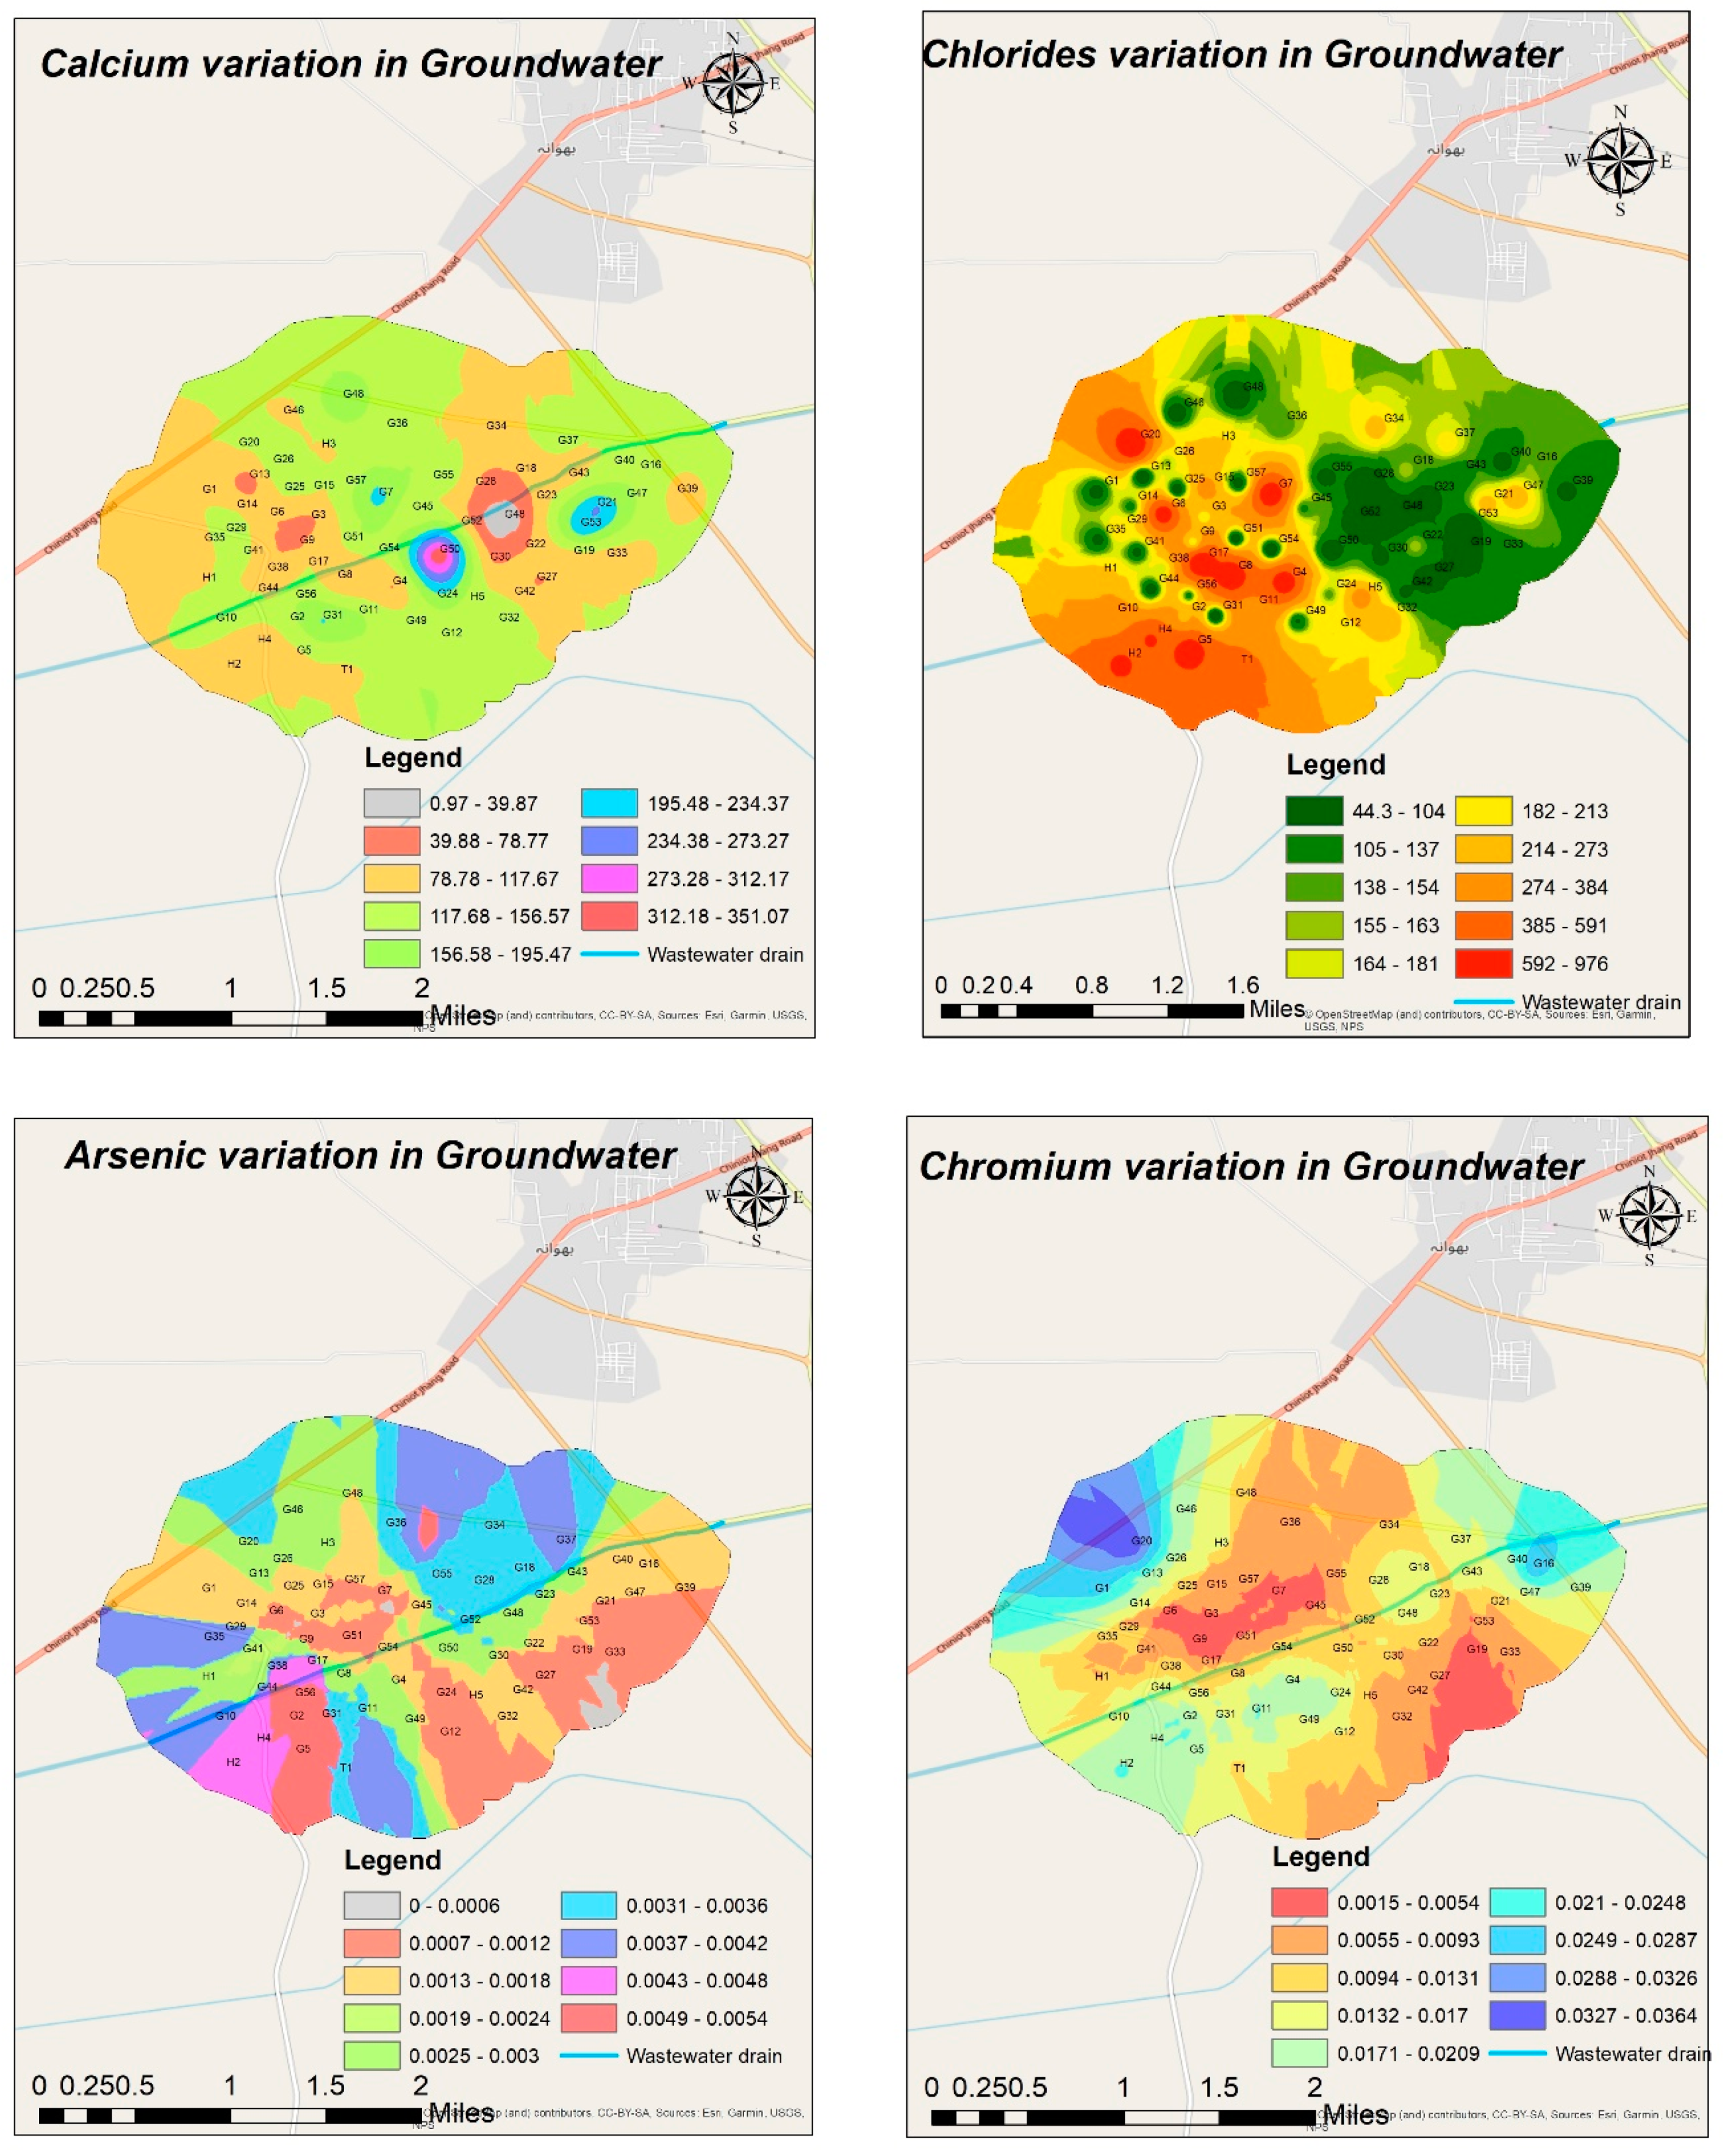
3. Therefore, most of the groundwater in the area is soft or moderate water. Calcium in the groundwater ranges from 60 to 356 mg/L, having an average mean value of 122.67 + 48.8 mg/L. The usual calcium value for drinking water is less than or equal to 100 mg Ca/L, according to WHO regulations. The results of the GIS analysis reveal that the calcium ions in the groundwater samples are high. As shown in
Figure 5, most of the land has a greater concentration of calcium in the groundwater. On both sides of the drain, the concentration is greater than the acceptable range.
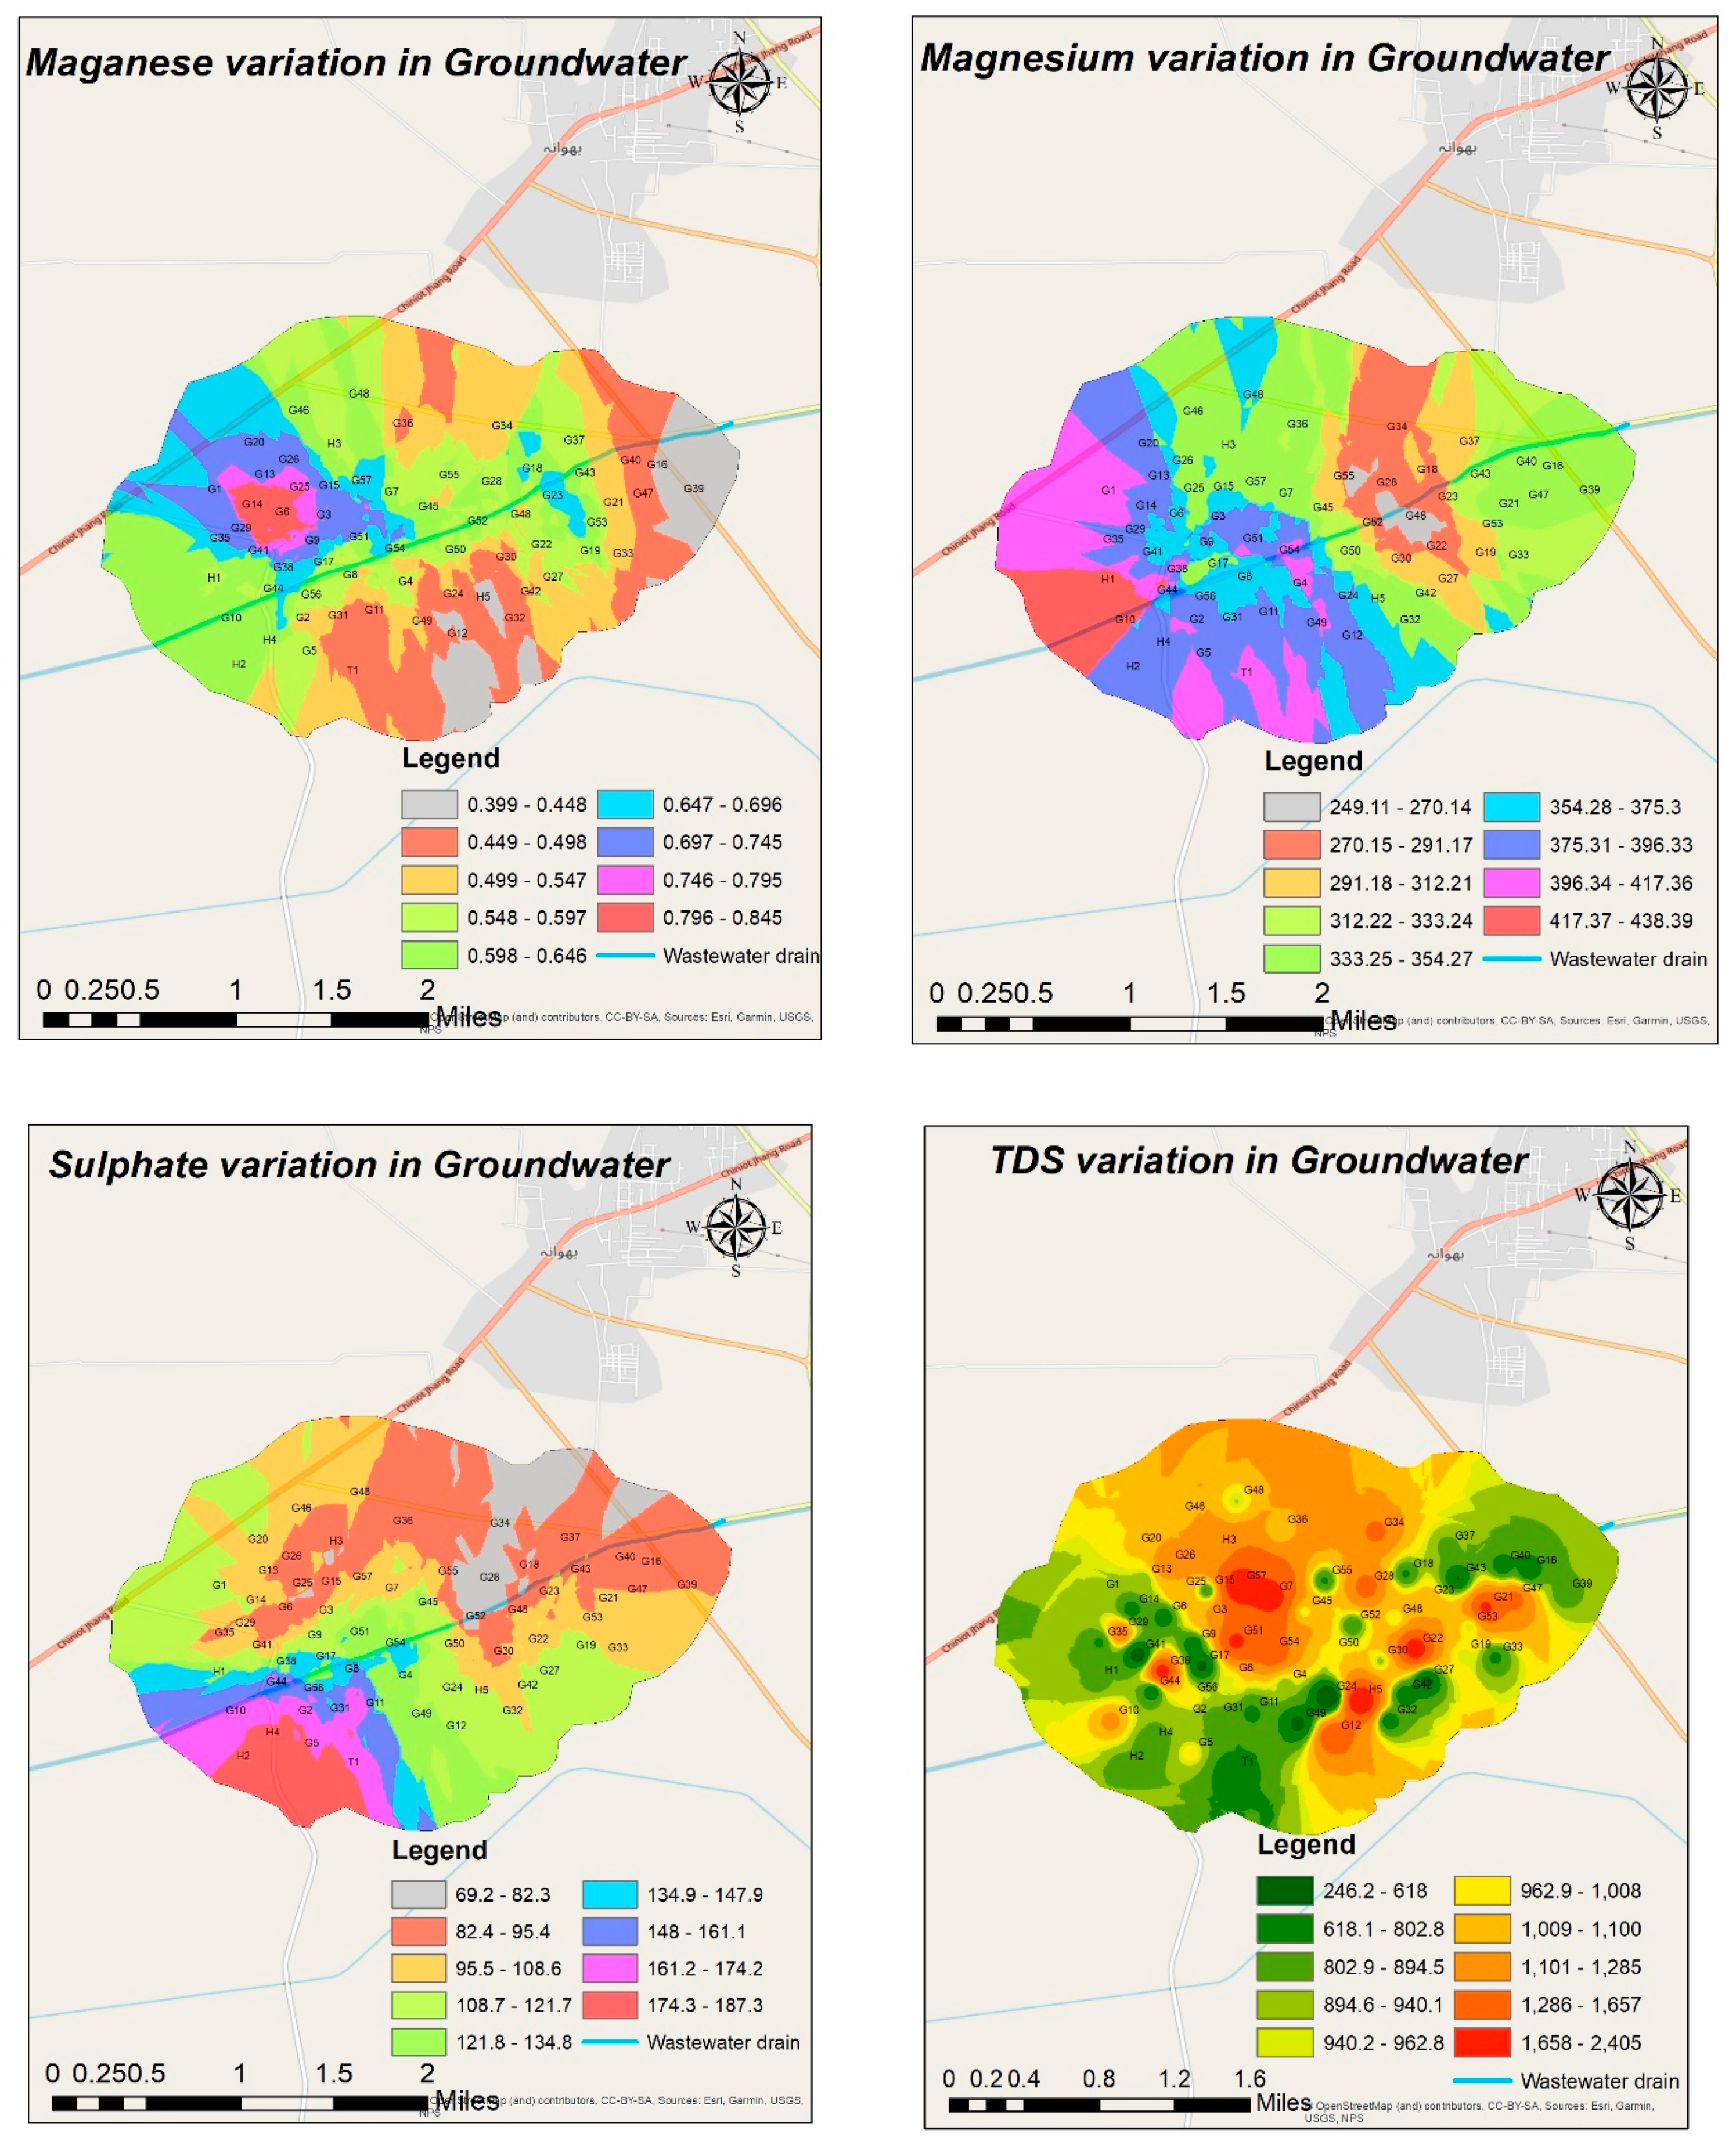
Magnesium in the groundwater ranges from 28.5 to 690 mg/L, having an average mean value of 360.48 + 123 mg/L. The usual magnesium value for drinking water is less than or equal to 50 mg Mg/L, according to WHO regulations. The results of the GIS analysis reveal that the magnesium ions in the groundwater samples are high. In the upward direction of the drain, the concentration is low as compared to the concentration in the downstream area of the drain. In the wastewater, no copper ions were detected, while in the groundwater, they were, and the values of copper in the groundwater range from 0 mg/L to 0.2 mg/L, with an average mean value of 0.00095 + 0.03 mg/L. The results of the GIS analysis show that the Cu level in the groundwater samples is low. The map in
Figure 6 shows that most of the land on both sides of the drain has a lower copper concentration because no copper is detected in the drain water, while when moving far from the drain, copper is detected. There may be another cause of copper in the groundwater besides the wastewater drain. The chromium IV concentration in the wastewater ranges from 0 to 0.004 mg/L, having an average mean value of 0.002667 + 0.0018 mg/L. In contrast, the values of chromium IV in the groundwater range from 0 mg/L to 0.106 mg/L, with an average mean value of 0.012 + 0.02 mg/L. The usual Cr concentration for drinking water is less than 0.05 mg/L, according to WHO regulations. Most of the land on both sides of the drain has a lower concentration of chromium, but upstream of the drain, chromium is high. In the nearest areas of the drain, a lower concentration of chromium is observed. Nickel analysis was performed for wastewater and groundwater samples. In both the wastewater and groundwater samples, no nickel was detected.
The iron concentration in the wastewater ranges from 1.72 to 4.36 mg/L, having an average mean value of 2.62 + 1.23 mg/L. In contrast, values of chromium IV in the groundwater range from 0 mg/L to 5 mg/L, having an average concentration of 0.728 + 1.106 mg/L. The typical iron value for drinking water is less than 0.3 mg/L, according to WHO regulations [
28]. As shown in
Figure 6, most of the land on both sides of the drain has a high concentration of iron. The manganese concentration in the groundwater ranges from 0 mg/L to 1.3 mg/L, having an average mean value of 0.59 + 0.306 mg/L. The results of the GIS analysis show that the iron and manganese levels in the groundwater samples are high. Upstream of the drain, manganese has a lower concentration, while its concentration increases when it flows downward. The sulfate concentration in the groundwater ranges from 15 mg/L to 360 mg/L, having an average concentration of 115.3 + 82.4 mg/L. Arsenic in the wastewater ranges from 0 to 0.01 mg/L with an average value of 0.0033 + 0.0047 mg/L, whereas the groundwater results show that the arsenic concentration ranges from 0 mg/L to 0.025 mg/L, having an average concentration of 0.0024 + 0.0049 mg/L. GIS analysis showed that the arsenic level in major areas is lower.
The BOD of the wastewater ranges from 168.96 mg/L to 222.72 mg/L, having an average concentration of 192 + 22.6 mg/L. USEPA regulations recommend that the BOD concentration be less than 80 mg/L. In this drain, wastewater is more polluted. The COD of the wastewater ranges from 264 mg/L to 348 mg/L, having an average concentration of 300 + 35.32 mg/L. According to USEPA regulations, the COD concentration should be less than 150 mg/L. In this drain, wastewater is more polluted—two to three times more polluted.
A study conducted in an industrial area drain of Faisalabad concluded that the surrounding area groundwater had high pH, EC, Fe, Mn, Cu, and Cr concentrations. In our study area, the industrial drain of Faisalabad has a high concentration of EC, TDS, Fe, and Mn. In addition, the water quality index in that study showed poor-quality water, while for the Nithar Ke area, the CWQI shows poor- to good-quality water. This shows that iron and manganese concentrations in groundwater relate to drain seepage [
29].
Iron and manganese are naturally found in soils, rocks, and minerals. They usually occur naturally in deep wells when the groundwater table has little or no air, and the ground is rich in organic matter. Iron and manganese are usually found together, but manganese is most commonly found in lower-lying areas than iron. As water soaks into soils and rocks, it can dissolve minerals containing iron and manganese and store them in a solution. Rust and corrosion of old steel pipes can also be a source of iron in the water. Iron and manganese in groundwater can also be produced or enhanced by artificial sources such as industrial, mining, sewage, and landfill leachates [
30,
31].
3.1. WQI
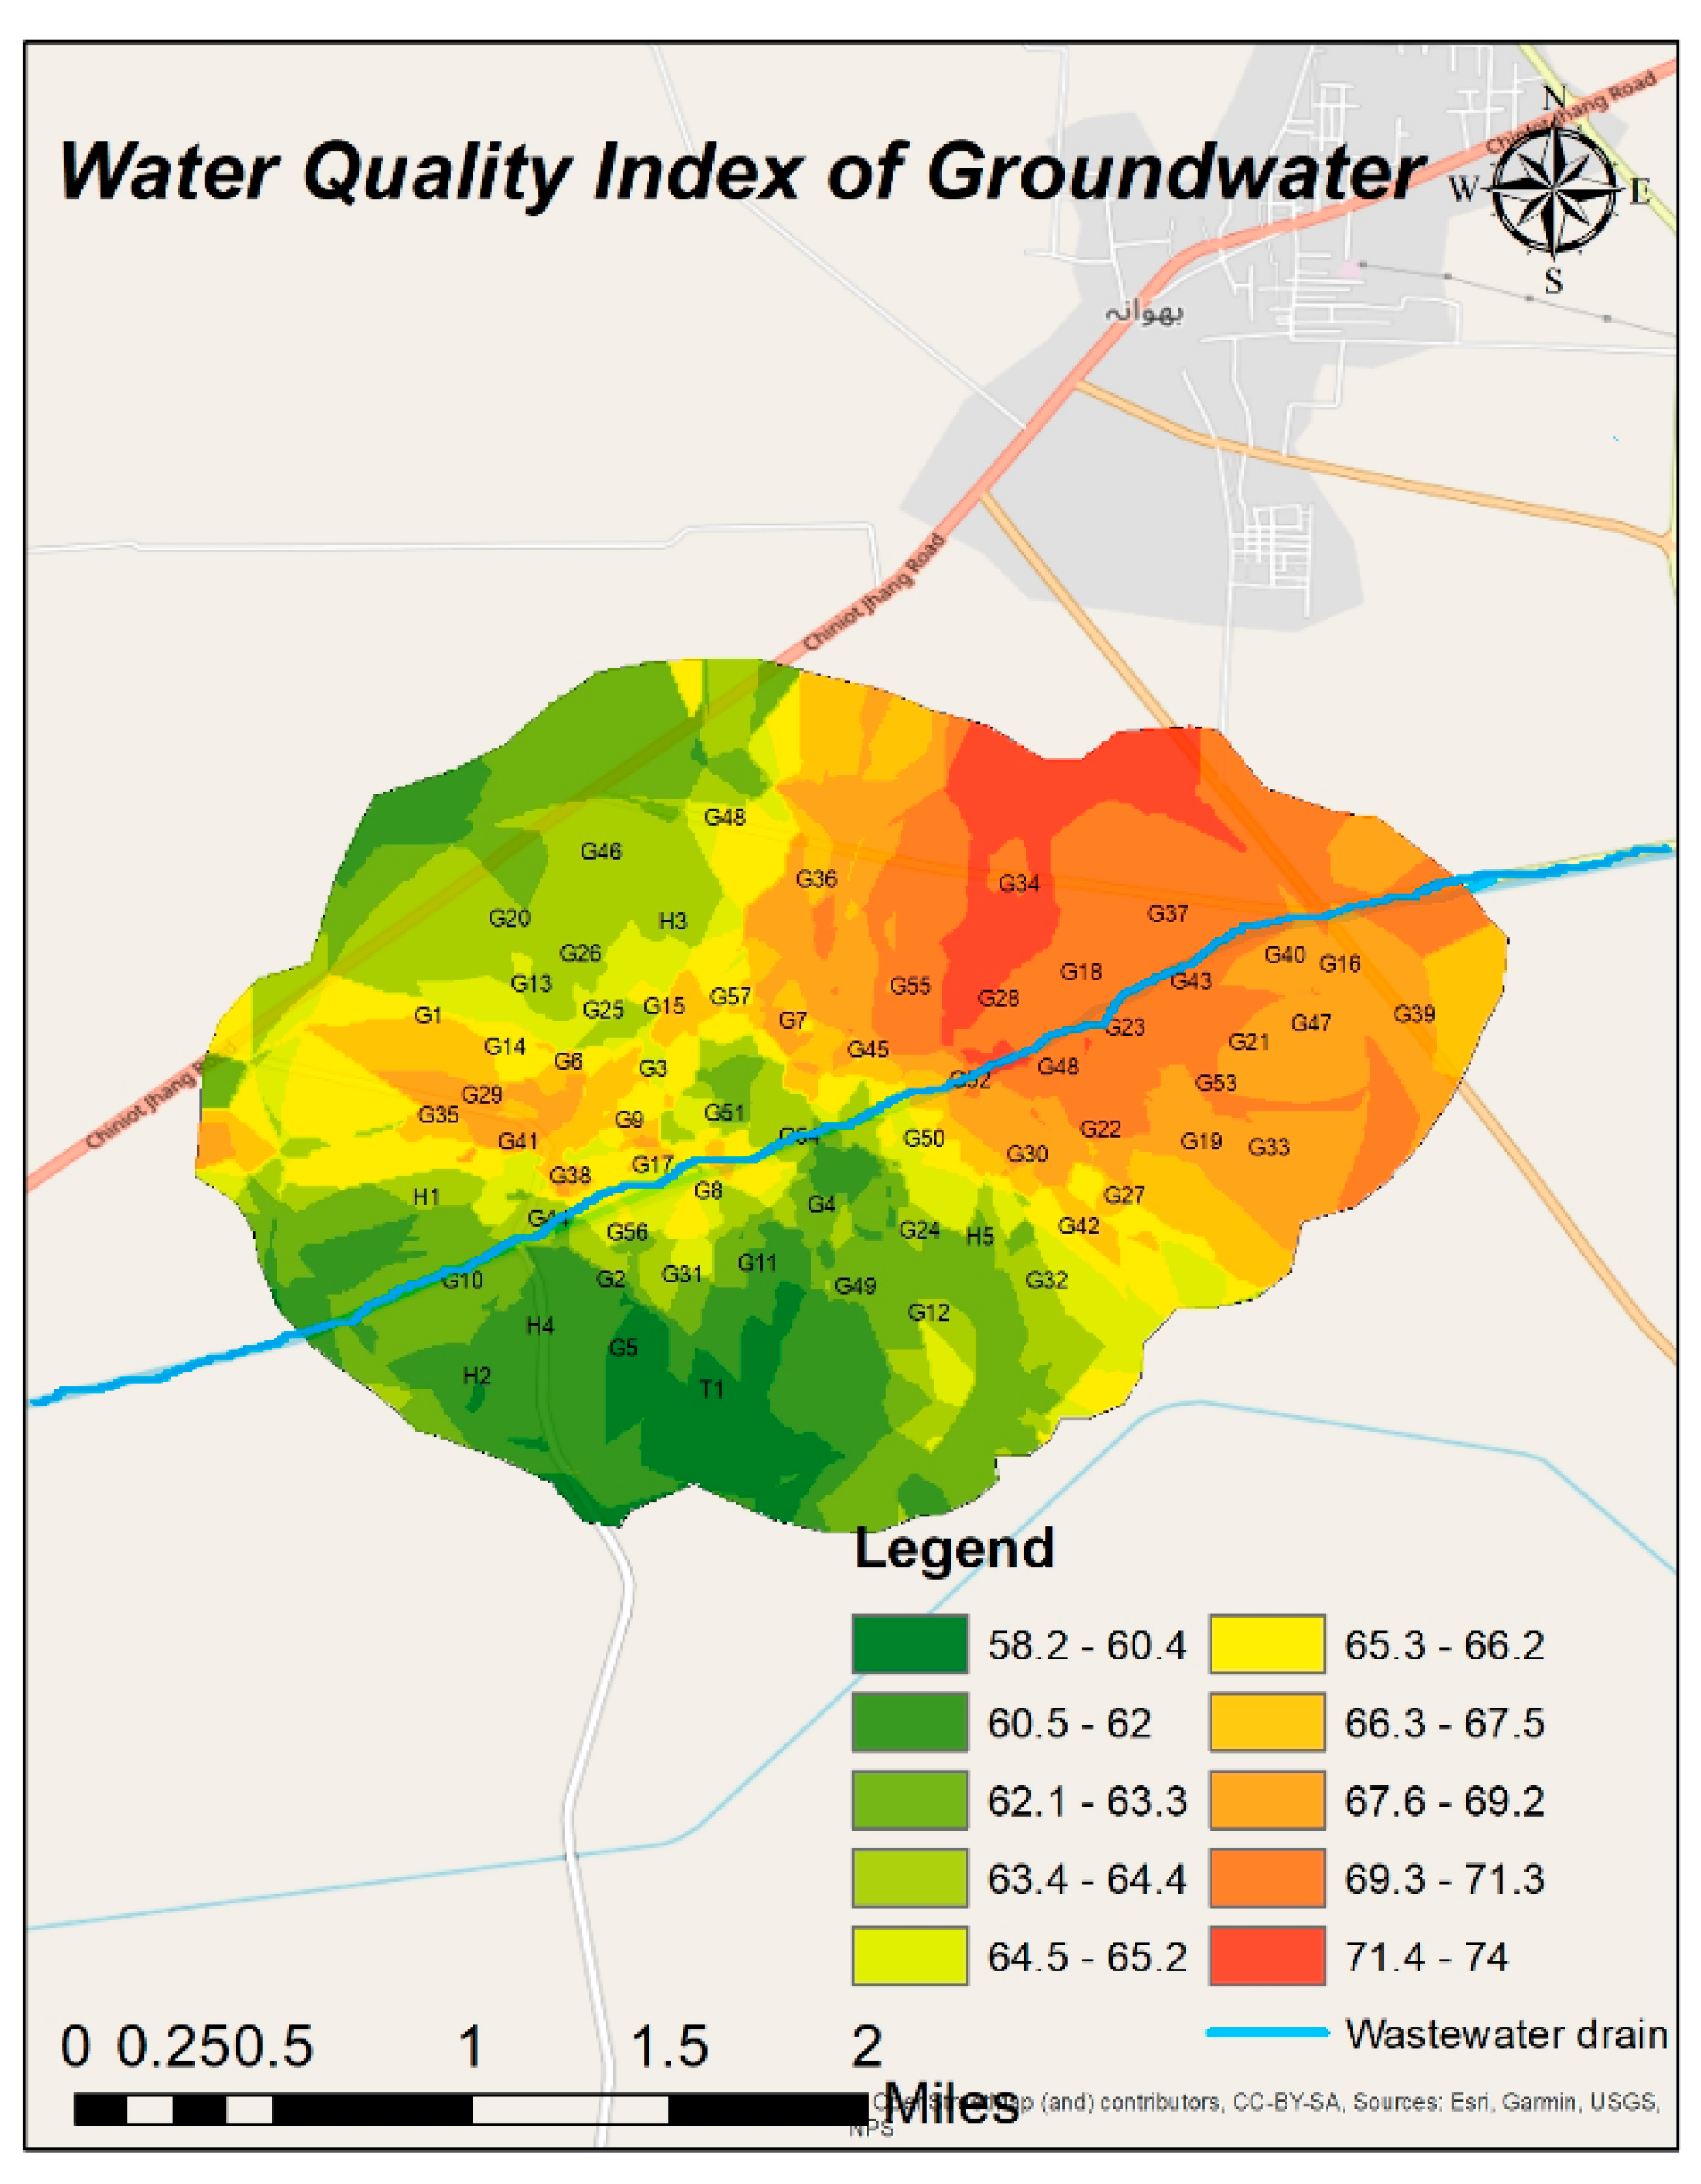
The WQI (water quality index) was developed for the study area’s groundwater to identify the groundwater’s appropriateness for drinking. The WQI for the groundwater ranges from 40.9 to 89.5, with a mean value of 64.8 ± 12.56. The map shows that very few areas have an acceptable quality of water, while the major area has marginal- to poor-quality water.
3.2. Statistical Analysis
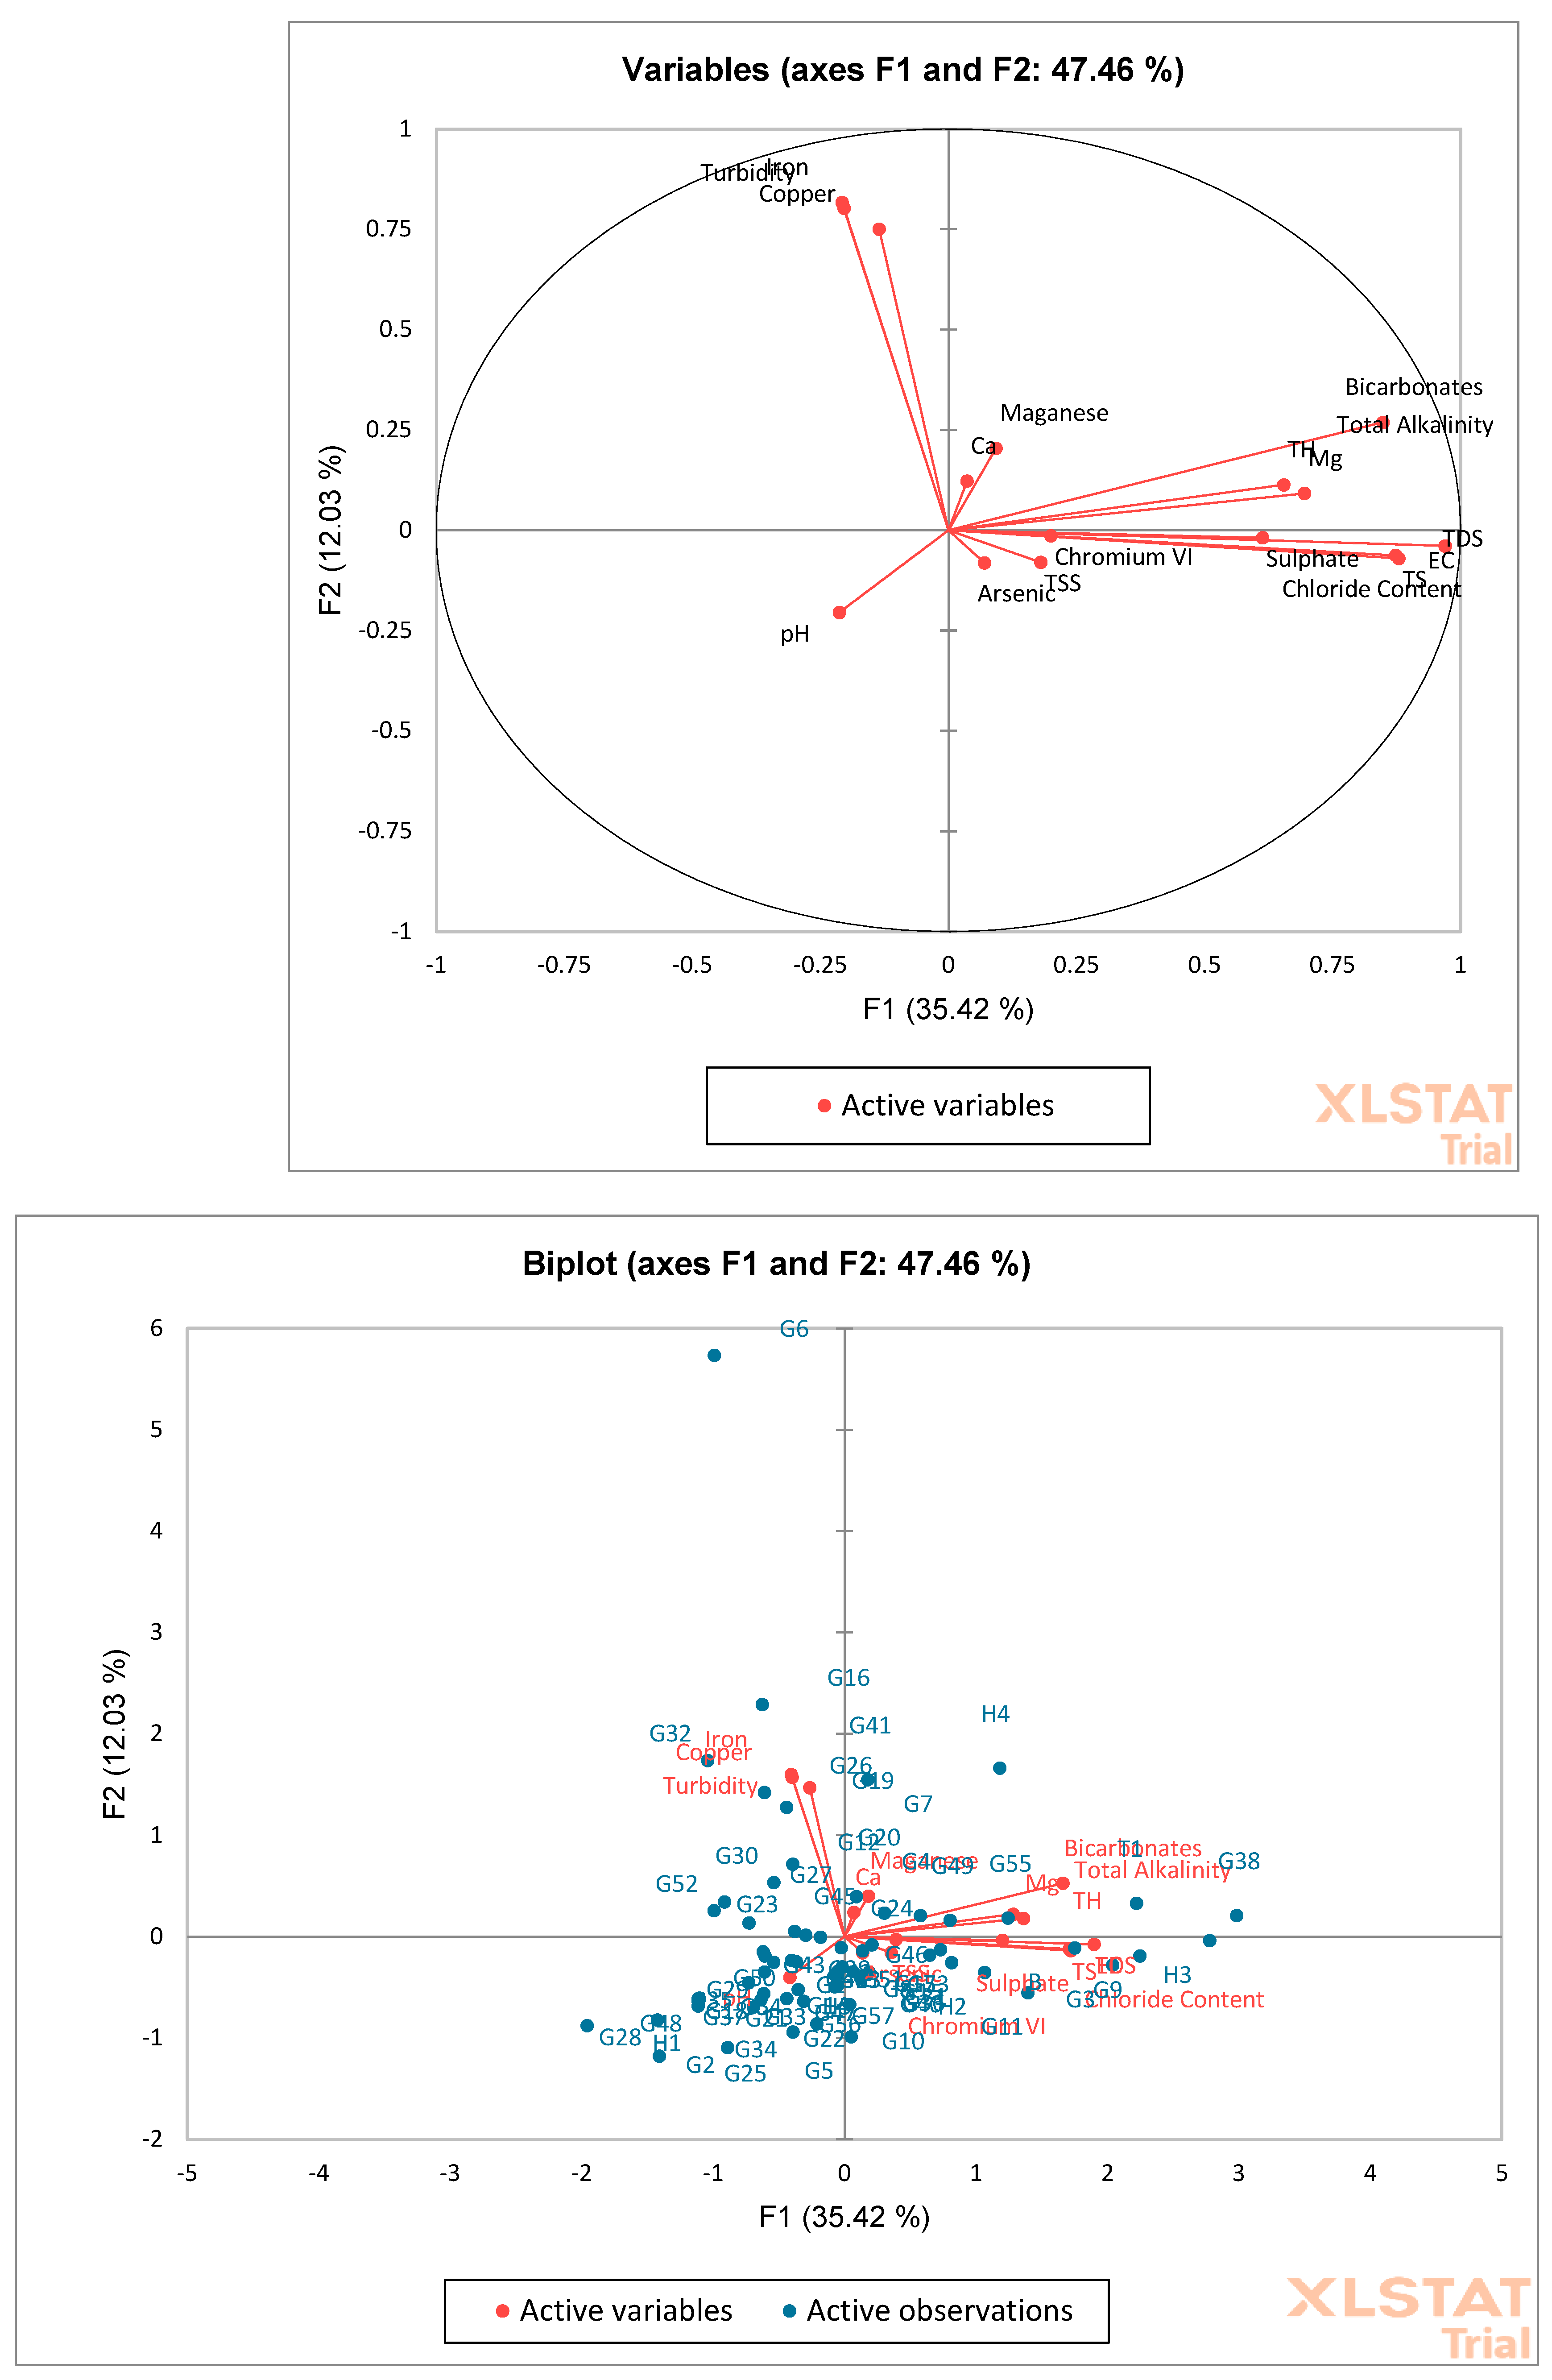
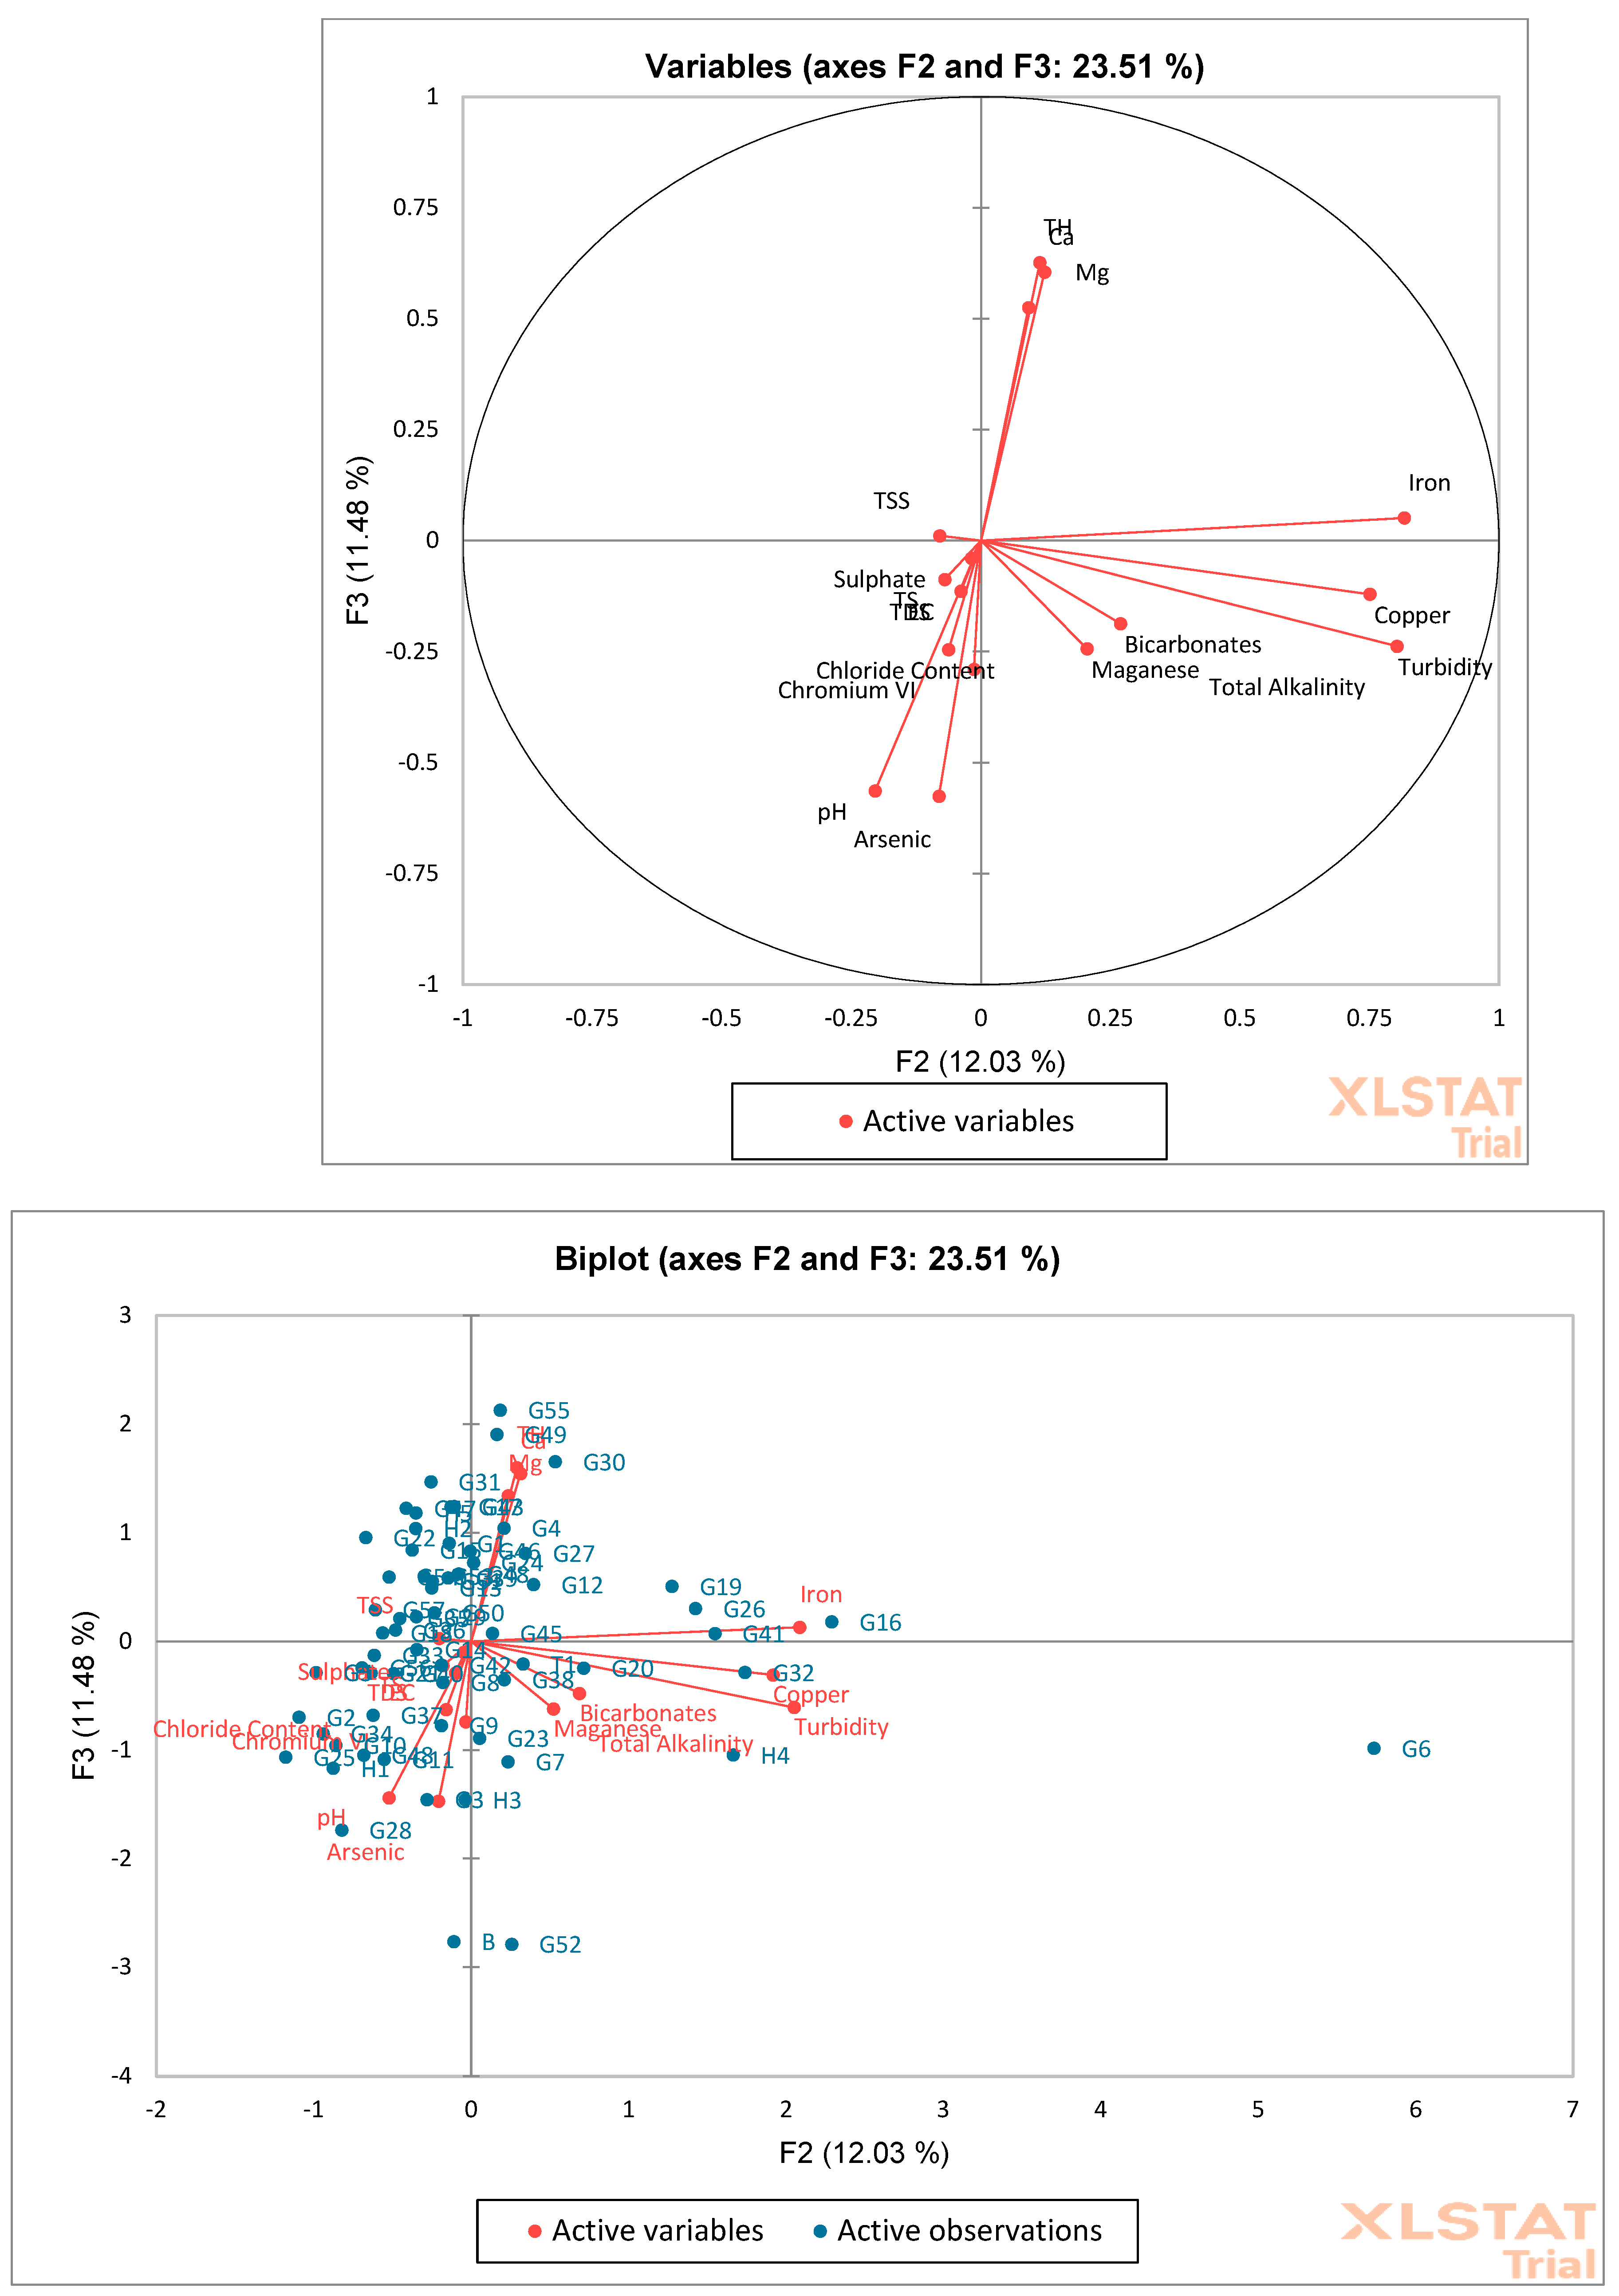
The correlation between groundwater-tested parameters and factors is shown in
Table 1. A positive value indicates that the parameters and characteristics are positively correlated, which shows that both variables travel in the same direction, and negative values mean they move in an opposite direction. The table shows that factors 1 and 2 positively correlate with the parameters, while factors 3 and 4 negatively correlate with them.
The correlation table and biplots for factors are shown in
Figure 7,
Figure 8 and
Figure 9. Factors 1 and 2 have a greater percentage of variabilities, while factors 3 and 4 have lower percentages. The results of factors 1 and 2 are interpreted as being due to the greater rate and accuracy. All parameters except turbidity, iron, copper, and pH are positively correlated due to the lesser angle. Turbidity and iron are close to each other, which shows that when the iron concentration is greater, the turbidity of the water is higher. The biplot shows that most of our water samples are negatively correlated.
4. Conclusions and Recommendation
Overall, the groundwater of the study area is marginal for drinking purposes. Heavy metals originate in lower concentrations in most groundwater samples up to a large coverage range of 1.7 km from the wastewater drain. Similarly, wastewater contains heavy metals with a lower concentration, posing a direct threat to groundwater due to the unlined surface. Contamination eventually disturbs human health as this groundwater is used for drinking. Esthetic parameters are very important because, being human, we cannot accept water that is esthetically unfit. The pH level was within the limit, but EC, TDS, TSS, turbidity, Mg, bicarbonates, chlorides, sulfates, iron, and manganese were not within the limit. Few samples showed a normal range of these parameters. The pH, BOD, COD, and iron concentration levels in the wastewater samples were considerably high. Heavy-metal analysis (Cr, Cu, Ni, Ar, Mn, Fe) showed that the pollution level in the drain is acceptable for all metals except iron. The contaminants infiltrate downward, and the heavy metal concentration gradually increases in the groundwater. Groundwater samples showed that the water quality for drinking purposes is marginal. Due to the high level of iron and manganese, the color and taste of the water deteriorated. The presence of these ions also causes a change in the color of cloths and utensils and leaves rust-colored stains on clothing, sinks, tubs, etc. The following suggestions are offered:
Using appropriate housekeeping and management practices at the community level can reduce the volume of municipal and industrial effluents emitted.
No municipal or industrial effluent should be discharged into the water bodies without lowering the pollution load to an acceptable limit.
A substantial portion of the chosen region is devoted to agriculture, which relies on groundwater for irrigation. The water table is dropping due to massive groundwater extraction for agriculture, which is a concerning issue. It is necessary to transition to surface water irrigation or water-saving irrigation systems.
Further study on soil stratification and soil characteristics is recommended in this area for a detailed analysis of metal contamination.


 ,
, 


