Article

Interference of Past Soil Contaminations in the Biomonitoring of PCB Emissions from a Recovered Derived Fuels (RDFs) Co-Powered Cement Plant

1
Department of Engineering and Architecture, University of Trieste, Via A. Valerio 6/1, I-34127 Trieste, Italy
2
Department of Life Sciences, University of Trieste, Via L. Giorgieri 10, I-34127 Trieste, Italy
*
Author to whom correspondence should be addressed.
Pollutants 2023, 3(1), 12-26; https://doi.org/10.3390/pollutants3010002
Submission received: 24 November 2022 / Revised: 7 December 2022 / Accepted: 14 December 2022 / Published: 29 December 2022
(This article belongs to the Special Issue Surveys and Case Studies in Biomonitoring of Atmospheric Pollution)

Abstract

:
Although the intentional production of polychlorinated biphenyls (PCBs) has totally been banned, these pollutants are still released into the atmosphere by industrial and domestic burning processes and by volatilization from soils locally contaminated by PCB spill-overs. The present work aims at identifying the PCB sources in a mixed land use area of northeastern Italy around a cement plant co-powered with recovered derived fuels (RDFs) from 2018. Leaves of Robinia pseudoacacia trees were systematically sampled over c. 40 km2 in 37 sites and analyzed for 12 dioxin-like and 20 non-dioxin-like congeners. The samples of most sampling sites had a PCB content < LOD, whereas those with higher content were located in urban sites. The spatial distribution of PCB leaf content was not centered on the purported emission sources. The samples of three spatially unrelated sites had high contents of 2, 12 and 18 PCB congeners, with the last two having combinations fully compatible with past commercial mixtures traded under different names. Comparison of these results with those of previous (bio-)monitoring surveys supports the hypothesis that the area has been subjected to punctiform PCB spill-overs, which overwhelm the contribution from present day industrial emissions, comprised of those actually derived from the use of RDFs.

1. Introduction

Recovered derived fuels (RDFs) largely consist of non-recyclable plastics (PVC excluded), paper cardboard, and other corrugated materials. Shredded into a uniform grain size, or also pelletized in order to produce a homogeneous material, RDF can be burned for thermal recovery as a valid alternative to traditional fossil fuels, reducing the landfill storage of non-recyclable plastics [1]. With respect to hydrocarbon fuels, RDFs have higher calorific value and release less greenhouse gasses [2]. RDFs are thus increasingly used in cement kilns, thermo-to-energy plants, blast furnaces, and foundries [3]. However, under sub-optimal conditions (e.g., in oxygen-depleted and low temperature conditions), RDF combustion can lead to the formation of multi-chlorinated benzenes, whose radical dimerization leads to an unintentional, de novo synthesis of polychlorinated biphenyls (PCBs) and other persistent organic pollutants (POPs), such as polychlorinated dibenzo dioxins/furans [4]. For this reason, specific directives (e.g., the European directive 2000/76/EC [5]) have been issued at national and/or international levels to regulate the combustion process of RDFs containing halogenated compounds. Furthermore, industrial plants authorized to use RDFs are subjected to severe emission controls, typically more rigid that those applied before the transformation of the combustion chambers for RDFs use (see European directive 2010/75/EC [6]).
The potential dispersion of PCBs, other POPs, and heavy metals in the environment remains one of the main public concerns, limiting the use of RDFs in several countries. This argument is often raised by Not-In-My-BackYard (NIMBY) opponents afraid of the possible health consequences at the local level. PCBs may actually cause serious damage to human health and ecosystems [7]. In particular, the non-ortho and mono-ortho substituted dioxin-like PCBs (DL-PCBs) cause toxic effects in humans and animals, interacting with the intercellular aryl hydrocarbon receptor [8]. Furthermore, PCBs accumulate in the food webs through biomagnification [9], as they are highly resistant to biodegradation [10].
In the past, PCBs were widely and commonly used due to their chemical stability [11], reaching a total production of c. 1–1.5 million tonnes in c. 70 years [12]) before being banned [13]. Unfortunately, 14 million tonnes of PCBs-contaminated oil and equipment still exist worldwide [14], and only a small fraction is properly disposed of and eventually processed for thermal destruction [15].
Soil PCB spill-overs—old or recent, criminal or accidental, totally unknown or (un)voluntarily neglected—may be important sources of contamination, with the volatilization from locally contaminated soils being recognized as a primary source of PCBs in the atmosphere and water bodies [16]. These spill-over sources can overlap—and obscure—those related to the activity of waste incineration, cement production, and foundry processes, i.e., the recognized, post-ban, industrial sources of PCB release in the atmosphere [17].
The correct assessment of the overall PCB load in a territory and the identification of past vs. current PCB emission sources are of paramount importance for making the use of RDFs at the industrial level a common practice, if not also acceptable for NIMBY opponents. This goal can be achieved by applying biomonitoring techniques based on a rigorous spatially-based sampling design and on the direct comparison between the PCB composition of environmental samples and its current source(s). Among the environmental matrix(es), plant materials are undoubtedly the most convenient because their commonness allows high sampling density without raising ethical concern [18]. Leaf sampling has frequently been applied for fast, efficient biomonitoring of PCBs at small and large scales [19]. In fact, the PCB leaf content is a good proxy of the time-integrated PCBs deposition that occurred between foliation and leaf sampling [20], although in some herbaceous plants (e.g., maize, cabbages, and carrots [21]; squash [22]; sunflower [23]) there may be a significant uptake and transportation of PCBs, dependent on the specific properties of the compound. In woody plants, however, PCBs remain blocked in the wood and are not translocated to the leaves of, e.g., hybrid poplars [24] and willows [25]. For this reason, they can profitably be used for PCB biomonitoring because the PCB concentration in their leaves is strictly related to that of the surrounding atmosphere [26].
Robinia pseudoacacia L. (black locust) is a tree very common in agricultural and urban-industrial areas of all temperate Europe, and is recognized as an efficient biomonitor of airborne persistent pollutants. The leaves of R. pseudoacacia are rather thin (130–190 µm in average), lack hard sclerenchymatous tissues [27], and thus the plant exposes a larger intercepting leaf surface per leaf mass unit with respect to other deciduous trees [28]. Furthermore, the leaves have a thick layer of epicuticular waxes [29], self-maintained till the end of summer [30], in which airborne lipophilic substances, PCB included, are accumulated efficiently [31,32]. The present work aims at using the leaves of R. pseudoacacia as a matrix for monitoring PCBs in a mixed land use area of northeastern Italy. Here a cement plant, operating since 1950, has been authorized to use RDFs as co-fuel since 2014, which became fully operational after 2017. The cement plant is a known local source of PCBs, which are released in full compliance [33] with the threshold values set by the integrated environmental authorization [34], but harshly debated with local NIMBY opponents. The working hypothesis is that if the PCB fingerprint in the leaf samples collected in the study area is heterogeneous and no spatial trend centered on the cement plant is discernible, then old pollution events or sources different from the plant must critically be considered. The results will be critically compared with those of previous PCB monitoring surveys carried out in the same area from 2016 onward [33,35,36,37] (Supplementary Materials: Table S1). New and old data will thoroughly be discussed, with special attention to the added value offered by a correct biomonitoring approach.

2. Materials and Methods
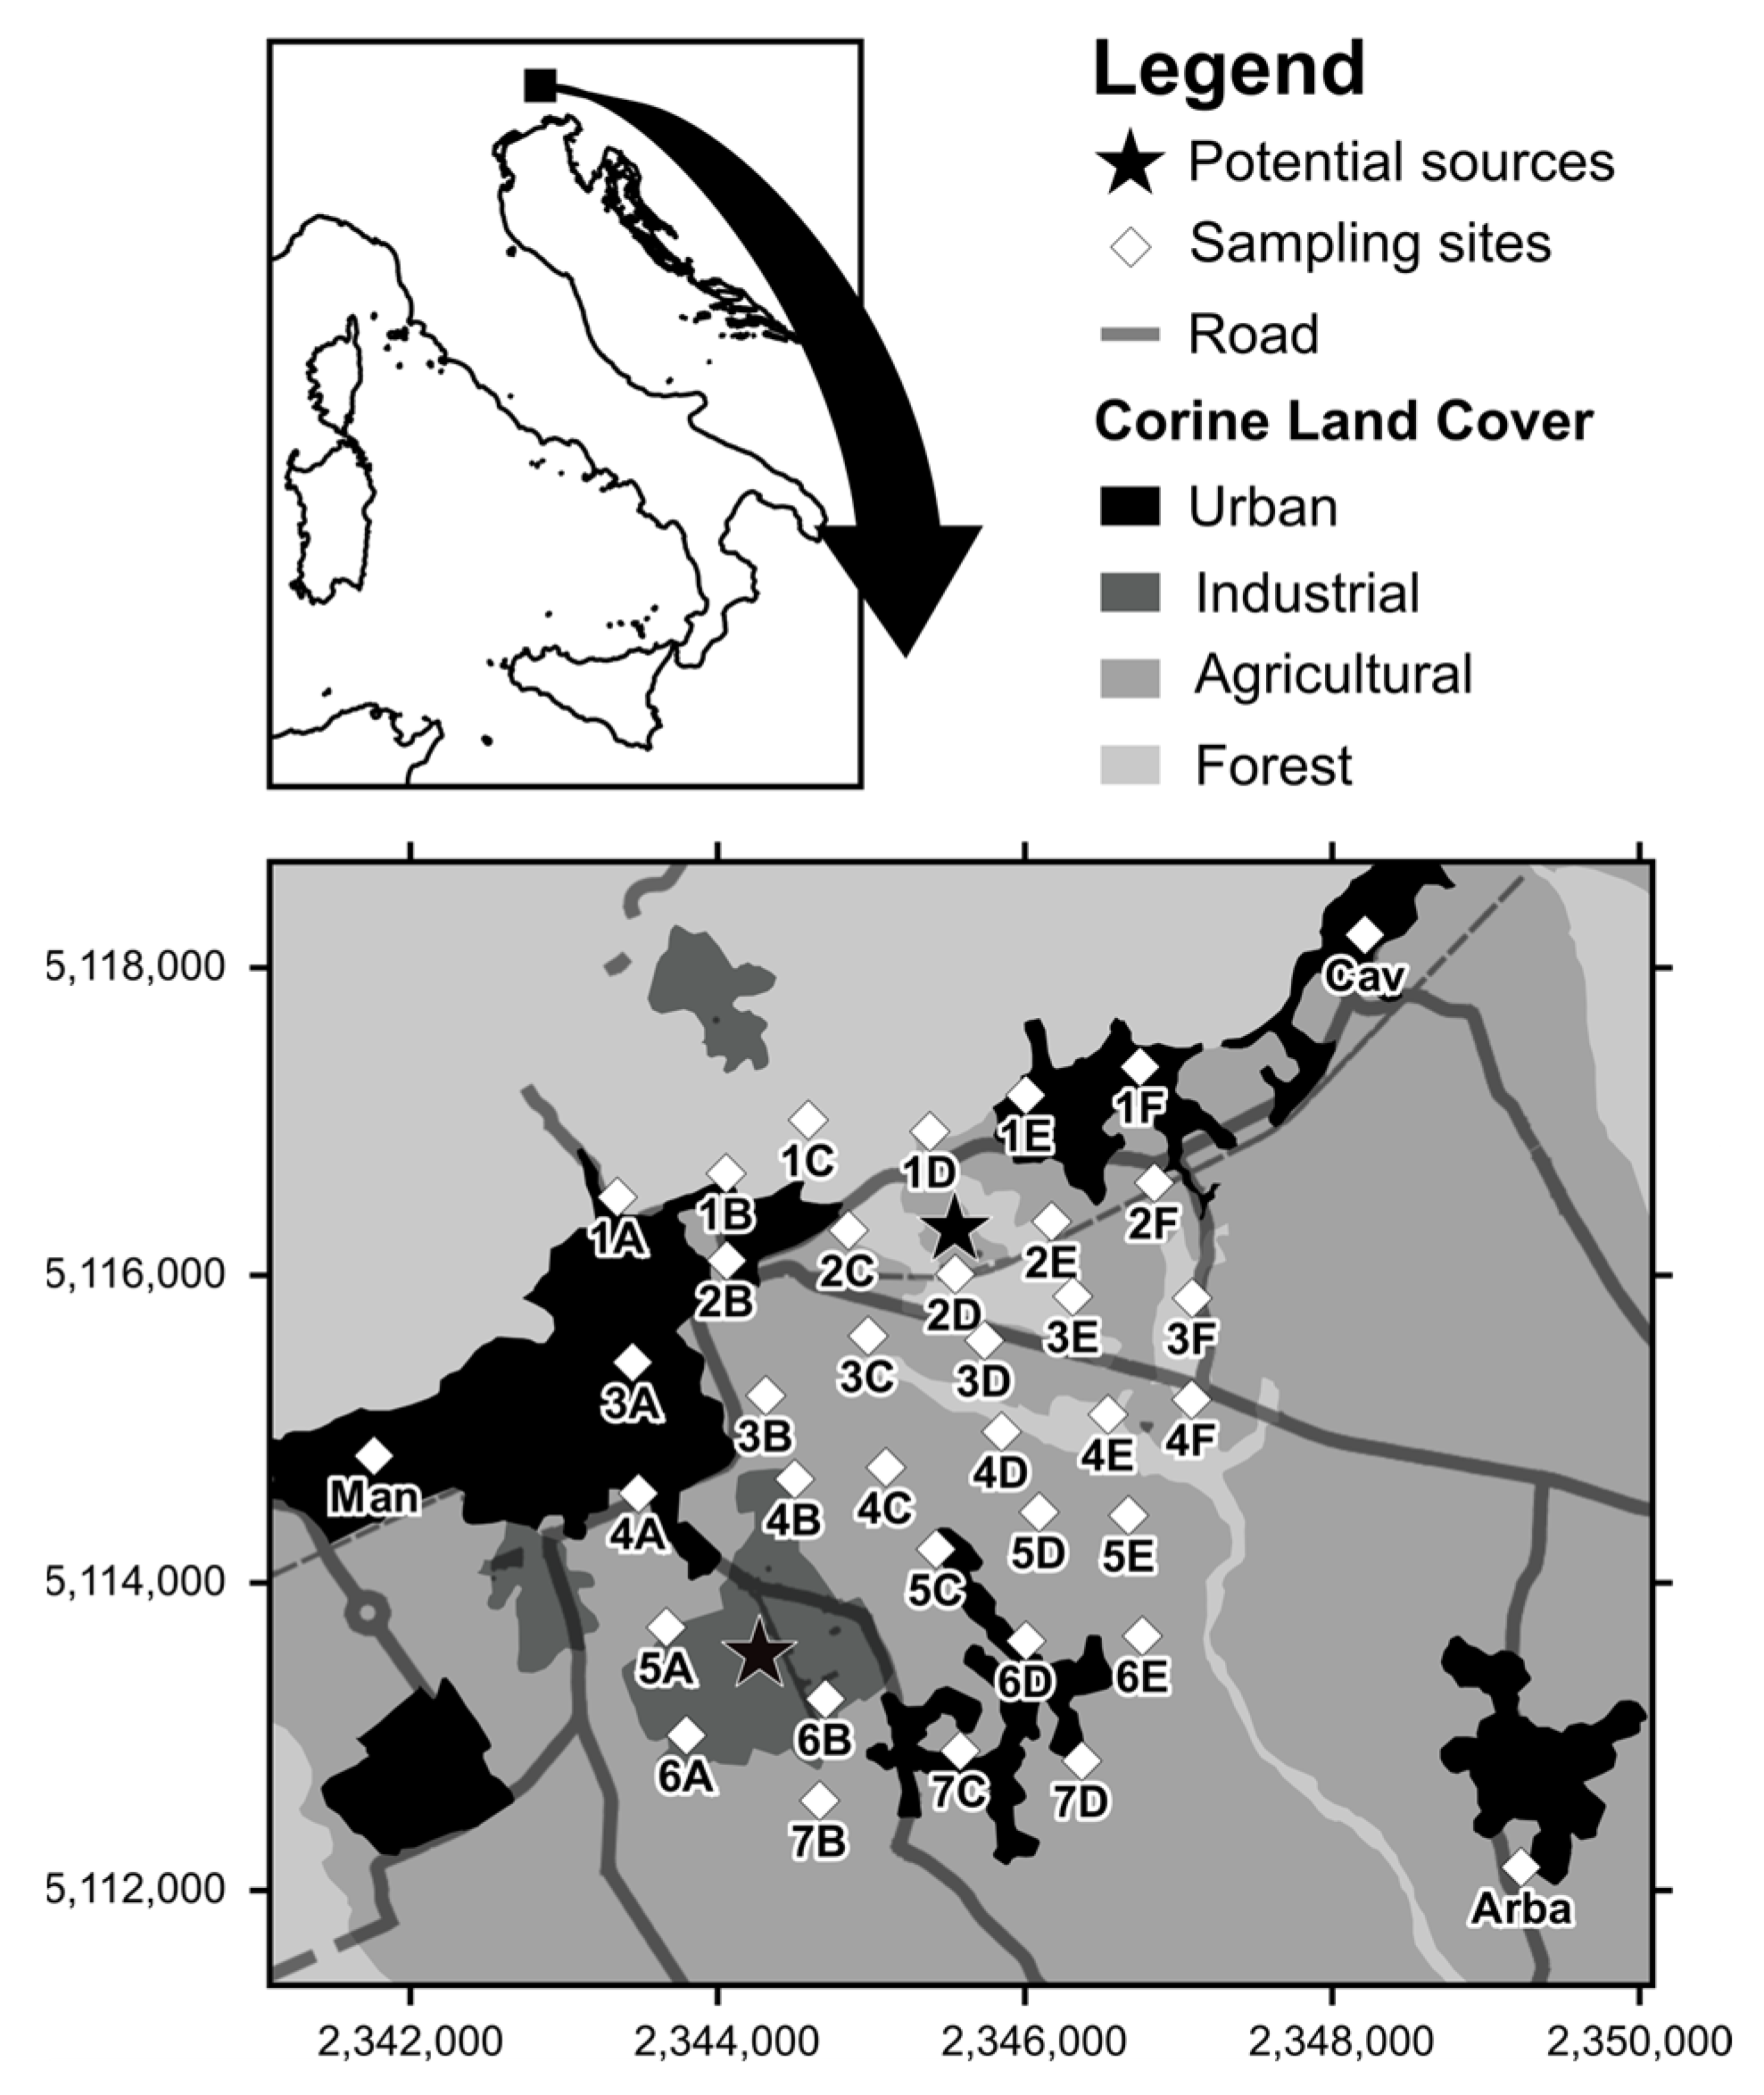
2.1. Study Area

The study area (Figure 1) is located at the foot of the Carnic Pre-Alps (northeastern Italy) and extends over 40 km2 in the typical mixed land use areas of northern Italy, where natural, agricultural, and urban-industrial land uses are strongly intermingled [38]. The main potential pollution sources are: (i) an isolated medium-sized cement plant (clinker production 556,000 ton year−1; [38]) powered by petroleum coke and RDF [34]; (ii) a large industrial park consisting of two steel works, several knife manufacturing factories, and a chemical plant producing pesticides; (iii) vehicular traffic, which is concentrated in the town of Maniago (c. 10,000 inhabitants) and along the national road which crosses the northern portion of the study area (Figure 1).
In the past, the cement plant also used alternative co-fuels, such as industrial and sewage sludge; bottom ash, slug and boiler dusts from industrial combustion process are used as raw materials. In the cement production process, linings and refractories from non-metallurgical processes, clay, marl, and carbonate rocks are processed. Stack emissions (summarized in Supplementary Materials: Table S2) are routinely checked by the local environmental protection agency and the company owning the cement plant.

2.2. Plant Material Sampling

Samples were collected on 18 August 2018 according to a systematic sampling design described elsewhere [38,39,40] (Figure 1). Overall, 37 sampling sites were selected at the knots of a 700 m step grid and 3 further ones in the nearby centers of Arba, Cavasso, and Maniago (Figure 1). At each site, 10 to 20 leaves were sampled at 4–6 m above the ground from the canopies of three mature R. pseudoacacia trees, at a minimum distance of 20 m from the linear and point emission sources (e.g., busy roads and house chimneys). Sampled leaves were stored in paper bags and immediately transported to the laboratory. The leaflets of each sample (10–12 g fresh weight) were excised from the rachis, washed in distilled water, and then dried at 50 °C for 24 h [41]. In this way, possible sample contamination derived from particulate matter on the leaves surfaces was minimized. Afterwards, the samples were ground with a planetary mill equipped with zirconium oxide spheres and jars, and cleaned with 20 mL of an acetone aqueous solution (1:1; v/v) after each grinding cycle. The pulverized samples were transferred to pre-labelled glass jars and kept at 4 °C until chemical analyses.

2.3. Chemical Analysis

Chemical analyses were carried out following the EPA protocols 3546 and 8270. Briefly, 2 g of each sample were dispersed in 10 mL of an acetone/hexane mixture (1:1; v/v), which was heated at 140 °C for 15 min in a MAE microwave system (Ethos-TC, Milestone). The extracts were concentrated in hexane under nitrogen flow to a final volume of 2 mL. Extract purification was carried out through solid phase extraction using an SPE LC-NH2 Supelco tube enriched with 100 mg of anhydrous sodium sulfate and 100 mg of Florisil®. Before adding the extract, the tubes were treated with 6 mL of dichloromethane and 3 mL of hexane. Afterwards, the extract was added and the tube wall was rinsed with 0.5 mL of hexane. The tube containing the extract was eluted twice using 2 mL of the hexane/dichloromethane mixture (65:35; v/v). The eluate was recovered and concentrated under nitrogen flow. The PCBs concentration was measured by injecting 0.5 mL of the concentrated eluate in a gas chromatographer equipped with a RXI-17SIL-MS Restek column and coupled to a mass spectrometer (Bruker, TQ300). Overall, the content of 12 dioxin-like (77, 81, 105, 114, 118, 123, 126, 156, 157, 167, 169, and 189) and 20 non-dioxin-like (18, 28 + 31, 44, 52, 95, 99, 101, 110, 128, 138, 146, 149, 151, 153, 170, 177, 180, 183, 187, and 194) PCB congeners were measured with a limit of detection (LOD) of 0.6 µg kg−1, with the only exceptions being the congeners 28 and 31, whose sum (PCB-28 + 31) was measured with a LOD of 0.8 µg kg−1. For the calibration, the GC-MS six working standard solutions were prepared at six concentrations from 1 to 200 µg L−1 by diluting an inhouse primary standard of the congener 209 with a concentration of 100 µg L−1.

2.4. Data Analysis

Preliminary analyses were carried out to calculate basic statistical parameters (e.g., average, median, standard deviation) of the concentration sums of the 12 dioxin-like (Σ12 DL-PCB), 20 non-dioxin-like (Σ20 NDL-PCB), and all PCB congeners (Σ32 PCB). Then, a non-parametric ANOVA (Kruskall Wallis Test) was carried out in order to compare the medians of Σ12 DL-PCB, Σ20 NDL-PCB and Σ32 PCB values of samples collected from different land use strata and with a PCB content higher than the LODs (see above). To test if the activity of the main emission sources of the study area could be related to the PCB content in leaf samples, a regression analysis was carried out between the values of concentration sums greater than the LOD and the distance of the sampling sites from the major potential emission sources, i.e., the cement plant and the industrial park. Distribution maps of the PCB concentration sums in the study area were calculated in the QGIS environment using an inverse distance weighed algorithm as the interpolation method. The PCB fingerprints of the leaf samples were graphically compared with those available for the stack emissions of the cement plant recorded in February, July, and October 2018, as well as May 2019 (data from [33]). However, because the number of congeners measured in the leaves and in the emissions was different, this comparison was based on the relative percentage of the PCB homologous groups (i.e., groups of congeners with the same chlorine atoms). The PCB composition of the leaf samples was also compared with the fingerprints of 21 past commercial PCB mixtures (data from [42,43]). For this purpose, the relative percentage of PCB homologous groups was submitted to hierarchical clustering using Ward’s method as the cluster algorithms and the Euclidean distance as the measure of linkage distance.

3. Results

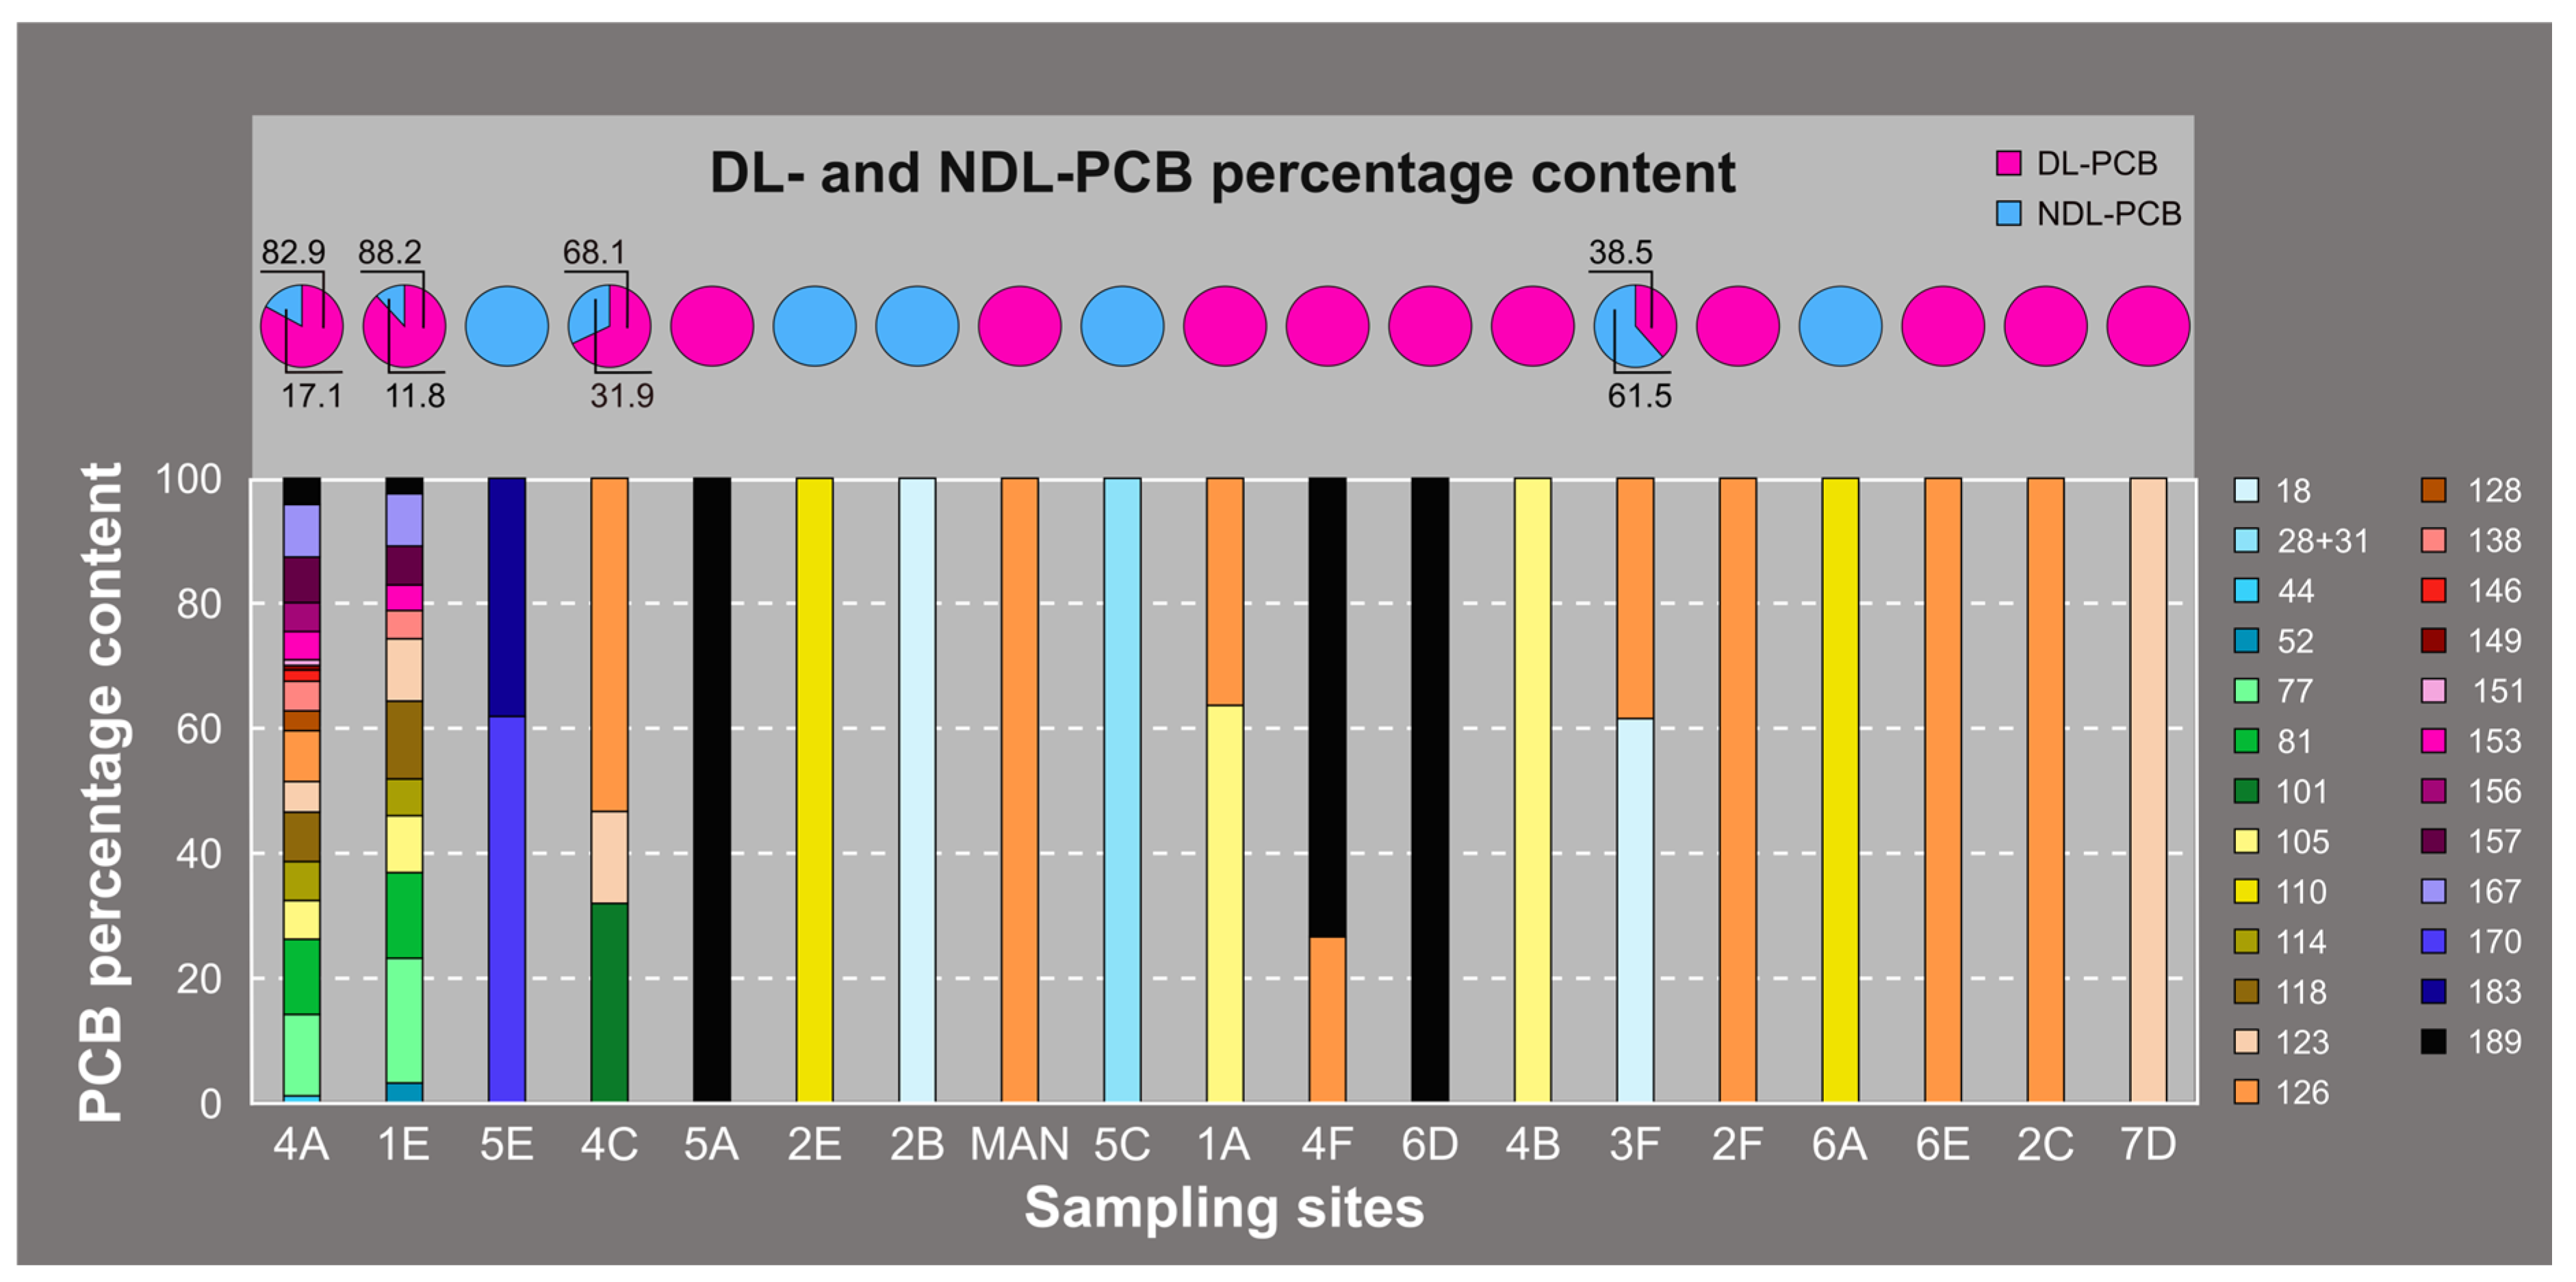
3.1. PCB Concentrations and Fingerprints in R. pseudoacacia Leaf Samples

Overall, 18 out of the 37 leaf samples had a PCB content lower than the limit of detection (Table 1), only 15 contained one or two congeners below or equal to 4.6 µg kg−1, one contained two congeners equal to 8.40 µg kg−1 (i.e., the third highest PCB content in the study area), while three samples, i.e., 4C, 1E, and 4A, had a mixture of 3, 12, and 18 congeners, respectively (Figure 2), with corresponding total contents of 4.69, 80.20, and 99.85 µg kg−1 PCBs. DL-PCBs were detected in 14 samples, and NDL-PCBs in 9 samples; they were co-occurring in 4 cases (Table 1; Figure 2).
The average of the concentration sums of DL-PCB (Σ12 DL-PCB) was three times higher than that of NDL-PCB (Σ20 DL-PCB) (Table 1). Overall, 49% and 43% of the analyzed samples had a concentration sum of all PCBs (Σ32 PCB) lower than the limit of detection (LOD = 0.6 µg kg−1) or comprised between the LOD and the average value observed in the study area (6.48 µg kg−1), respectively.
Nevertheless, the PCB concentrations in the samples 1E, 4A, and 5E strongly deviated not only from the average (Table 1), but also in the high content of Σ12 DL-PCB in the former two samples and Σ20 NDL-PCB in the latter (Table 1; Figure 2). The PCB fingerprint of these three samples was different: samples 1E and 4A shared 11 PCB, but the former contained PCB-52, while the latter contained PCB−44, −126, −128, −146, −149, −151, and −156 (Figure 2). The fingerprint of the sample 5E, however, was characterized by PCB−170 and −183 (Figure 2).

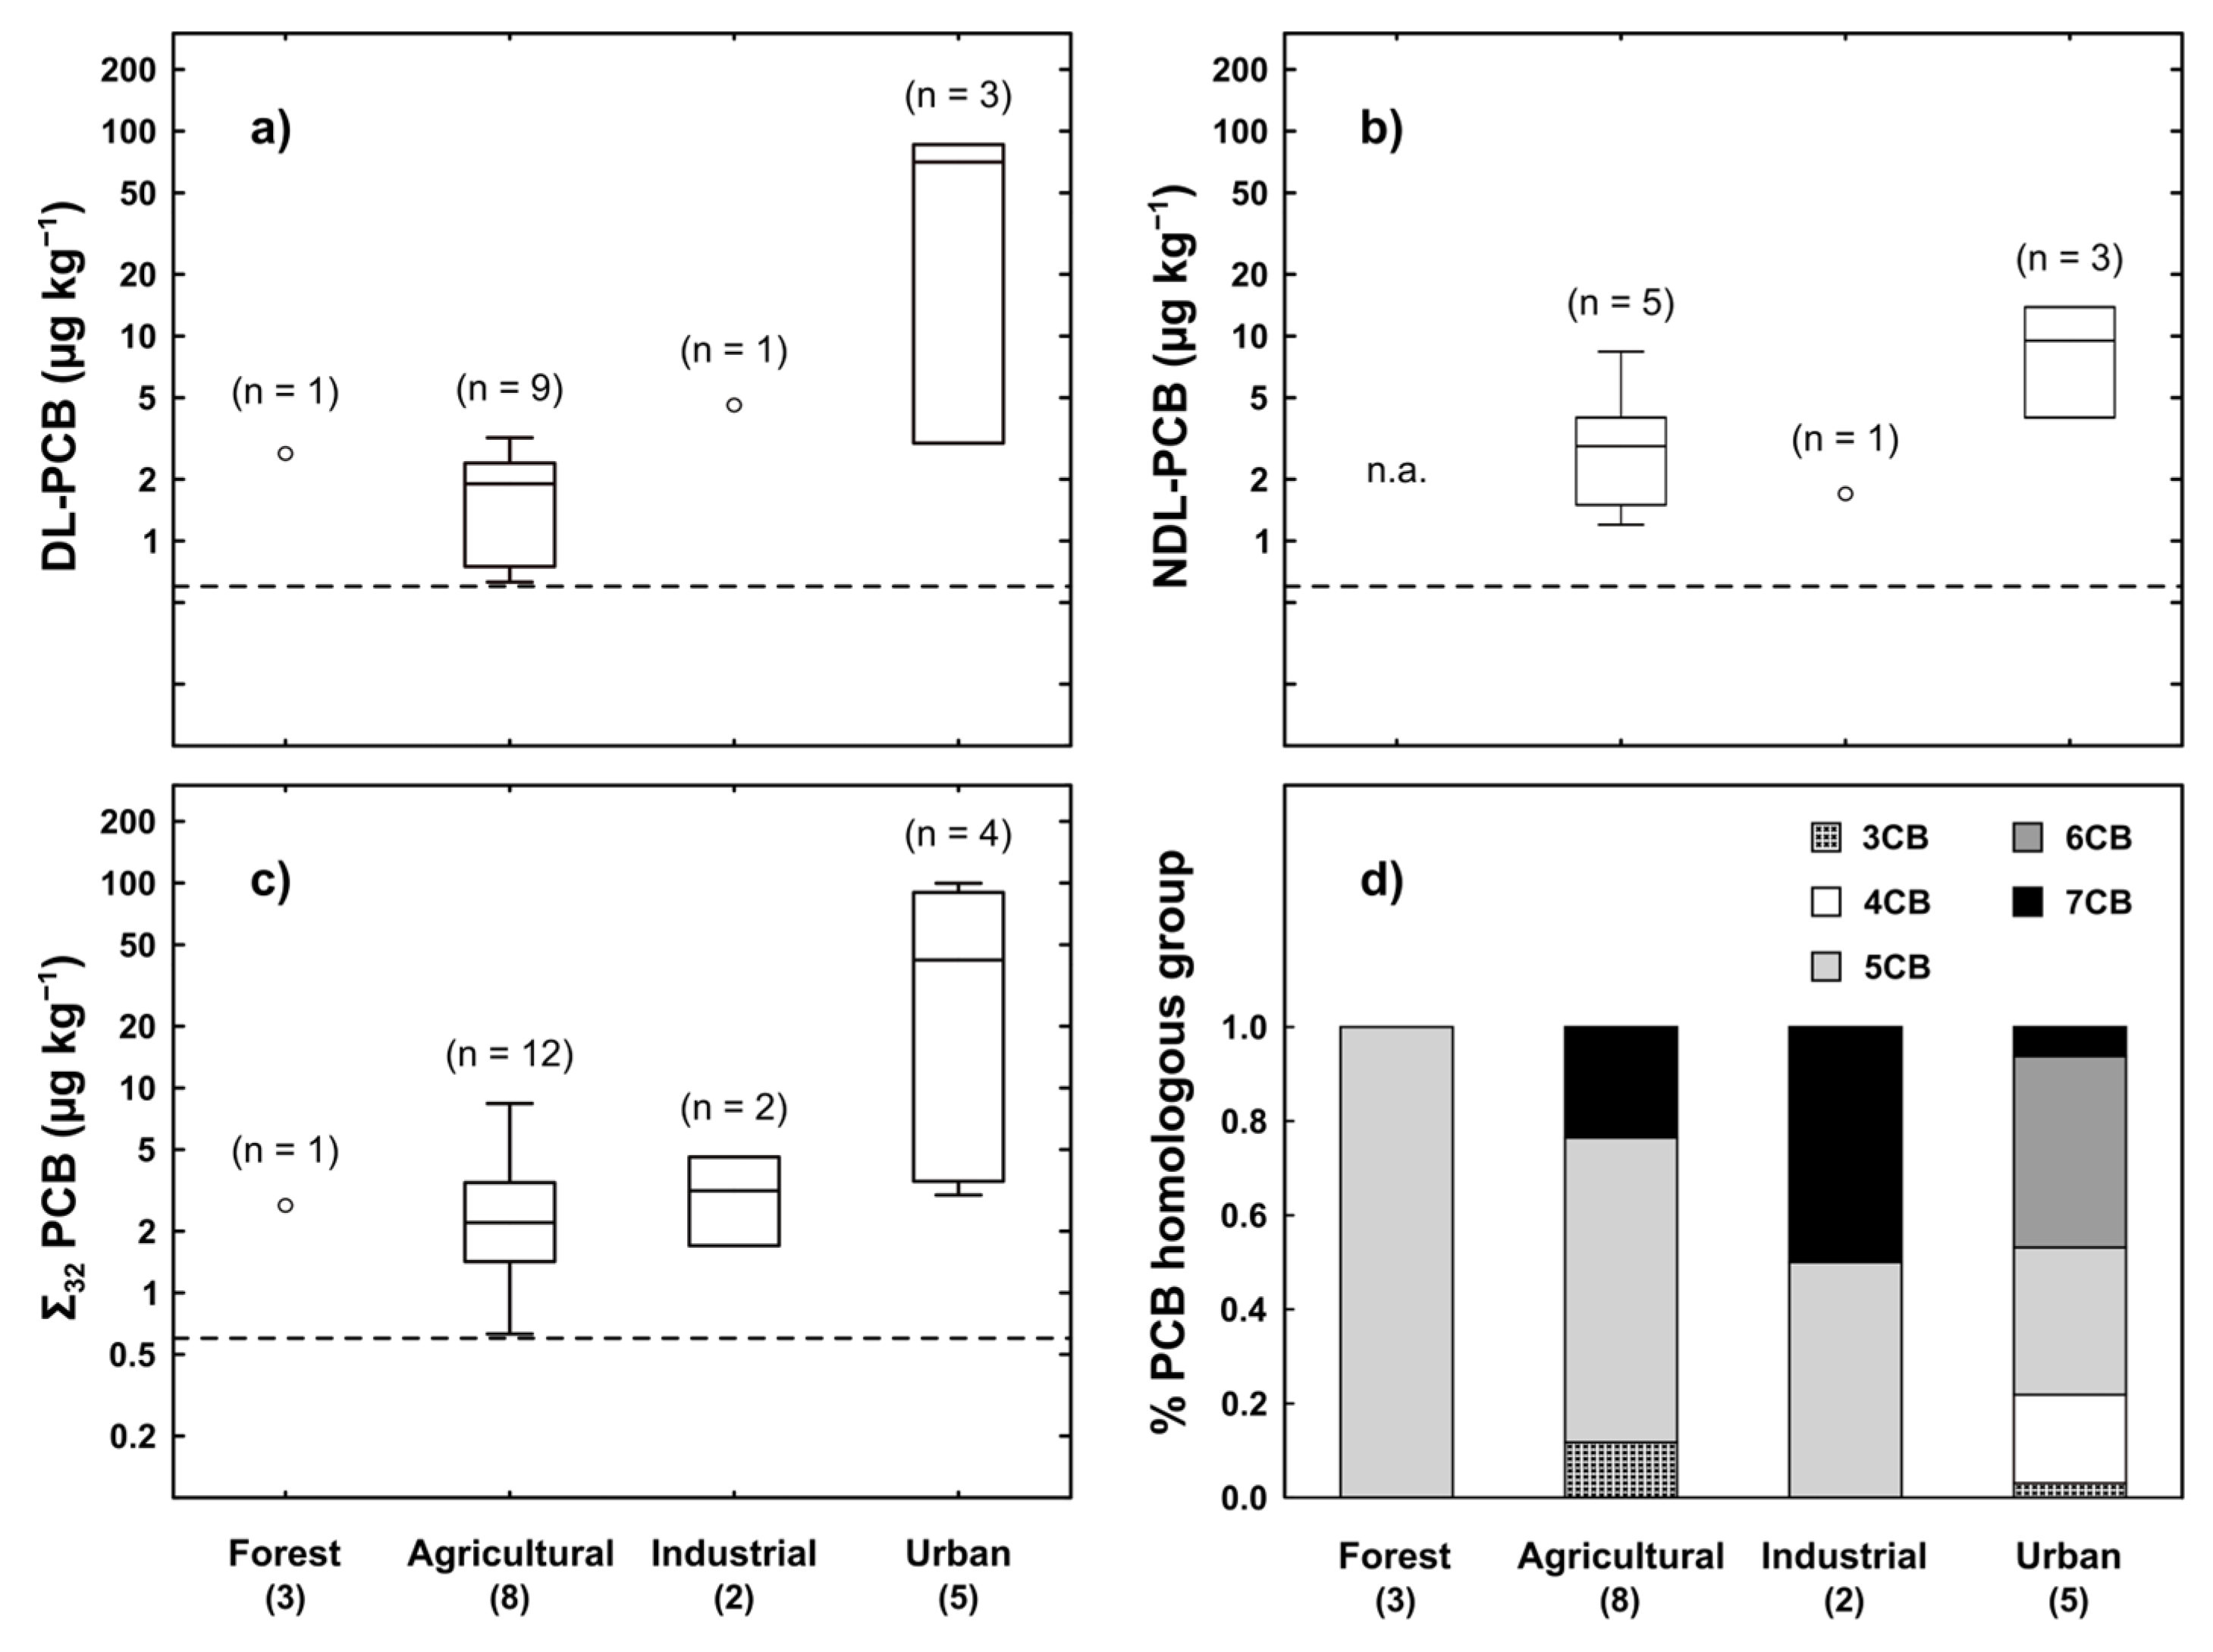
3.2. Influence of Land Use Strata and Distance from the Potential Emission Sources

To localize the potential sources of PCB emissions in the study area, the concentration sums of PCBs (i.e., Σ12 DL-PCB, Σ20 NDL-PCB and Σ32 PCBs) were first compared as a function of the site-specific dominant land use strata using a non-parametric ANOVA (Kruskall Wallis Test). According to the Corine land cover classification [44], 20 sampling sites belonged to the agricultural land use stratum, 9 to the urban stratum, 4 to the industrial stratum, and 4 to the forest stratum. Among the four samples collected within the forest stratum (i.e., 1A, 1B, 1C and 1D), only those sampled in the immediate proximity of the urban center of Maniago (site 1A; Figure 1) had a detectable content of two DL-PCBs (PCB−105 and −126; Figure 3).
In contrast, more than half of the samples collected at the sites classified as agricultural had accumulated DL- and/or NDL-PCB in amounts similar to or higher than those collected in the industrial sites (Figure 3). The highest PCB contents were observed in the samples from the urban sites, with a median value of Σ12 DL-PCB, Σ20 NDL-PCB, and Σ32 PCB one order of magnitude higher than those observed in the industrial sites (Figure 3). Interestingly, the samples from the urban areas differed also in the percentage of the PCB homologous group, i.e., the group of congeners with the same number of chlorine atoms. Most of the samples collected throughout the study area had 1–3 penta- and/or epta-chlorinated congeners, and only those collected in the urban stratum also contained tri-, tetra- and hexa-PCBs (Figure 3d).
No statistically significant linear relationship was found between the concentration PCB sums and the distances to the sampling sites from the major potential emission sources, i.e., the cement plant and the industrial park (Supplementary Materials: Table S3). This suggests that the activity of the two potential emission sources was unrelated to the distribution pattern of PCB in the study area. In support of this, the distribution maps of Σ12 DL-PCB, Σ20 NDL-PCB, and Σ32 PCB values had an undefined pattern characterized by three extremely localized hot spots, i.e., sites 1E, 4A, and 5E (Figure 4).

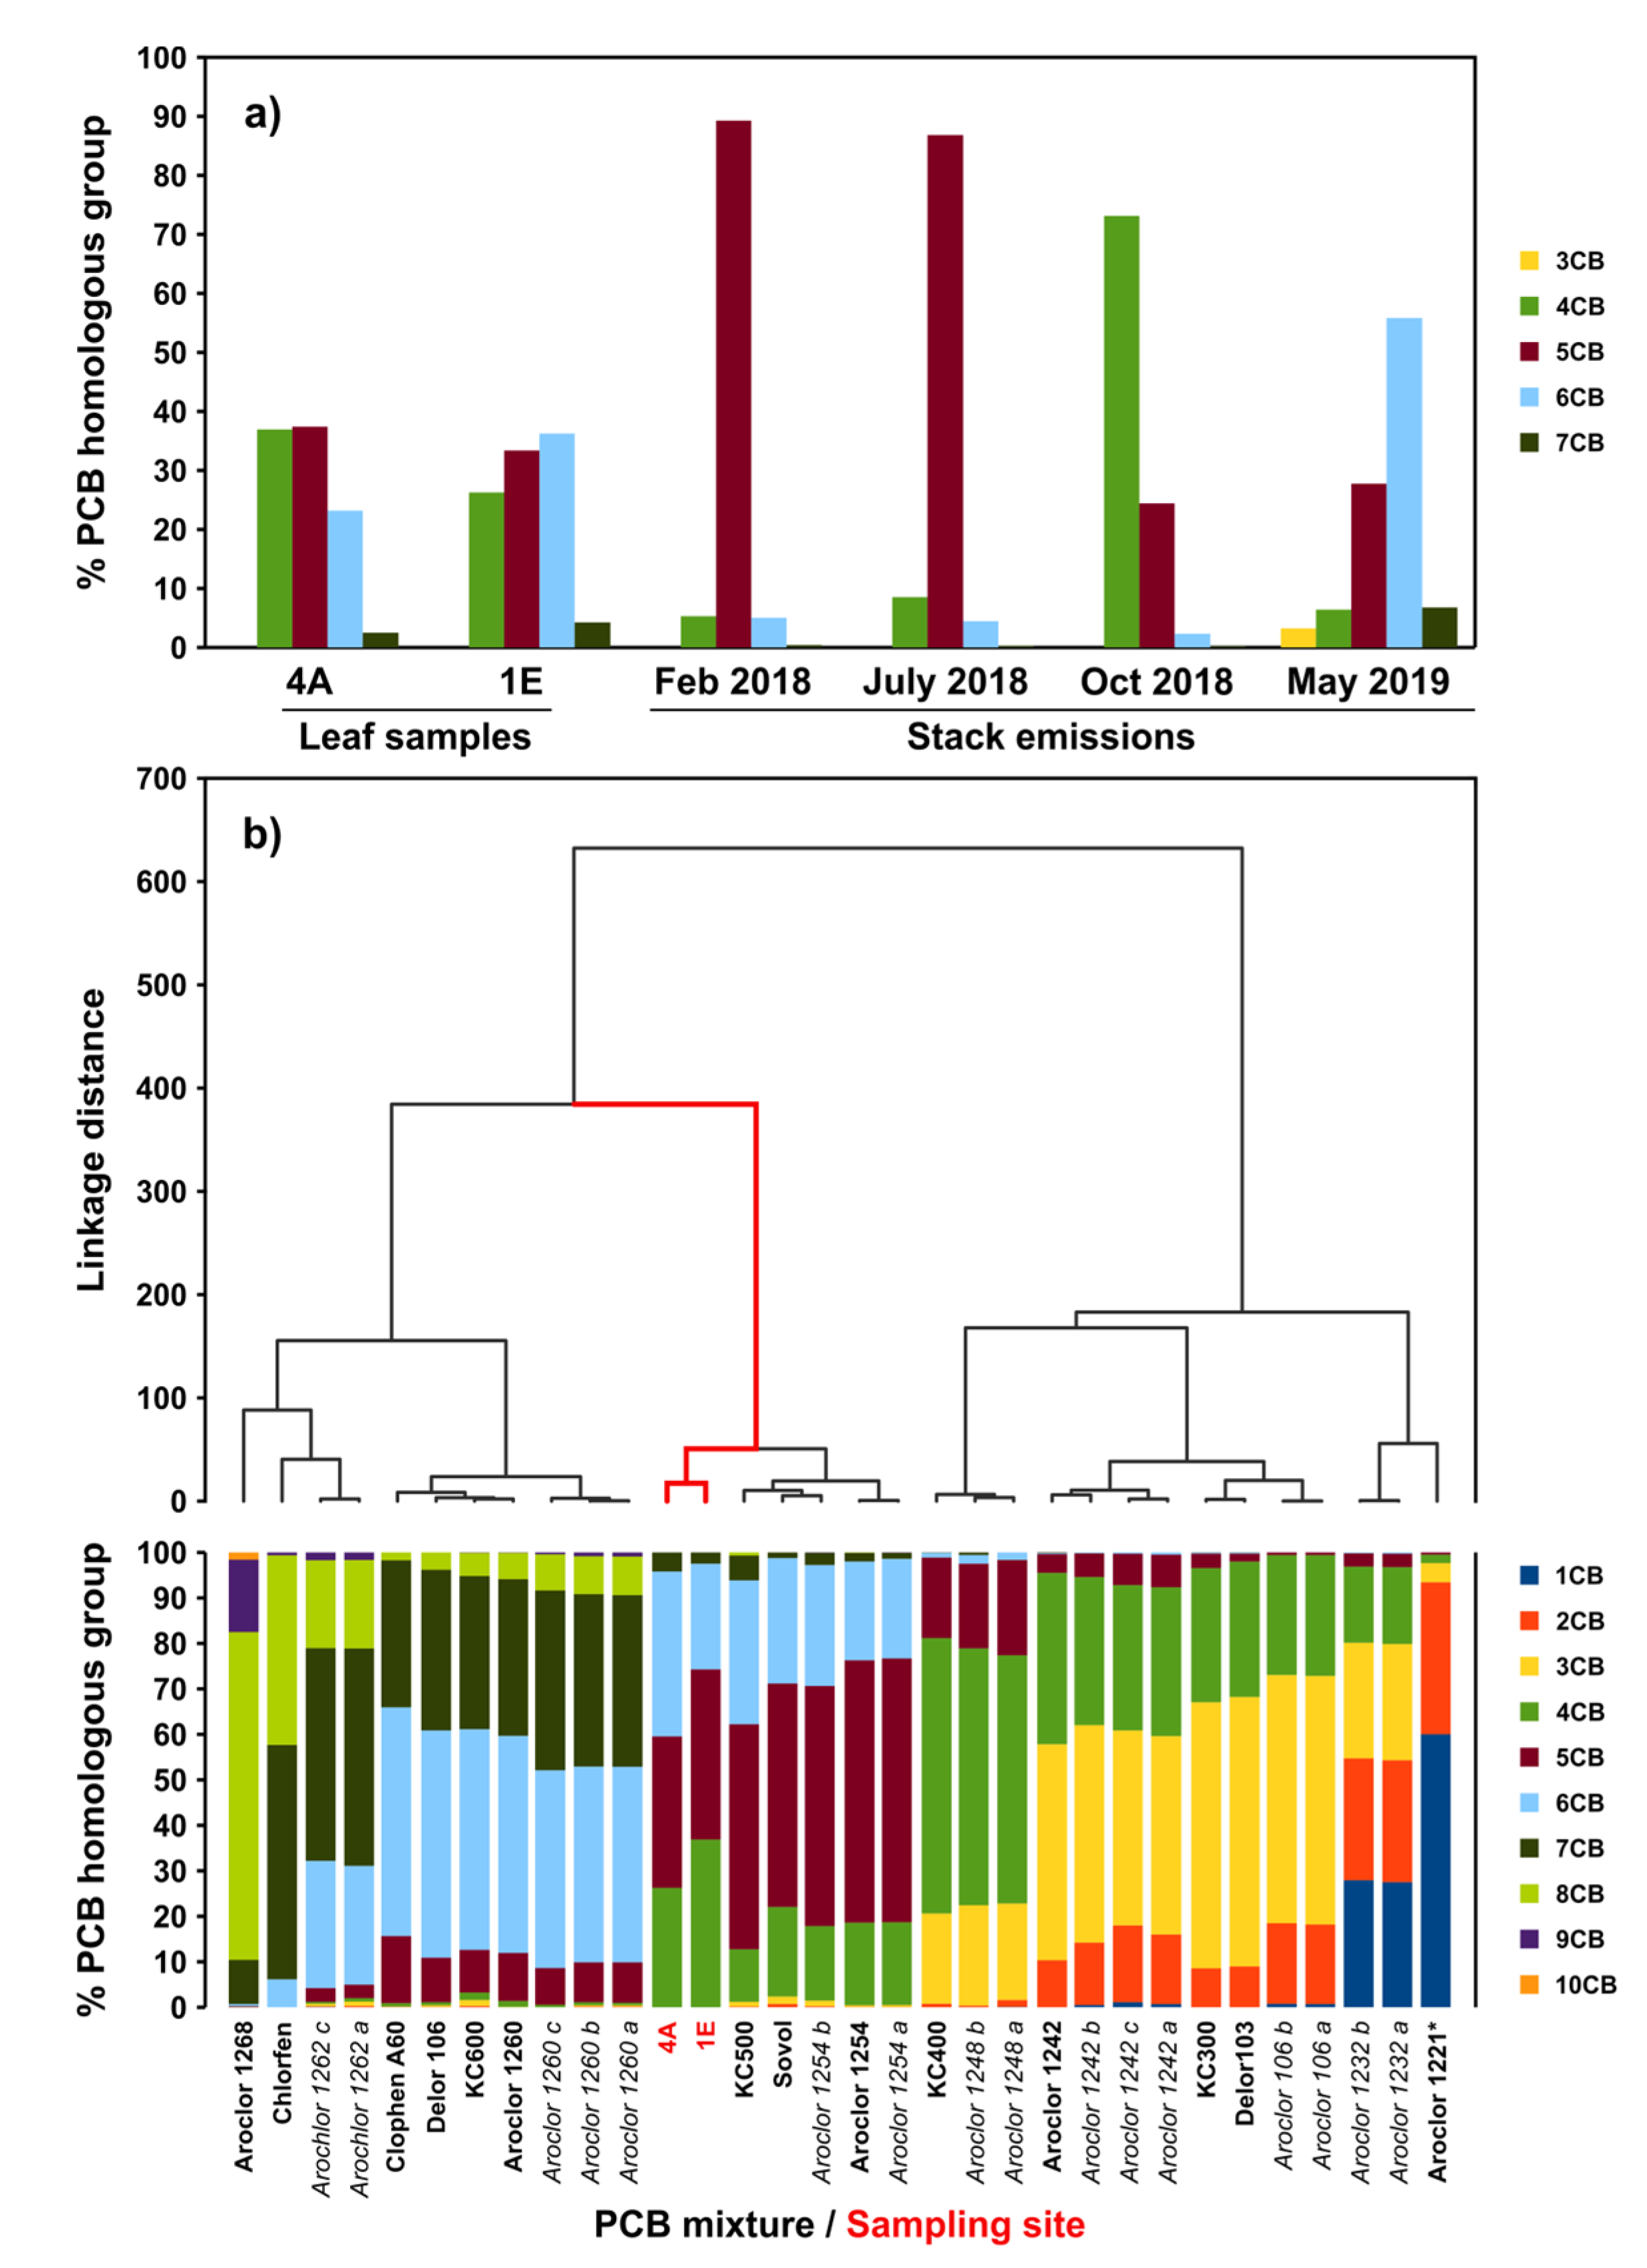
3.3. Fingerprint Comparison

In order to provide an origin for the identified hot spots, a fingerprint comparison was carried out. The PCB content of leaf samples strongly differed from the stack emissions in terms of relative percentages of tri-, tetra-, penta-, hexa-, and epta-chlorinated biphenyls. In particular, leaf samples had similar contents of tetra-, penta-, and hexa-chlorinated biphenyls, which were absent in the stack emissions of e.g., July 2018 (i.e., before the leaf sampling); the latter, on the contrary, were characterized by penta-chlorinated PCBs, where were absent in the leaf samples (Figure 5a). The comparison with the relative percentage of the PCB homologous group of the 21 past commercial PCB mixtures was carried out through hierarchical clustering. The results (Figure 5b) indicated that the relative percentage of the PCB homologous groups in the leaf samples from sites 1E and 4A is very similar, and most importantly, highly compatible with PCB mixtures produced in the past, namely Arochlor 1254 (U.S.A.), Sovol (former U.S.S.R.), and Kanechlor 500 (Japan).

4. Discussion

Robinia pseudoacacia has frequently been used in bioremediation processes of PCBs-contaminated soils [45] due to its nitrogen-fixing bacterioid symbionts, and as a bioaccumulator of airborne trace elements [28,46] and PAHs [32]. To the best of our knowledge, this is the first study to use the leaves of R. pseudoacacia as a matrix for monitoring PCBs. Therefore, it is not possible to qualitatively evaluate the magnitude of the observed PCB concentration values using an interpretative scale, as is currently done with other biomonitors of airborne pollution, e.g., epiphytic lichens (see [40]). For this reason, the bioaccumulation data of R. pseudoacacia leaves were compared with those derived from other plant-based surveys [26,47,48,49,50,51,52,53,54,55,56,57,58,59,60,61,62,63,64,65,66,67,68,69,70,71,72,73,74,75,76,77,78,79,80,81,82,83,84,85,86]. The range of the PCB content measured in this study is lower than those reported in other surveys carried out in close proximity to relevant PCB emissions sources, such as electronic waste incinerators [50], densely inhabited areas with industrial plants [52], and PCB contaminated soils [51]. It is similar to that observed in samples of deciduous plants collected in agricultural fields exposed to the emission of an electronic waste incinerator [57], in evergreen plants from areas with contaminated streams [56], or hosting industrial plants [58]. Lower values are reported only for plant samples intended for human consumption [71] or collected in remote areas [78] (Supplementary Material: Figure S1).
Usually, in the presence of an important pollutant source, an evident distribution pattern, compatible with wind regimes, geomorphology and chimney height, should be expected [55]. Contrastingly, in this study, no evident trend emerged either from the analysis of the PCBs distribution maps (Figure 4), or from the regression analysis between concentration values and distances to the sampling sites from the two purported sources, i.e., the cement plant and the industrial park (Supplementary Materials: Table S3). Only the land use based comparison revealed that the environmental availability of NDL- and DL-PCB was significantly higher in urban sites rather than in agricultural or industrial ones (Figure 3). Similar patterns were already observed in other PCB biomonitoring surveys carried out in China [52], France [79], and Poland [60], using pine needles as the biological matrix. High PCB content in urban leaf samples has frequently been attributed to the off-gassing from PCB-treated construction materials in old buildings, and leakage from closed systems such as old electrical equipment (e.g., capacitors and transformers that still contain large quantities of PCB fluids) [11]. However, a further important source of PCBs at the local level might be the burning of old wood floors and furniture, with their PCBs-containing finishes, de-dusting agents, paints, and waterproofing compounds. This is reinforced by the fact that in the study area, wood burning is a common practice for domestic heating, and causes an important local enrichment in, for example, 4-ring PAHs [38].
The aberrant, high concentration values observed only in three sites, i.e., 1E, 4A, and 5E (Figure 4), cannot be referred to any clear distribution pattern. These three sites were characterized by a peculiar PCB composition with respect to the other 34 sampling sites (Figure 5a). The leaf PCB fingerprints from sites 1E and 4A were remarkably different from that of the cement plant stack emissions recorded immediately before leaf sampling (July 2018; Figure 5a). A critical re-appraisal of the site cards, which was carefully compiled during the sampling, did not reveal any evident environmental anomaly and/or the presence of combustion activity linked to domestic heating. Thus, the most probable explanation is a very localized soil contamination, caused by a past release of PCBs or due to PCBs-enriched materials. This hypothesis requires validation by direct assays of soil samples, but it is fully supported by the peculiar congener compositions of the samples 1E and 4A, which are fully congruent with those of some commercial PCB mixtures. Notwithstanding their different trade names, these mixtures had very similar compositions [87] and were widely used in products also distributed in the Italian market [88].
The direct terrigenous contamination of the samples 1E and 4A must be excluded, because all the leaf samples processed in this study had been rinsed in distilled water before chemical analysis (see material and methods section), specifically to remove the fraction of particulate matter deposited on the external leaf surface [89]. Because in trees PCBs are not translocated to the leaves [24,25], the PCB enrichment of samples 1E and 4A might be the direct consequence of the volatilization of the PCBs present in the upper soil layers, and absorbed by the leaves of the surrounding vegetation. Interestingly, this accumulation mechanism was demonstrated in azalea (Rhododendron sp.) potted plants exposed in mesocosms containing PCB contaminated soil [90].
Previous (bio-)monitoring surveys (Supplementary Materials: Table S1) conducted by a local organization of NIMBY opponents or, in response to them, by the regional environmental protection agency (ARPA-FVG), had also pinpointed single hot spots of PCB contamination in the study area, and referred to the use of RDFs as co-fuel in the cement plant (the NIMBY ones) or by unknown sources (the ARPA-FVG ones). The analyzed matrices were the most diverse: hen fat tissues [35], chicken eggs and hen fodder [37], soil [36], and air particulate matter [33]. Each survey adopted a different sampling strategy, with different numbers of sampling sites, possibly chosen for their availability of the selected matrix, and unfortunately were never resampled from one study to the other. Interestingly, all the surveys based on animal and plant samples pinpointed single hot spots of PCB contamination, whose spatial distribution differed from study to study, was never consistent in terms of PCB composition, and never fully compatible with the known industrial processes occurring in the area. This contamination heterogeneity might depend on very localized past PCB spill-overs, caused by the aleatory dispersal of PCB-containing materials, and occurred independently several times in different places. In fact, if leaves accumulate PCBs through their volatilization from contaminated soil (see above), the high PCB content observed in hens bred in open field conditions might derive from the ingestion of soil and soil organisms, such as worms and slugs [91], living in or nearby a contaminated site. Notoriously, PCBs can persist for many decades in the environment [10], are easily retained within an organism, and are subjected to important biomagnification processes. Moreover, humans have generally too short a memory to remember what occurred at a site only a few decades ago.

5. Conclusions

The use of Robinia pseudoacacia leaves allowed us to monitor the distribution of airborne PCBs with high spatial resolution in an area characterized by mixed land use. Thanks to the adoption of a systematic sampling design with high sampling density, it was possible to trace back the differences in the PCB leaf content to the land use strata and exclude their spatial relationship with the geographical position of the main potential emission sources, i.e., the cement plant and the industrial park. The hierarchical clustering carried out on the PCB homologous group measured in the leaf samples and those of former commercial PCB mixtures supported the hypothesis that the unusually high PCB concentration values of three hot-spots derive from the volatilization of occasional PCB spill-overs, excluding the present use of RDF as co-fuel in the cement plant.

Supplementary Materials

The following supporting information can be downloaded at: https://www.mdpi.com/article/10.3390/pollutants3010002/s1. Table S1: résumé of the studies carried out between 2016 and 2019 aimed at assessing the distribution of polychloro byphenyls and polychloro dibenzo dioxins/furans near the main potential sources of the study area (Figure 1), i.e., the cement plant and the industrial park; Table S2: summary of the polychlorinated biphenyls concentrations (pg ncm−1) measured in the stack emissions of the cement plant during February, July, and October 2018 and May 2019; Table S3: results of the regression analysis carried out between the distance to the cement plant and the industrial park from the 37 sampling sites in Figure 1 and the concentration sums of the 12 dioxin-like (Σ12 DL-PCB), 20 non-dioxin-like (Σ20 NDL-PCB), and all 32 PCB congeners (Σ32 PCB) calculated for the Robinia pseudoacacia leaf samples; Figure S1: comparison between the range of PCB concentration values measured in Robinia pseudoacacia samples (this study, in red) and those reported in 41 other studies based on the use of leaves of deciduous broadleaved, evergreen broadleaved, and coniferous species as biomonitors of airborne PCB.

Author Contributions

Conceptualization, M.T.; Methodology, L.F. and M.T.; Software, L.F.; Validation, M.T.; Formal Analysis, L.F.; Investigation, L.F. and M.T.; Resources, L.F.; Data Curation, L.F.; Writing—Original Draft Preparation, L.F. and M.T.; Writing—Review & Editing, M.T.; Visualization, L.F.; Supervision, M.T.; Project Administration, M.T.; Funding Acquisition, M.T. All authors have read and agreed to the published version of the manuscript.

Funding

Field work and PCB analyses were financed by Buzzi Unicem S.p.A. (Casale Monferrato, Italy) in the framework of a research contract with M.T. as scientific responsible (contract number: J11I18000160007). The activity of L.F. was partially covered by Cementizillo S.p.A. (Padova, Italy) with a post-doc grant (contract number: J91I18000440007).

Data Availability Statement

The datasets used and/or analysed during the current study are available from the corresponding author on reasonable request.

Acknowledgments

We gratefully acknowledge Elva Cecconi and Marco Peplis (University of Trieste) for their valuable help in sample collection and processing. Fabio Candotto Carniel (University of Trieste) is thanked for critical remarks to the manuscript.

Conflicts of Interest

The sponsors had no role in the design of the study, as well as in the sample collection, interpretation of the data and in writing the original draft of the manuscript. The authors declare no conflict of interest.

References

  1. Georgiopoulou, M.; Lyberatos, G. Life cycle assessment of the use of alternative fuels in cement kilns: A case study. J. Environ. Manag. 2018, 216, 224–234. [Google Scholar] [CrossRef] [PubMed]
  2. Garg, A.; Smith, R.; Hill, D.; Simms, N.; Pollard, S. Wastes as co-fuels: The policy framework for solid recovered fuel (SRF) in Europe, with UK implications. Environ. Sci. Technol. 2007, 41, 4868–4874. [Google Scholar] [CrossRef] [PubMed] [Green Version]
  3. Alcock, R.E.; Gemmill, R.; Jones, K.C. Improvements to the UK PCDD/F and PCB atmospheric emission inventory following an emissions measurement programme. Chemosphere 1999, 38, 759–770. [Google Scholar] [CrossRef]
  4. Weber, R.; Iino, F.; Imagawa, T.; Takeuchi, M.; Sakurai, T.; Sadakata, M. Formation of PCDF, PCDD, PCB, and PCN in de novo synthesis from PAH: Mechanistic aspects and correlation to fluidized bed incinerators. Chemosphere 2001, 44, 1429–1438. [Google Scholar] [CrossRef]
  5. Directive of the European Parliament and of the Council of 4 December 2000 on the Incineration of Waste, 76. 2000. Available online: http://data.europa.eu/eli/dir/2000/76/oj (accessed on 9 November 2022).
  6. Directive of the European Parliament and of the Council of 24 November 2010 on Industrial Emissions (Integrated Pollution Prevention and Control) (Recast) (Text with EEA Relevance), 75. 2010. Available online: http://data.europa.eu/eli/dir/2010/75/oj (accessed on 9 November 2022).
  7. Hooper, S.W.; Pettigrew, C.A.; Sayler, G.S. Ecological fate, effects and prospects for the elimination of environmental polychlorinated biphenyls (PCBs). Environ. Toxicol. Chem. 1990, 9, 655–667. [Google Scholar] [CrossRef]
  8. Kafafi, S.A.; Afeefy, H.Y.; Ali, A.H.; Said, H.K.; Kafafi, A.G. Binding of polychlorinated biphenyls to the aryl hydrocarbon receptor. Environ. Health Perspect. 1993, 101, 422–428. [Google Scholar] [CrossRef] [PubMed]
  9. Prince, K.D.; Taylor, S.D.; Angelini, C. A global, cross-system meta-analysis of polychlorinated biphenyl biomagnification. Environ. Sci. Technol. 2020, 54, 10989–11001. [Google Scholar] [CrossRef]
  10. Borja, J.; Taleon, D.M.; Auresenia, J.; Gallardo, S. Polychlorinated biphenyls and their biodegradation. Process Biochem. 2005, 40, 1999–2013. [Google Scholar] [CrossRef]
  11. Erickson, M.D.; Kaley, R.G. Applications of polychlorinated biphenyls. Environ. Sci. Pollut. Res. 2011, 18, 135–151. [Google Scholar] [CrossRef]
  12. Rossberg, M.; Lendle, W.; Pfleiderer, G.; Tögel, A.; Dreher, E.L.; Langer, E.; Rassaerts, H.; Kleinschmidt, P.; Strack, H.; Cook, R.; et al. Chlorinated Hydrocarbons. In Ullmann’s Encyclopedia of Industrial Chemistry; Wiley-VCH: Weinheim, Germany, 2006; pp. 1–86. [Google Scholar] [CrossRef]
  13. Lallas, P.L. The Stockholm Convention on persistent organic pollutants. Am. J. Int. Law 2001, 95, 692–708. [Google Scholar] [CrossRef]
  14. United Nation Environment Programme Home Page. Available online: https://wedocs.unep.org/handle/20.500.11822/31249?show=full (accessed on 9 November 2022).
  15. Weber, R.; Herold, C.; Hollert, H.; Kamphues, J.; Blepp, M.; Ballschmiter, K. Reviewing the relevance of dioxin and PCB sources for food from animal origin and the need for their inventory, control and management. Environ. Sci. Eur. 2018, 30, 42. [Google Scholar] [CrossRef] [PubMed] [Green Version]
  16. Breivik, K.; Gioia, R.; Chakraborty, P.; Zhang, G.; Jones, K.C. Are reductions in industrial organic contaminants emissions in rich countries achieved partly by export of toxic wastes? Environ. Sci. Technol. 2011, 45, 9154–9160. [Google Scholar] [CrossRef] [PubMed]
  17. Richards, G.; Agranovski, I.E. Dioxin-like pcb emissions from cement kilns during the use of alternative fuels. J. Hazard. Mater. 2017, 323, 698–709. [Google Scholar] [CrossRef] [PubMed]
  18. Davies, G.F. Harm-benefit analysis: Opportunities for enhancing ethical review in animal research. Lab Animal 2018, 47, 57–58. [Google Scholar] [CrossRef] [PubMed]
  19. Safari, M.; Ramavandi, B.; Sanati, A.M.; Sorial, G.A.; Hashemi, S.; Tahmasebi, S. Potential of trees leaf/bark to control atmospheric metals in a gas and petrochemical zone. J. Environ. Manag. 2018, 222, 12–20. [Google Scholar] [CrossRef] [PubMed]
  20. Puri, R.K.; Qiuping, Y.; Kapila, S.; Lower, W.R.; Puri, V. Plant uptake and metabolism of polychlorinated biphenyls (PCBs). In Plants for Environmental Studies; Wang, W., Gorsuch, J.W., Hughes, J.S., Eds.; CRC Press: New York, NY, USA, 1997; pp. 481–513. [Google Scholar]
  21. Webber, M.D.; Pietz, R.I.; Granato, T.C.; Svoboda, M.L. Plant uptake of PCBs and other organic contaminants from sludge-treated coal refuse. J. Environ. Qual. 1994, 23, 1019–1026. [Google Scholar] [CrossRef]
  22. White, J.C.; Parrish, Z.D.; Isleyen, M.; Gent, M.P.; Iannucci-Berger, W.; Eitzer, B.D.; Kelsey, J.W.; Mattina, M.I. Influence of citric acid amendments on the availability of weathered PCBs to plant and earthworm species. Int. J. Phytoremediat. 2006, 8, 63–79. [Google Scholar] [CrossRef]
  23. Wang, S.; Luo, C.; Zhang, D.; Wang, Y.; Song, M.; Yu, Z.; Wang, Y.; Zhang, G. Reflection of stereoselectivity during the uptake and acropetal translocation of chiral PCBs in plants in the presence of copper. Environ. Sci. Technol. 2017, 51, 13834–13841. [Google Scholar] [CrossRef]
  24. Liu, J.; Schnoor, J.L. Uptake and translocation of lesser-chlorinated polychlorinated biphenyls (PCBs) in whole hybrid poplar plants after hydroponic exposure. Chemosphere 2008, 73, 1608–1616. [Google Scholar] [CrossRef]
  25. Kacálková, L.; Tlustoš, P. The uptake of persistent organic pollutants by plants. Open Life Sci. 2011, 6, 223–235. [Google Scholar] [CrossRef]
  26. Cindoruk, S.S.; Sakin, A.E.; Tasdemir, Y. Levels of persistent organic pollutants in pine tree components and ambient air. Environ. Pollut. 2020, 256, 113418. [Google Scholar] [CrossRef] [PubMed]
  27. Rashidi, F.; Jalili, A.; Kafaki, S.B.; Sagheb-Talebi, K.; Hodgson, J. Anatomical responses of leaves of Black Locust (Robinia pseudoacacia L.) to urban pollutant gases and climatic factors. Trees 2012, 26, 363–375. [Google Scholar] [CrossRef]
  28. Fortuna, L.; Candotto Carniel, F.; Capozzi, F.; Tretiach, M. Congruence evaluation of mercury pollution patterns around a waste incinerator over a 16-year-long period using different biomonitors. Atmosphere 2019, 10, 183. [Google Scholar] [CrossRef] [Green Version]
  29. Neinhuis, C.; Koch, K.; Barthlott, W. Movement and regeneration of epicuticular waxes through plant cuticles. Planta 2001, 213, 427–434. [Google Scholar] [CrossRef]
  30. Tranquada, G.C.; Erb, U. Morphological development and environmental degradation of superhydrophobic aspen and black locust leaf surfaces. Ecohydrology 2014, 7, 1421–1436. [Google Scholar] [CrossRef]
  31. Moeckel, C.; Thomas, G.O.; Barber, J.L.; Jones, K.C. Uptake and storage of PCBs by plant cuticles. Environ. Sci. Technol. 2008, 42, 100–105. [Google Scholar] [CrossRef]
  32. Capozzi, F.; Di Palma, A.; Adamo, P.; Spagnuolo, V.; Giordano, S. Monitoring chronic and acute PAH atmospheric pollution using transplants of the moss Hypnum cupressiforme and Robinia pseudacacia leaves. Atmos. Environ. 2017, 150, 45–54. [Google Scholar] [CrossRef]
  33. Agenzia Regionale per la Protezione dell’Ambiente del Friuli Venezia Giulia Home Page. Available online: http://www.arpa.fvg.it/export/sites/default/focus_ambientali/Pedemontana_Pordenonese/download/Relazione_microinquinanti_2018-2019_Maniaghese_v2.2_firmata.pdf (accessed on 9 November 2022).
  34. Presa D’atto Dell’intervenuta Modifica della Titolarità Dell’Autorizzazione Integrata Ambientale (AIA) di cui al Decreto n. 276 del 20 Febbraio 2014, Relativa All’esercizio Dell’attività di cui al punto 3.1, dell’Allegato VIII, alla Parte Seconda, del Decreto Legislativo 152/2006, Svolta Presso L’installazione sita nel Comune di Fanna (PN), Decreto n° 4963, 2018; Direzione Centrale Ambiente ed Energia. Available online: https://www.regione.fvg.it/rafvg/export/sites/default/RAFVG/ambiente-territorio/valutazione-ambientale-autorizzazioni-contributi/FOGLIA3/DITTE/allegati/PN_AIA_12-R.pdf (accessed on 9 November 2022).
  35. Movimento 5 Stelle Friuli Venezia Giulia Home Page. Available online: http://www.movimento5stellefvg.it/wp-content/uploads/2018/04/ChickensPops.pdf (accessed on 9 November 2022).
  36. Agenzia Regionale per la Protezione dell’Ambiente del Friuli Venezia Giulia Home Page. Available online: http://www.arpa.fvg.it/export/sites/default/tema/suolo/suolbio/allegati/RELAZIONE_MANIAGO_DIOSSINE.pdf (accessed on 9 November 2022).
  37. Agenzia Regionale per la Protezione dell’Ambiente del Friuli Venezia Giulia Home Page. Available online: http://www.arpa.fvg.it/export/sites/default/focus_ambientali/Pedemontana_Pordenonese/download/Relazione-conclusiva-Maniago-Fanna-Vajont-Cavasso-Nuovo_2019.pdf (accessed on 9 November 2022).
  38. Kodnik, D.; Carniel Candotto, F.; Licen, S.; Tolloi, A.; Barbieri, P.; Tretiach, M. Seasonal variations of PAHs content and distribution patterns in a mixed land use area: A case study in NE Italy with the transplanted lichen Pseudevernia furfuracea. Atmos. Environ. 2015, 113, 255–263. [Google Scholar] [CrossRef]
  39. Kodnik, D.; Winkler, A.; Carniel Candotto, F.; Tretiach, M. Biomagnetic monitoring and element content of lichen transplants in a mixed land use area of NE Italy. Sci. Tot. Environ. 2017, 595, 858–867. [Google Scholar] [CrossRef]
  40. Cecconi, E.; Fortuna, L.; Peplis, M.; Tretiach, M. Element accumulation performance of living and dead lichens in a large-scale transplant application. Environ. Sci. Pollut. Res. 2021, 28, 16214–16226. [Google Scholar] [CrossRef]
  41. Bacci, E.; Gaggi, C. Polychlorinated biphenyls in plant foliage: Translocation or volatilization from contaminated soils? Bull. Environ. Contam. Toxicol. 1985, 35, 673–681. [Google Scholar] [CrossRef] [PubMed]
  42. Wyrzykowska, B.; Bochentin, I.; Hanari, N.; Orlikowska, A.; Falandysz, J.; Yuichi, H.; Yamashita, N. Source determination of highly chlorinated biphenyl isomers in pine needles–comparison to several PCB preparations. Environ. Pollut. 2006, 143, 46–59. [Google Scholar] [CrossRef] [PubMed]
  43. Frame, G.M.; Cochran, J.W.; Bøwadt, S.S. Complete PCB congener distributions for 17 Aroclor mixtures determined by 3 HRGC systems optimized for comprehensive, quantitative, congener-specific analysis. J. High Res. Chromatog. 1996, 19, 657–668. [Google Scholar] [CrossRef]
  44. Büttner, G.; Soukup, T.; Sousa, A. CLC 2006 Technical Guidelines; Report N° 17/2007; European Environmental Agency: Copenhagen, Denmark, 2007. [Google Scholar]
  45. Leigh, M.B.; Prouzová, P.; Macková, M.; Macek, T.; Nagle, D.P.; Fletcher, J.S. Polychlorinated biphenyl (PCB)-degrading bacteria associated with trees in a PCB-contaminated site. Appl. Environ. Microb. 2006, 72, 2331–2342. [Google Scholar] [CrossRef] [Green Version]
  46. Tretiach, M.; Candotto Carniel, F.; Loppi, S.; Carniel, A.; Bortolussi, A.; Mazzilis, D.; Del Bianco, C. Lichen transplants as a suitable tool to identify mercury pollution from waste incinerators: A case study from NE Italy. Environ. Monit. Assess. 2011, 175, 589–600. [Google Scholar] [CrossRef]
  47. Chen, S.J.; Tian, M.; Zheng, J.; Zhu, Z.C.; Luo, Y.; Luo, X.J.; Mai, B.X. Elevated levels of polychlorinated biphenyls in plants, air, and soils at an e-waste site in Southern China and enantioselective biotransformation of chiral PCBs in plants. Environ. Sci. Technol. 2014, 48, 3847–3855. [Google Scholar] [CrossRef]
  48. Maskaoui, K.; Zhou, J.L.; Han, Y.L.; Hu, Z.; Zheng, T.L.; Hong, H.S. Contamination of soil, leaves and vegetables by polychlorinated biphenyls in Xiamen region, China. J. Environ. Sci. 2005, 17, 460–464. [Google Scholar]
  49. Alegria, H.; Martinez-Colon, M.; Birgul, A.; Brooks, G.; Hanson, L.; Kurt-Karakus, P. Historical sediment record and levels of PCBs in sediments and mangroves of Jobos Bay, Puerto Rico. Sci. Tot. Environ. 2016, 573, 1003–1009. [Google Scholar] [CrossRef]
  50. Klees, M.; Hombrecher, K.; Gladtke, D. Polychlorinated biphenyls in the surrounding of an e-waste recycling facility in North-Rhine Westphalia: Levels in plants and dusts, spatial distribution, homologue pattern and source identification using the combination of plants and wind direction data. Sci. Tot. Environ. 2017, 603, 606–615. [Google Scholar] [CrossRef]
  51. Luttmer, C.; Ficko, S.; Reimer, K.; Zeeb, B. Deciduous vegetation (Betula glandulosa) as a biomonitor of airborne PCB contamination from a local source in the Arctic. Sci. Tot. Environ. 2013, 445, 314–320. [Google Scholar] [CrossRef]
  52. Xu, D.; Deng, L.; Chai, Z.; Mao, X. Organohalogenated compounds in pine needles from Beijing city, China. Chemosphere 2004, 57, 1343–1353. [Google Scholar] [CrossRef] [PubMed]
  53. Sofuoglu, S.C.; Yayla, B.; Kavcar, P.; Ates, D.; Turgut, C.; Sofuoglu, A. Olive tree, Olea europaea L., leaves as a bioindicator of atmospheric PCB contamination. Environ. Sci. Pollut. Res. 2013, 20, 6178–6183. [Google Scholar] [CrossRef] [PubMed] [Green Version]
  54. Olatunji, O.S. Evaluation of selected polychlorinated biphenyls (PCBs) congeners and dichlorodiphenyltrichloroethane (DDT) in fresh root and leafy vegetables using GC-MS. Sci. Rep. 2019, 9, 538. [Google Scholar] [CrossRef] [PubMed] [Green Version]
  55. Blais, J.M.; Froese, K.L.; Kimpe, L.E.; Muir, D.C.; Backus, S.; Comba, M.; Schindler, D.W. Assessment and characterization of polychlorinated biphenyls near a hazardous waste incinerator: Analysis of vegetation, snow, and sediments. Environ. Toxicol. Chem. 2003, 22, 126–133. [Google Scholar] [CrossRef]
  56. Dang, V.D.; Walters, D.M.; Lee, C.M. Assessing atmospheric concentration of polychlorinated biphenyls by evergreen Rhododendron maximum next to a contaminated stream. Environ. Toxicol. Chem. 2016, 35, 2192–2198. [Google Scholar] [CrossRef]
  57. Fan, Y.; Chen, S.J.; Li, Q.Q.; Zeng, Y.; Yan, X.; Mai, B.X. Uptake of halogenated organic compounds (HOCs) into peanut and corn during the whole life cycle grown in an agricultural field. Environ. Pollut. 2020, 263, 114400. [Google Scholar] [CrossRef]
  58. Odabasi, M.; Ozgunerge Falay, E.; Tuna, G.; Altiok, H.; Kara, M.; Dumanoglu, Y.; Bayram, A.; Tolunay, D.; Elbir, T. Biomonitoring the spatial and historical variations of persistent organic pollutants (POPs) in an industrial region. Environ. Sci. Technol. 2015, 49, 2105–2114. [Google Scholar] [CrossRef]
  59. Wyrzykowska, B.; Hanari, N.; Orlikowska, A.; Bochentin, I.; Rostkowski, P.; Falandysz, J.; Taniyasu, S.; Horii, Y.; Jiang, Q.; Yamashita, N. Polychlorinated biphenyls and-naphthalenes in pine needles and soil from Poland–Concentrations and patterns in view of long-term environmental monitoring. Chemosphere 2007, 67, 1877–1886. [Google Scholar] [CrossRef]
  60. Falandysz, J.; Orlikowska, A.; Jarzyńska, G.; Bochentin, I.; Wyrzykowska, B.; Drewnowska, M.; Hanari, N.; Horii, Y.; Yamashita, N. Levels and sources of planar and non-planar PCBs in pine needles across Poland. J. Environ. Sci. Health Part A 2012, 47, 688–703. [Google Scholar] [CrossRef]
  61. Hanedar, A.; Güneş, E.; Kaykioğlu, G.; Çelik, S.Ö.; Cabi, E. Presence and distributions of POPS in soil, atmospheric deposition, and bioindicator samples in an industrial-agricultural area in Turkey. Environ. Monit. Assess. 2019, 191, 42. [Google Scholar] [CrossRef]
  62. Ma, J.; Cheng, J.; Xie, H.; Hu, X.; Li, W.; Zhang, J.; Yuan, T.; Wang, W. Seasonal and spatial character of PCBs in a chemical industrial zone of Shanghai, China. Environ. Geochem. Health 2007, 29, 503–511. [Google Scholar] [CrossRef] [PubMed]
  63. Amakura, Y.; Tsutsumi, T.; Tanno, K.; Nomura, K.; Yanagi, T.; Kono, Y.; Yoshimura, M.; Maitani, T.; Matsuda, R.; Yoshida, T. Dioxin concentrations in commercial health tea materials in Japan. J. Health Sci. 2009, 55, 290–293. [Google Scholar] [CrossRef] [Green Version]
  64. Garí, M.; Bosch, C.; Grimalt, J.O.; Sunyer, J. Impacts of atmospheric chlor-alkali factory emissions in surrounding populations. Environ. Int. 2014, 65, 1–8. [Google Scholar] [CrossRef] [PubMed]
  65. Kannan, N.; Hong, S.H.; Yim, U.H.; Shim, W.J. Biomonitoring background levels of PCBs and PBDEs in Seoul metropolitan atmosphere for possible health effects. Toxicol. Environ. Health Sci. 2009, 1, 109–116. [Google Scholar] [CrossRef]
  66. Davidson, D.A.; Wilkinson, A.C.; Blais, J.M.; Kimpe, L.E.; McDonald, K.M.; Schindler, D.W. Orographic cold-trapping of persistent organic pollutants by vegetation in mountains of western Canada. Environ. Sci. Technol. 2003, 37, 209–215. [Google Scholar] [CrossRef]
  67. Sajwan, K.S.; Kumar, K.S.; Kelley, S.; Loganathan, B.G. Deposition of organochlorine pesticides, PCBs (Aroclor 1268), and PBDEs in selected plant species from a superfund site at Brunswick, Georgia, USA. Bull. Environ. Contam. Toxicol. 2009, 82, 444–449. [Google Scholar] [CrossRef]
  68. Brambilla, G.; Abate, V.; di Domenico, A.; Esposito, M.; Fulgenzi, A.R.; Iacovella, N.; Serpe, F.P.; Tassinari, M. Non-dioxin-like PCB and PBDE deposition on Zea mays L. leaves: Modelled contamination in milk from dairy animals fed on silage. Food Addit. Contam. A 2015, 32, 864–873. [Google Scholar] [CrossRef]
  69. Gabryszewska, M.; Gworek, B. Impact of municipal and industrial waste incinerators on PCBs content in the environment. PLoS ONE 2020, 15, e0242698. [Google Scholar] [CrossRef]
  70. Romanić, S.H.; Klinčić, D. Organochlorine compounds in pine needles from Croatia. Bull. Environ. Contam. Toxicol. 2012, 88, 838–841. [Google Scholar] [CrossRef]
  71. Grassi, P.; Fattore, E.; Generoso, C.; Fanelli, R.; Arvati, M.; Zuccato, E. Polychlorobiphenyls (PCBs), polychlorinated dibenzo-p-dioxins (PCDDs) and dibenzofurans (PCDFs) in fruit and vegetables from an industrial area in northern Italy. Chemosphere 2010, 79, 292–298. [Google Scholar] [CrossRef]
  72. Nakagawa, R.; Hori, T.; Tobiishi, K.; Iida, T.; Tsutsumi, T.; Sasaki, K.; Toyoda, M. Levels and tissue-dependent distribution of dioxin in Japanese domestic leafy vegetables––from the 1999 national investigation. Chemosphere 2002, 48, 247–256. [Google Scholar] [CrossRef] [PubMed]
  73. Müller, J.F.; Hawker, D.W.; McLachlan, M.S.; Connell, D.W. PAHS, PCDD/Fs, PCBs and HCB in leaves from Brisbane, Australia. Chemosphere 2001, 43, 507–515. [Google Scholar] [CrossRef] [PubMed]
  74. Al Nasir, F.; Batarseh, M.I. Agricultural reuse of reclaimed water and uptake of organic compounds: Pilot study at Mutah University wastewater treatment plant, Jordan. Chemosphere 2008, 72, 1203–1214. [Google Scholar] [CrossRef] [PubMed]
  75. Li, Q.; Wang, Y.; Luo, C.; Li, J.; Zhang, G. Characterization and risk assessment of polychlorinated biphenyls in soils and rice tissues in a suburban paddy field of the Pearl River Delta, South China. Environ. Sci. Pollut. Res. 2015, 22, 11626–11633. [Google Scholar] [CrossRef]
  76. Qiu, Y.W.; Qiu, H.L.; Zhang, G.; Li, J. Bioaccumulation and cycling of organochlorine pesticides (OCPs) and polychlorinated biphenyls (PCBs) in three mangrove reserves of south China. Chemosphere 2019, 217, 195–203. [Google Scholar] [CrossRef]
  77. Loganathan, B.G.; Kumar, K.S.; Seaford, K.D.; Sajwan, K.S.; Hanari, N.; Yamashita, N. Distribution of persistent organohalogen compounds in pine needles from selected locations in Kentucky and Georgia, USA. Arch. Environ. Contam. Toxicol. 2008, 54, 422–439. [Google Scholar] [CrossRef] [PubMed]
  78. Terzi, M.; Acemi, A.; Ergül, H.A.; Özen, F. PAH and PCB Levels in Malva sylvestris L. specimens collected from Kocaeli, Turkey. Biomonitoring 2016, 2, 42–46. [Google Scholar] [CrossRef]
  79. Al Dine, E.J.; Mokbel, H.; Elmoll, A.; Massemin, S.; Vuilleumier, S.; Toufaily, J.; Hanieh, T.; Millet, M. Concomitant evaluation of atmospheric levels of polychlorinated biphenyls, organochlorine pesticides, and polycyclic aromatic hydrocarbons in Strasbourg (France) using pine needle passive samplers. Environ. Sci. Pollut. Res. 2015, 22, 17850–17859. [Google Scholar] [CrossRef]
  80. Cui, S.; Hough, R.; Fu, Q.; Qi, X.; Liu, D.; Cooper, P.; Li, P.; Zhang, Z. Concentrations and uptake pathways of polychlorinated biphenyls from soil to grass. Ecotox. Environ. Safe 2019, 182, 109428. [Google Scholar] [CrossRef]
  81. Klánová, J.; Čupr, P.; Baráková, D.; Šeda, Z.; Anděl, P.; Holoubek, I. Can pine needles indicate trends in the air pollution levels at remote sites? Environ. Pollut. 2009, 157, 3248–3254. [Google Scholar] [CrossRef] [PubMed]
  82. Gong, P.; Wang, X.P.; Li, S.H.; Yu, W.S.; Kattel, D.B.; Wang, W.C.; Devkota, L.P.; Yao, T.D.; Joswiak, D.R. Atmospheric transport and accumulation of organochlorine compounds on the southern slopes of the Himalayas, Nepal. Environ. Pollut. 2014, 192, 44–51. [Google Scholar] [CrossRef] [PubMed]
  83. Silva, J.A.; Ratola, N.; Ramos, S.; Homem, V.; Santos, L.; Alves, A. An analytical multi-residue approach for the determination of semi-volatile organic pollutants in pine needles. Anal. Chim. Acta 2015, 858, 24–31. [Google Scholar] [CrossRef] [Green Version]
  84. Graziani, N.S.; Tames, M.F.; Mateos, A.C.; Silva, J.A.; Ramos, S.; Homem, V.; Ratola, N.; Carreras, H. Estimation of urban POP and emerging SVOC levels employing Ligustrum lucidum leaves. Atmos. Pollut. Res. 2019, 10, 1524–1530. [Google Scholar] [CrossRef] [Green Version]
  85. Gao, S.Z.; Zhao, X.R.; Cui, S.M.; Gan, Z.F.; Jiao, L.X.; Liu, L.S.; Lei, K.; Zheng, B.H. Distribution characteristics of the typical persistent organic pollutants (POPs) in Suaeda heteroptera. Huan Jing Ke Xue 2010, 31, 2456–2461. [Google Scholar] [PubMed]
  86. Romanić, S.H.; Kljaković-Gašpić, Z.; Bituh, T.; Žužul, S.; Dvoršćak, M.; Fingler, S.; Jurasović, J.; Klinčić, D.; Marović, G.; Orct, T.; et al. The impact of multiple anthropogenic contaminants on the terrestrial environment of the Plitvice Lakes National Park, Croatia. Environ. Monit. Assess. 2016, 188, 27. [Google Scholar] [CrossRef]
  87. Ivanov, V.; Sandell, E. Characterization of polychlorinated biphenyl isomers in Sovol and trichlorodiphenyl formulations by high-resolution gas chromatography with electron capture detection and high-resolution gas chromatography-mass spectrometry techniques. Environ. Sci. Technol. 1992, 26, 2012–2017. [Google Scholar] [CrossRef]
  88. Gabrielcig, F.; Lenarduzzi, F.; Patrone, O. Programma Provinciale Attuativo del Programma Regionale per la Decontaminazione e lo Smaltimento Degli Apparecchi Non Soggetti ad Inventario Contenenti PCB e del PCB in Essi Contenuto; Provincia di Gorizia, Direzione Territorio e Ambiente: Gorizia, Italy, 2011; p. 43, 3 allegati. [Google Scholar]
  89. Castanheiro, A.; Joos, P.; Wuyts, K.; De Wael, K.; Samson, R. Leaf-deposited semi-volatile organic compounds (SVOCs): An exploratory study using GCxGC-TOFMS on leaf washing solutions. Chemosphere 2019, 214, 103–110. [Google Scholar] [CrossRef]
  90. Bacci, E.; Gaggi, C. Chlorinated hydrocarbon vapours and plant foliage: Kinetics and applications. Chemosphere 1987, 16, 2515–2522. [Google Scholar] [CrossRef]
  91. Van Eijkeren, J.C.; Zeilmaker, M.J.; Kan, C.A.; Traag, W.A.; Hoogenboom, L.A.P. A toxicokinetic model for the carry-over of dioxins and PCBs from feed and soil to eggs. Food Addit. Contam. 2006, 23, 509–517. [Google Scholar] [CrossRef]
Figure 1. Geographical localization of the study area with the 37 sampling sites (◇). Black stars near to sites 2D and 5A indicate the cement-plant and the industrial park, respectively. UTM 33N coordinates are reported on the x, y axes.
Pollutants 03 00002 g001
Figure 2. Percentage content of PCB congeners measured in the 19 Robinia pseudoacacia leaf samples collected at the 32 sampling sites shown in Figure 1 with PCB content > LOD. The samples are sorted along the abscissa in descending order according to the total content of all 32 PCBs. The upper pie graphs show the percentage content of dioxin-like (DL) and non-dioxin-like (NDL) PCBs.
Pollutants 03 00002 g002
Figure 3. Statistical comparison (Kruskal–Wallis Test) among the concentration sums of the 12 dioxin-like (Σ12 DL-PCB) (a), 20 non-dioxin-like (Σ20 NDL-PCB) (b), and all 32 PCB congeners (Σ32 PCB) (c) measured in Robinia pseudoacacia leaf samples collected in forest, agricultural, industrial, and urban strata of the study area of Figure 1; the analysis was based on the 19 samples with PCB content > LOD (black dotted line). The average of the percentage of PCB homologous groups calculated for leaf samples collected in the strata is given in (d). The numbers in brackets below the labels of the x-axis corresponds to the samples with PCB content < LOD.
Pollutants 03 00002 g003
Figure 4. Distribution patterns of the concentration sums of the 12 dioxin-like (Σ12 DL-PCB), 20 non-dioxin-like (Σ20 NDL-PCB), and all 32 PCB congeners (Σ32 PCB) measured in the Robinia pseudoacacia leaf samples shown in Figure 1. For a list of measured PCBs, see the text.
Pollutants 03 00002 g004
Figure 5. Percentage of the PCB homologous group (3CB-7CB) in leaf samples from sites 4A and 1E and in the stack emission of the cement plant in four periods (data from [37]) (a); the results of the hierarchical clustering (b) carried out on the percentage of the PCB homologous groups (1CB-10CB) calculated for the same leaf samples and selected PCBs mixtures commercialized in the past. The lower histogram represents the percentage of the PCB homologous groups (1CB-10CB) (data form [43] (labels in italics) and [42]).
Pollutants 03 00002 g005
Table 1. Concentration sums (µg kg−1) of polychlorinated biphenyls (PCBs) calculated for the Robinia pseudoacacia leaf samples collected in the 37 sampling sites shown in Figure 1; Note that samples were sorted in descending order depending on the total PCB content.
Sampling Siten
PCBs
12
DL-PCB
20
NDL-PCB
32
PCB
4A1886.0013.8599.85
1E1270.709.5080.20
5E2<LOD8.408.40
4C33.191.504.69
5A14.60<LOD4.60
2B1<LOD4.004.00
2E1<LOD4.004.00
MAN13.00<LOD3.00
5C1<LOD2.902.90
1A22.67<LOD2.67
4F22.59<LOD2.59
6D12.40<LOD2.40
4B12.00<LOD2.00
3F20.751.201.95
2F11.90<LOD1.90
6A1<LOD1.701.70
6E10.94<LOD0.94
2C10.71<LOD0.71
7D10.63<LOD0.63
1B0<LOD<LOD<LOD
1C0<LOD<LOD<LOD
1D0<LOD<LOD<LOD
1F0<LOD<LOD<LOD
2D0<LOD<LOD<LOD
3A0<LOD<LOD<LOD
3B0<LOD<LOD<LOD
3C0<LOD<LOD<LOD
3D0<LOD<LOD<LOD
3E0<LOD<LOD<LOD
4D0<LOD<LOD<LOD
4E0<LOD<LOD<LOD
5D0<LOD<LOD<LOD
6B0<LOD<LOD<LOD
7B0<LOD<LOD<LOD
7C0<LOD<LOD<LOD
Arba0<LOD<LOD<LOD
CAV0<LOD<LOD<LOD
Average 5.291.736.48
Minimum 0.600.600.60
Maximum 86.0013.8599.85
n PCBs: number of PCBs detected in each sample; Σ12 DL-PCB: 12 dioxin-like PCB; Σ20 NDL-PCB: 20 non-dioxin-like PCB; Σ32 PCB: 32 PCB; LOD: limit of detection.
Disclaimer/Publisher’s Note: The statements, opinions and data contained in all publications are solely those of the individual author(s) and contributor(s) and not of MDPI and/or the editor(s). MDPI and/or the editor(s) disclaim responsibility for any injury to people or property resulting from any ideas, methods, instructions or products referred to in the content.

