
Spatiotemporal Effect of Land Use on Water Quality in a Peri-Urban Watershed in a Brazilian Metropolitan Region: An Approach Considering GEP-Based Artificial Intelligence

 , , ,
, , ,
Abstract
:1. Introduction
2. Materials and Method
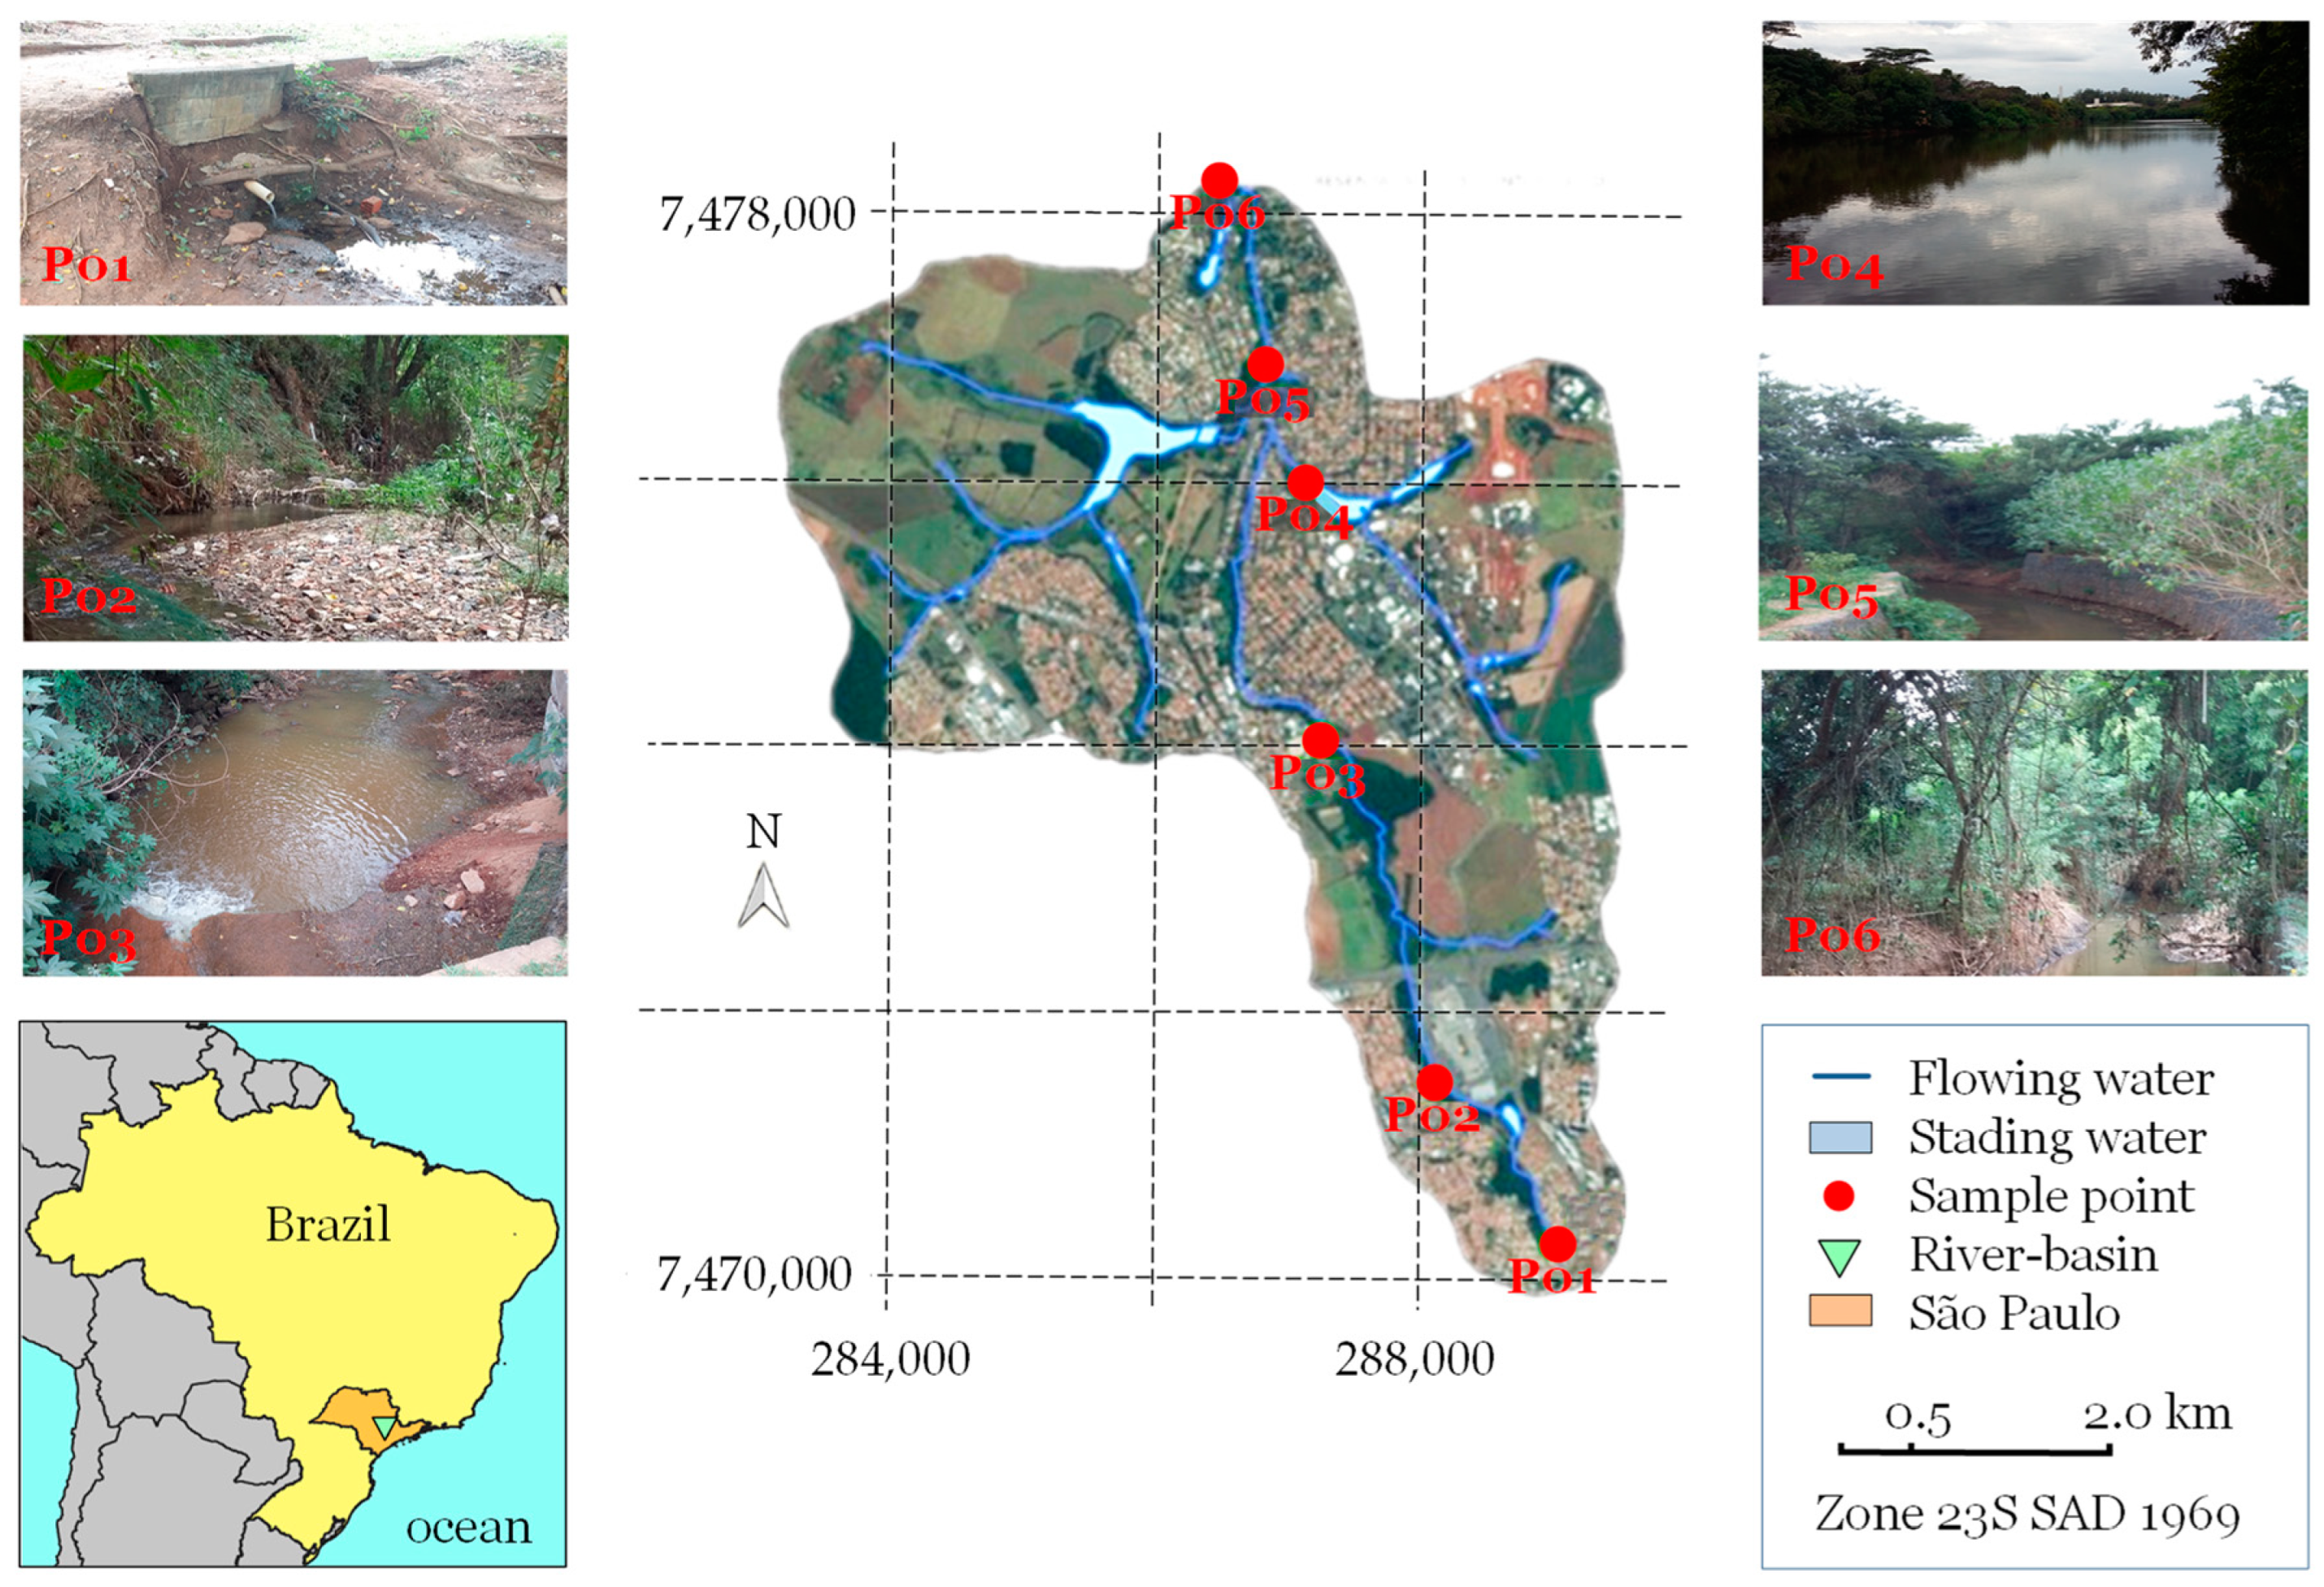
2.1. Study Area
2.2. Sampling and Experimental Analysis
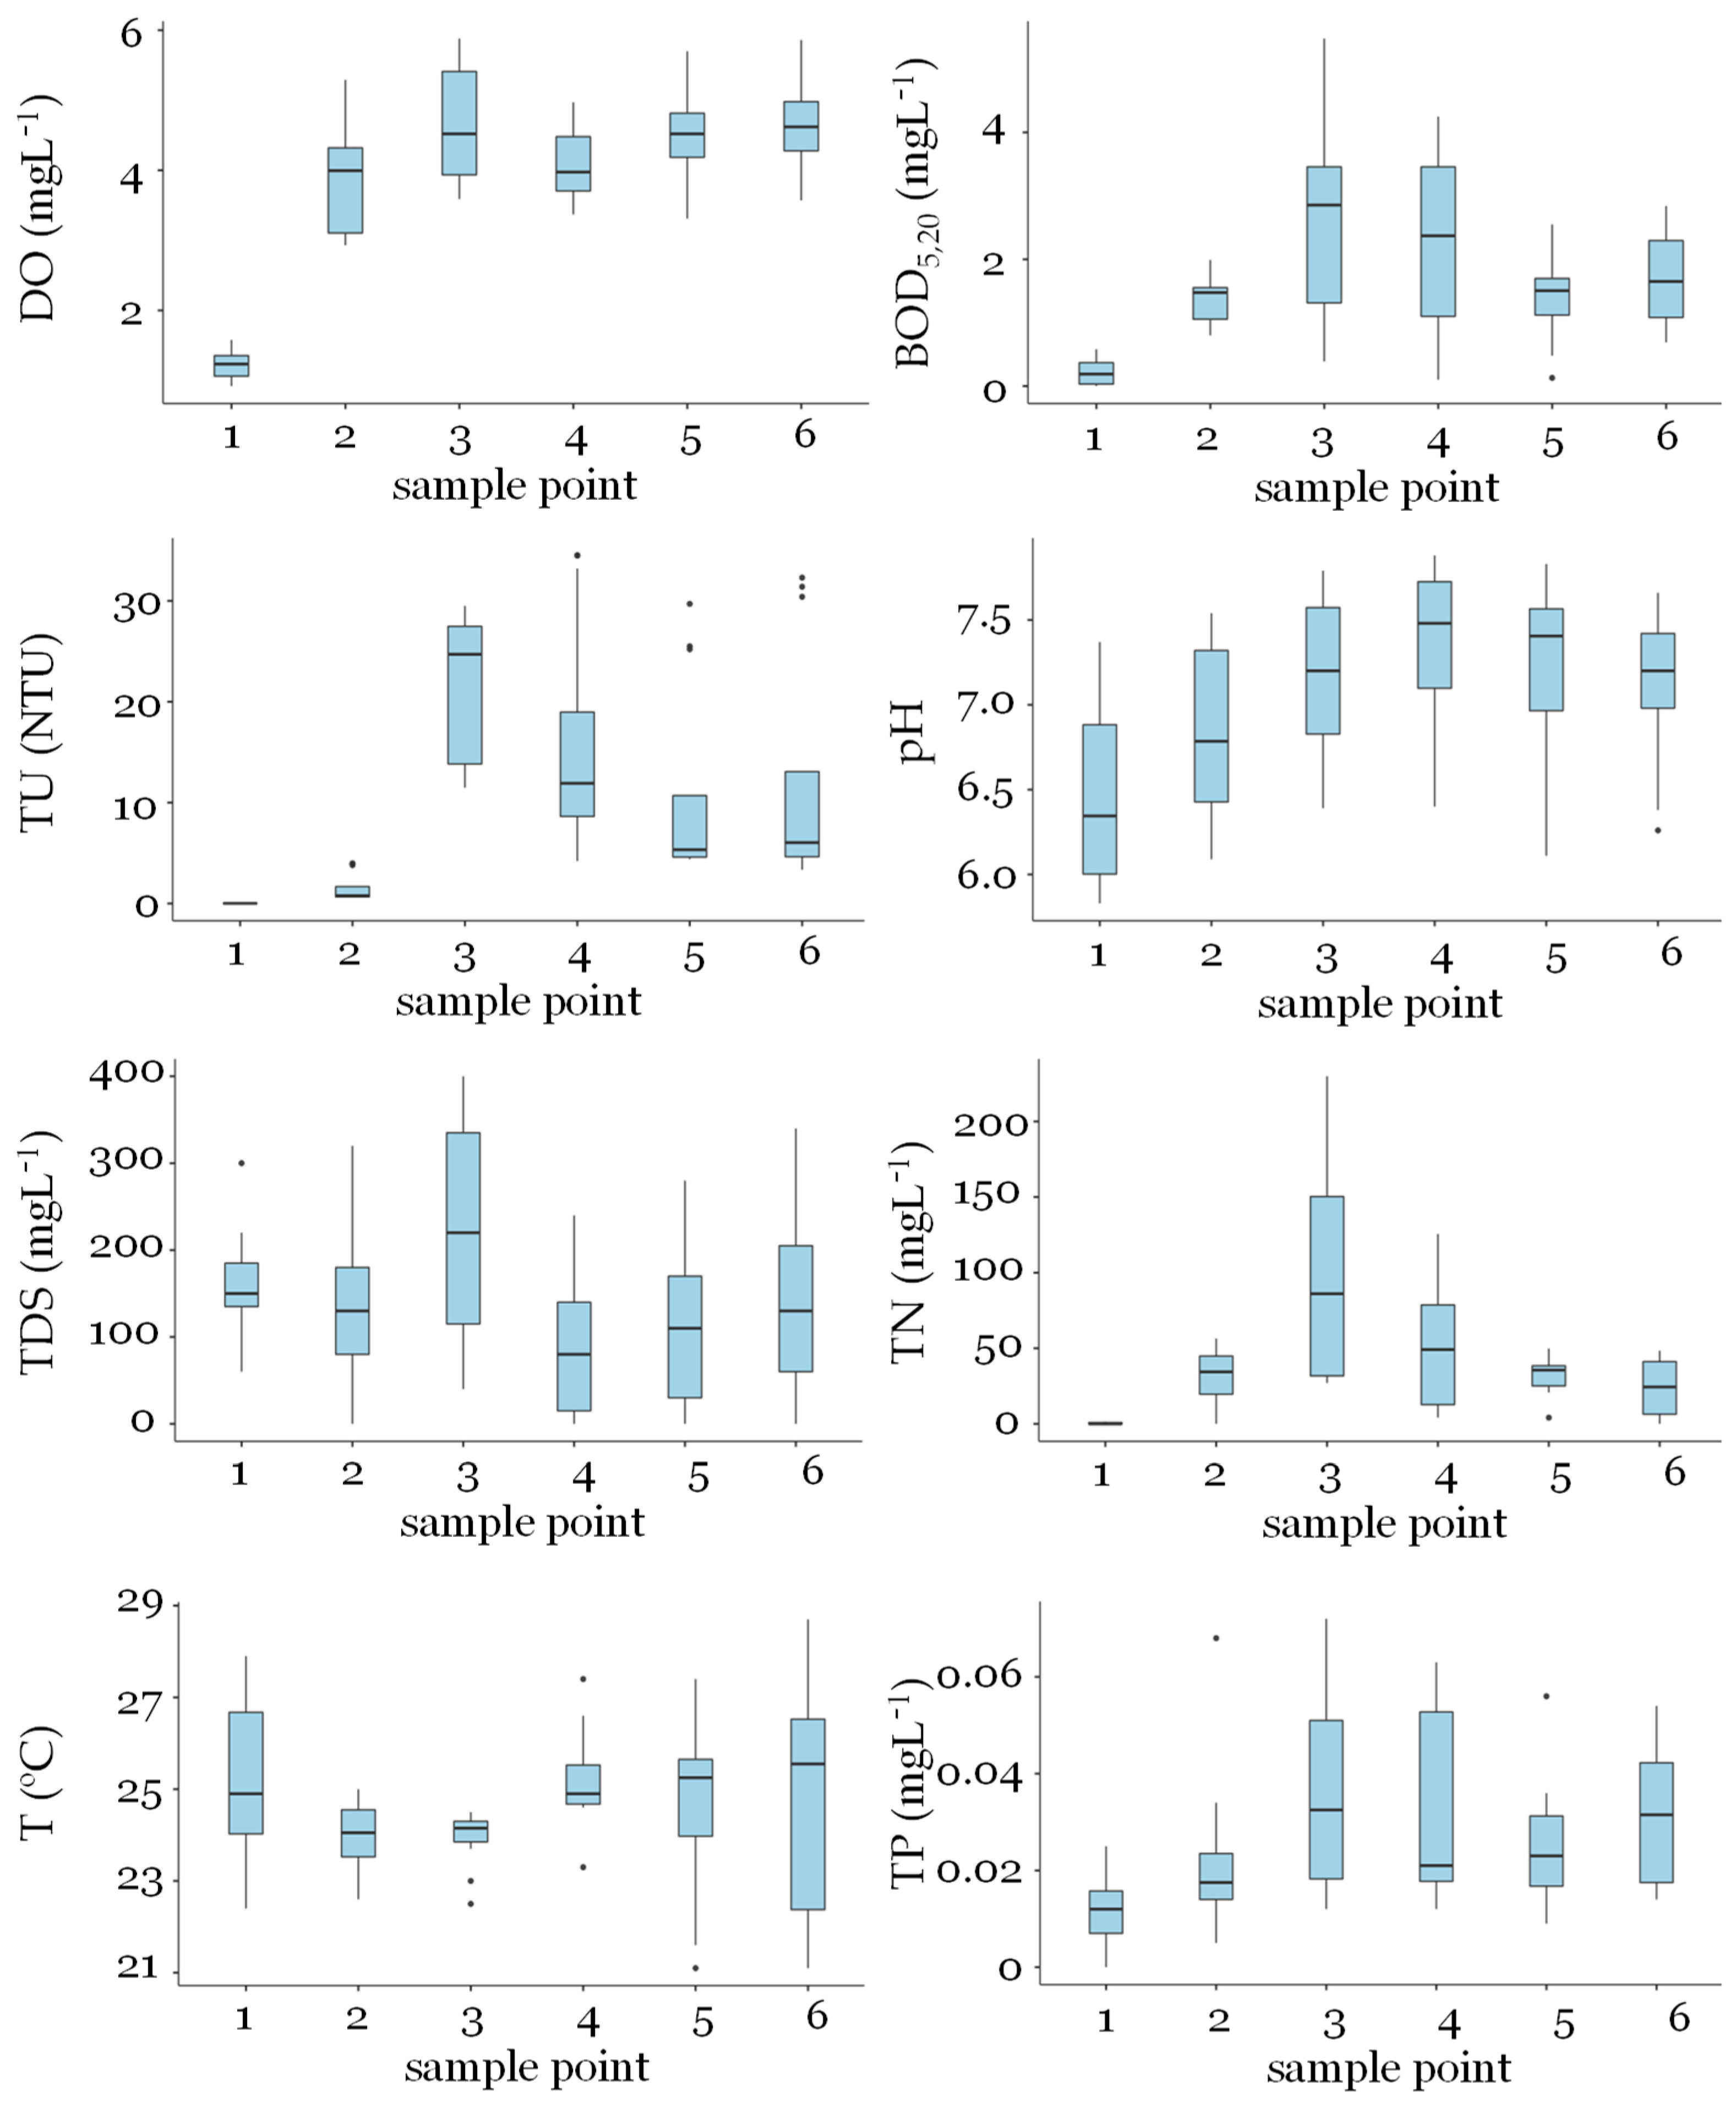
3. Results
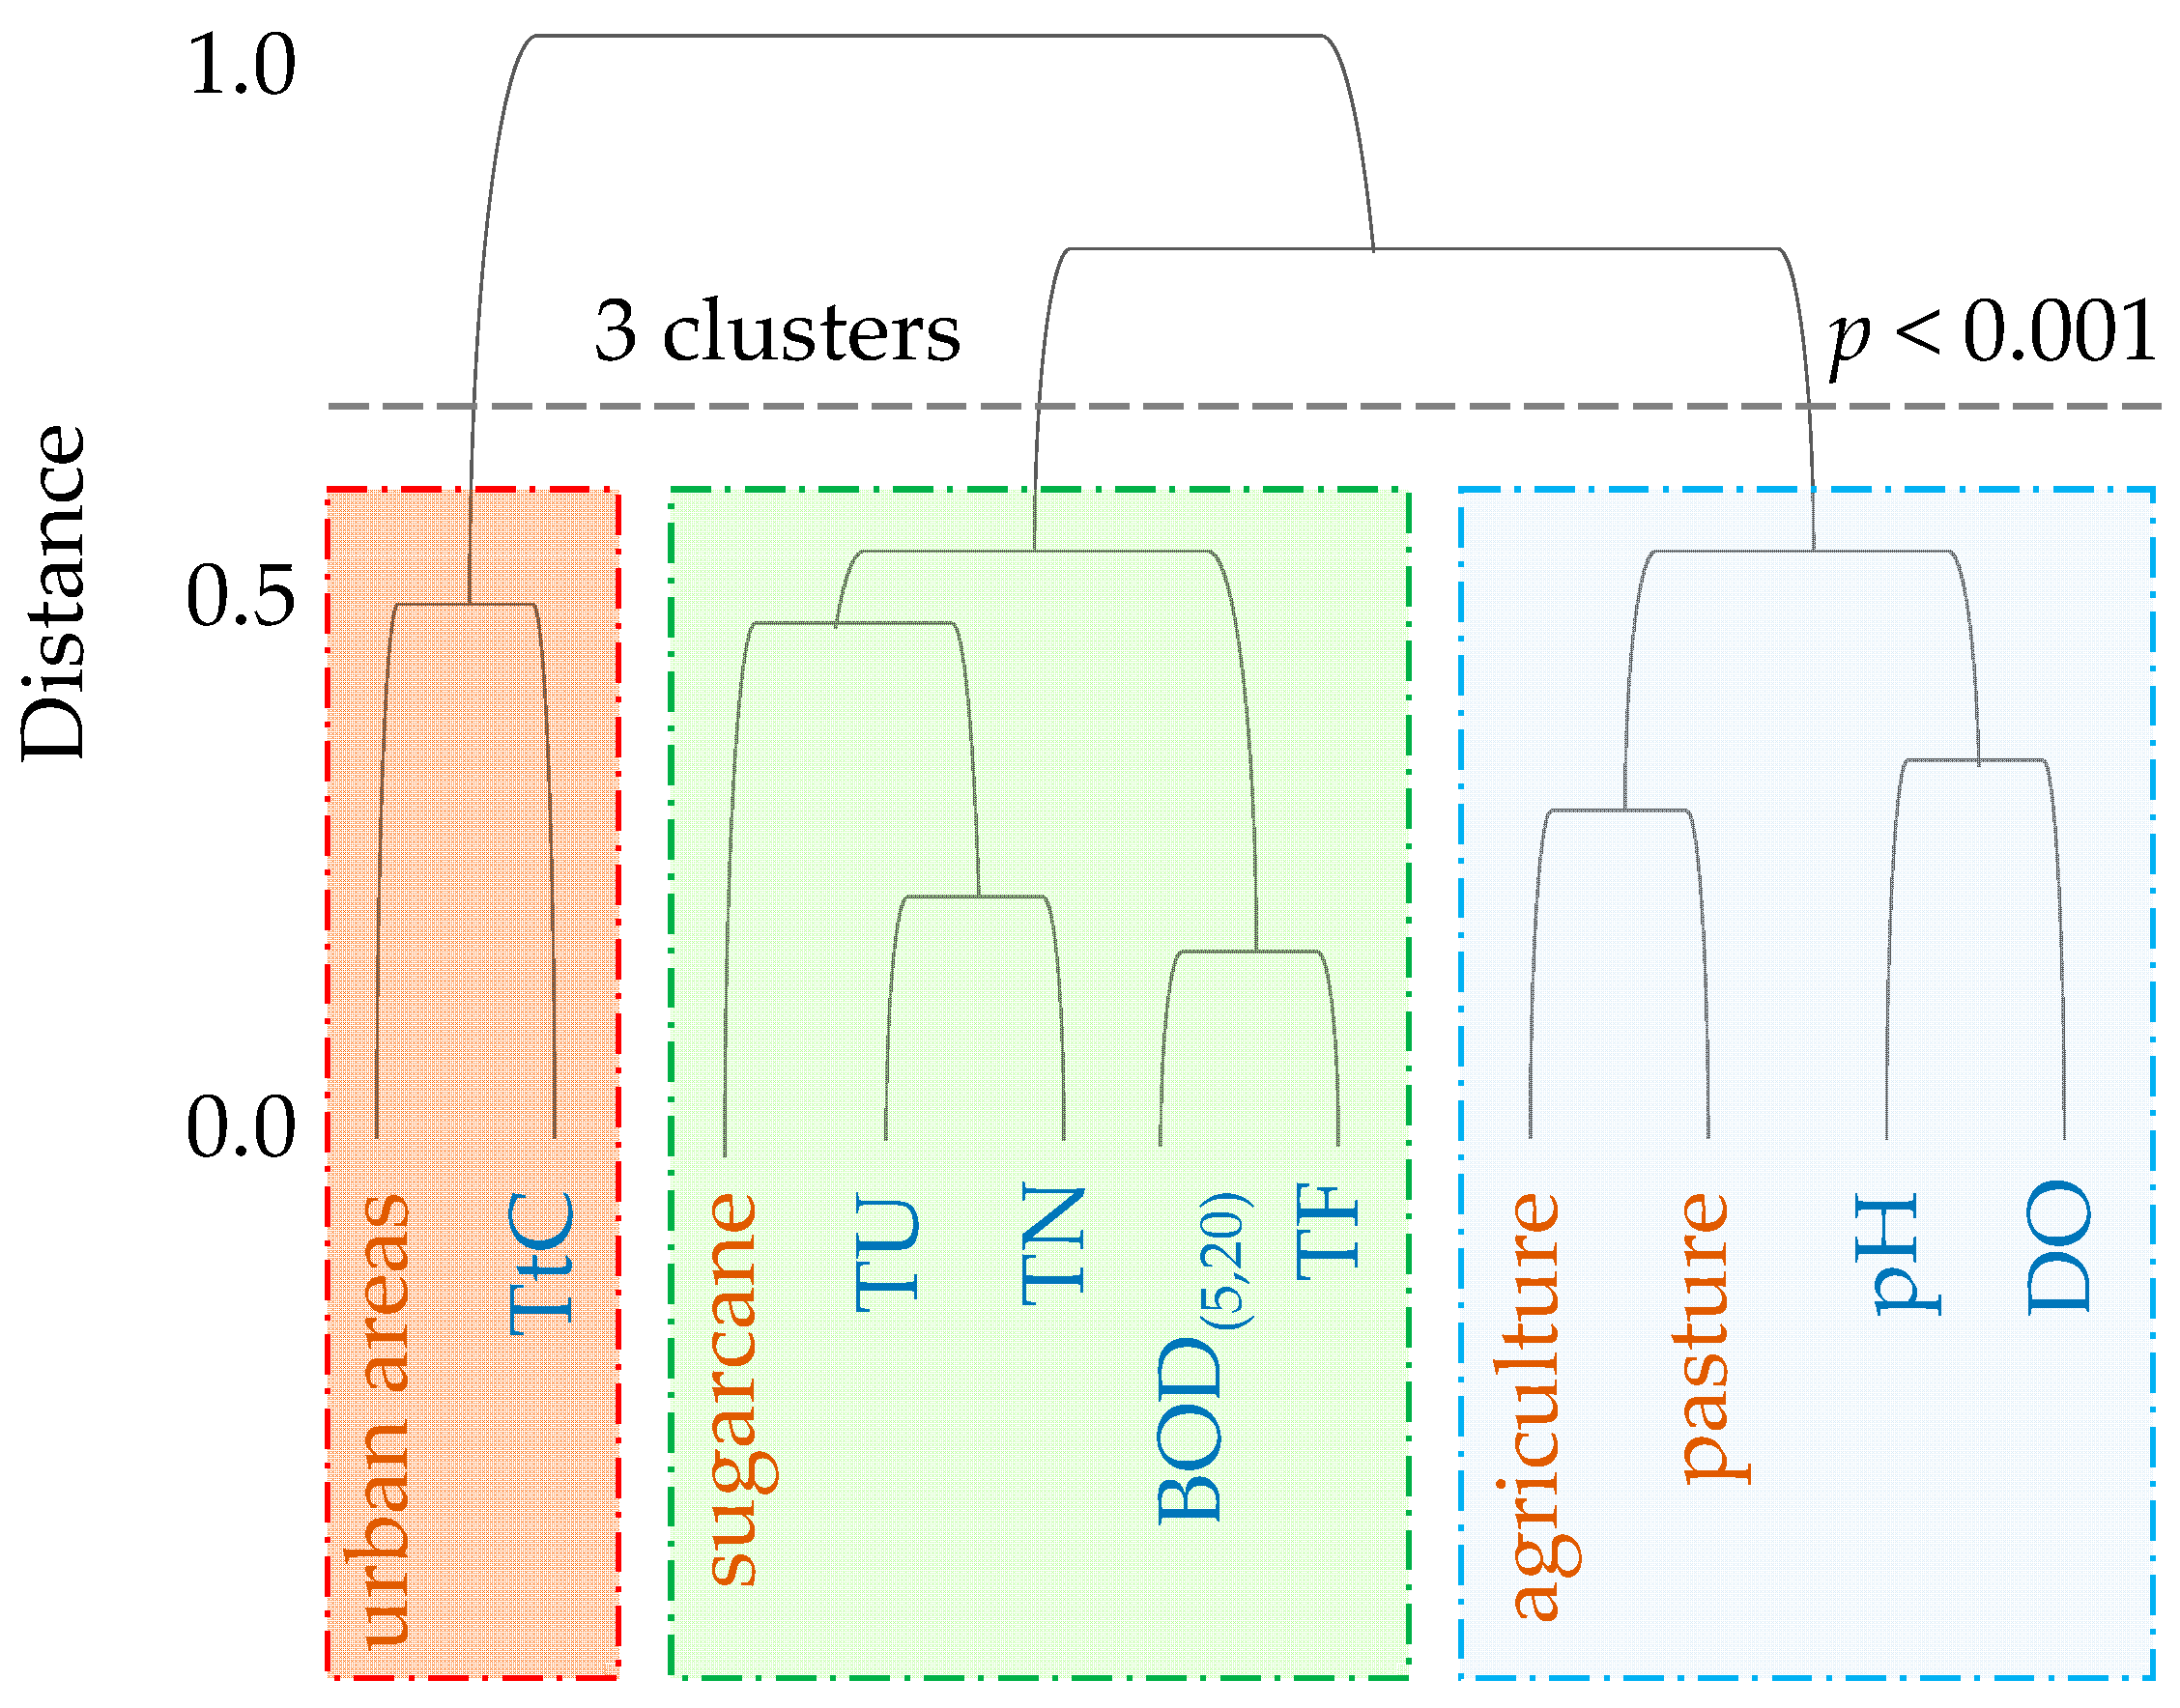
4. Discussion
5. Conclusions
Author Contributions
Funding
Institutional Review Board Statement
Informed Consent Statement
Conflicts of Interest
References
- Mello, K.; Valente, R.A.; Randhir, T.O.; dos Santos, A.C.A.; Vettorazzi, C.A. Effects of land use and land cover on water quality of low-order streams in Southeastern Brazil: Watershed versus riparian zone. Catena 2018, 167, 130–138. [Google Scholar] [CrossRef]
- Brontowiyono, W.; Asmara, A.A.; Jana, R.; Yulianto, A.; Rahmawati, S. Land-Use Impact on Water Quality of the Opak Sub-Watershed, Yogyakarta, Indonesia. Sustainability 2022, 14, 4346. [Google Scholar] [CrossRef]
- Ullah, K.A.; Jiang, J.; Wang, P. Land use impacts on surface water quality by statistical approaches. Global J. Environ. Sci. Manag. 2018, 4, 231–250. [Google Scholar]
- Mirzaei, M.; Jafari, A.; Gholamalifard, M.; Azadi, H.; Shooshtari, S.J.; Moghaddam, S.M.; Witlox, F. Mitigating environmental risks: Modeling the interaction of water quality parameters and land use cover. Land Use Policy 2020, 95, e103766. [Google Scholar] [CrossRef]
- Xu, J.; Jin, G.; Tang, H.; Mo, Y.; Wang, Y.-G.; Li, L. Response of water quality to land use and sewage outfalls in different seasons. Sci. Total Environ. 2019, 696, e134014. [Google Scholar] [CrossRef]
- Mello, K.; Taniwaki, R.H.; Paula, F.R.; Valente, R.A.; Randhir, T.O.; Macedo, D.R.; Leal, C.G.; Rodrigues, C.B.; Hughes, R.M. Multiscale land-use impacts on water quality: Assessment, planning, and future perspectives in Brazil. J. Environ. Manag. 2020, 270, e110879. [Google Scholar] [CrossRef]
- De-Carli, B.P.; Souza, J.C.; Souza, J.A.P.; Shoegima, T.F.; Barreiro, M.P.R.; Dutra, A.C.; Medeiros, G.A.; Ribeiro, A.I.; Bressane, A. Relationship Between Land Use and Water Quality in a Subtropical River Basin. J. Soc. Technol. Environ. Sci. 2019, 7, 245–261. [Google Scholar] [CrossRef]
- Bressane, A.; Ribeiro, A.I.; Medeiro, G.A. Environmental reclamation as strategy for sustainability. Veredas 2016, 13, 109–133. [Google Scholar] [CrossRef]
- Etto, T.L.; Longo, R.M.; Arruda, D.R.; Invenzioni, R.; Cereda Junior, A. Landscape ecology of the forest fragments of Stones River watershed-Campinas, São Paulo State–Campinas/SP. Rev. Árvore 2013, 37, 1063–1071. [Google Scholar] [CrossRef] [Green Version]
- Kemerich, P.D.C.; Martins, S.R.; Kobiyama, M.; Santi, A.L.; Flores, E.B.; Borba, W.F.; Fernandes, G.D.; Cherubin, M.R. Water quality originated from the superficial outflow simulated in a hydrographic bay. Ciência E Nat. 2013, 35, 136–151. [Google Scholar]
- Longo, R.M.; Reis, M.S.; Yamaguchi, C.S.; Demamboro, A.C.; Bettine, S.C.; Ribeiro, A.I.; Medeiros, G.S. Indicators of soil degradation in urban forests: Physical and chemical parameters. Trans. Ecol. Environ. 2012, 162, 497–506. [Google Scholar]
- Longo, R.M.; Zangirolami, G.F.; Yamaguchi, C.S.; Demamboro, A.C.; Bettine, S.C.; Ribeiro, A.I. Impacts of agricultural activities in remaining forest: Campinas/SP, Brazil. Trans. Ecol. Environ. 2013, 170, 15–23. [Google Scholar]
- Souza, M.M.; GastaldinI, M.C.C. Water quality assessment in watersheds with different anthropogenic impacts. Eng. Sanit. Ambient. 2014, 19, 263–274. [Google Scholar] [CrossRef] [Green Version]
- American Public Health Association. Standard Methods For the Examination of Water and Wastewater; Lipps, W.C., Baxter, T.E., Braun-Howland, E., Eds.; APHA Press: Washington, DC, USA, 2018. [Google Scholar]
- American Public Health Association. Standard Methods For the Examination of Water and Wastewater; Lipps, W.C., Baxter, T.E., Braun-Howland, E., Eds.; APHA Press: Washington, DC, USA, 2012. [Google Scholar]
- American Public Health Association. Standard Methods For the Examination of Water and Wastewater; Lipps, W.C., Baxter, T.E., Braun-Howland, E., Eds.; APHA Press: Washington, DC, USA, 2021. [Google Scholar]
- Batista, B.D.D.O.; Ferreira, D.F. Alternative to Tukey test. Sci. Agrotechnol. 2020, 44, 1–55. [Google Scholar] [CrossRef]
- Jamovi Project. Jamovi Version 2.3 [Computer Software]. 2022. Available online: https://www.jamovi.org (accessed on 1 October 2022).
- QGIS Development Team. QGIS v. 3.28.1 [Computer Software]. 2022. Available online: https://www.qgis.org (accessed on 1 October 2022).
- Sherrod, P.H. DTREG Demo Version [Computer Software]. 2022. Available online: https://www.dtreg.com (accessed on 1 October 2022).
- Garbossa, L.H.; Souza, R.V.; Campos, C.J.; Vanz, A.; Vianna, L.F.; Rupp, G.S. Thermotolerant coliform loadings to coastal areas of Santa Catarina (Brazil) evidence the effect of growing urbanisation and insufficient provision of sewerage infrastructure. Environ. Monit. Assess. 2017, 189, 27. [Google Scholar] [CrossRef] [PubMed]
- Ouma, Y.O.; Okuku, C.O.; Njau, E.N. Use of artificial neural networks and multiple linear regression model for the prediction of dissolved oxygen in rivers: Case study of hydrographic basin of River Nyando, Kenya. Complexity 2020, 2020, 9570789. [Google Scholar] [CrossRef]
- Ahmed, M.H.; Lin, L.S. Dissolved oxygen concentration predictions for running waters with different land use land cover using a quantile regression forest machine learning technique. J. Hydrol. 2021, 597, 126213. [Google Scholar] [CrossRef]
- Feng, Z.; Xu, C.; Zuo, Y.; Luo, X.; Wang, L.; Chen, H.; Liang, T. Analysis of water quality indexes and their relationships with vegetation using self-organizing map and geographically and temporally weighted regression. Environ. Res. 2023, 216, 114587. [Google Scholar] [CrossRef]
- Bajard, M.; Etienne, D.; Quinsac, S.; Dambrine, E.; Sabatier, P.; Frossard, V.; Gaillard, J.; Develle, A.L.; Poulenard, J.; Arnaud, F.; et al. Legacy of early anthropogenic effects on recent lake eutrophication (Lake Bénit, northern French Alps). Anthropocene 2018, 24, 72–87. [Google Scholar] [CrossRef]
- Garcia-Hernandez, J.A.; Brouwer, R.; Pinto, R. Estimating the Total Economic Costs of Nutrient Emission Reduction Policies to Halt Eutrophication in the Great Lakes. Water Resour. Res. 2022, 58, e2021WR030772. [Google Scholar] [CrossRef]
- Seidl, C.; Wheeler, S.A.; Zuo, A. High turbidity: Water valuation and accounting in the Murray-Darling Basin. Agric. Water Manag. 2020, 230, 105929. [Google Scholar] [CrossRef]
- Vargas-Lopez, I.A.; Kelso, W.E.; Bonvillain, C.P.; Keim, R.F.; Kaller, M.D. Influence of water quality, local knowledge and river–floodplain connectivity on commercial wild crayfish harvesting in the Atchafalaya River Basin. Fish. Manag. Ecol. 2020, 27, 417–428. [Google Scholar] [CrossRef]
- Göransson, G.; Larson, M.; Bendz, D. Variation in turbidity with precipitation and flow in a regulated river system. Hydrol. Earth Syst. Sci. 2013, 14, 2529–2542. [Google Scholar] [CrossRef] [Green Version]
- Nozaki, C.T.; Marcondes, M.A.; Lopes, A.F.; Satos, K.F.; Larizzatti, P.C. Temporal behavior of dissolved oxygen and pH in rivers and urban streams. Atas Saúde Ambient. 2014, 2, 29–44. [Google Scholar]
- Basso, l.A.; Moreira, l.G.R.; Pizzato, F. The influence of precipitation on the concentration and load of solids in urban streams: The case of the Dilúvio stream, Porto Alegre-RS. Geosul 2012, 26, 145–163. [Google Scholar] [CrossRef]
- von Sperling, M. Introduction to Water Quality and Sewage Treatment, 3rd ed.; DESA: Belo Horizonte, Brazil, 2007. [Google Scholar]
- Lima, E.B.N.R. Integrated Model for the Water Quality Management of Cuiabá River Basin. Ph.D. Thesis, UFRJ, Rio de Janeiro, Brazil, 2001. [Google Scholar]


| Parameter | Procedure | Guideline |
|---|---|---|
| TU (NTU) | 2130-B | APHA [14] |
| TtC (CFUg−1) | 9222-G | APHA [15] |
| TN (mg·L−1) | 4500-N | APHA [16] |
| BOD5,20 (mg·L−1) | 5220-B | APHA [15] |
| TDS (mg·L−1) | 2540-B | APHA [14] |
| pH (mg·L−1) | 4500-H+ | APHA [14] |
| TP (mg·L−1) | 4500-P | APHA [15] |
| Sample Point (%) | ||||||
|---|---|---|---|---|---|---|
| P01 | P02 | P03 | P04 | P05 | P06 | |
| Hydrography | - | 1.03 | 0.32 | 2.16 | 1.51 | 1.53 |
| Urban areas | 100 | 89.38 | 54.88 | 42.74 | 42.86 | 45.47 |
| Commercial forestry | - | - | - | 1.20 | 0.30 | 0.28 |
| Riparian forest | - | 2.50 | 6.90 | 0.07 | 3.90 | 4.52 |
| Mixed vegetation | - | 7.09 | 9.91 | 9.15 | 7.07 | 6.55 |
| Sugarcane | - | - | 24.94 | 16.08 | 18.05 | 16.73 |
| Diversified agriculture | - | - | - | - | 4.77 | 4.42 |
| Pasture | - | - | - | 28.60 | 20.07 | 19.15 |
| TtC (CFU·g−1) | DO (mg·L−1) | BOD(5,20) (mg·L−1) | T (°C) | TU (NTU) | pH | TP (mg·L−1) | TDS (mg·L−1) | TN (mg·L−1) | |
|---|---|---|---|---|---|---|---|---|---|
| Urban areas | 0.816 ** | −0.718 *** | −0.734 *** | −0.029 | −0.547 *** | −0.448 *** | −0.377 ** | 0.091 | −0.289 * |
| Com. forestry | 0.204 | 0.215 | 0.237 * | 0.190 | 0.259 * | 0.304 ** | 0.164 | −0.266 * | 0.025 |
| Rip. forestry | 0.294 * | 0.611 *** | 0.600 *** | −0.235 * | 0.394 *** | 0.186 | 0.294 * | 0.240 * | 0.448 *** |
| Mix. vegetation | 0.416 *** | 0.799 *** | 0.800 *** | −0.140 | 0.536 *** | 0.422 *** | 0.416 *** | −0.004 | 0.529 *** |
| Sugarcane | 0.395 *** | 0.667 *** | 0.675 *** | −0.046 | 0.646 *** | 0.389 *** | 0.395 *** | 0.092 | 0.490 *** |
| Div. agriculture | 0.138 | 0.387 *** | 0.398 *** | 0.030 | 0.068 | 0.156 | 0 0.094 | −0.101 | −0.178 |
| Pasture | 0.246 * | 0.384 *** | 0.410 *** | 0.179 | 0.259 * | 0.343 ** | 0.191 | −0.281 * | −0.071 |
| Sampling Points | |||||||
|---|---|---|---|---|---|---|---|
| P01 | P02 | P03 | P04 | P05 | P06 | ||
| T (°C) | T01 | 23.07 bC | 23.83 aBC | 24.30 aBC | 24.70 aBC | 25.57 aB | 27.50 aA |
| T02 | 26.20 aA | 23.30 aB | 23.33 aB | 25.10 aAB | 25.97 aA | 24.13 bB | |
| T03 | 26.53 aA | 24.10 aB | 24.23 aB | 26.33 aA | 25.10 aAB | 26.20 aA | |
| T04 | 24.73 abA | 24.63 aA | 23.83 aA | 24.73 aA | 21.50 bB | 21.27 cB | |
| DO (mg·L−1) | T01 | 1.44 aC | 3.42 bcB | 4.54 bA | 4.42 abA | 4.65 cAB | 3.93 bAB |
| T02 | 1.05 aC | 4.79 aA | 4.53 bAB | 3.78 bcB | 4.57 bAB | 4.52 bAB | |
| T03 | 1.07 aD | 3.00 cC | 3.98 bAB | 3.51 cBC | 4.42 cbAB | 4.62 bA | |
| T04 | 1.39 aD | 4.15 abC | 5.68 aA | 4.68 aBC | 5.47 aAB | 5.55 aAB | |
| BOD (mg·L−1) | T01 | 0.50 aC | 1.49 aBC | 4.40 aA | 3.95 aA | 2.17 aB | 2.25 abB |
| T02 | 0.21 aB | 1.52 aA | 1.65 cA | 1.59 bA | 1.37 abA | 2.49 aA | |
| T03 | 0.15 aD | 1.54 aB | 3.32 bA | 3.11 aA | 1.31 abB | 1.33 bcB | |
| T04 | 0.02 aA | 0.97 aA | 0.94 cA | 0.65 bA | 0.73 bA | 0.88 cA | |
| TDS (mg·L−1) | T01 | 133.33 aC | 180.00 aC | 386.67 aA | 206.67 aBC | 233.33 aBC | 313.33 aAB |
| T02 | 226.27 aAB | 151.33 aAB | 266.67 bA | 126.67 abB | 126.67 abB | 166.67 bAB | |
| T03 | 133.33 aA | 120.00 aA | 153.33 cA | 26.67 bcA | 86.67 bcA | 100.00 bcA | |
| T04 | 146.67 aA | 73.33 aAB | 66.67 cAB | 6.67 cB | 0.00 cB | 0.00 cB | |
| TU (NTU) | T01 | 0.02 aC | 0.66 aC | 11.64 cA | 13.77 bA | 4.77 bB | 4.86 aBC |
| T02 | 0.02 aD | 3.91 aC | 24.35 abB | 34.40 aA | 26.80 aB | 31.37 aA | |
| T03 | 0.02 aD | 0.66 aD | 26.83 aA | 10.49 bB | 5.76 bC | 6.83 bBC | |
| T04 | 0.02 aB | 0.93 aB | 21.66 bA | 4.22 cB | 4.43 bB | 4.53 bB | |
| pH | T01 | 6.04 bC | 6.86 bB | 7.51 aA | 7.71 aA | 7.61 aA | 7.27 aAB |
| T02 | 6.09 bB | 6.82 bcA | 7.08 aA | 7.37 aA | 7.26 aA | 7.19 aA | |
| T03 | 6.72 aA | 6.30 cA | 6.41 bA | 6.19 bA | 6.23 bA | 6.35 bA | |
| T04 | 7.11 aA | 7.42 aA | 7.58 aA | 7.71 aA | 7.59 aA | 7.65 aA | |
| TN (mg·L−1) | T01 | 0.54 aB | 15.62 aB | 89.22 bA | 11.45 bB | 22.71 aB | 24.93 abB |
| T02 | 0.43 aA | 17.32 aA | 30.17 cA | 15.09 bA | 30.49 aA | 19.75 abA | |
| T03 | 0.27 aD | 44.13 aC | 227.95 aA | 91.76 aB | 39.06 aC | 7.95 bCD | |
| T04 | 0.00 aC | 49.33 aAB | 82.71 bA | 79.86 aA | 36.52 aBC | 44.94 aAB | |
| TtC | DO | BOD5,20 | TDS | TU | TN | |
|---|---|---|---|---|---|---|
| Urban areas | 82.1 | 52.2 | --- | 4.2 | --- | --- |
| Commercial forestry | 8.6 | 3.33 | --- | --- | --- | 13.4 |
| Riparian forest | 50.4 | 62.49 | 50.7 | 69.0 | 82.2 | 60.2 |
| Mixed vegetation | 41.0 | 34.19 | 49.3 | 31.0 | 17.8 | 26.4 |
| Sugarcane | 17.9 | 15.6 | 75.3 | 95.8 | 90.9 | 60.1 |
| Diversified agriculture | --- | 17.2 | 12.3 | --- | 7.9 | 39.9 |
| Pasture | --- | 14.9 | 12.4 | --- | 1.2 | --- |
Disclaimer/Publisher’s Note: The statements, opinions and data contained in all publications are solely those of the individual author(s) and contributor(s) and not of MDPI and/or the editor(s). MDPI and/or the editor(s) disclaim responsibility for any injury to people or property resulting from any ideas, methods, instructions or products referred to in the content. |
© 2022 by the authors. Licensee MDPI, Basel, Switzerland. This article is an open access article distributed under the terms and conditions of the Creative Commons Attribution (CC BY) license (https://creativecommons.org/licenses/by/4.0/).
Share and Cite
Bressane, A.; Loureiro, A.I.S.; Gomes, R.C.; Ribeiro, A.I.; Longo, R.M.; Negri, R.G. Spatiotemporal Effect of Land Use on Water Quality in a Peri-Urban Watershed in a Brazilian Metropolitan Region: An Approach Considering GEP-Based Artificial Intelligence. Pollutants 2023, 3, 1-11. https://doi.org/10.3390/pollutants3010001
Bressane A, Loureiro AIS, Gomes RC, Ribeiro AI, Longo RM, Negri RG. Spatiotemporal Effect of Land Use on Water Quality in a Peri-Urban Watershed in a Brazilian Metropolitan Region: An Approach Considering GEP-Based Artificial Intelligence. Pollutants. 2023; 3(1):1-11. https://doi.org/10.3390/pollutants3010001
Chicago/Turabian StyleBressane, Adriano, Anna Isabel Silva Loureiro, Raissa Caroline Gomes, Admilson Irio Ribeiro, Regina Marcia Longo, and Rogério Galante Negri. 2023. "Spatiotemporal Effect of Land Use on Water Quality in a Peri-Urban Watershed in a Brazilian Metropolitan Region: An Approach Considering GEP-Based Artificial Intelligence" Pollutants 3, no. 1: 1-11. https://doi.org/10.3390/pollutants3010001