1. Introduction
Radioactive waste storage at great depths is likely to produce gas, mainly di-hydrogen, due to water radiolysis and corrosion. This will lead to gas transport through storage structures, such as concrete tunnels, or surrounding rocks—often clay rocks. This is why numerous studies were conducted by ONDRAF/NIRAS (in Belgium) or Andra (in France) in order to characterize the gas transfer properties of dry or partially saturated concrete or of its host rock. Gas-permeability tests are often carried out with a significant pressure gradient, i.e., with quite a high injection pressure—a few MPa, for example. It must be nevertheless mentioned that the gas pressure would slowly increase in the storage structure at the beginning of its production. As a consequence, and for the purpose of further simulations, it seems important to take this phase into account and to measure the respective role of permeation and diffusion in the gas-transfer process. Diffusion, which occurs when there is a gas concentration gradient, has in fact to be taken into account during the low-gas-pressure phase. Hence, the scope of the present experimental study was to design a gas-diffusion device and to evaluate the effective diffusion coefficient of the concrete intended to be used by ONDRAF/NIRAS (Organisme national des déchets radioactifs et des matières fissiles enrichies—in Belgium) for its storage tunnels. This measurement, conducted alongside ‘traditional’ permeability tests, demonstrates that a large proportion of gas transport may be occurring due to diffusion under a very low pressure injection.
2. Material and Sample Preparation
Concrete cylinders (around 140 mm diameter) cored from tunnel voussoirs of the HADES URL (the Belgian Underground research laboratory) were provided by ONDRAF/NIRAS. They were then re-cored into small rectified cylinders with a diameter of 65 mm and height of 50 mm. Such a height was considered to be enough for permeability and diffusion measurements, as it is more than three times the maximum aggregate size (14 mm). The concrete composition as provided by ONDRAF/NIRAS is presented in
Table 1 below.
Four samples were prepared, and their porosity was measured with the classical vacuum and weighing techniques [
1]. The samples were dried at a temperature of 105 °C until the mass was constant. The results gave a mean porosity of 12.5%.
3. Experimental Setup and Experimental Conditions
Two different setups were used: one for permeability measurements and one for gas diffusion. Gas-permeability measurements are quite usual in our lab, and they did not require any new design. This was not the case with diffusion tests, which required the performance of a new design.
3.1. Gas Permeability
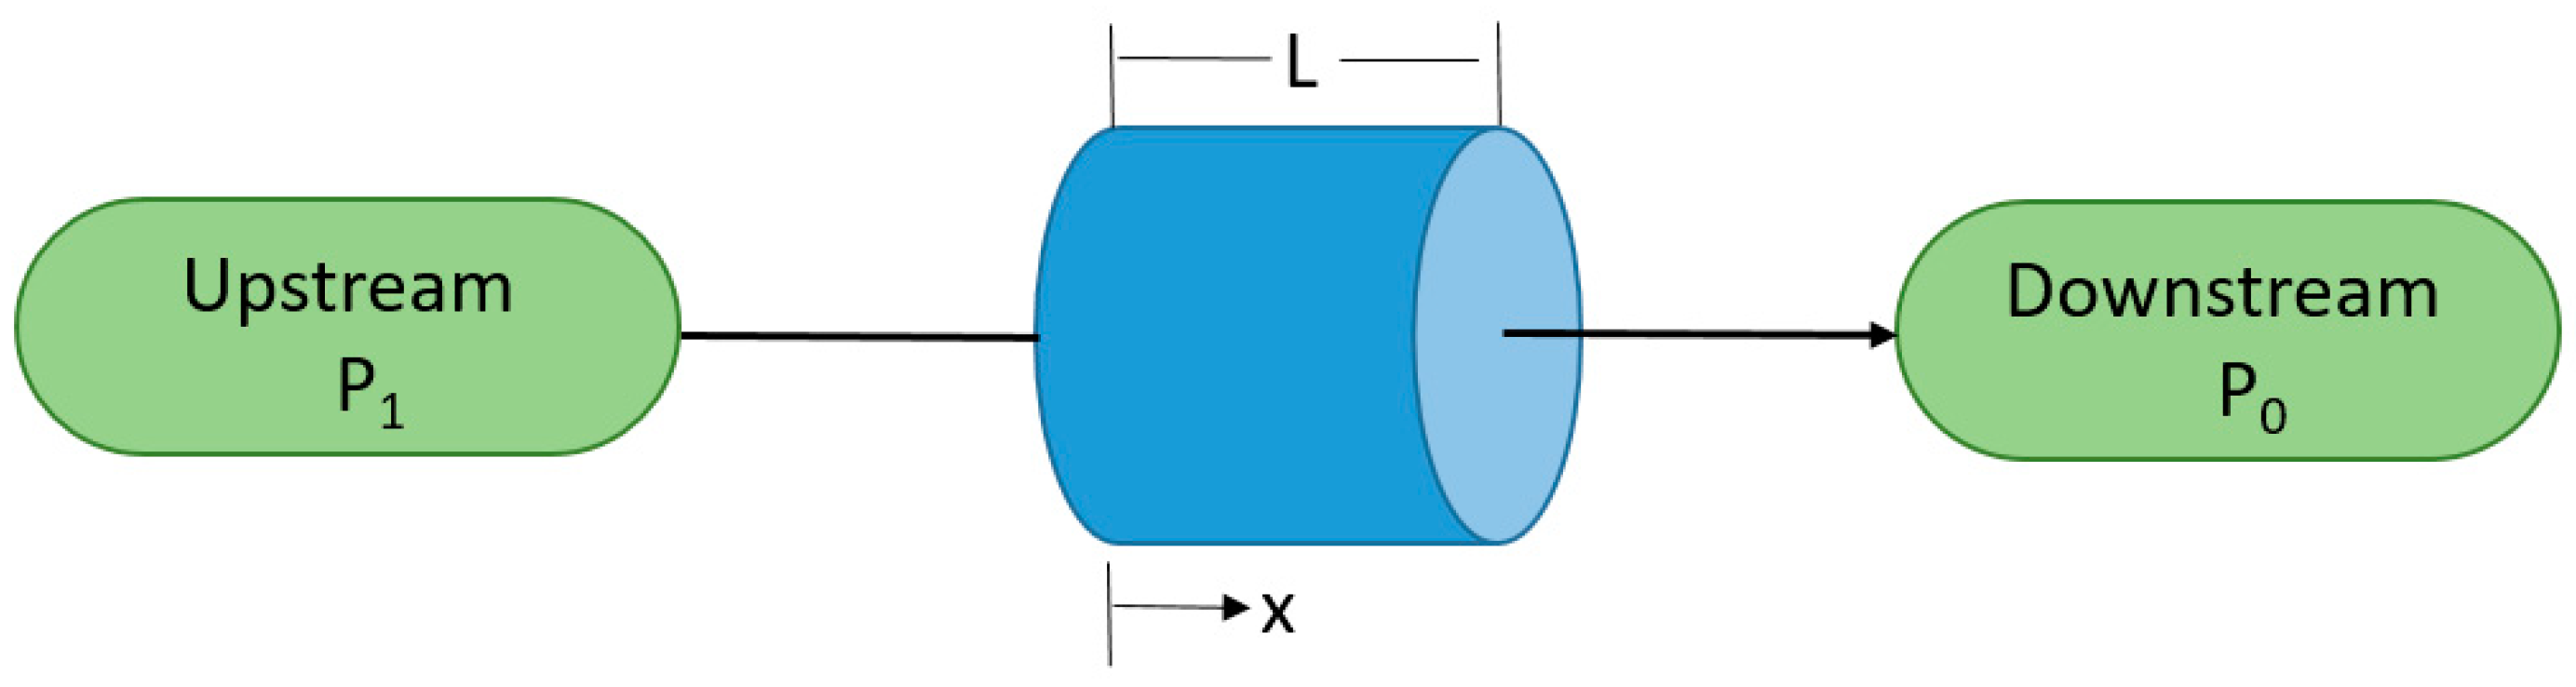
Most of the tests performed in the laboratory are 1D-flow-type tests on cylindrical samples (
Figure 1). The gas pressure is P
1 at the upstream sample side and P
0 at the downstream side. Using Darcy’s law and steady flow [
2], we obtain:
Q
1 is the volumetric gas flowrate at the upstream sample side [
2]:
K
app is the apparent gas permeability (apparent due to a potential Klinkenberg effect—see further), A is the sample cross-section, L is the sample length, and μ is the gas viscosity.
The flowrate Q
1 has to be measured to find the apparent gas permeability. Different methods can be used for this purpose: direct measurement with flowmeters (for example Brooks or Bronkhorst) or a measurement based on small pressure variation techniques (often used to calibrate the usual mass flowmeters). This second method was specially developed in our laboratory for materials with a very low permeability.
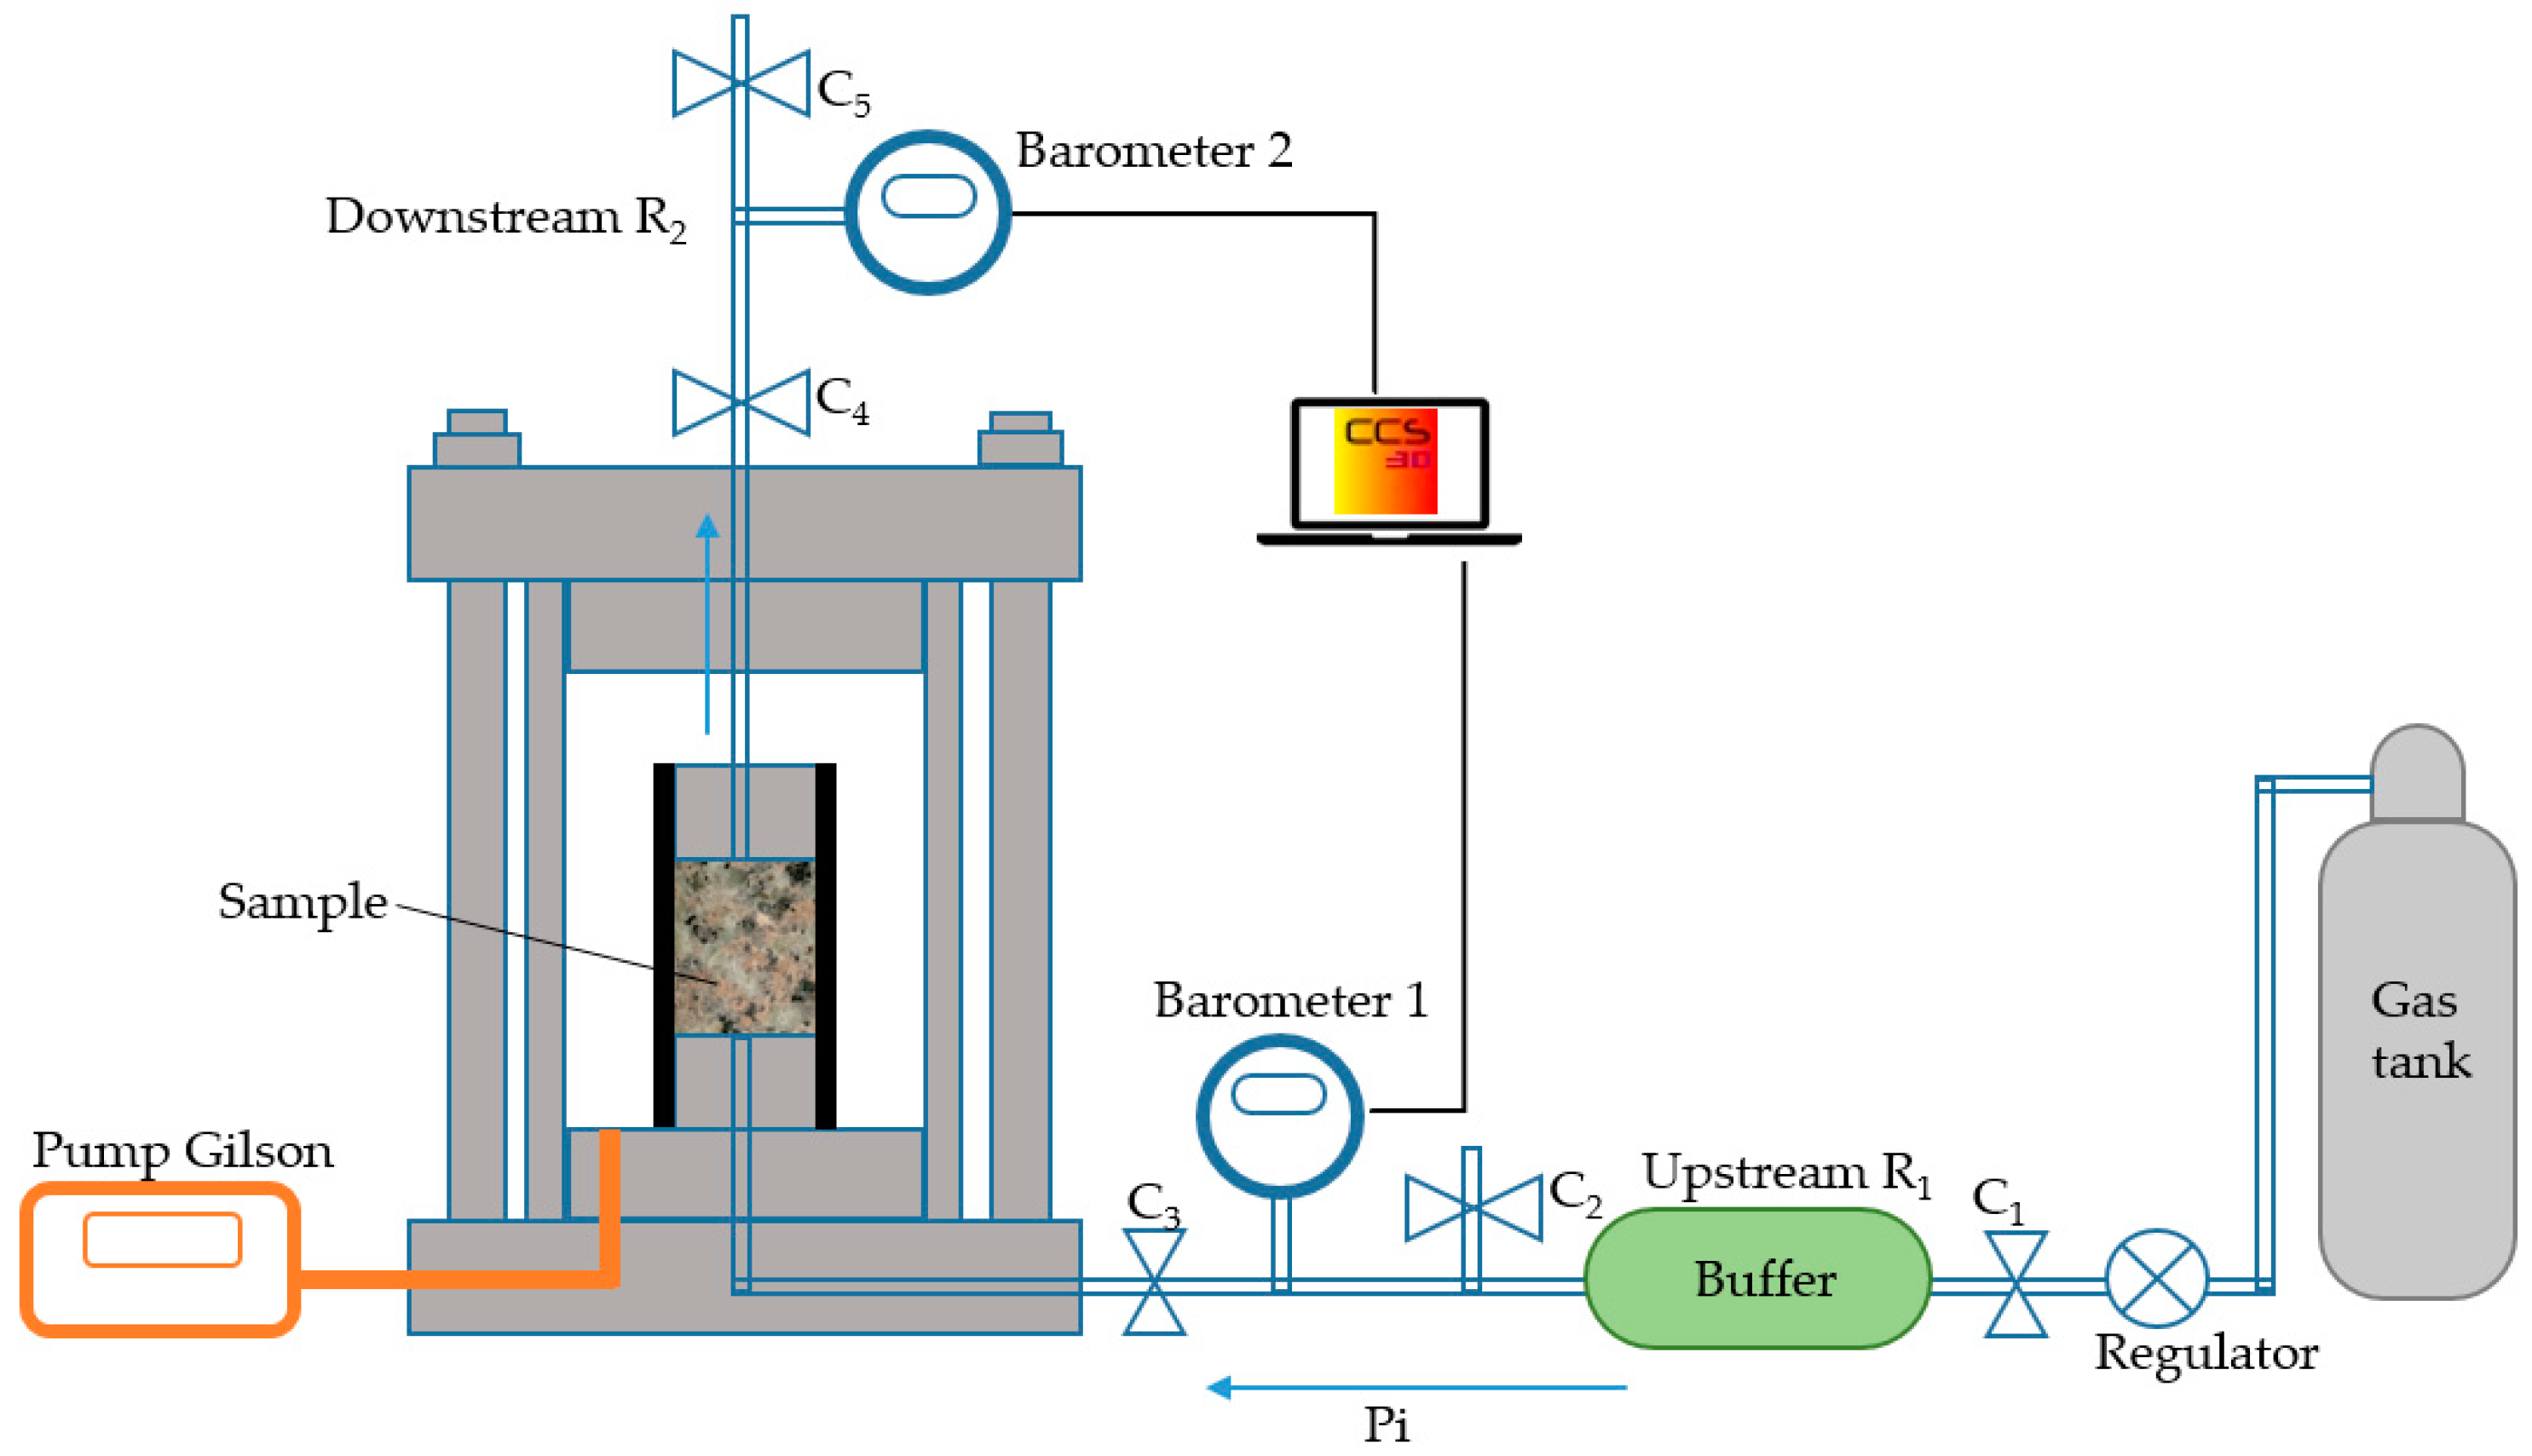
Figure 2 presents a scheme of the system designed and used for this purpose.
The device is composed of a buffer reservoir R
1 and a tube reservoir R
2, respectively, connected at the upstream and downstream sample sides. The gas is first injected from a big gas tank at constant pressure P
1 (or P
i). The valve C
1 is closed as soon as a steady flow is assumed and R
1 is now feeding the sample with gas. The first possibility is then to measure the incoming flow rate Q
1. It is in fact the mean flowrate Q
1mean during a time Δt for which there is a decrease ΔP
1 of pressure P
1. Assuming that there is a steady flow during Δt at a mean injection pressure P
1mean = P
1 − ΔP
i/2, it can be easily shown [
3] that:
The apparent permeability Kapp can then be deduced from relation 2 in which P1 = P1mean and Q1 = Q1mean. This method is called the quasi-steady flow method at high pressure because it is applied at the upstream sample side. Experiments were also conducted in the laboratory with electronic mass flowmeters when it was possible. They provided results that were compared to those given upstream by the quasi-steady method. The same results were virtually obtained with a difference in permeability of often less than 1%, as long as the ΔP1 decrease did not exceed 5% of P1.
V1 is the volume of the R1 reservoir, which includes the tubing volume between R1 and the sample. This volume is obtained with an accurate calibration.
3.2. Diffusion Test—Principle of the Method
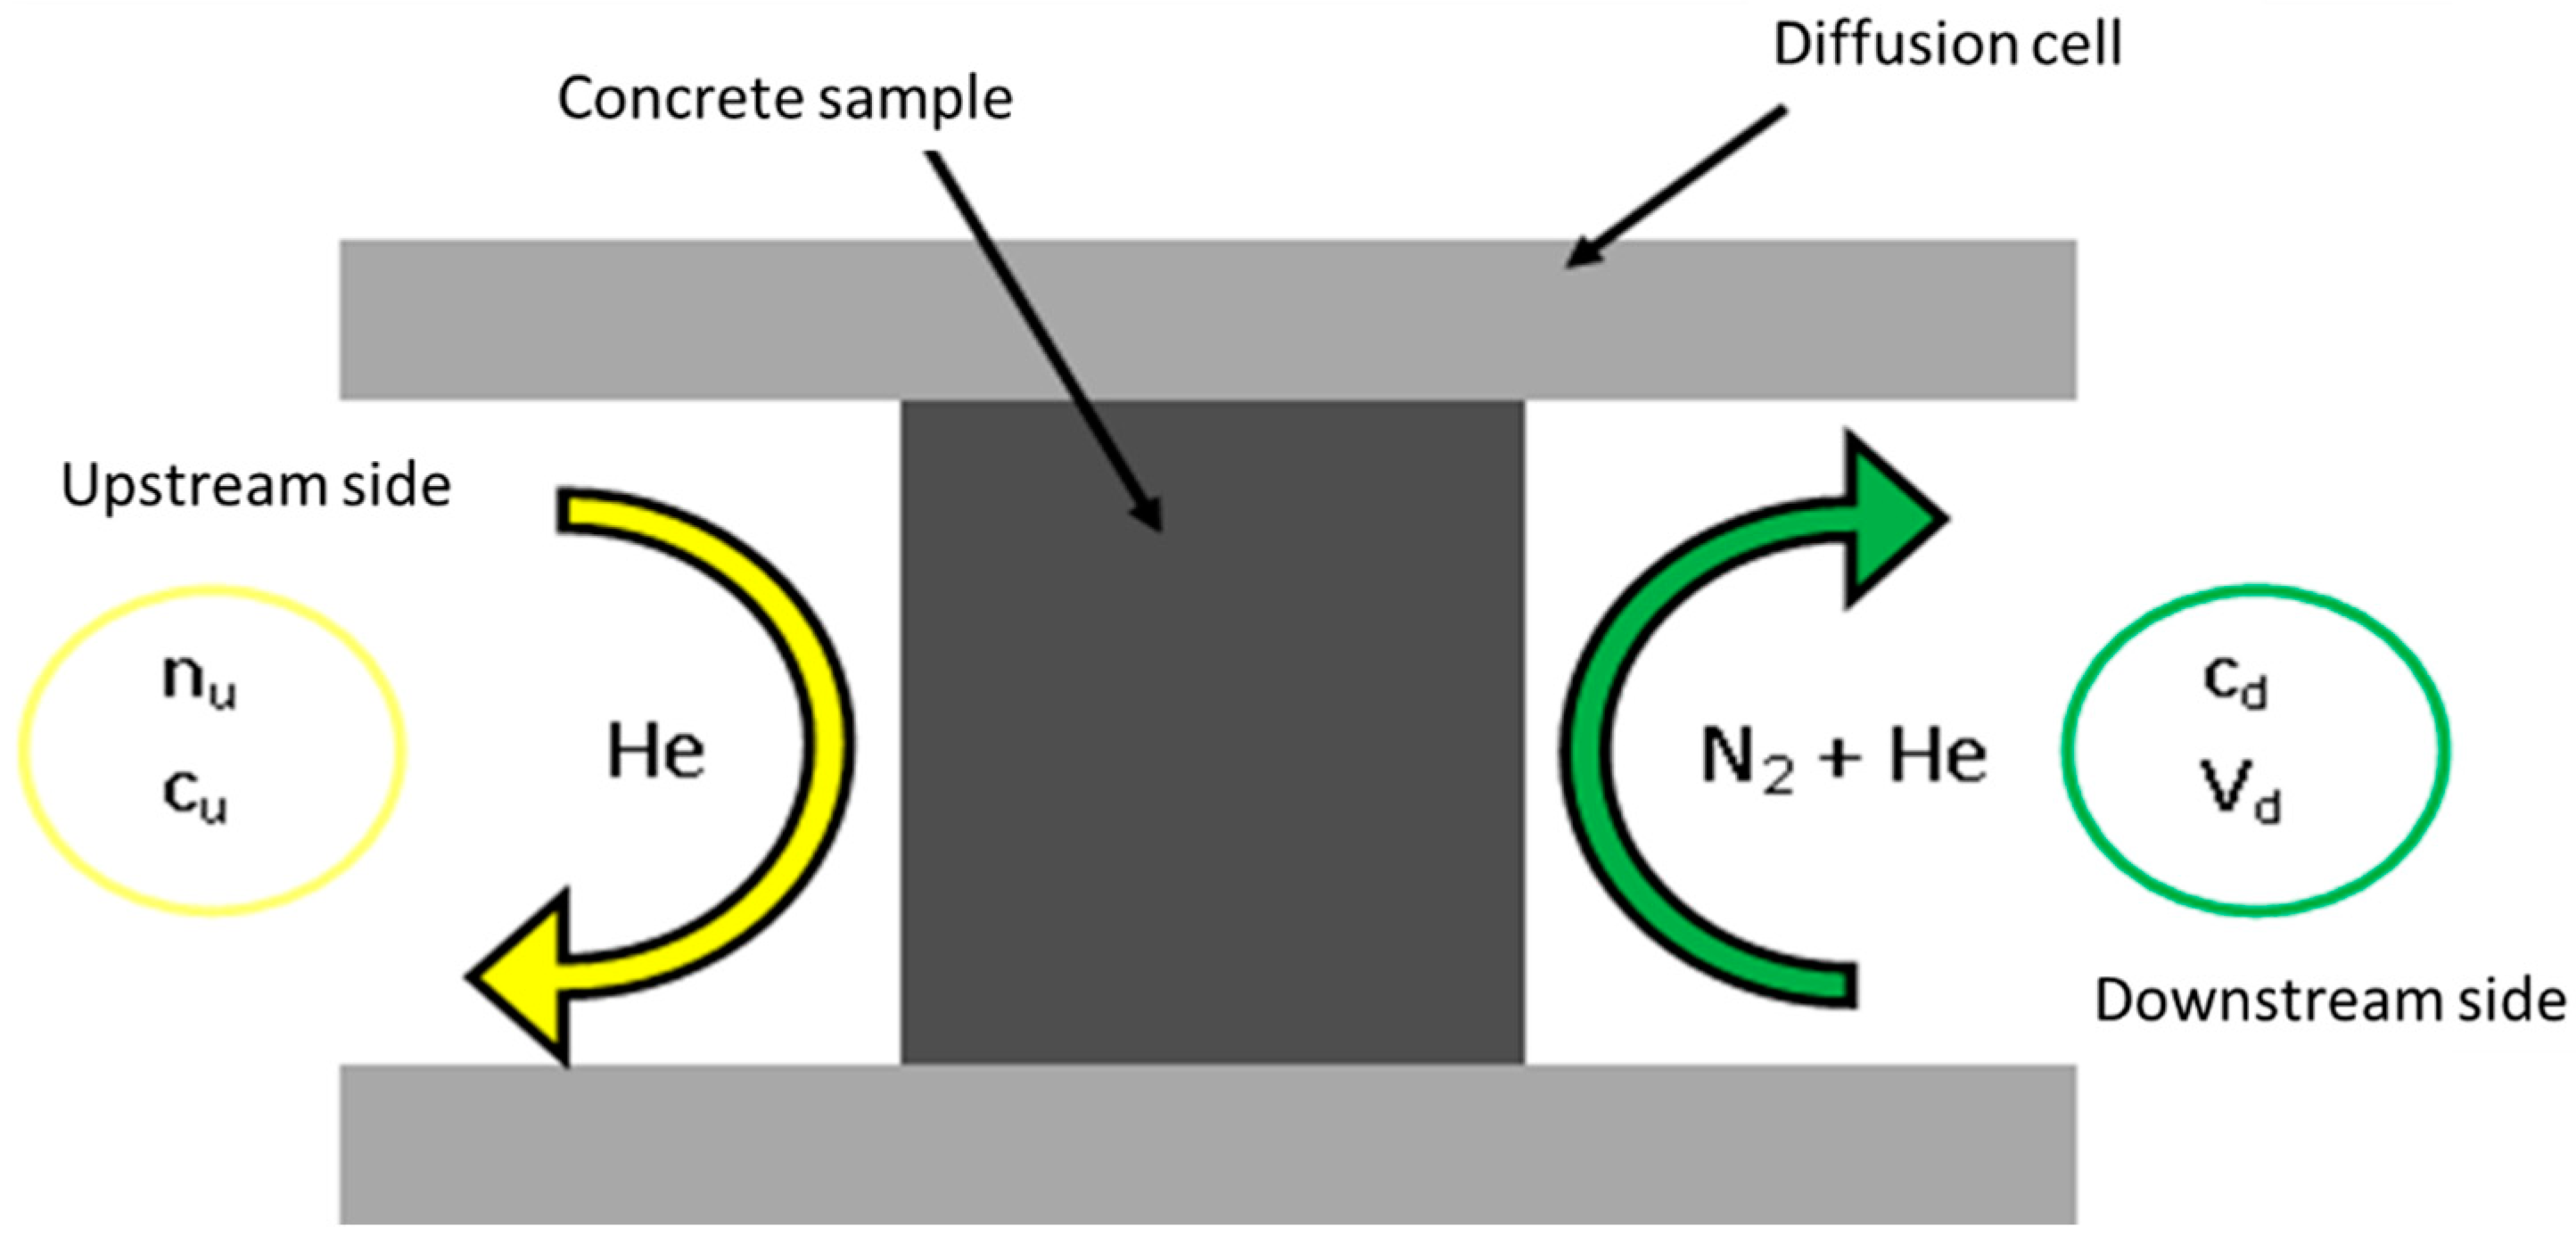
This test has been newly designed in our laboratory in order to induce gas transport through a concentration difference at atmospheric pressure on both sample sides. As the use of a gas spectrometer has caused some calibration difficulties, we chose to use a simpler gas analyzer with a 500 ppm resolution. This apparatus was calibrated to detect helium into nitrogen, and it can work in a closed circuit. This means that helium will diffuse into a reservoir containing nitrogen (initially 100% nitrogen) and that the apparatus will analyze a small proportion of the mix (nitrogen + helium) and re-inject this proportion into the reservoir after analysis. The principle of this test is indicated in
Figure 3. There is a continuous pure helium flow at the upstream side. This implies that the helium concentration is constant at this side despite nitrogen diffusion.
The device designed for diffusion tests is presented in the picture in
Figure 4. The balancing device at Patm is realized by dip tubes whose height (into oil to avoid evaporation) can be adjusted. This allows for a pressure regulation with an accuracy that is better than one millibar. The percentage of helium at the downstream side is periodically measured by the gas analyzer.
3.3. Hypotheses and Test Analysis
By using some hypotheses, it is supposed that the diffusion process is controlled by the first Fick’s law (1856), which, with a 1D geometry, gives:
Jx is the molar surface flow in mol·s−1·m−2;
D is the effective diffusion coefficient in m2·s−1;
c is the gas concentration in mol·m−3.
The goal is then to measure J through the sample to obtain D under known or measured concentrations at the upstream and downstream sample sides. To be applied, Equation (3) needs a knowledge of the concentration ‘c(x,t)’ through the sample, which evolves with time. Under a constant molar flow Jx, the downstream concentration increases linearly with time. At this stage, the mass balance equation coupled with Equation (3) leads to a linear concentration profile in the sample. This will be the main hypothesis used in the results.
The room temperature is constant and controlled at 22 °C or 295 K. Assuming that helium is a perfect gas (Patm V = nuRT), it is found that nu = 40.8 moles per unit volume (1 m3); thus, the concentration at the upstream side is cu = 40.8 mol/m3.
The molar flux through the sample cross-section will be:
For the calculations, it was supposed that the downstream helium concentration can be neglected in front of the upstream one, i.e., c
d << c
u. This leads to:
L is the sample length.
Under a stationary flow, ‘p’, the rate of helium particles’ increase into the downstream reservoir, is directly linked to φ:
The following is thus obtained:
with
4. Results
4.1. Gas-Permeability Results
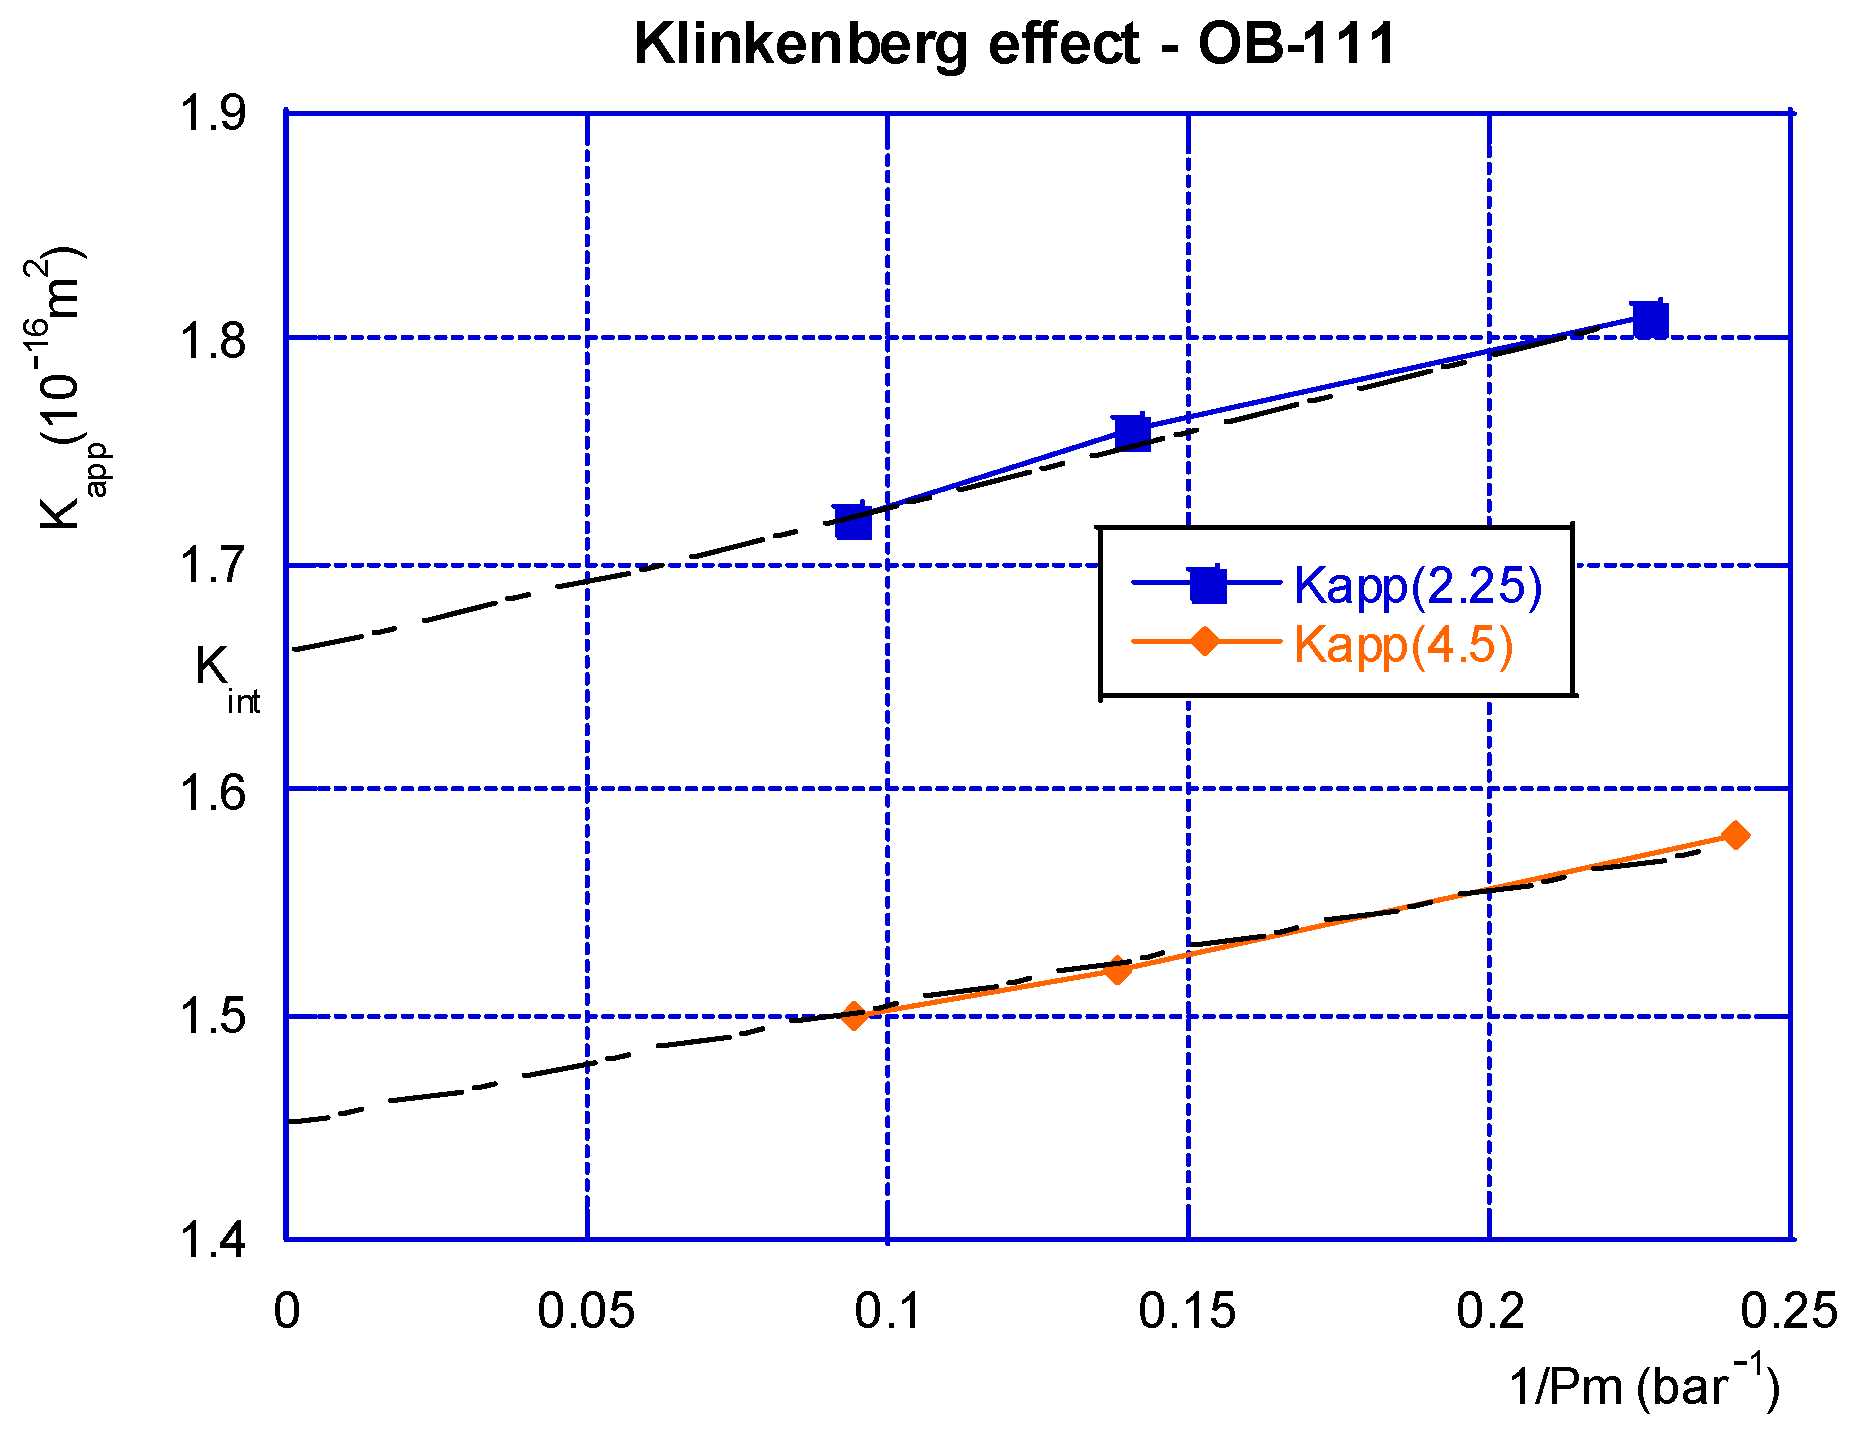
4.1.1. Results with Argon
Gas-permeability tests were performed with argon gas on dry material after the porosity measurements. Three injection pressures were used: 0.5, 1 and 1.5 MPa, in order to quantify the potential Klinkenberg effect [
4]. This effect, also known as the ‘slipping effect’, may occur when the mean gas free path ‘λ’ is close to or lower than the mean pore size. As ‘λ’ is increasing when the gas pressure is decreasing, this effect is often visible on material with small pores (like concrete) and/or during tests with a weak injection pressure. As a result, if this effect is present, the measured permeability is apparent and higher than the intrinsic one. A very well-known correction was brought by Klinkenberg [
4] in order to take this effect into account:
Kapp is the apparent permeability (m2);
Kint is the intrinsic permeability;
β is the Klinkenberg coefficient and Pm is the mean test pressure:
From relation (8), it can be seen that three different injection pressures are sufficient to assess and correct the Klinkenberg effect.
Two confining pressures (hydrostatic pressures) had been required by our partner ONDRAF/NIRAS: 2.25 and 4.5 MPa. Such a change in confining pressure can induce a significant permeability variation depending on whether the material is (micro-)cracked [
3,
5]. A typical result, obtained from sample OB-111, can be seen in
Figure 5, and the whole set of intrinsic permeability results is presented in
Table 2.
First of all, these results show a good material homogeneity in terms of its gas permeability. The confinement effect is very weak; this means that the material is not significantly cracked, as it is well known [
6] that cracks close with a confining pressure, which in return induces a strong (and non-reversible) reduction in permeability. This is not the case here. The Klinkenberg effect is actually present but can be considered as being quite low.
4.1.2. Results with Helium
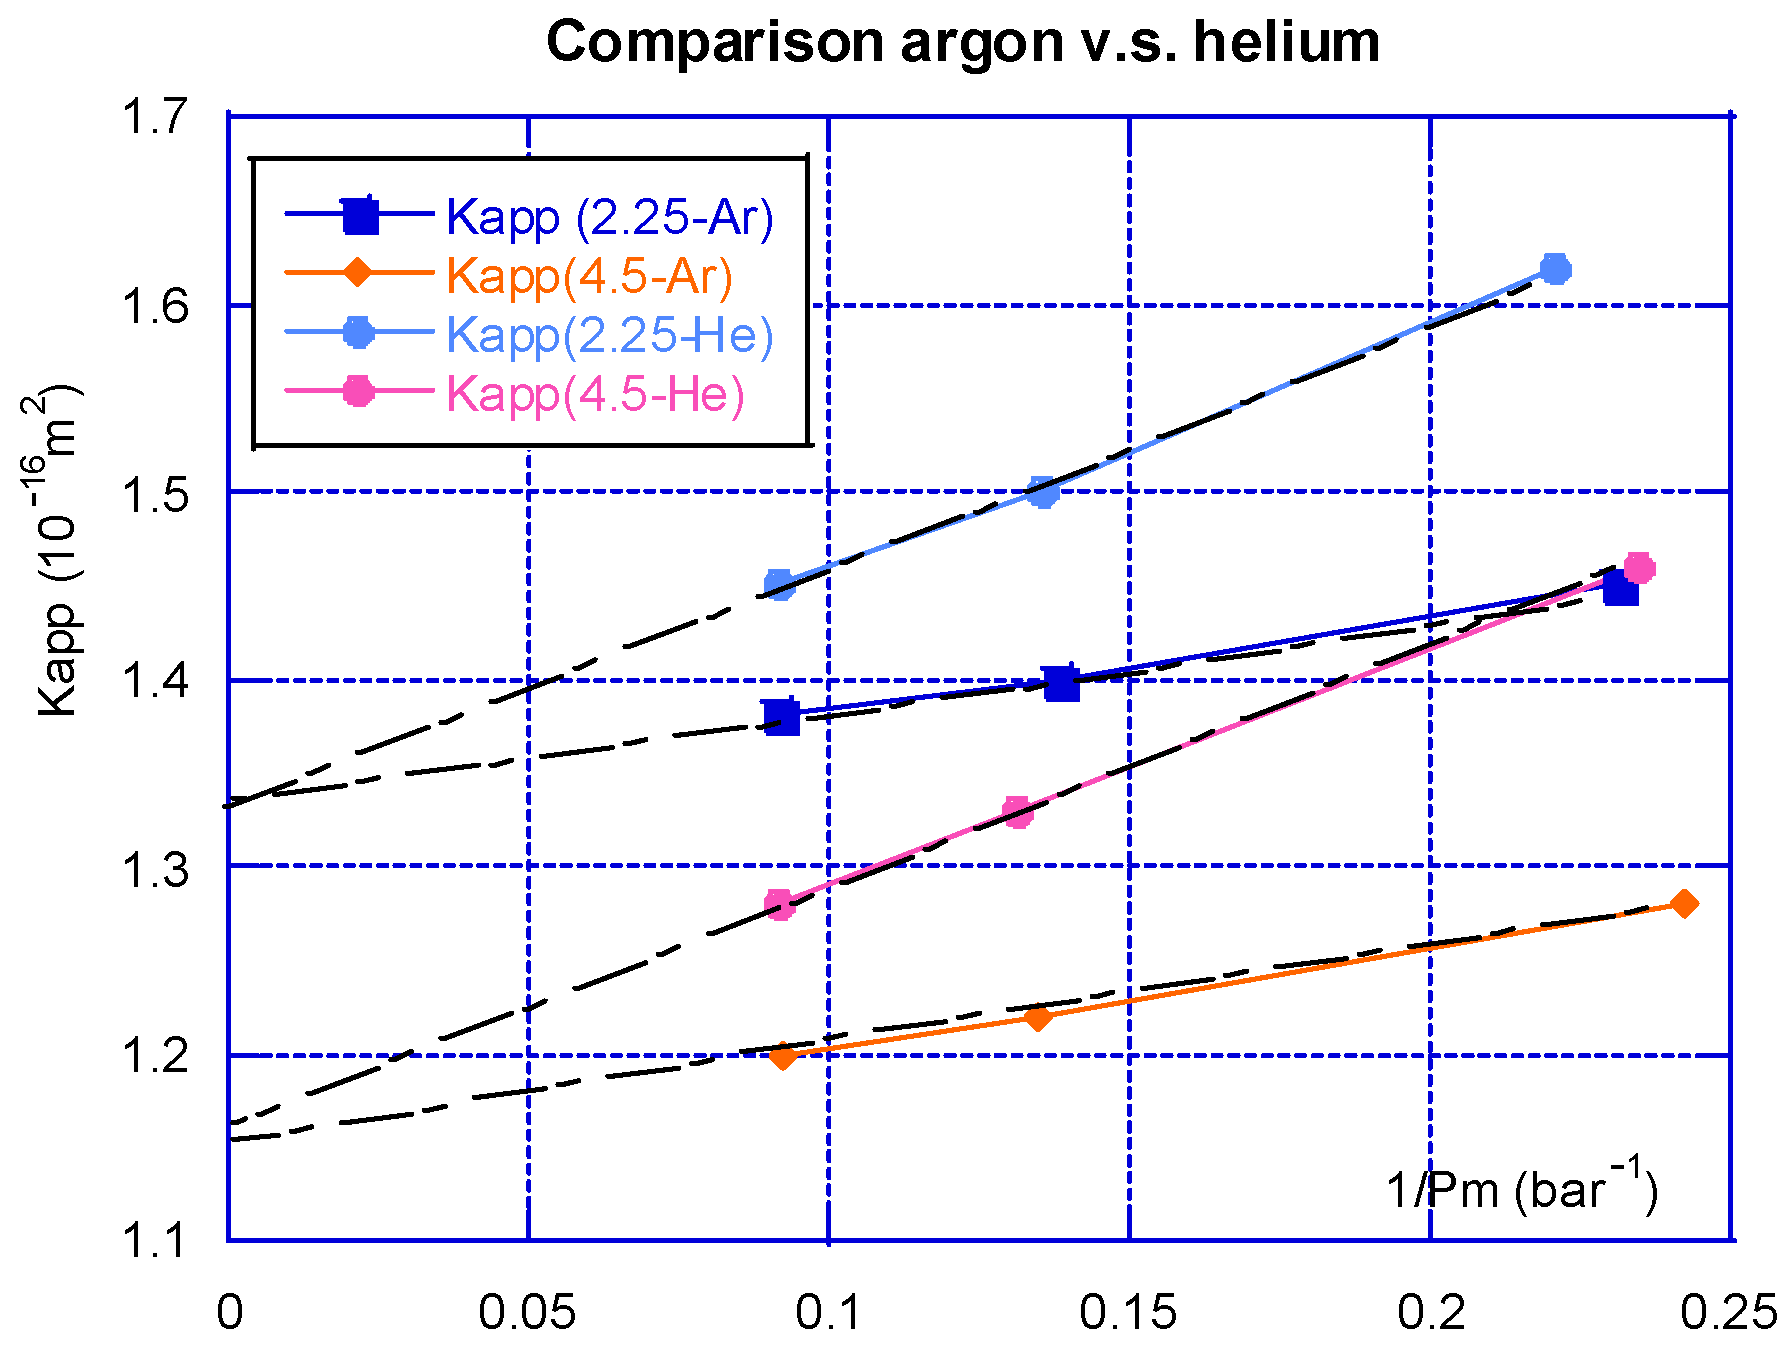
As mentioned before, the diffusion test will be performed with helium and not with argon. The results obtained will be used to evaluate the respective proportion of gas transfer due, respectively, to diffusion and permeation. It is thus important to compare the ‘argon permeability’ with the ‘helium permeability’. One comparative set of tests was therefore performed on sample OB-422. The Klinkenberg effect is more sensitive with helium, as can be seen in
Figure 6. This is consistent with the fact that the helium molecule size is lower than the argon molecule size [
7]. ‘β’ is supposed to vary as 1/r, ‘r’ being the radius of the molecule. ‘r’ is three times higher for argon than for helium. This ratio (1/3) is more or less respected by the ‘β’ coefficients presented in
Table 3. On the other hand, it is clear that argon’s and helium’s intrinsic permeabilities are virtually the same, i.e., both can be used, without significant differences, to compare the respective flow resulting from permeation or from diffusion.
4.2. Gas-Diffusion Results
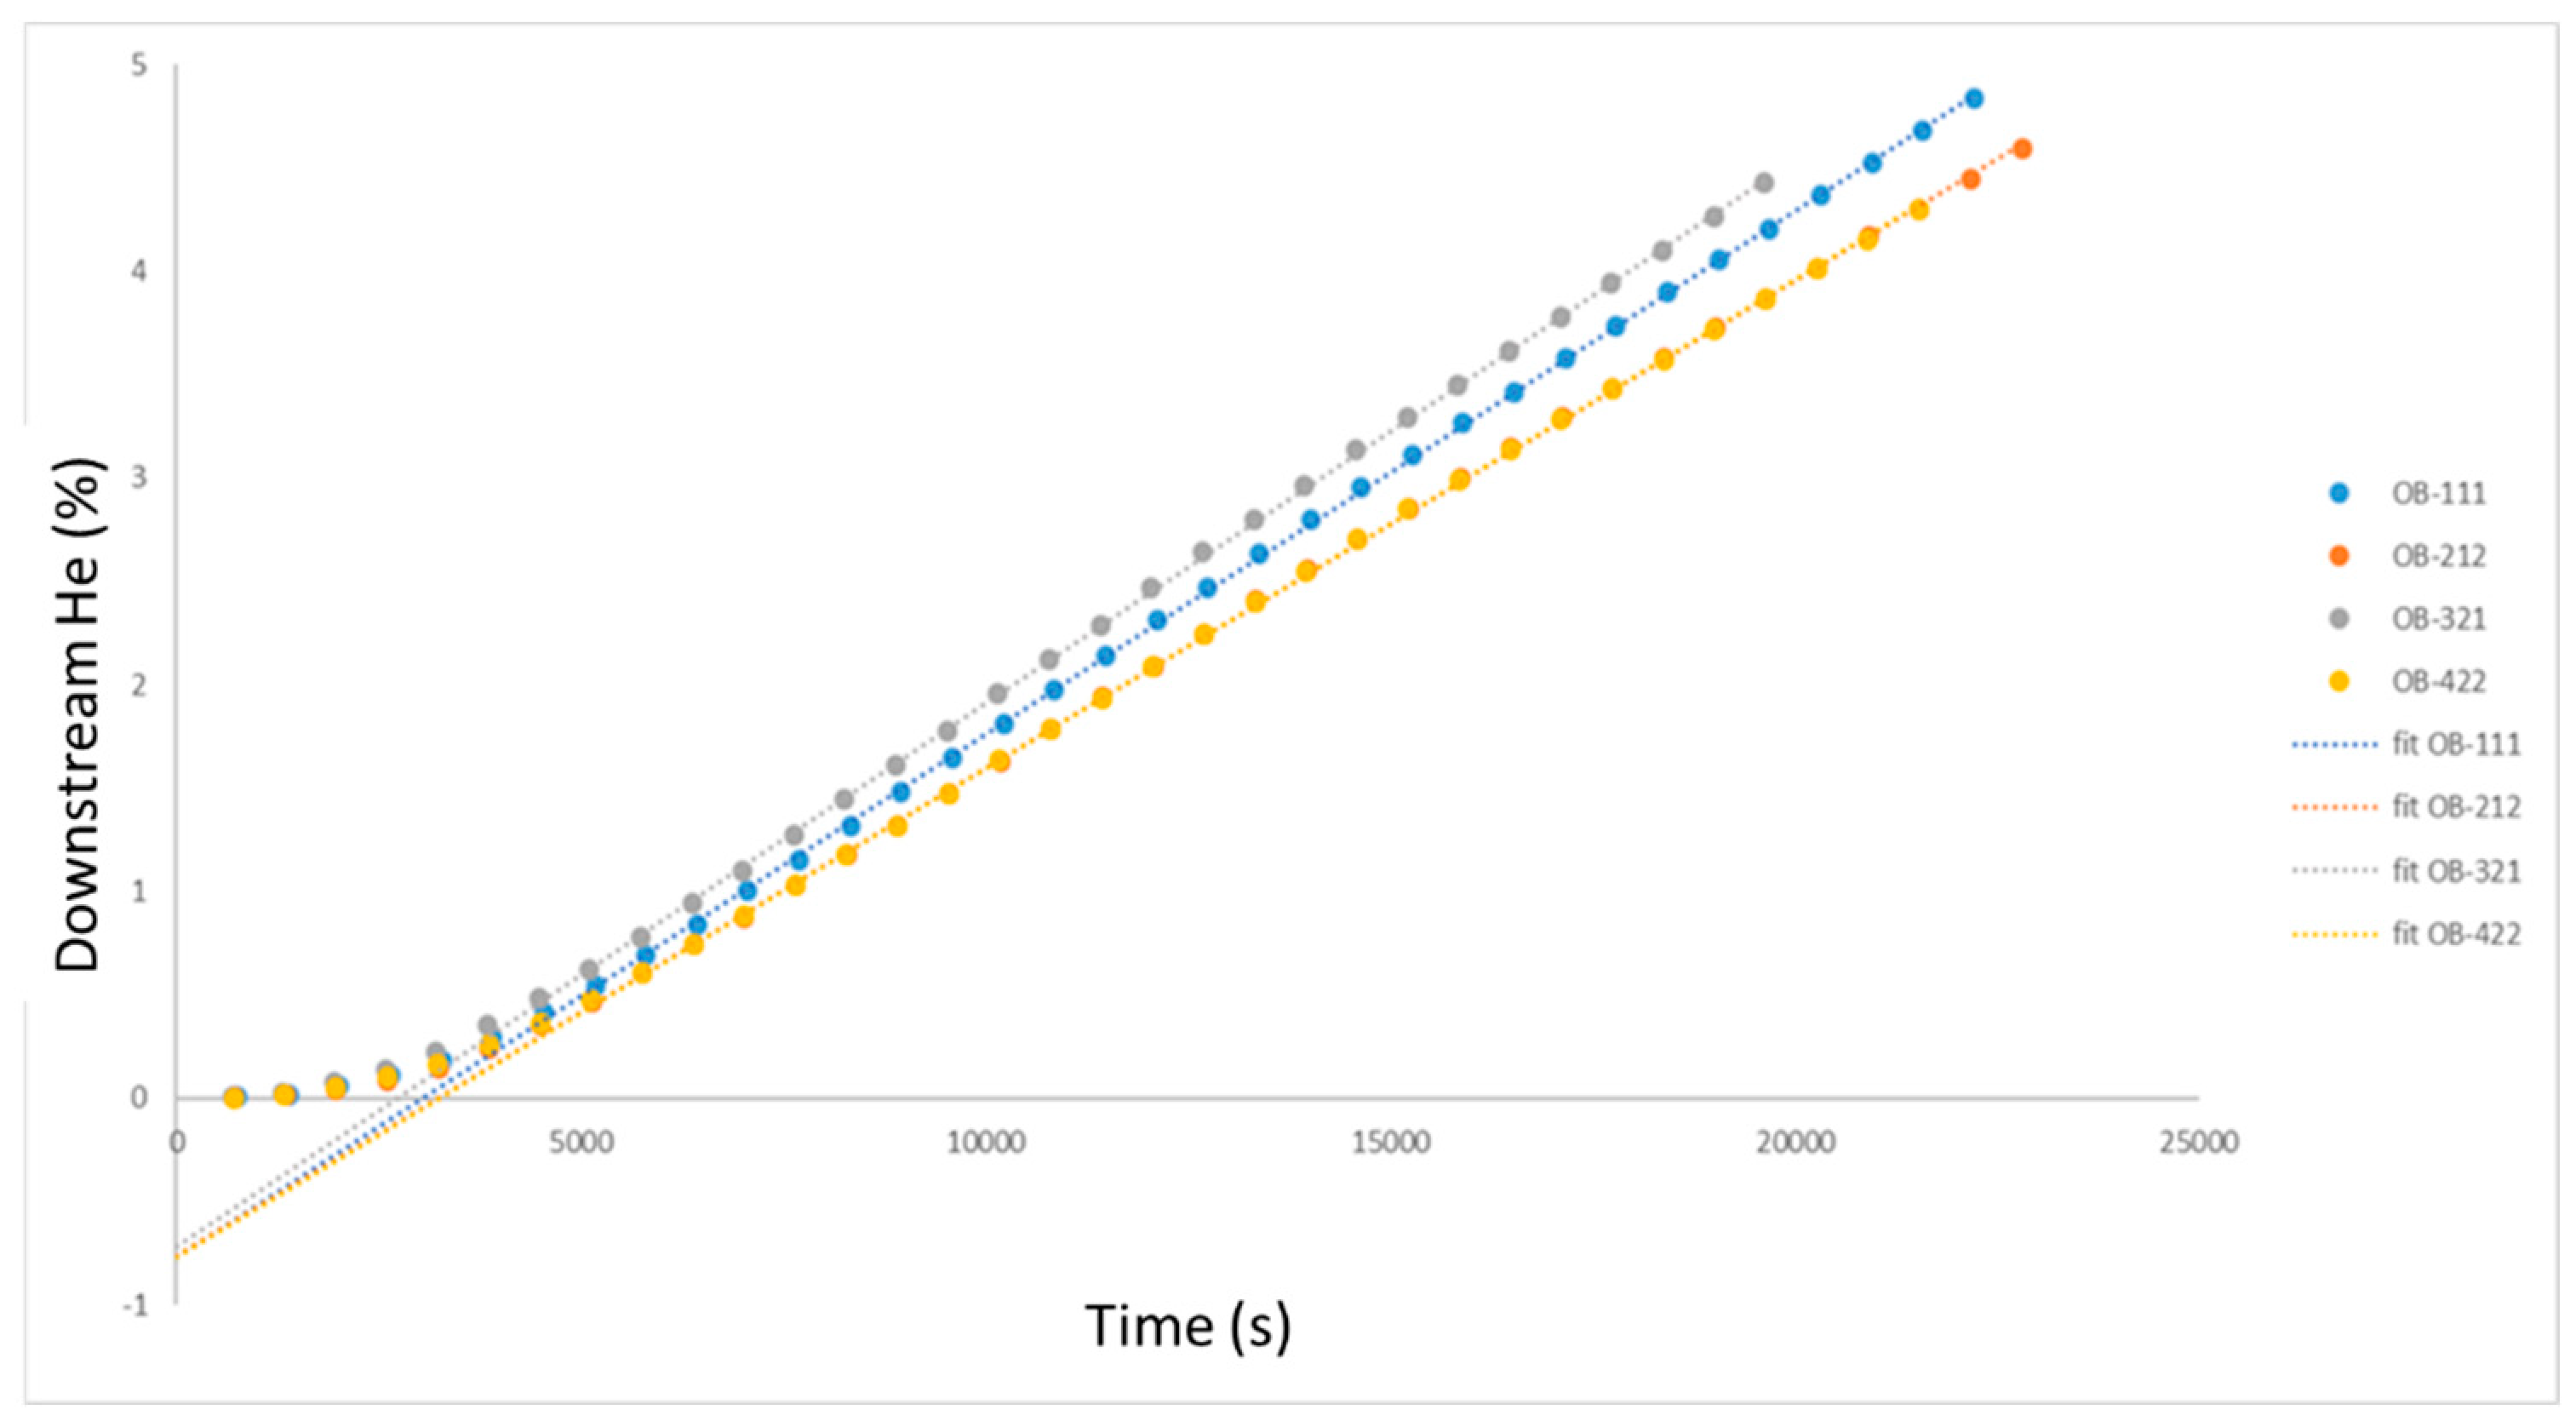
Helium-diffusion tests were carried out right after the permeability experiments. The downstream helium concentration is given in
Figure 7. One can observe a very good homogeneity in these results for the four samples, as was also the case for the gas permeability. The four tests were performed at a 2.25 MPa confining pressure, as it was supposed that this pressure did not play a crucial role for permeability measurements. It is clear that, after around 3500 s, a permanent flow rate can be assumed, as the He concentration increases linearly. This provides evidence that for the dry concrete, the diffusion phenomenon is quite rapid. The slope ‘p’ (presented in §3.3) can be obtained from these results, allowing for the calculation of the diffusion coefficient ‘D’ with relation (7). The results are presented in
Table 4; they lie within the range of the gas-diffusion coefficient often reported for concrete [
8].
4.3. Equivalent Permeability and Discussion
As mentioned before, the pressure due to gas production in a radioactive-waste storage should slowly increase. It is thus interesting to evaluate, in the case of a very low pression gradient, the proportion of gas transfer resulting from permeation and diffusion. This calculation was made within some simplified hypotheses. In particular, it was assumed that the diffusion coefficient does not depend on the gas pressure, which is not the case. The first step is to calculate the equivalent permeability due to diffusion. If an experiment is conducted with the gas pressure (pure helium, for example) at injection pressure P
1 (upstream sample side) and the drainage pressure at P
0 = Patm (air), it is supposed here that the diffusion coefficient helium-air is almost the same as for helium-nitrogen. If the test is interpreted as a permeability test, the downstream volumetric flowrate Q
0 is given by:
This is linked to the number of moles per second n
k:
In a diffusion test, this quantity is the same as φ mentioned before:
The helium downstream concentration is still neglected, while the upstream concentration is:
Then:
The equivalent permeability K
D can then be extracted from relation (15):
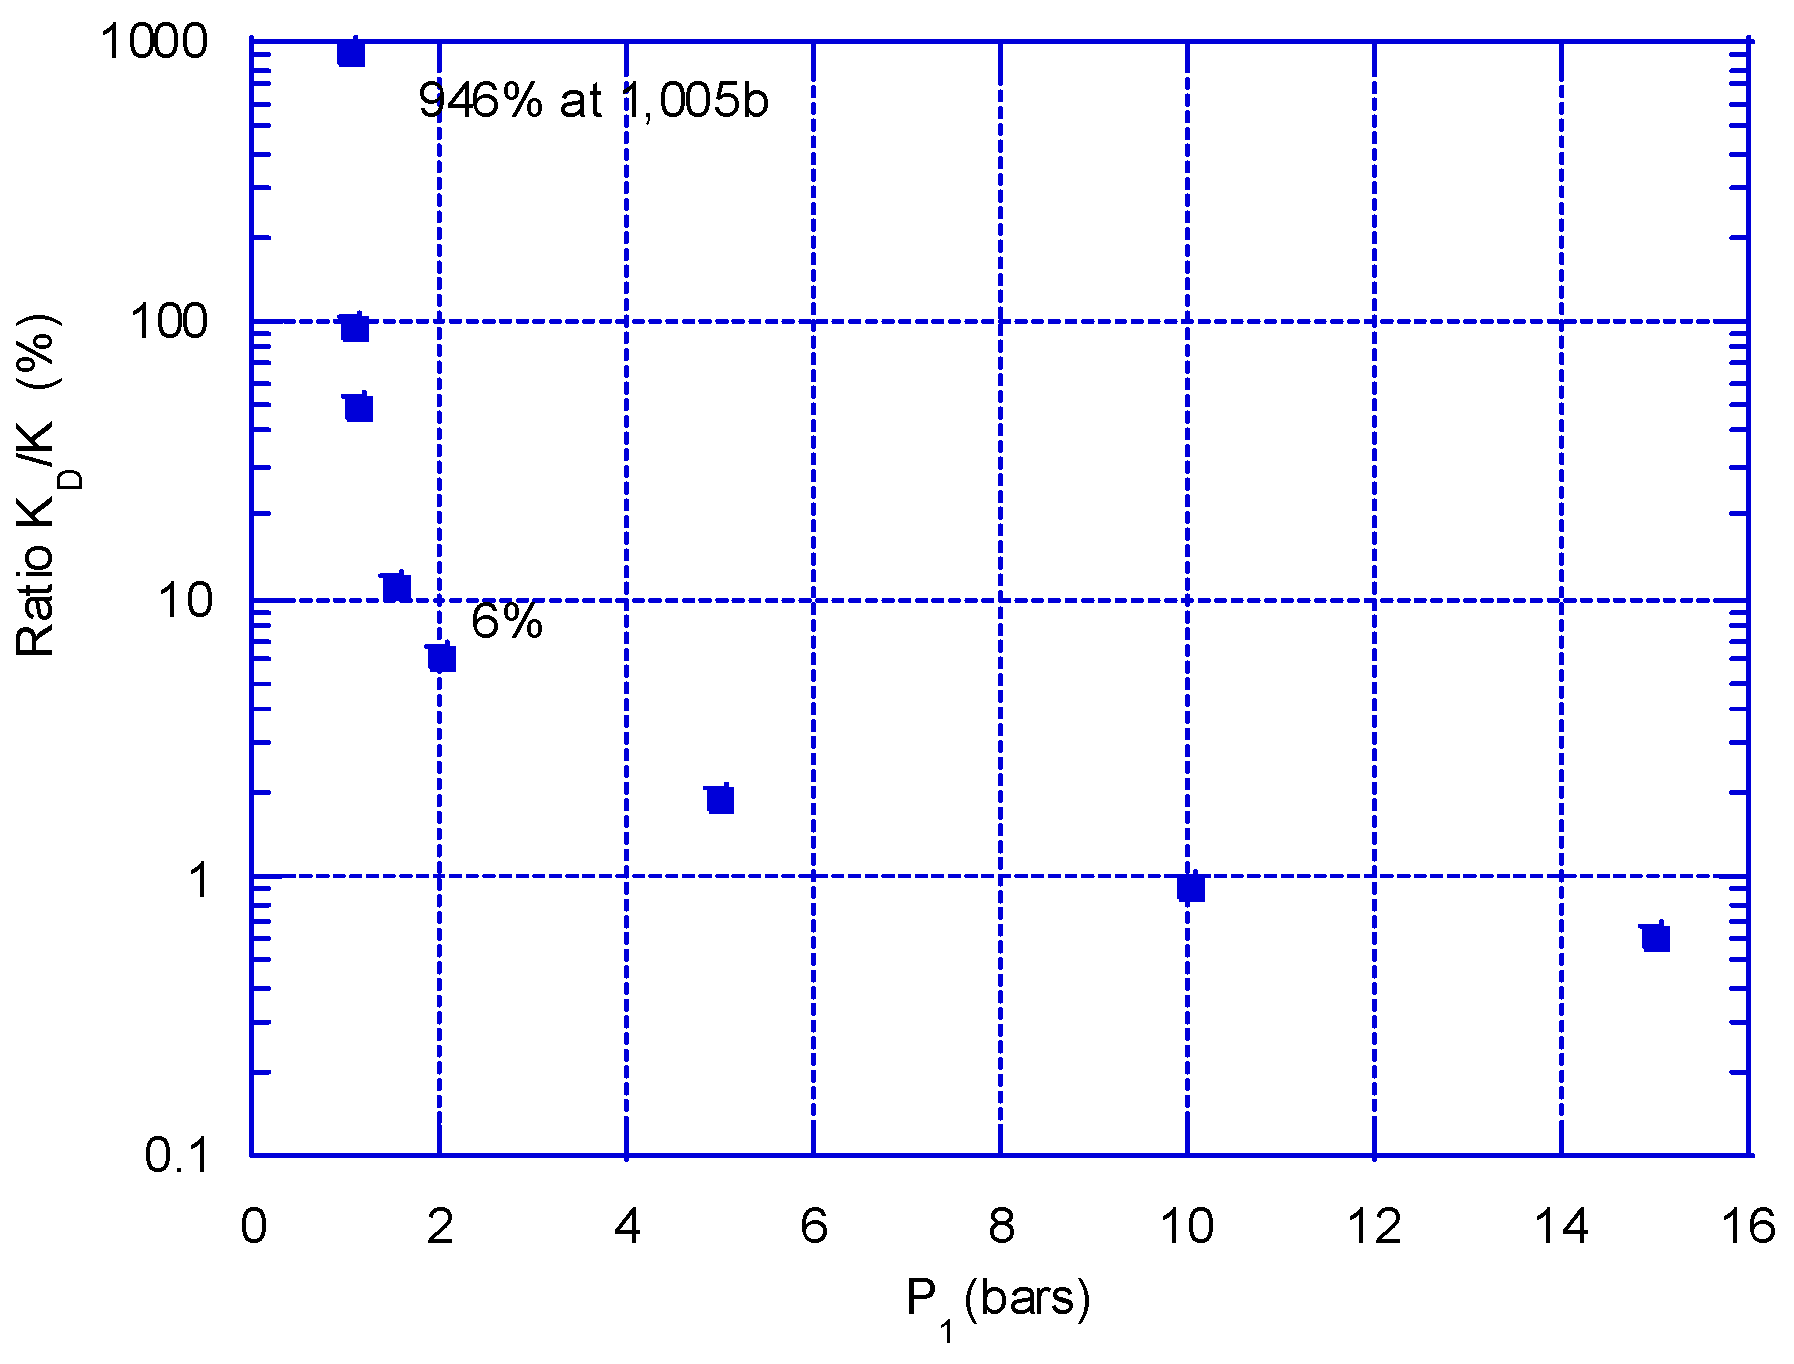
As can be seen in relation (15), the equivalent permeability depends on the injection pressure P
1. K
D is roughly in the form Cste/P
1 when P
1 is increased. This means that the proportion of flow due to diffusion will be lesser and lesser as P
1 is increased. This is illustrated in
Figure 8, which presents the ratio K
D/K, in which K has been chosen as a mean value of 1.5 × 10
−16 m
2. This ratio is equivalent to the proportion of gas flow due to diffusion compared to the one due to permeation.
5. Conclusions
A special device has been designed in order to measure gas diffusion through concrete (or other porous materials). The main goal of this study was to measure both the gas permeability and gas diffusion of an industrial concrete, which could be employed for tunnels intended for radioactive-waste storage. Gas production due to corrosion and water radiolysis should take place in these structures, and the low rate of production would first induce gas transfer at very low pressures, which are generally not used in gas-permeability experiments. Gas-permeability and diffusion tests were then performed on the same set of samples. They revealed that argon and helium permeability is virtually the same when corrected from a (slight) Klinkenberg effect. On the whole, gas permeability was found to be very homogeneous (order of magnitude of 1.5 × 10⁻¹⁶ m2). This homogeneity was also verified for the effective diffusion coefficients (around 4 × 10⁻⁸ m2/s). These coefficients were used to calculate an equivalent permeability KD, which is dependent on the gas injection pressure. This clearly showed that under a low pressure gradient (or injection pressure), diffusion is largely predominant, whereas its induced flow can be neglected as soon as the injection pressure is larger than a few bars. This implies that gas diffusion must be taken into account at the beginning of gas production. Such a study should find a logical extension in the case of partially saturated concrete, which is likely to be encountered in ‘in situ’ structures.
Author Contributions
T.D., L.P. and F.S. conceived and planned the experiments. T.L. and L.P. carried out the experiments. T.L. and F.S. planned and carried out the analyses. S.L., T.L. and F.S. contributed to the interpretation of the results. F.S. and S.L. took the lead in writing the manuscript. All authors have read and agreed to the published version of the manuscript.
Funding
The publication cost of this paper was covered with funds from the Polish National Agency for Academic Exchange (NAWA): “MATBUD’2023-Developing international scientific cooperation in the field of building materials engineering” BPI/WTP/2021/1/00002, MATBUD’2023.
Acknowledgments
The authors thank ONDRAF/NIRAS for its technical and scientific support.
Conflicts of Interest
The authors declare no conflict of interest.
References
- Andreola, F.; Leonelli, C.; Romagnoli, M.; Miselli, P. Techniques Used to Determine Porosity. Am. Ceram. Soc. Bull. 2000, 79, 49–52. [Google Scholar]
- Zhang, D.; Agostini, F.; Jeannin, L.; Skoczylas, F. New Insights Brought by Micro-Tomography to Better Understand Gas Transfer Property Variation and Coupling Effects in Salt Rocks. Rock. Mech. Rock Eng. 2021, 54, 6457–6480. [Google Scholar] [CrossRef]
- Chen, X.; Caratini, G.; Davy, C.A.; Troadec, D. Skoczylas, Coupled transport and poro-mechanical properties of a heat-treated mortar under confinement. Cem. Concr. Res. 2013, 49, 10–20. [Google Scholar] [CrossRef]
- Klinkenberg, L.J. The permeability of porous media to liquids and gases. In Drilling and Production Practices; American Petroleum Institute: Washington, DC, USA, 1941; pp. 200–213. [Google Scholar]
- Chen, W.; Han, Y.; Agostini, F.; Skoczylas, F.; Corbeel, D. Permeability of a Macro-Cracked Concrete Effect of Confining Pressure and Modelling. Materials 2021, 14, 862. [Google Scholar] [CrossRef] [PubMed]
- Ding, Q.; Wang, P.; Cheng, Z. Influence of temperature and confining pressure on the mechanical properties of granite. Powder Technol. 2021, 394, 10–19. [Google Scholar] [CrossRef]
- Degao, H.; Feng, Y.; Zhiguo, S.; Aiwei, Z.; He, Z.; Bin, L. Experimental study about the gas slip flow in Longmaxi shales from the southern Sichuan Basin. Bull. Geol. Sci. Technol. 2021, 40, 36–41. [Google Scholar] [CrossRef]
- Sercombe, R.; Vidal, C.; Gallé, F. Adenot, Experimental study of gas diffusion in cement paste. Cem. Concr. Res. 2007, 37, 579–588. [Google Scholar] [CrossRef] [Green Version]
| Disclaimer/Publisher’s Note: The statements, opinions and data contained in all publications are solely those of the individual author(s) and contributor(s) and not of MDPI and/or the editor(s). MDPI and/or the editor(s) disclaim responsibility for any injury to people or property resulting from any ideas, methods, instructions or products referred to in the content. |
© 2023 by the authors. Licensee MDPI, Basel, Switzerland. This article is an open access article distributed under the terms and conditions of the Creative Commons Attribution (CC BY) license (https://creativecommons.org/licenses/by/4.0/).


