1. Introduction to Low-Carbon Concrete
There is currently a strong effort underway to reduce greenhouse gas emissions and mitigate global warming. To achieve this goal, most industries and human activities must be revised, and a change from the linear approach/model (from cradle to grave) to a circular approach/model (from cradle to cradle) has to take place.
Concrete is probably the most common building material or man-made product, and it was almost entirely produced from virgin materials until recently. Nowadays, the trend is changing, and a more circular approach is being implemented. New types of concrete, such as Low Carbon Concrete (LCC), substitute various materials, primarily waste streams from other industries, for cement. Cement’s production has a significant carbon footprint, which also translates to concrete’s carbon footprint. The materials that can replace cement are called supplemental cementitious materials (SCM), and the mechanism behind their influence on final concrete properties is described in
Section 2.1.
2. Low Carbon Concrete
There are several terms referring to concrete with a lower content of clinker. In this study, we will keep to the term “low carbon concrete.” As indicated, the design of LCC is based on direct clinker reduction (linked with CO
2), resulting in binder volume reduction, and therefore the mix design process deviates from standard concrete design practices. Mix design is more demanding, and its optimization is required. The main compounds of concrete are aggregates (fine and coarse) and binder (cement, supplementary cementitious materials, water, and eventually superplasticizer and air), and their proportion defines the fresh and hardened properties of final concrete. New trends connected to various aggregate types such as crushed sand, recycled aggregates, or artificial aggregates are becoming popular as deposits of natural sand and good-quality natural aggregates are shrinking. In this study, the focus will be given mainly to binder composition and its contribution to concrete´s carbon footprint as expressed by the environmental product declaration (EPD) value [
1]. Supplementary cementitious materials have a significant impact on both fresh and hardened properties, and therefore it is important to have good knowledge of their characteristics.
Throughout the whole publication, a demonstration series of three mixes will be used as an example for mix design, characterization, and environmental assessment. The series consists of a reference mix (REF) and two different low-carbon concretes (LCC1 and LCC2). See
Table 1.
All designed mixes belong to the same strength class C45/55 according to European standard EN206 [
2], with a minimum cube strength of 55 MPa after 28 days (see
Table 2). Concrete mixes were designed to be air-entrained for exposure classes X0, XC1-4, FX1, XD1-3, XA1-4, and XS1-3. The testing of fresh concrete consisted of workability evaluation by a slump test and air content determination by a pressure test.
2.1. Binder Composition
Supplementary cementitious materials are powder additions used as a replacement for clinker (in some cases referred to as Portland cement) with the aim of reducing the carbon footprint of cement while still preserving sufficient cement or concrete properties. The SCM can be blended directly into cement during its production or later during concrete production. The origin of SCM is mostly from various industries’ waste streams, which, with or without treatment, are changed into secondary raw materials that are beneficially used in cement or concrete production. The most widely used SCMs are fly ash (FA), ground-granulated blast furnace slag (SL), and silica fume (SF). More alternative types are calcined clay, ground glass, pumice, or rice husk ash. Nowadays, the trend is highly focused on existing and new SCMs because of the emphasis on the reduction of CO2 emissions, the use of environmentally friendly materials, the circularity of materials through the reuse of waste from various industries, and the reduction of landfilling.
The most important property of SCM is the content of the amorphous (glassy) phase, which is reactive under certain conditions and contributes to the strength and other properties of the binder. Other properties influencing the reactivity of SCMs are fines, the shape of particles, chemical composition, replacement level, and the water/cementitious materials ratio. Another reason why it is essential to keep testing the potential of new materials that could become SCMs is due to the closure of thermal power plants that produce the by-product FA, which is presently the most common SCM on the market.
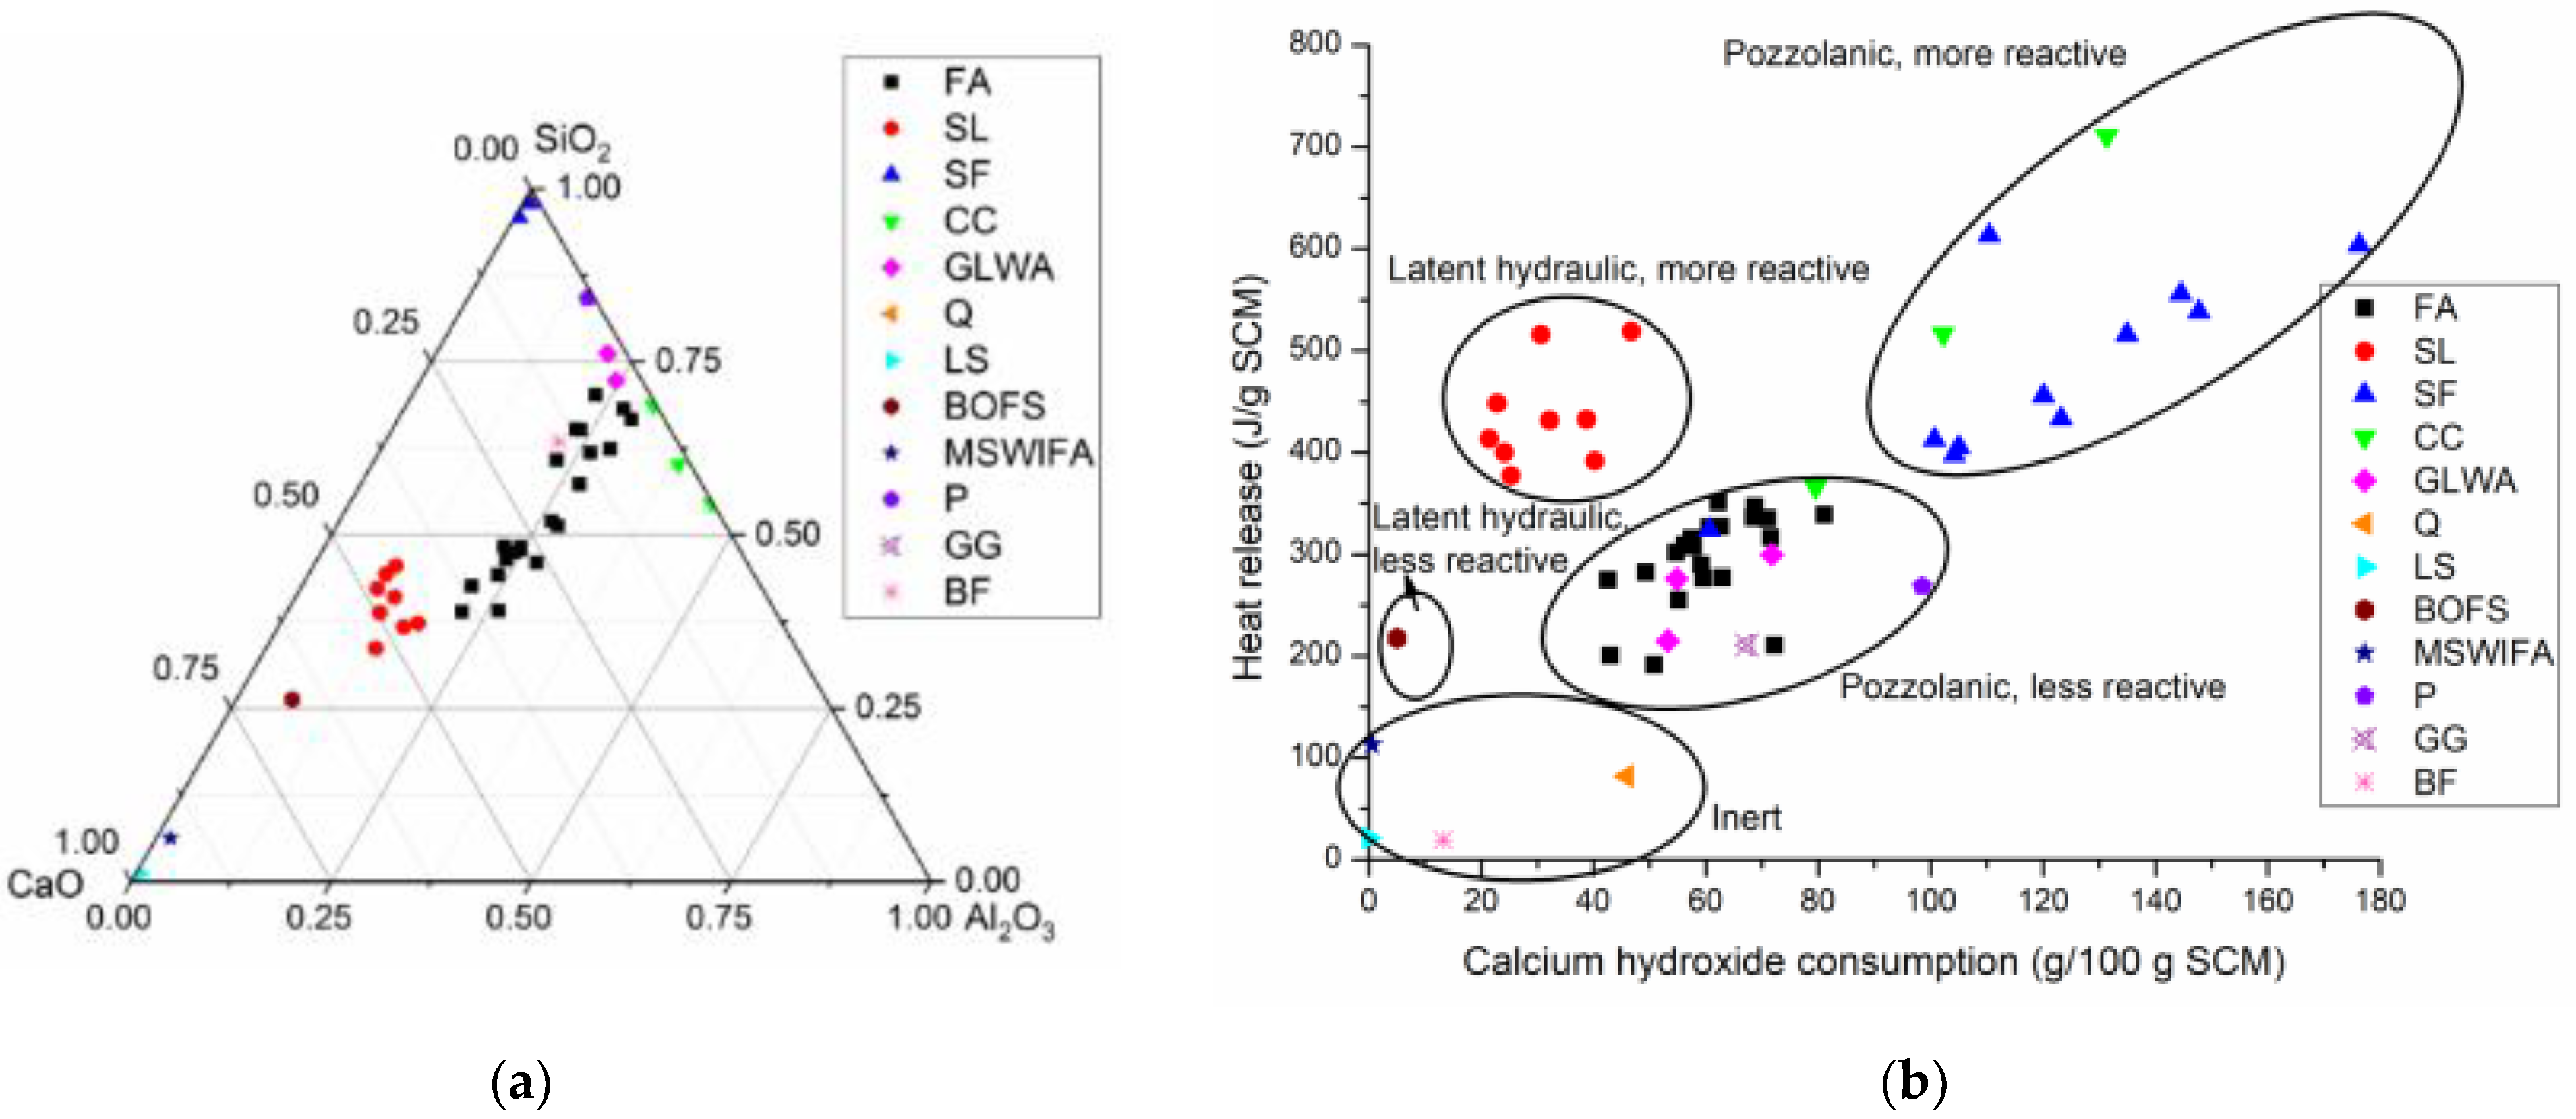
Reactivity is a factor that sorts SCMs into inert, latent hydraulic, or pozzolanic types based on their chemical reaction principle. For example, the reactivity of SCMs could be improved by the addition of a sulphate constituent (gypsum) and a carbonate constituent (lime). The reactivity of individual SCMs is possible to analyze using various test methods. There are tests specifically for FA and SL described in ASTM and EN, but they are based only on the comparison of strength properties to the reference mix. Other methods, such as the Chapelle test, the Frattini test, the strength activity index test, and the SCM dissolution test, have been introduced. Those methods are useful, but they are not able to distinguish whether the SCM is pozzolanic or latently hydraulically reactive (see
Figure 1. Therefore, isothermal calorimetry and thermogravimetry analysis, or “rapid, relevant, and reliable” test methods, were introduced [
3].
There are two main standards for the utilization of SCMs: directly in cement, later during concrete production, or both to be followed in Europe. The amount of SCMs used as a replacement for clinker is regulated by standard EN 197-1, “Cement—Part 1: Composition, specifications, and conformity criteria for common cements” [
5]; and standard EN 197-5:2021, “Cement Part 5: Portland-composite cement CEM II/C-M and composite cement CEM VI” [
6]. Only EN197-1 [
5] is mentioned in the standard for concrete, EN206, “Concrete—Specification, Performance, Production, and Conformity” [
2], and therefore, the maximum replacement of clinker in concrete is approximately 35% (this can vary for individual countries by the national annex). If the SCMs are added during concrete production, EN206 [
2] shall be followed, where in the section “5.2.5 Use of Additives”, it is specified the maximal proportions of FA, SF, and SL to cement. The k-value concept is regulative, and if the amount of SCM in question exceeds the limit value, an excessive amount is considered an additive of type I (mineral filler).
All these regulations must be followed, so it is challenging for industry to abide by them and still produce concrete with a low carbon footprint. The demonstration series of mixes contains fly ash, silica fume, and limestone powder in various proportions to cement (see
Table 3).
The most common method for evaluating CO
2 connected to concrete produced in a given concrete plant is the EPD. This certificate allows concrete producers around Europe to compare their concrete in terms of carbon footprint. A detailed description of EPD is described in the following
Section 3.
3. Environmental Product Declaration for Low Carbon Concrete
The environmental impact in terms of CO
2 associated with the production of low-carbon concrete is calculated in an EPD consisting of four major sections: CO
2 related to raw materials (A1) and their transportation (A2), concrete production (A3), and delivery of the final product (A4), concrete, to the construction site where it is used (A4). Stages A1, A2, and A3 belong to the product stage, and stage A4 is part of the construction installation stage [
1]. The use of SCMs can help reduce CO
2, which is predominantly related to Stage A1. In general, limestone powder and SCMs such as fly ash or microsilica have a significantly lower CO
2 footprint connected to their production than Portland cement. The EPDs for the demonstration series were created in two different concrete plants in Northern Norway, Nordland Betong (NB) and HGB Betong AS (HGB). The difference in carbon footprint connected to individual mixes is related to the A2 stage, as all input materials are the same besides aggregates; see
Table 4.
4. Areas for Utilisation of LCC in Northern Periphery and Arctics
Different countries in the Northern Periphery and the Arctic have different national regulations and recommendations for LCC, but all of them are aligned with European standards, particularly EN197-1 [
5] and EN206 [
2]. Individual concrete types are regulated by a classification system that sorts concretes in low-carbon concrete classes defined by kg CO
2—eqv. per 1 m
3 of concrete. LCC can be designed for all concrete strength classes, and the emitted CO
2 varies for each class. The exposure classes defined in EN 206 [
2] further describe the properties of concrete, and if the LCC fulfills those, it can be used for any application. Nevertheless, based on extensive research, we know that LCC suffer in harsh conditions, and their use is even more limited than in countries with a warmer climate. Recommendations and regulations for LCC classification for Norway, Sweden, Iceland, and Finland follow.
4.1. Norway
For Norway, the system is described in the Norwegian Concrete Association’s publication NB 37, “Lavkarbonbetong” [
7]. In this publication, it is clearly explained that the production of LCC is more feasible in the southern part of Norway than in the northern part, mainly due to input material transportation. Northern Norway has only one realistic supplier of cement: Norcem in Kjøpsvik. The nearest supplier apart from this is Norcem Brevik (near Oslo). Therefore, CO
2 footprint that concrete producers from Northern Norwegian use is 616 kg CO
2/ton compared to southern producers, which are using Norcem Brevik with 573 kg CO
2/ton [
8]. Classification system in NB 37 sorts of concrete in 4 LCC classes and compare them to industrially produced concrete (Industry reference [
7]). The following
Table 5 presents a system for the classification of LCC in Norway. There are already discussions that The Norwegian Public Roads Administration will impose requirements for low carbon at B in the concrete structures.
4.2. Sweden
The Swedish national climate target goal aims for LCC by 2045. The industry is working on strategies to reach these goals and thereby attain a lower climate impact. Now, some LCC are currently available, but generally, there is a lack of LCC on the Swedish market.
A very good overview of Swedish progress is given in a master’s thesis by Strombom (2021) on a survey of climate-improved concrete [
9]. The purpose of the work is to investigate how the concrete industry works towards climate neutrality and to see how far the actors have come in that work. The survey and review of the EPDs showed that some LCC already exists today, but that it is not used to such a large extent. Just over half of the concrete producers do not have any LCC on the market now, but most are working on developing it, and most expect to have it on the market within one to three years. Most concrete producers are confident that all of their concrete will be climate neutral by 2045. Because the Swedish classification system is quite extensive, the only category into which we classified our test series is shown in
Table 6.
4.3. Iceland
Iceland has had its own system for low-carbon concrete qualification since 2009. At the ICI Rheocenter at IBRI and Reykjavík University, special carbon classes have been defined for concrete, taking into account their EPDs [
11].
Such a classification can be useful for evaluating the environmental friendliness of concrete, but conventional, vibrated concrete was then estimated to release 400 kg CO
2/m
3. However, this value has decreased somewhat as the carbon footprint of cement has continuously decreased. According to the Icelandic classification, the original low carbon concrete classes (LCCC) are given in
Table 7. It is now a relatively simple system, as when one specifies the concrete, the LCCC is just added after the strength and durability classification, ex. C25/30 FX2 LCC
200, meaning the carbon footprint of this concrete should not exceed 200 kg CO
2/m
3.
4.4. Finland
In Finland, concrete types are assigned to classes depending on the associated CO
2 emissions. The classification system covers a total of 16 different concrete types and a total of 5 different low-carbon classes [
12]. The classification is assigned separately for each concrete mix and concrete plant. Concrete manufacturers can assign the concrete mix recipes of their choice to low-carbon classes, provided the emission value of the mix meets the classification requirements.
Low-carbon classes are indicated as GWP.NN, where GWP stands for global warming potential and NN indicates the emission level in comparison with the reference level. The reference level is given for each type of concrete as the average emission level of Finnish concrete manufacturers in 2021.
Table 8 shows selected section of the Concrete Association of Finland (BY) low-carbon classes. The GWPtotal values include modules A1–A3. The values are given in kg (GWPtotal)/m
3 of concrete. As the table is rather extensive, sections relevant for the demonstration series are present in
Table 8.
5. Application of Classification Systems to Demonstration Series
The demonstration series of one reference mix and two LCC mixes was classified according to systems from all four countries: Norway (NO: NB37), Sweden (SE: SCI), Iceland (IS: LKS), and Finland (FI: LC class), see
Table 9. Several benefits and limitations for all systems were identified. As the carbon footprint for the demonstration series was evaluated in two different locations, 6 EPDs were classified.
Prepared concrete mixes were air-entrained with a minimum cube strength of 55 MPa after 28 days. According to the individual systems, the demonstration series was classified as B45 in NO: NB37; in SE:SCI classified as 5. House Outside, salt (For example. Car park, external stairs, loft passage, plinth, an outer wall near the coast). The Icelandic system does not distinguish any strength or exposure classes and is only informative.According to Finish system, FI:LC, was demonstration series classified as C45/55—Air-entrained. Demonstration LCC improved in most cases by 2–3 classes, which shows very good environmental potential for newly designed concrete types.
In all systems besides NO:NB37, the REF mix was classified in different classes due to the 12.6% (42 kg CO2—eqv. per 1 m3 of concrete) difference based on the production plant (NB or HGB). According to NO:NB37, REF belongs to the “industry reference” class, as the limit for a subsequent class B is 290 kg CO2—eqv. per 1 m3 of concrete.
The C45/55 LCC1 produced in both plants fits in the same class in all systems. The difference between producers was 18 kg CO2—eqv. per 1 m3 of concrete, and the limits for all countries were between 220 and 200 kg CO2—eqv. per 1 m3 of concrete. The lower EPD for LCC1 produced in NB is mainly due to the transport method and distance for limestone powder.
Classification of C45/55 LCC2 was more variable as HGB managed to have EPD value below 150 kg CO2—eqv. per 1 m3 of concrete, which is a common level for IS: LKS and FI: LC class. In addition, in NO:NB37 system, LCC2 fit in lower class “Lavkarbon Pluss” with a limit 170 kg CO2—eqv. per 1 m3 of concrete. The Swedish system´s highest class has a limit of 205 kg CO2—eqv. per 1 m3 of concrete, with which both LCCs complied regardless of producer. Transportation method and distance are the main reasons for the low EPD value of LCC2 produced in HGB, as cement and fly ash are transported only 95 km by trucks compared to 200 km to NB by coastal barge.
6. Conclusions
The overall design of LCC in the demonstration series was successful, as both mixes reached the requested strength class despite lacking 9.8 and 5.3% of the REF mix. But the second intention to design concrete for freeze-thaw exposure was not successful, as the mixes exceeded the scaling limit level despite showing high chloride migration resistivity. Example: LCC mixes had a higher aggregate share, which allowed for cement reduction and only partial replacement by SCM. EPD is for two particular concrete productions located in Norway, and even with that, we can see differences in EPD values. Therefore, the same mix design produced in a different location will have a different EPD value/carbon footprint per 1 m3 of concrete. The difference between the REF mix produced in two different concrete plants was 12.6%, according to the demonstration series used in this article. The LCC1 carbon footprint was reduced by 48.2 and 34.6%, and the carbon footprint of LCC2 was reduced by 46.1 and 51.0% in NB and HGB.
In all classification systems from Norway, Sweden, Iceland, and Finland, the REF mix complied with the criteria for industry reference, and when produced in HGB, it was even classified as the first level of LCC according to SE:SCI, IS:LCCxxx, and FI:LC class. The LCC mixes moved by 2 to 3 classes, which points out that systems are comparable; only the Norwegian is more ambitious, with an extreme class of 130 kg CO2—eqv. per 1 m3 of concrete. In addition, the Icelandic system has classes down to a value ˂105 kg CO2 per m3 of “EcoCrete-Xtreme” and is mainly informative without direct comparison to industry reference. On the contrary, the Swedish system is well developed and clearly describes classes based on exposure classes, but the highest recognized class, “climate improved class 3”, is rather conservative, and other classes with a lower carbon footprint might be essential.
Author Contributions
I.N.: conceptualization, validation, writing—original draft preparation, funding acquisition. P.P.: methodology, writing—review and editing. A.C.: methodology, writing—review and editing. O.H.W.: methodology, writing—review and editing. All authors have read and agreed to the published version of the manuscript.
Funding
This research was funded by Northern Periphery and Arctic programme 2021-2027, Project No. NPA0100039.
Data Availability Statement
No new data were created or analyzed in this study. Data sharing is not applicable to this article.
Acknowledgments
I would like to acknowledge the Interreg bridging call project ArCorD, within which the first draft of the study took place. The publication cost of this paper was covered by the funds of the Polish National Agency for Academic Exchange (NAWA): "MATBUD’2023—Developing international scientific cooperation in the field of building materials engineering" (BPI/WTP/2021/1/00002, MATBUD’2023).
Conflicts of Interest
The authors declare no conflict of interest.
References
- Environmental Product Declaration. Available online: https://www.environdec.com (accessed on 5 July 2022).
- NS-EN 206:2013+A2:2021+NA:2022; Concrete—Specification, Performance, Production and Conformity. Standard Norge: Oslo, Norway, 2022.
- Avet, F.; Snellings, R.; Alujas, A.; Scrivener, K. Development of a new rapid, relevant and reliable (R3) testing method to evaluate the pozzolanic reactivity of calcined clays. In Calcined Clays for Sustainable Concrete: Proceedings of the 1st International Conference on Calcined Clays for Sustainable Concrete; Springer: Dordrecht, The Netherlands, 2015; pp. 539–544. [Google Scholar] [CrossRef]
- Suraneni, P.; Hajibabaee, A.; Ramanathan, S.; Wang, Y.; Weiss, J. New insights from reactivity testing of supplementary cementitious materials. Cem. Concr. Comp. 2019, 103, 331–338. [Google Scholar] [CrossRef]
- NS-EN 197-1:2011; Cement—Part 1: Composition, Specifications and Conformity Criteria for Common Cements. Standard Norge: Oslo, Norway, 2011.
- NS-EN 197-5:2021; Cement Part 5: Portland-Composite Cement CEM II/C-M and Composite Cement CEM VI. Standard Norge: Oslo, Norway, 2021.
- 37 PDF Lavkarbonbetong (2020)—Norsk Betongforening. Available online: https://betong.net/nettbutikk/nb-publikasjoner/37-pdf-lavkarbonbetong-2015-gratis-nedlasting-klikk-les/ (accessed on 2 October 2022).
- Norcem Standardsement FA|Norcem. Available online: https://www.norcem.no/en/StandardsementFA_eng (accessed on 3 December 2022).
- BORÅS BYGGINGENJÖR HANNA STRÖMBOM, Högskoleingenjörsutbildningen. Kartläggning av klimatförbättrad betong [online]. 2021. Available online: http://urn.kb.se/resolve?urn=urn:nbn:se:hb:diva-26057 (accessed on 3 October 2022).
- Klimatförbättrad Betong. Available online: https://xn--klimatfrbttradbetong-jzb70b.guide/ (accessed on 5 October 2022).
- Wallevik, O.H.; Mansour, W.I.; Yazbeck, F.H.; Kristjansson, T.I. Ecocrete-Xtreme: Extreme Performance Of A Sustainable Concrete. In Proceedings of the International Symposium on Environmentally Friendly Concrete Ecocrete, Reykjavik, Iceland, 13–15 August 2014; pp. 3–10. [Google Scholar]
- PUNKKI, Jouni a Mirva VUORI. Low-Carbon Classification of Concrete in Finland. Available online: www.vahahiilinenbetoni.fi (accessed on 10 October 2022).
| Disclaimer/Publisher’s Note: The statements, opinions and data contained in all publications are solely those of the individual author(s) and contributor(s) and not of MDPI and/or the editor(s). MDPI and/or the editor(s) disclaim responsibility for any injury to people or property resulting from any ideas, methods, instructions or products referred to in the content. |
© 2023 by the authors. Licensee MDPI, Basel, Switzerland. This article is an open access article distributed under the terms and conditions of the Creative Commons Attribution (CC BY) license (https://creativecommons.org/licenses/by/4.0/).


