Proceeding Paper

Properties of the Cement, Slag and Fly Ash Mixture Composition Corresponding to CEM II/C-M and CEM VI †

by
Ewelina Tkaczewska
and
Grzegorz Malata
*
Department of Building Materials Technology, Faculty of Materials Science and Ceramics, AGH University of Science and Technology, 30 Mickiewicza Avenue, 30-059 Krakow, Poland
*
Author to whom correspondence should be addressed.
Presented at the 10th MATBUD’2023 Scientific-Technical Conference “Building Materials Engineering and Innovative Sustainable Materials”, Cracow, Poland, 19–21 April 2023.
Mater. Proc. 2023, 13(1), 11; https://doi.org/10.3390/materproc2023013011
Published: 14 February 2023
(This article belongs to the Proceedings of 10th MATBUD’2023 Scientific-Technical Conference)

Abstract

:
In the study, cement mixtures containing granulated blast furnace slag (GBFS) and siliceous fly ash (SFA) were tested, including those corresponding to special cements according to the PN-B-19707: 2013 standard. Measurements included the period of development of standard strength (up to 28 days) and concerned the compressive strength, linear changes and phase composition of cement mixtures. Furthermore, an evaluation of the microstructure of cement mortar was carried out by SEM. The mixture of composition CEM II/C-M (S-V) satisfies the requirements of the 32.5R or 32.5N strength class, whereas that of CEM VI (S-V) is of the 32.5N strength class, as opposed to stronger mixtures richer in Portland clinker.

1. Introduction

In 2021, worldwide emissions from the cement industry reached almost 2.9 billion tons of CO2, which is more than 7% of the total global CO2 emissions [1]. For the production of 1 Mg of Portland cement clinker, about 1.7 Mg of natural resources are used, mainly carbonate raw materials, such as limestone and marl [2]. About 60% of the total CO2 emissions released by a cement plant come from the calcination of carbonates in the raw material bulk. The remaining 40% of all CO2 emissions in a cement plant are derived from the burning of fossil fuels. Therefore, the world cement industry has to meet the constantly growing environmental requirements, which mainly concern the reduction in CO2 emissions [3].
One way to reduce CO2 emissions is the production of multicomponent cements CEM II-CEM V according to the PN-EN 197-1 standard [4] using significant amounts of main ingredients other than Portland clinker, mainly granulated blast furnace slag or siliceous fly ashes. Cements containing significant amounts of these components are characterized by low hydration heat, higher compressive strength, longer curing periods, and higher resistance to chemical aggression [5,6,7,8,9,10].
The PN-EN 197-5 standard [11] defines the framework conditions for a significant reduction in the clinker content of cements. It extends the range of Portland multicomponent cements (the possibility of using several main components in the composition of cement) by a group of Portland multicomponent cements CEM II/C-M with a minimum content of Portland clinker of 50% and a newly created group of multicomponent cements CEM VI, in which the share of non-clinker components can reach 65% at a maximum.
This paper presents the results of research into the properties of the CEM II/C-M cements with a mixture of granulated blast furnace slag and siliceous fly ashes at 20 and 15% or 30 and 15%, respectively, and the CEM VI cement containing 40% granulated blast furnace slag and 15% siliceous fly ashes. Cement tests were performed to analyze the compressive strength, linear changes, phase composition, and microstructure after a specified period of time.

2. Materials and Methods
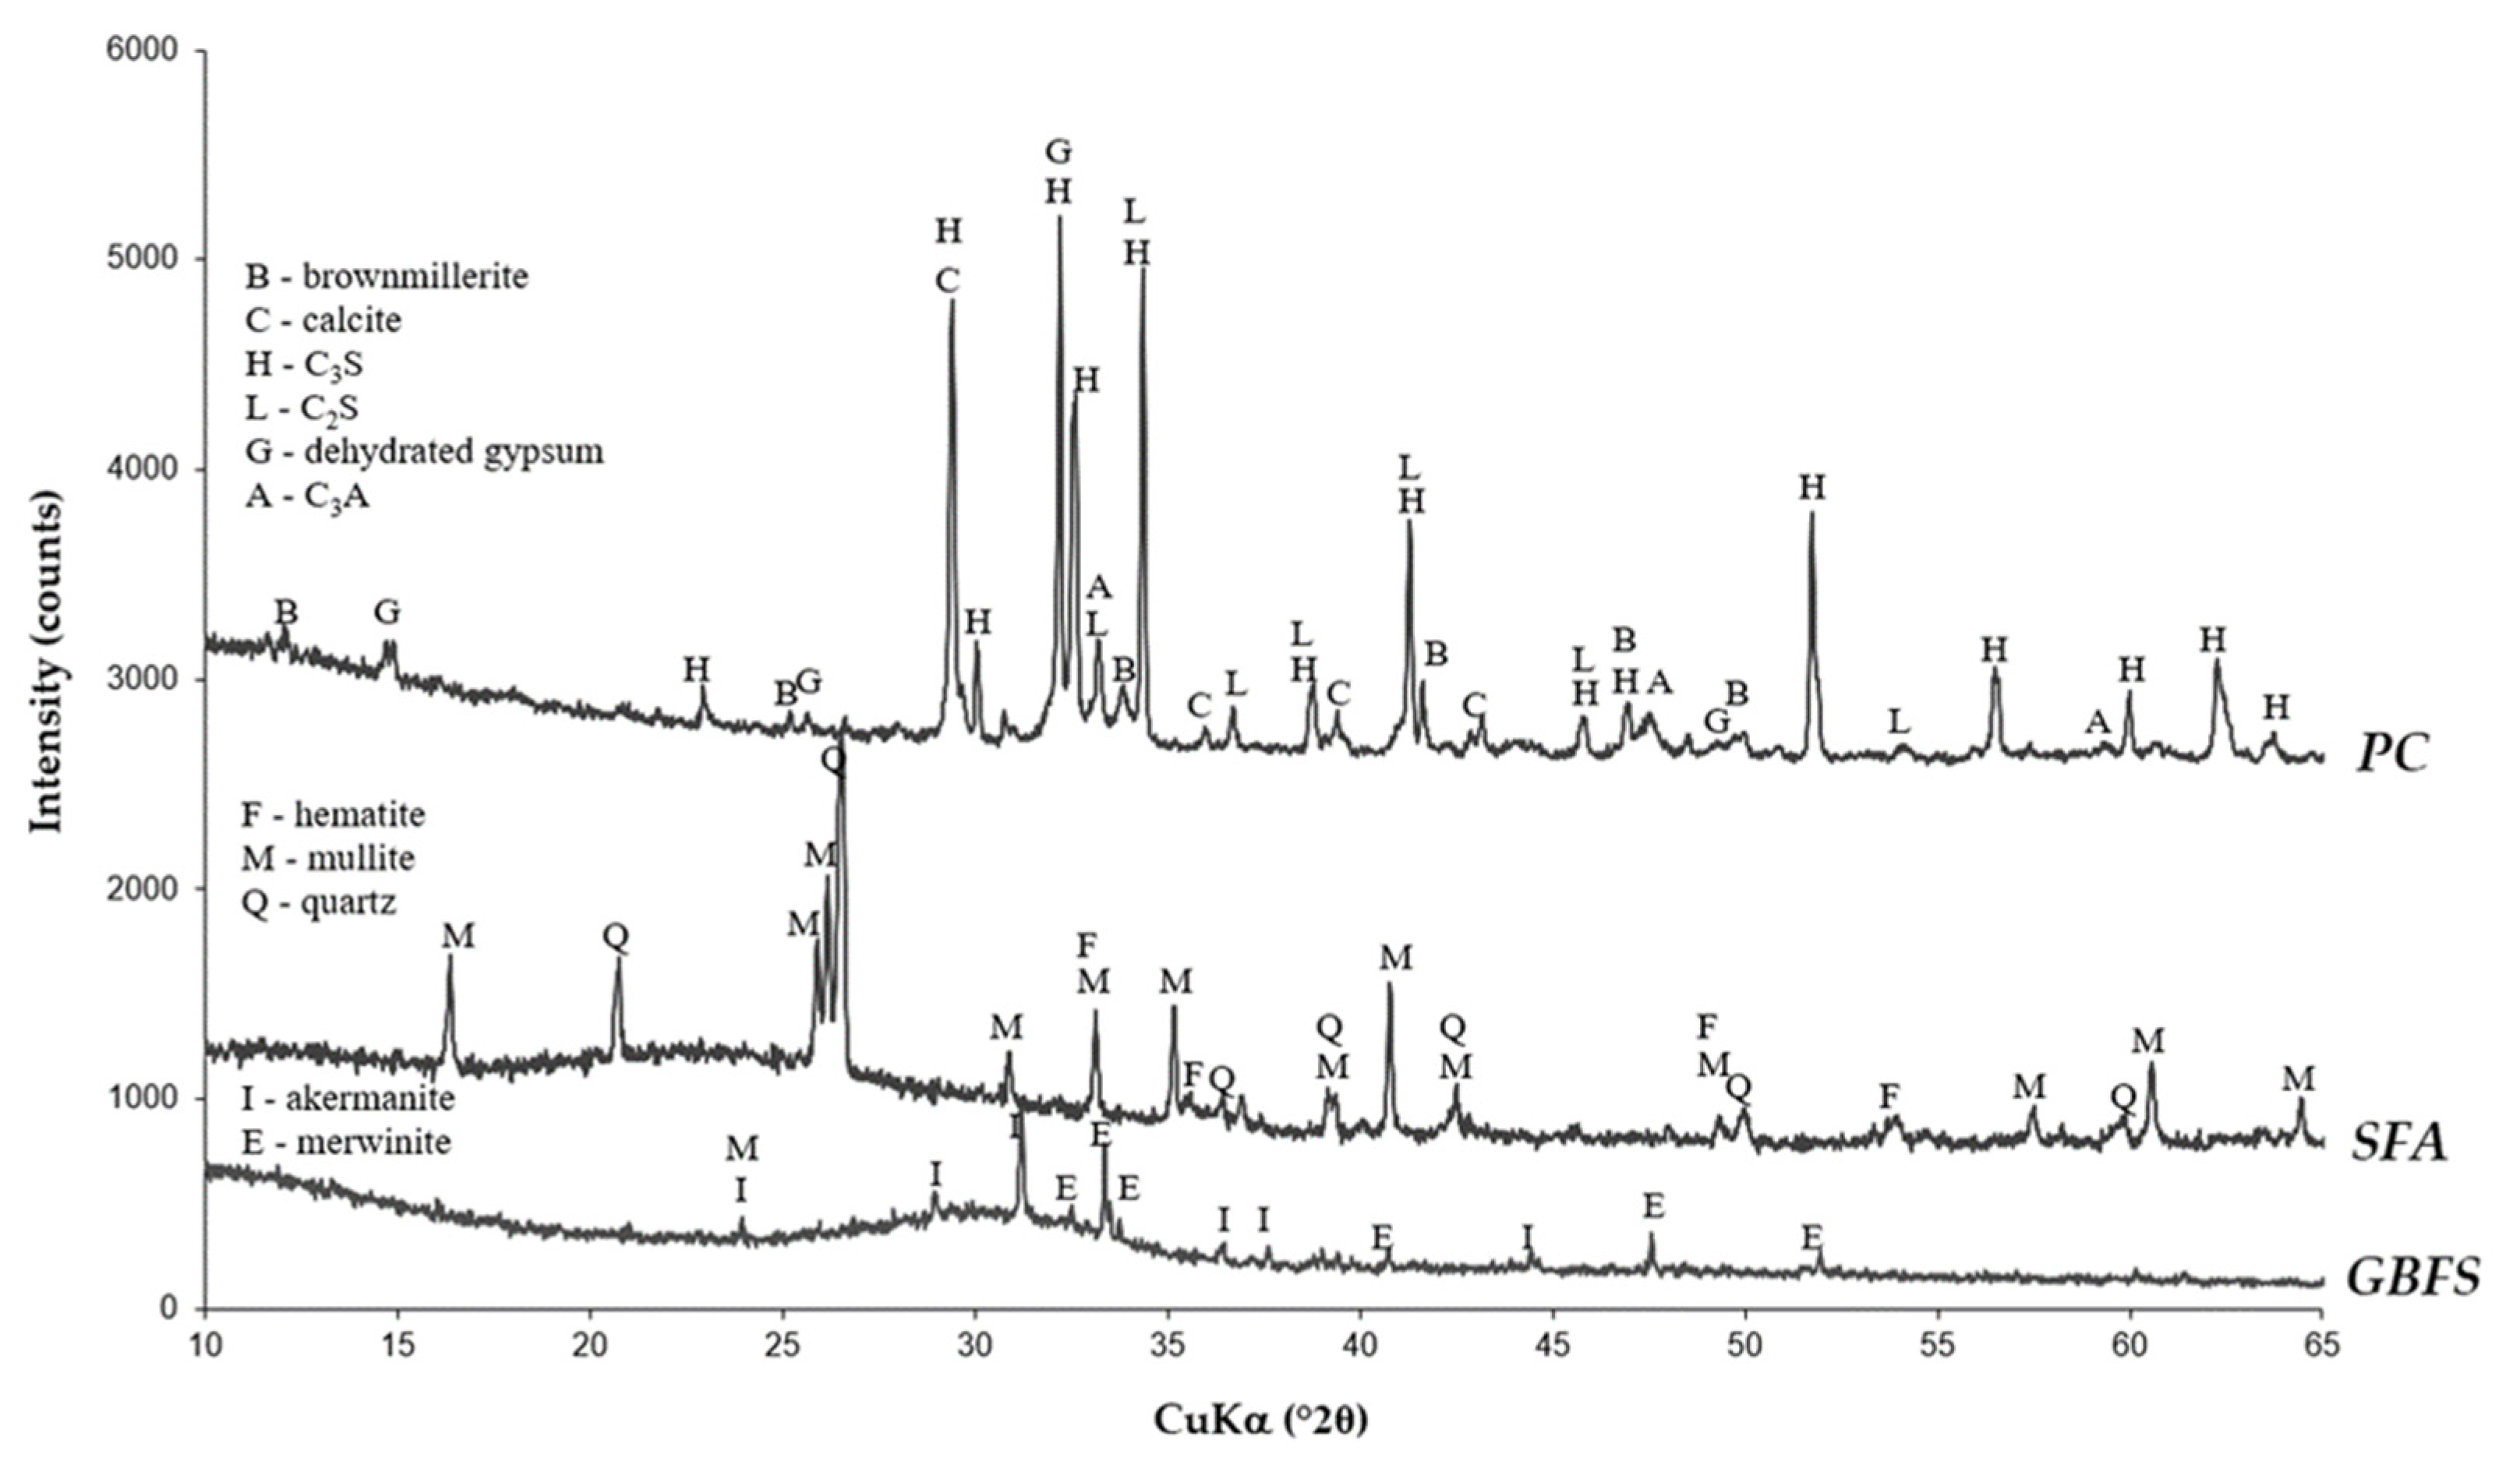
2.1. Materials

The materials used were the ordinary Portland cement type of CEM I 42.5R (PC) according to the PN-EN 197-1 standard [4], granulated blast furnace slag (GBFS), siliceous fly ash (SFA), and gypsum (G). The chemical composition and physical characteristics of these materials are presented in Table 1.
The XRD analysis of PC, GBFS and SFA (at 10–65°2θ range) is presented in Figure 1. The GBFS is composed of a glassy phase (a background signal at 24–38°2θ) with XRD peaks from the crystalline phases, such as akermanite and merwinite. For SFA, the identified phases were the glassy phase (a broad background signal at 16–38°2θ), mullite, quartz and hematite.
The GBFS and SFA used meet the requirements according to the PN-EN 197-1 standard [4]. The chemical modulus of GBFS (CaO + MgO + SiO2) and ((CaO + MgO)/SiO2) were 87.2% and 1.4%, respectively. For SFA, the reactive SiO2 content was 38.87%, while the contents of MgO, SO3, and Na2Oe (Na2Oe = Na2O + 0.658K2O) were 8.22, 1.51, and 3.13%, respectively. SFA showed 0.013% chloride ion composition.

2.2. Composition of Cement Mixtures and Measured Properties

In the study, three cement mixtures were prepared, and their compositions are shown in Table 2. The proportions between the components were selected to achieve the compositions of the cement types CEM II/C-M (S-V) and CEM VI (S-V) included in the PN-EN 197-5 standard [11]. Measurements included the period of development of standard strength (up to 28 days) and concerned the compressive strength, linear change, and phase composition of the cement mixture specimens. Evaluation of the microstructure of the cement mortars was carried out by SEM.
Compressive strength tests of the cement mortars were carried out on prismatic samples of 40 mm height, 40 mm width, and 160 mm length after 2, 7, and 28 days according to the procedure described in the PN-EN 196-1 standard [12].
Linear change measurements were performed on cement paste samples prepared with a water-to-cement ratio of 0.33. Cement pastes were molded into prismatic samples of 25 mm height, 25 mm width, and 100 mm length. Molded samples were stored for 24 h in a high-moisture atmosphere and at a temperature of 20 °C. Samples were then removed from the molds and stored under water at a temperature of 20 °C until testing. Linear changes in cement paste prisms were investigated in the Grauf–Kaufman apparatus every day for up to 7 days.
The identification of the phase composition of the cement paste samples prepared with a water-to-cement ratio of 0.33 was determined using the X-ray diffraction (XRD) technique. A Philips X’Pert Pro MD diffractometer (Cu Kα1 line monochromatized with a Ge(111) monochromator) was used. The standard Bragg–Brentano geometry with a θ-2θ setup was applied (0.008° step size and 5–90°2θ range). Studies were performed for cement pastes 60PC-20GBFS-15SFA and 40PC-40GBFS-15SFA after 2, 7, 14, and 28 days.
The microstructure of the cement paste was observed with the FEI Nova NanoSEM 200 scanning electron microscope equipped with an EDS microanalyzer. Polished cross-sections of pastes were covered with a thin layer of carbon to avoid charging. Studies were made for the cement paste 60PC-20GBFS-15SFA after 2 and 28 days.

3. Results and Discussion

3.1. Compressive Strength of the Cement Mortar Samples

The compressive strength measurements were performed for all cement mixtures studied. Results are given in Table 3.
According to Table 3, after 2 days the strength of the 60PC-20GBFS-15SFA mixture was 13.73 MPa and achieved a minimum of 10 MPa as required by the PN-EN 197-1 standard [4]. After the same time period the 50PC-30GBFS-15SFA mixture represented a strength of 9.85 MPa, a drop of 28% compared to the 60PC-20GBFS-15SFA mixture. In the case of the 40PC-40GBFS-15SFA mixture, the strength was only 6.34 MPa and about two times lower compared to the 60PC-20GBFS-15SFA mixture. The factor determining the drop in the early strength of the 50PC-30GBFS-15SFA and 40PC-40GBFS-15SFA mixtures is lower content of CEM I 42.5R in the mixtures, forcing a lower content of alite (C3S). The lower content of C3S gives a lower increase in the calcium silicate hydrate phase (C-S-H) after 2 days of hydration, especially in the case of the 40PC-40GBFS-15SFA mixture.
From Table 3, after 7 days, the strength of the 50PC-30GBFS-15SFA and 40PC-40GBFS-15SFA mixtures was still lower than that of the 60PC-20GBFS-15SFA mixture, but the difference between the strength of these cement mixtures was less. After 7 days the strength of the 40PC-40GBFS-15SFA mortar was 23.49 MPa, while the strength of the 50PC-30GBFS-15SFA and 60PC-20GBFS-15SFA mixtures was 19.75 MPa and 17.69 MPa, respectively. The high increase in the strength of the 40PC-40GBFS-15SFA mortar in the period from 2 to 7 days, two and half times compared to the strength after 2 days, results from the highest content of granulated blast furnace slag of laten hydraulic properties in this mixture. After 7 days the strength of the 40PC-40GBFS-15SFA mortar met the required 16 MPa according to the PN-EN 197-1 standard [4].
As is shown in Table 3, after 28 days, the strength of the 60PC-20GBFS-15SFA, 50PC-30GBFS-15SFA, and 40PC-40GBFS-15SFA mortars was 41.73 MPa, 40.13 MPa, and 37.68 MPa, respectively, and achieved a minimum of 32.5 MPa as required by the PN-EN 197-1 standard [4]. After 28 days the drop in strength of the 40PC-40GBFS-15SFA mixture was only 4% compared to the 60PC-20GBFS-15SFA mixture.
According to requirements of the PN-EN 197-1 standard [4], the 60PC-20GBFS-15SFA and 50PC-30GBFS-15SFA mixtures can be classified as CEM II/C-M (S-V) cements the 32.5R and 32.5N strength classes, respectively, while the 40PC-40GBFS-15SFA mixture corresponds to CEM VI (S-V) cement of the 32.5N strength class.

3.2. Linear Changes in the Cement Paste Samples

The linear changes were defined as the change in the length of the prismatic cement paste samples. Length changes are given in Table 4.
All the cement pastes studied showed dimensional stability for up to 7 days, as shown in Table 4. No or little shrinkage was observed due to the hydration process. These slight linear changes in the initial curing period probably resulted from the disappearance of monocarboaluminates in favor of higher amounts of ettringite.

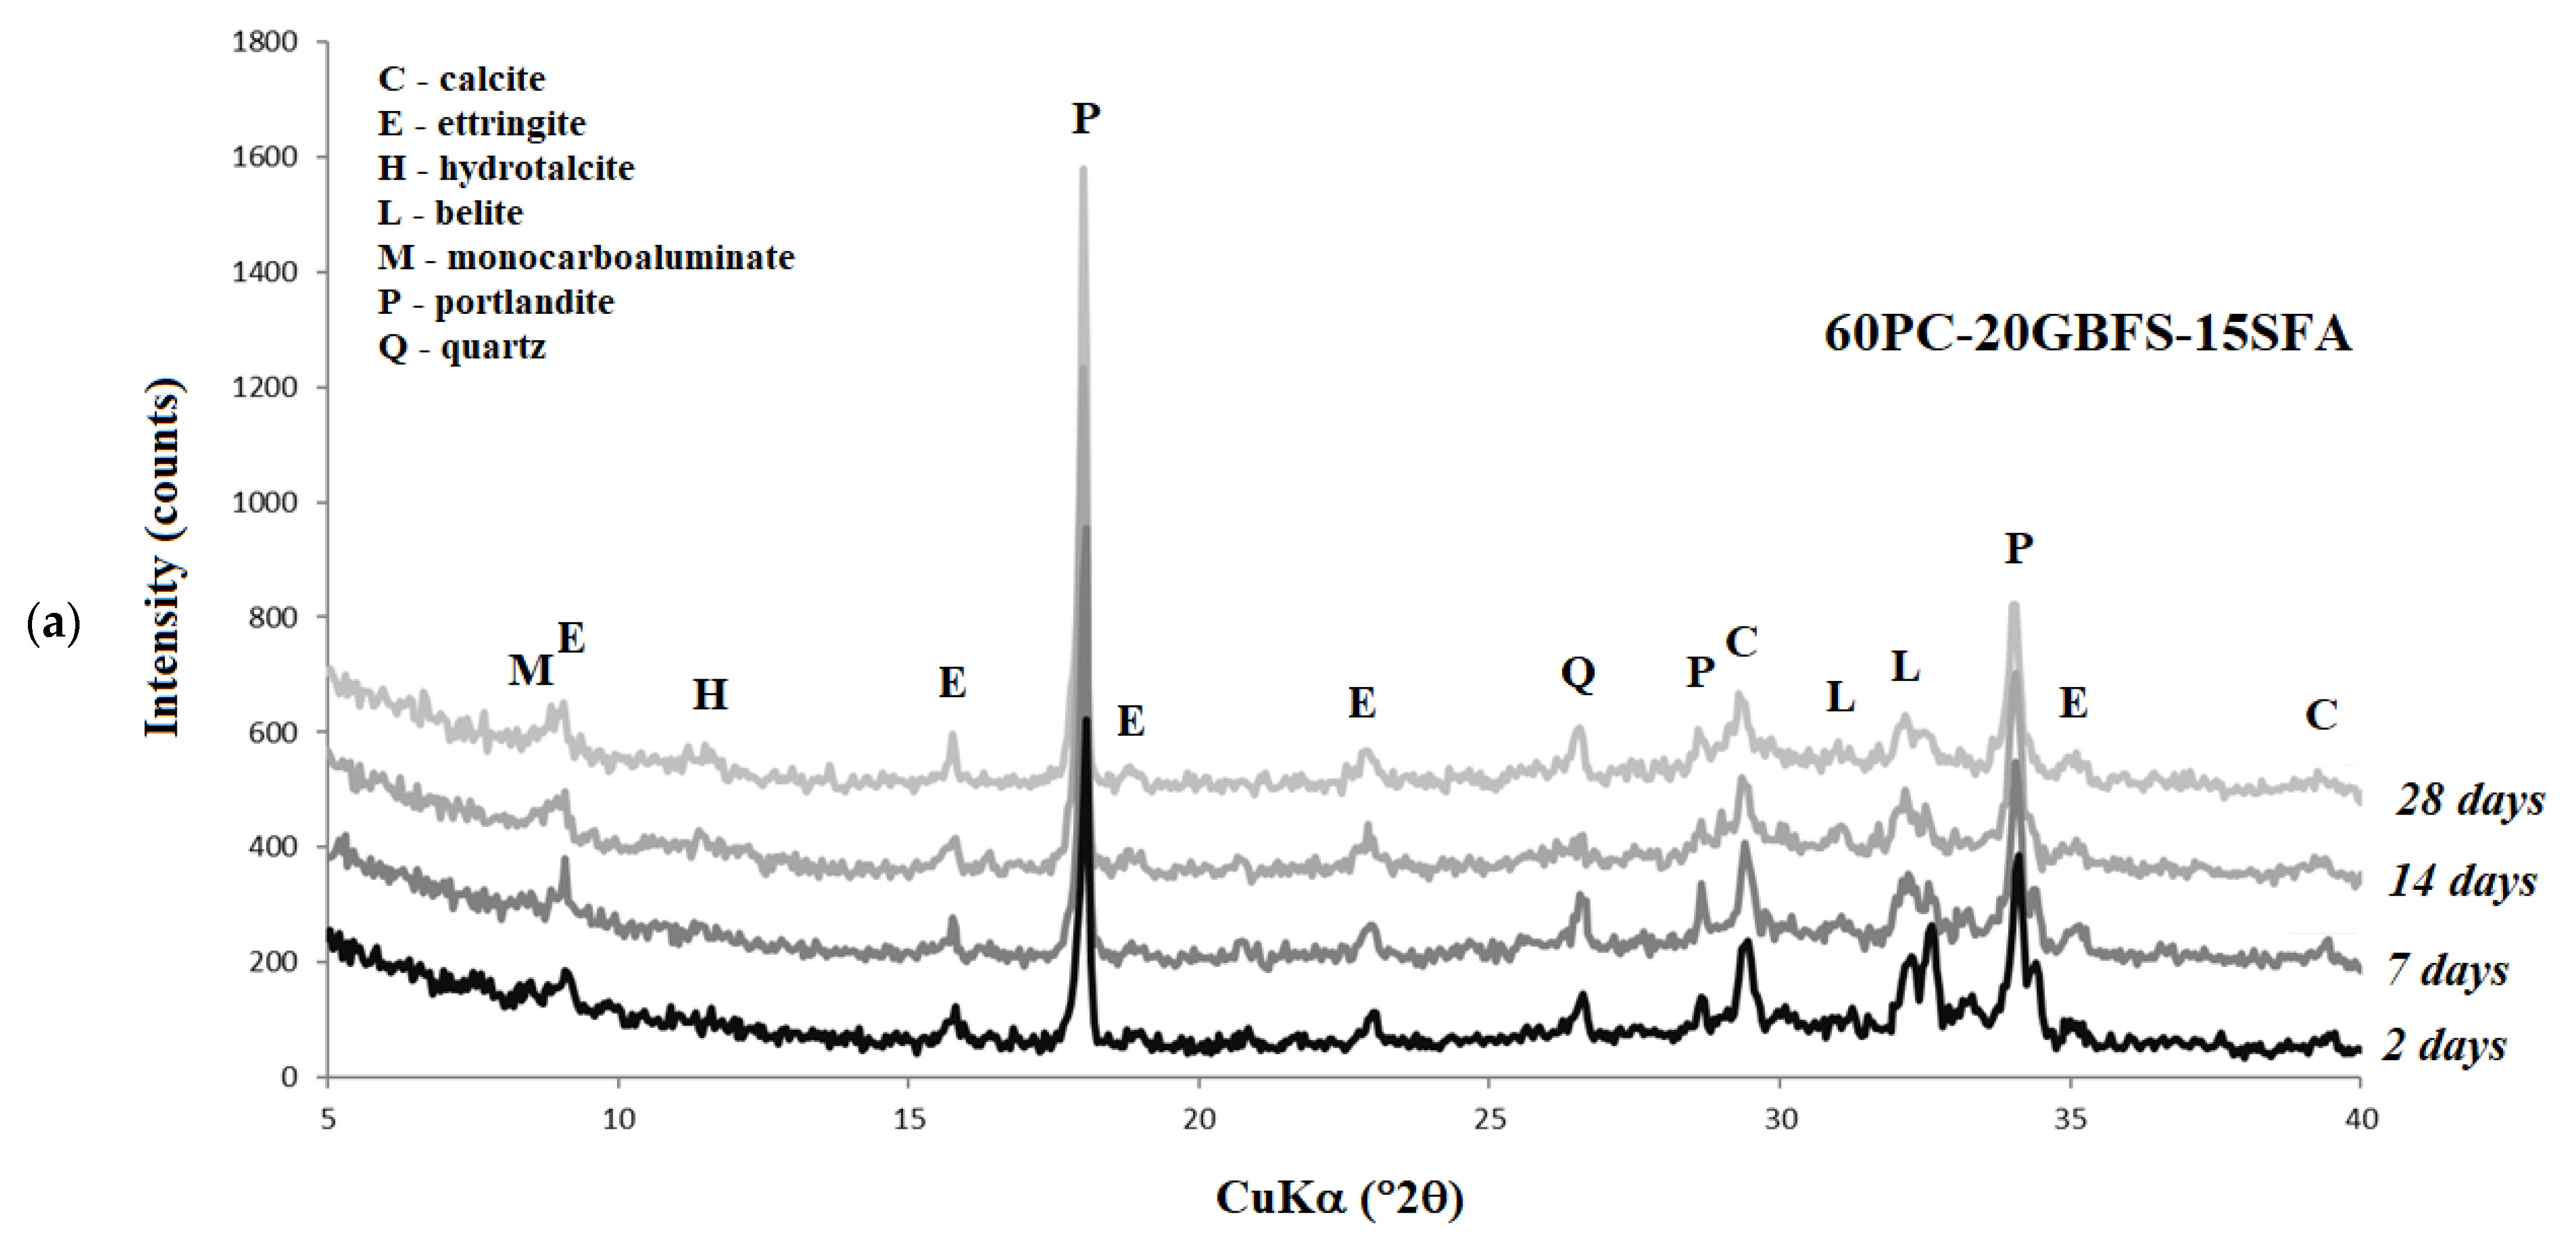
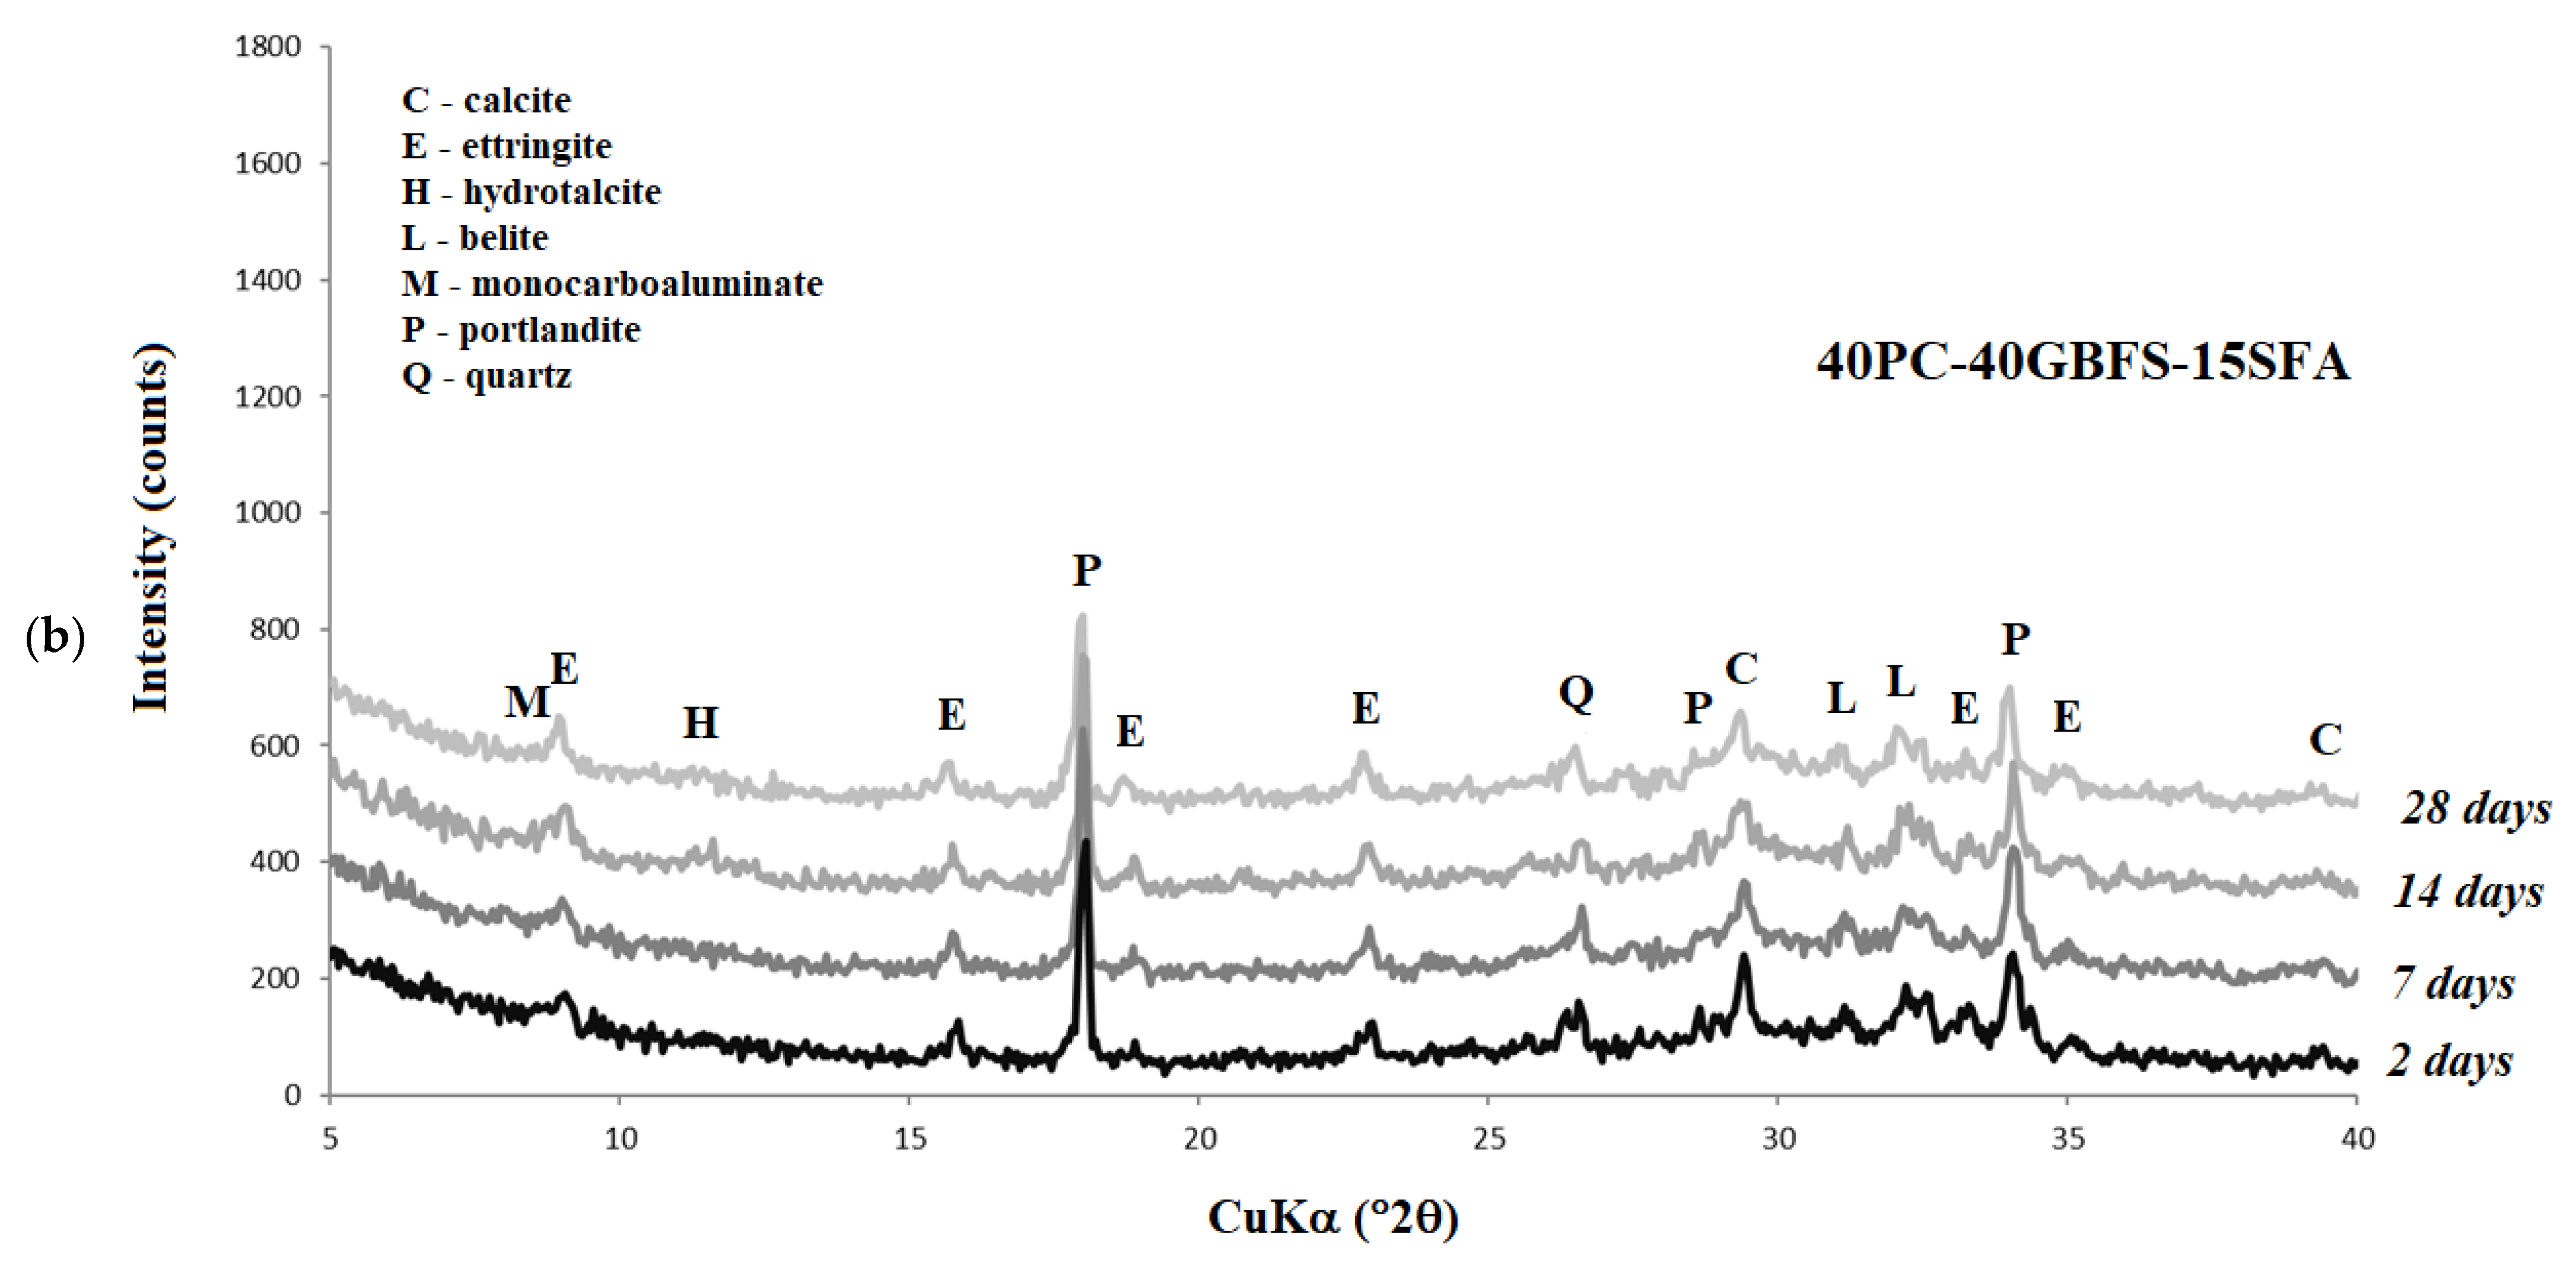
3.3. Phase Composition of the Cement Paste Samples

Phase composition analysis was performed for the 60PC-20GBFS-15SFA and 40PC-40GBFS-15SF cement pastes. The XRD patterns after 2, 7, 14, and 28 days of hydration are presented in Figure 2.
For the cement paste samples with a higher proportion of Portland cement (60PC-20GBFS-15SFA cement paste), more hydration products were formed (Figure 2a); mainly portlandite. Ettringite dominated among the reaction products of the aluminate phase. After 7 and 14 days the monocarboaluminate was visible. After 28 days the hydrotalcite also appeared.

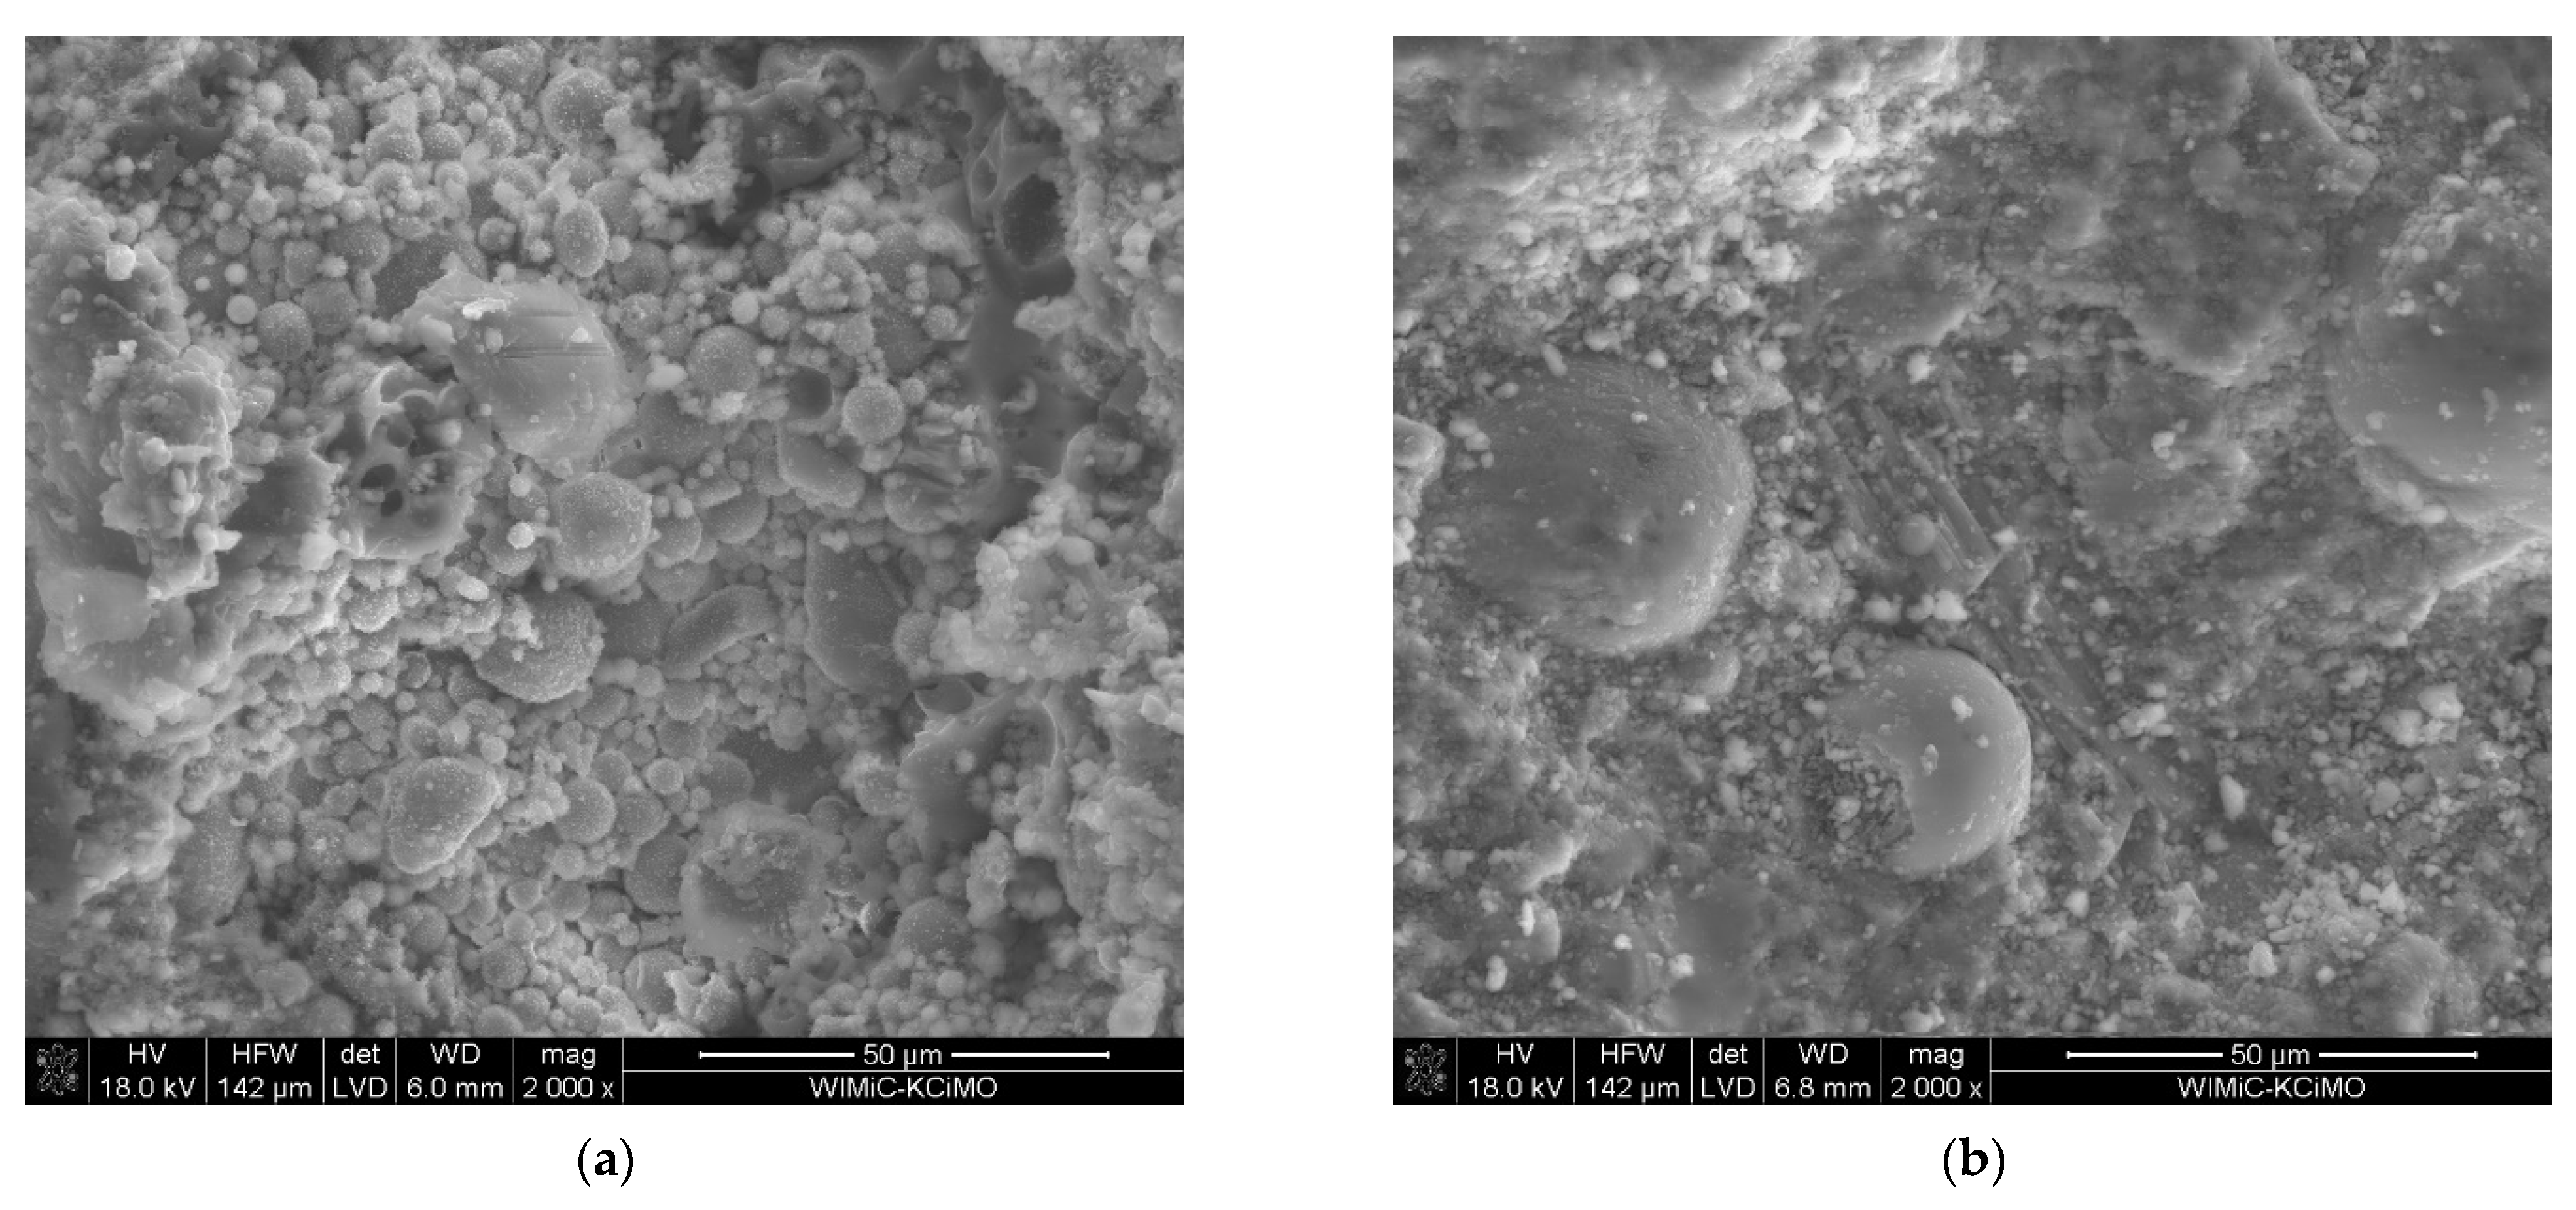
3.4. Microstructure of Cement Paste Samples

Figure 3a and b present the SEM images of the 60PC-20GBFS-15SFA cement paste with a magnification of 2000 times after 2 and 28 days of hydration, respectively.
As shown in Figure 3a, after 2 days of hydration, the microstructure of the 60PC-20GBFS-15SFA cement paste was porous, which, as is known from the literature [2], is associated with a slower hydration process of the 60PC-20GBFS-15SFA mixture in the early stages. This is due to the fact that the 60PC-20GBFS-15SFA mixture contains less CEM I 42.5R and, as a result, less C-S-H phase is formed after 2 days of hydration. As the hydration process is carried out, the microstructure of the 60PC-20GBFS-15SFA becomes denser, similar to previous results [13] (hydration products of Portland cement and granulated blast furnace slag, as shown in Figure 3b). However, after 28 days, the siliceous fly ashes were still unreacted; siliceous fly ashes do not represent hydraulic properties, but only pozzolanic properties, which become apparent over a longer period of time [2].

4. Conclusions

The following conclusions can be drawn based on the results presented above:
  • According to requirements of the PN-EN 197-1 standard the 60PC-20GBFS-15SFA and 50PC-30GBFS-15SFA mixtures can be classified as CEM II/C-M (S-V) cements of the 32.5R and 32.5N strength classes, respectively, while the 40PC-40GBFS-15SFA mixture corresponds to the CEM VI (S-V) cement of the 32.5N strength class.
  • Slight linear changes in the initial curing period of the cement pastes studied may be due to the disappearance of monocarboaluminates in favor of an increase in the amount of ettringite.
  • Changes in the dynamics of the hydration process and an increase in the strength of the mortar may result in sealing the cement mortar microstructure with a compact C-S-H.

Author Contributions

E.T. and G.M.: Conceptualization, methodology, formal analysis, investigation, resources, visualization; E.T.: writing—original draft preparation, writing—review and editing, supervision. All authors have read and agreed to the published version of the manuscript.

Funding

Publication cost of this paper was covered with founds of the Polish National Agency for Academic Exchange (NAWA): “MATBUD’2023–Developing international scientific cooperation in the field of building materials engineering” BPI/WTP/2021/1/00002, MATBUD’2023.

Institutional Review Board Statement

Not applicable.

Informed Consent Statement

Not applicable.

Data Availability Statement

Not applicable.

Acknowledgments

This research was supported from the subsidy of the Ministry of Education and Science for the AGH University of Science and Technology in Kraków (Project No 16.16.160.557).

Conflicts of Interest

The authors declare no conflict of interest.

References

  1. Andrew, R.; Peters, G. The Global Carbon Project’s fossil CO2 Emissions Dataset: 2021 Release; CICERO Center for International Climate Research: Oslo, Norway, 2021; Available online: https://zenodo.org/record/5569235/files/GCP%20fossilCO2%202021v34.pdf (accessed on 20 November 2022).
  2. Kurdowski, W. Chemistry of Cement and Concrete; Polish Scientific Publishers PWN: Warszawa, Poland, 2010. [Google Scholar]
  3. Bjegovic, D.; Strimer, N.; Serdar, M. Ecological aspects of concrete production. In Proceedings of the Second International Conference on Sustainable Construction Materials and Technologies, Ancona, Italy, 28–30 June 2010; Zachar, J., Claisse, P., Naik, T.R., Ganjian, E., Eds.; UWM Center for By-Products Utlilization: Milwaukee, WI, USA, 2010; pp. 1483–1492. [Google Scholar]
  4. PN-EN 197-1; Cement—Part 1: Composition, Specifications and Conformity Criteria for Common Cements. iTeh Standards: Warszawa, Poland, 2012.
  5. Giergiczny, Z. Fly ash and slag. Cem. Concr. Res. 2019, 124, 105826. [Google Scholar] [CrossRef]
  6. Król, A.; Giergiczny, Z.; Kuterasińska-Warwas, J. No TitleProperties of Concrete Made with Low-Emission Cements CEM II/C-M and CEM VI. Materials 2020, 13, 2257. [Google Scholar] [CrossRef] [PubMed]
  7. Deschner, F.; Winnefeld, F.; Lothenbach, B.; Seufert, S.; Schwesig, P.; Dittrich, S.; Goetz-Neunhoeffer, F.; Neubauer, J. Hydration of Portland cement with high replacement by siliceous fly ash. Cem. Concr. Res. 2012, 42, 1389–1400. [Google Scholar] [CrossRef]
  8. Sakai, E.; Miyahara, S.; Ohsawa, S.; Lee, S.H.; Daimon, M. Hydration of fly ash cement. Cem. Concr. Res. 2005, 35, 1135–1140. [Google Scholar] [CrossRef]
  9. Schuldyakov, K.V.; Kramar, L.Y.; Trofimov, B.Y. The properties of slag cement and its influence on the structure of the hardened cement paste. Procedia Eng. 2016, 150, 1433–1439. [Google Scholar] [CrossRef] [Green Version]
  10. Roy, D.M.; Malek, R.I. Hydration of slag cement. In Progress in Cement and Concrete: Mineral Admixtures in Cement and Concrete; ABI Books Pvt. Ltd.: Delhi, India, 1993; pp. 84–117. [Google Scholar]
  11. PN-EN 197-5; Cement—Part 5: Composition, Specifications and Conformity Criteria for Portland Composite-Cement and Composite Cement. iTeh Standards: Warszawa, Poland, 2021.
  12. PN-EN 196-1:2016; Methods of Testing Cement—Part 1: Determination of Strength. iTeh Standards: Warszawa, Poland, 2016.
  13. Wieczorek, M.; Pichniarczyk, P. Wpływ zmiennego stosunku popiołu lotnego krzemionkowego do granulowanego żużla wielkopiecowego na właściwości cementu. In Proceedings of the XI Konferencja „Dni Betonu: Tradycja i nowoczesność”, Wisła, Poland, 11–13 October 2021; Stowarzyszenie Producentów Cementu: Kraków, Poland, 2021; pp. 683–696. [Google Scholar]
Figure 1. XRD patterns of PC, GBFS and SFA.
Materproc 13 00011 g001
Figure 2. XRD patterns of the (a) 60PC-20GBFS-15SFA and (b) 40PC-40GBFS-15SFA cement pastes after 2, 7, 14, and 28 days.
Materproc 13 00011 g002aMaterproc 13 00011 g002b
Figure 3. SEM micrographs of the 60PC-20GBFS-15SFA cement paste after (a) 2 days and (b) 28 days.
Materproc 13 00011 g003
Table 1. Chemical composition and physical characteristics of the materials.
ParameterPCGBFSSFAG
Chemical composition (%)SiO2,
Al2O3
Fe2O3
CaO
MgO
SO3
Na2O
K2O
TiO2
P2O5
Residue
LOI
Cl
Reactive SiO2
21.62
2.37
1.51
62.12
1.57
2.03
0.42
0.84
0.15
0.18
3.42
3.77
0.097
36.25
8.68
0.23
42.70
8.22
1.51
0.57
0.39
0.41
0.03
0.92
0.10
0.014
49.67
27.77
6.96
2.78
1.37
0.93
1.48
2.51
1.60
0.82
0.48
3.66
0.013
38.87
3.70
1.29
0.64
35.61
0.40
39.20
0.12
0.22
0.07
0.03
0.28
18.45
0.036
Density (g/cm3)3.042.892.111.49
Blaine surface area (cm2/g)3810412027405250
Particle size distribution (%) (1)D10, µm
D50, µm
D90, µm
4.4
17.4
45.7
0.7
13.2
34.7
5.8
52.5
239.9
1.0
5.8
45.7
(1) D10, D50, D90: the portion of particles with diameters smaller than this value is 10, 50, and 90%, respectively; D50 is also known as the median diameter.
Table 2. Compositions of the cement mixtures studied.
SymbolPC (%)GBFS (%)SFA (%)G (%)Cement Type According to the PN-EN 197-5 Standard [11]
60PC-20GBFS-15SFA
50PC-30GBFS-15SFA
40PC-40GBFS-15SFA
60
50
40
20
30
40
15
15
15
5
5
5
CEM II/C-M (S-V)
CEM II/C-M (S-V)
CEM VI (S-V)
Table 3. Compressive strength of the cement mortar samples.
Cement MixtureCompressive Strength (MPa)
2 Days7 Days28 Days
60PC-20GBFS-15SFA
50PC-30GBFS-15SFA
40PC-40GBFS-15SFA
13.73
9.85
6.34
23.49
19.75
17.69
41.73
40.13
37.68
Table 4. Length changes of the cement paste prismatic samples.
Cement MixtureLength Changes (mm)
1 Day2 Days3 Days4 Days5 Days6 Days7 Days
60PC-20GBFS-15SFA
50PC-30GBFS-15SFA
40PC-40GBFS-15SFA
0.00
0.00
0.00
−0.05
−0.09
−0.05
−0.01
−0.01
−0.06
−0.01
0.00
−0.04
−0.01
0.00
−0.06
−0.01
0.01
−0.05
0.00
0.00
−0.04
Disclaimer/Publisher’s Note: The statements, opinions and data contained in all publications are solely those of the individual author(s) and contributor(s) and not of MDPI and/or the editor(s). MDPI and/or the editor(s) disclaim responsibility for any injury to people or property resulting from any ideas, methods, instructions or products referred to in the content.

