1. Introduction
Breast cancer (BC) is the most common type of cancer in women in the world. BC accounts for about 12 percent of newly diagnosed cancers and 25 percent of all cancers in women [
1]. According to the statistics of the World Health Organization [
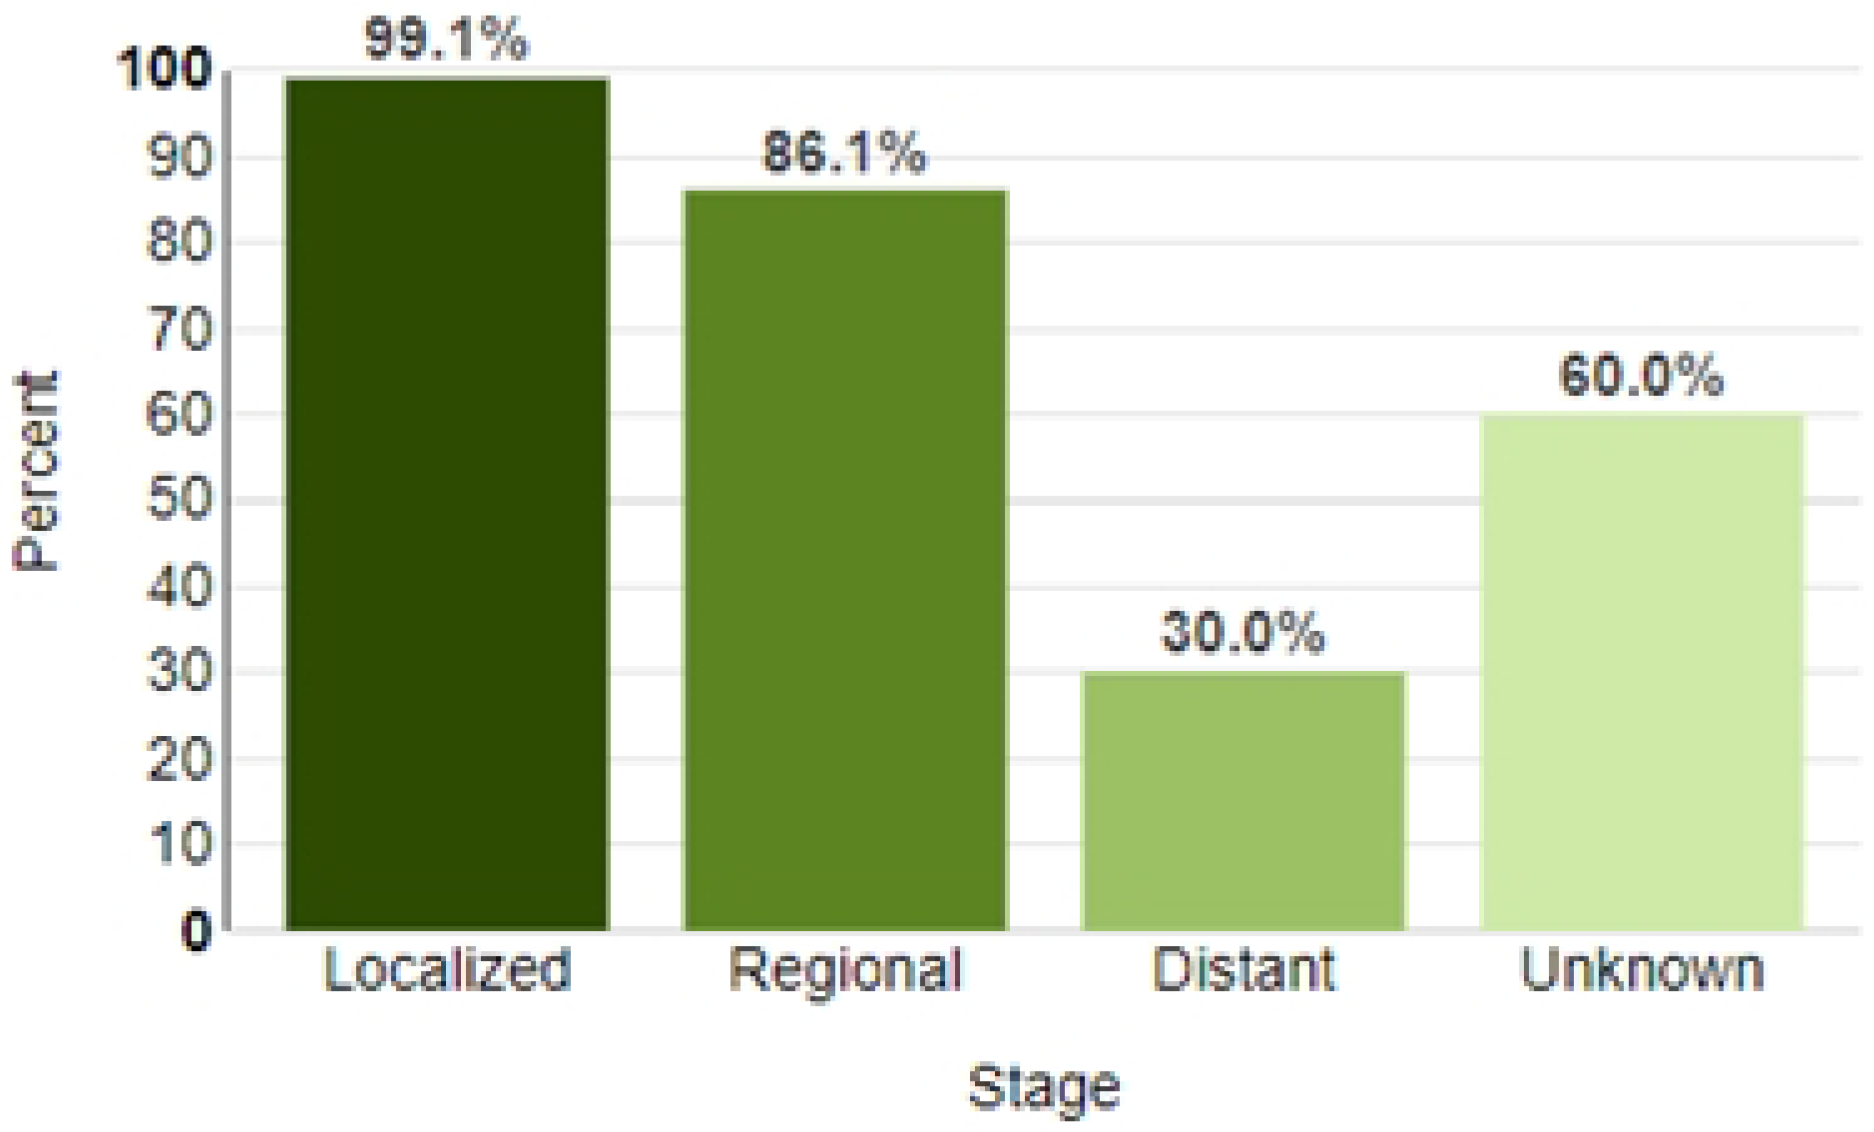
1], more than 2.3 million cases of BC were diagnosed worldwide in 2020, which accounted for approximately 24.5% of all cancer cases, and more than 680 thousand patients with diagnosed BC died. The early diagnosis of BC significantly reduces the risk of death. The survival rate for early BC diagnosis approaches 99.1%, and the mortality rate reaches 70% for late diagnosis [
2] (
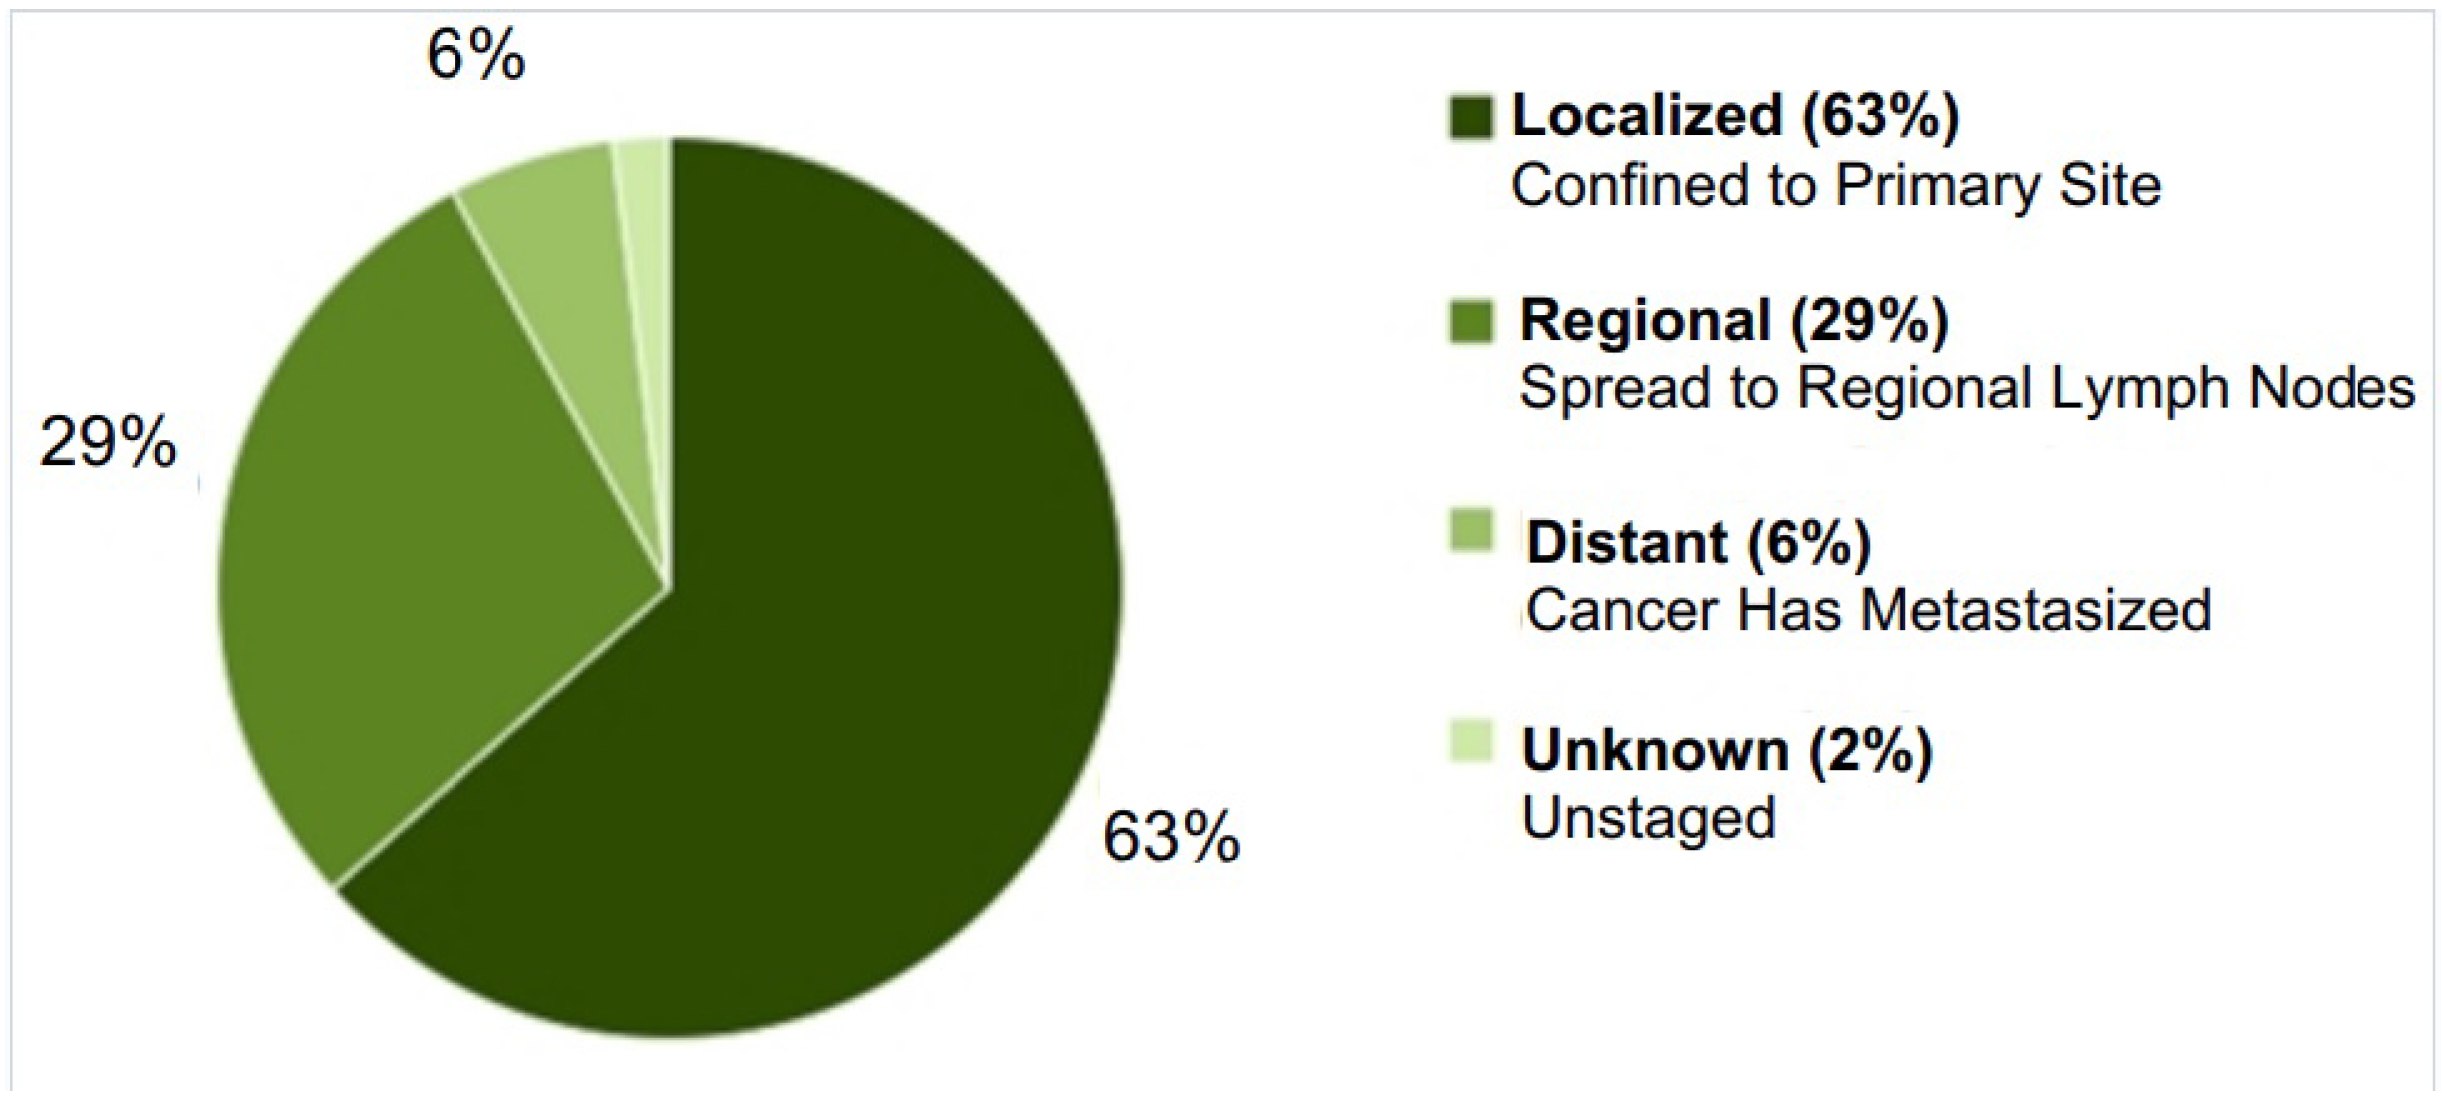
Figure 1). At the same time, the early diagnosis of breast cancer cannot be considered sufficient, since the localized stage accounts for only 64% of newly diagnosed cases of breast cancer (
Figure 2) [
2].
The incidence and mortality of breast cancer increased rapidly in developing countries [
3,
4,
5]. Therefore, along with early diagnostic methods such as mammograms, clinical breast exams, and breast self-exams, it is of interest to develop new methods of additional minimally invasive clinical diagnostics that could improve early detection and prognosis in breast cancer. Such new approaches can be created using methods and algorithms of artificial intelligence, thereby creating a predictive system for the early diagnosis of breast cancer based on a number of biophysiological parameters of the patient. This paper is devoted to the creation of a predictive system for the early diagnosis of breast cancer by analyzing the tumor microenvironment and its cytokines. The tumor microenvironment (TME) is a microenvironment that is formed as a result of the interaction between tumor tissue and the cells of the immune system that infiltrate it. The concentration of TME cytokines in the blood varies depending on the activity of the tumor and the presence of a metastatic process. As shown in [
6], the mediator imbalance of the MCO, its special characteristics, can be used for diagnosing and predicting tumor development. In the previous work of [
6], the authors analyzed changes in the concentration of cytokines in the TME for breast cancer for two cases—for the incubation of tumor biopsies and for biopsies of unchanged breast tissue with the determination of spontaneous cytokine production for analyzing the cytokine concentrations in blood serum. This work describes the experience of creating a predictive system based on the cytokine concentrations in blood serum, since this method seems to be more convenient for patients for early BC diagnosis.
The purpose of this work is to develop a predictive system for early BC diagnosis by the cytokine concentration in the blood serum.
2. Materials and Methods
Clinical research was carried out in the Regional Clinical Oncological Dispensary, Saratov, Russia. A total of 80 patients (50–69 years) with diagnosed breast cancer were involved in this clinical research.
The inclusion criteria were as follows: 1. age 50–69 years, 2. the I–IV stage of BC, 3. the signed consent to informed participation in the study.
The exclusion criteria were as follows: 1. malignant tumors of other localizations, 2. acute infectious diseases, 3. chronic diseases in an acute phase (bronchitis, bronchial asthma, pyelonephritis, etc.), 4. concomitant background in the form of somatic diseases in the sub- and decompensation stage (cardiovascular insufficiency, insufficiency circulatory, hepatic, renal failure, and diabetes mellitus).
The comparison group consisted of 26 almost healthy women with ages ranging from 41 to 62 years old.
The study was approved by the local ethics committee of the Medical University “Reaviz”, Saratov branch (protocol No. 7 dated 21 July 2017).
Healthy women of the comparison group and patients were examined in accordance with the Clinical Guidelines of the Russian Federation. The patients were classified by the BC stages according to the TNM classification, revision 7 (2012). The patients were divided into three groups. The zero study group included healthy women without BC. The first study group (local cancer, 37 (46%) patients) included patients with the first and second stages of BC; the second study group (spread cancer, 43 (54%) patients) included patients with the third and fourth stages.
Samples of seven blood serum cytokines were taken from women of the comparison group (n = 26) and from the patients with diagnosed BC (n = 80) before therapy. The following serum cytokines were obtained: MCP–1 (monocyte chemoattractant protein-1), VEGF (vascular endothelial growth factor), TNF–
(tumor necrosis factor-alpha), IFN–
(interferon gamma), TGF–
1 (transforming growth factor-beta1), G–CSF (granulocyte colony stimulating factor), and GM–CSF (granulocyte-macrophage colony-stimulating factor). The levels of MCP–1, VEGF, TNF–
, and IFN–
were determined by solid-phase ELISA (a set of reagents of Vector Best JSC, Novosibirsk). For the study of TGF–
1, G–CSF, and GM–CSF, a “sandwich” ELISA variant (three-stage) with mono- and polyclonal antibodies to cytokines (R&D Systems, UK) was used. To activate the inactive form of TGF–
1, blood serum was kept for 60 min before ELISA in an environment with pH 1–2.0, followed by neutralization to pH 7.2–7.6 [
6].
3. Statistical Analysis
At the first stage, a statistical analysis was carried out to determine the parameters that had the greatest impact on the stage of cancer.
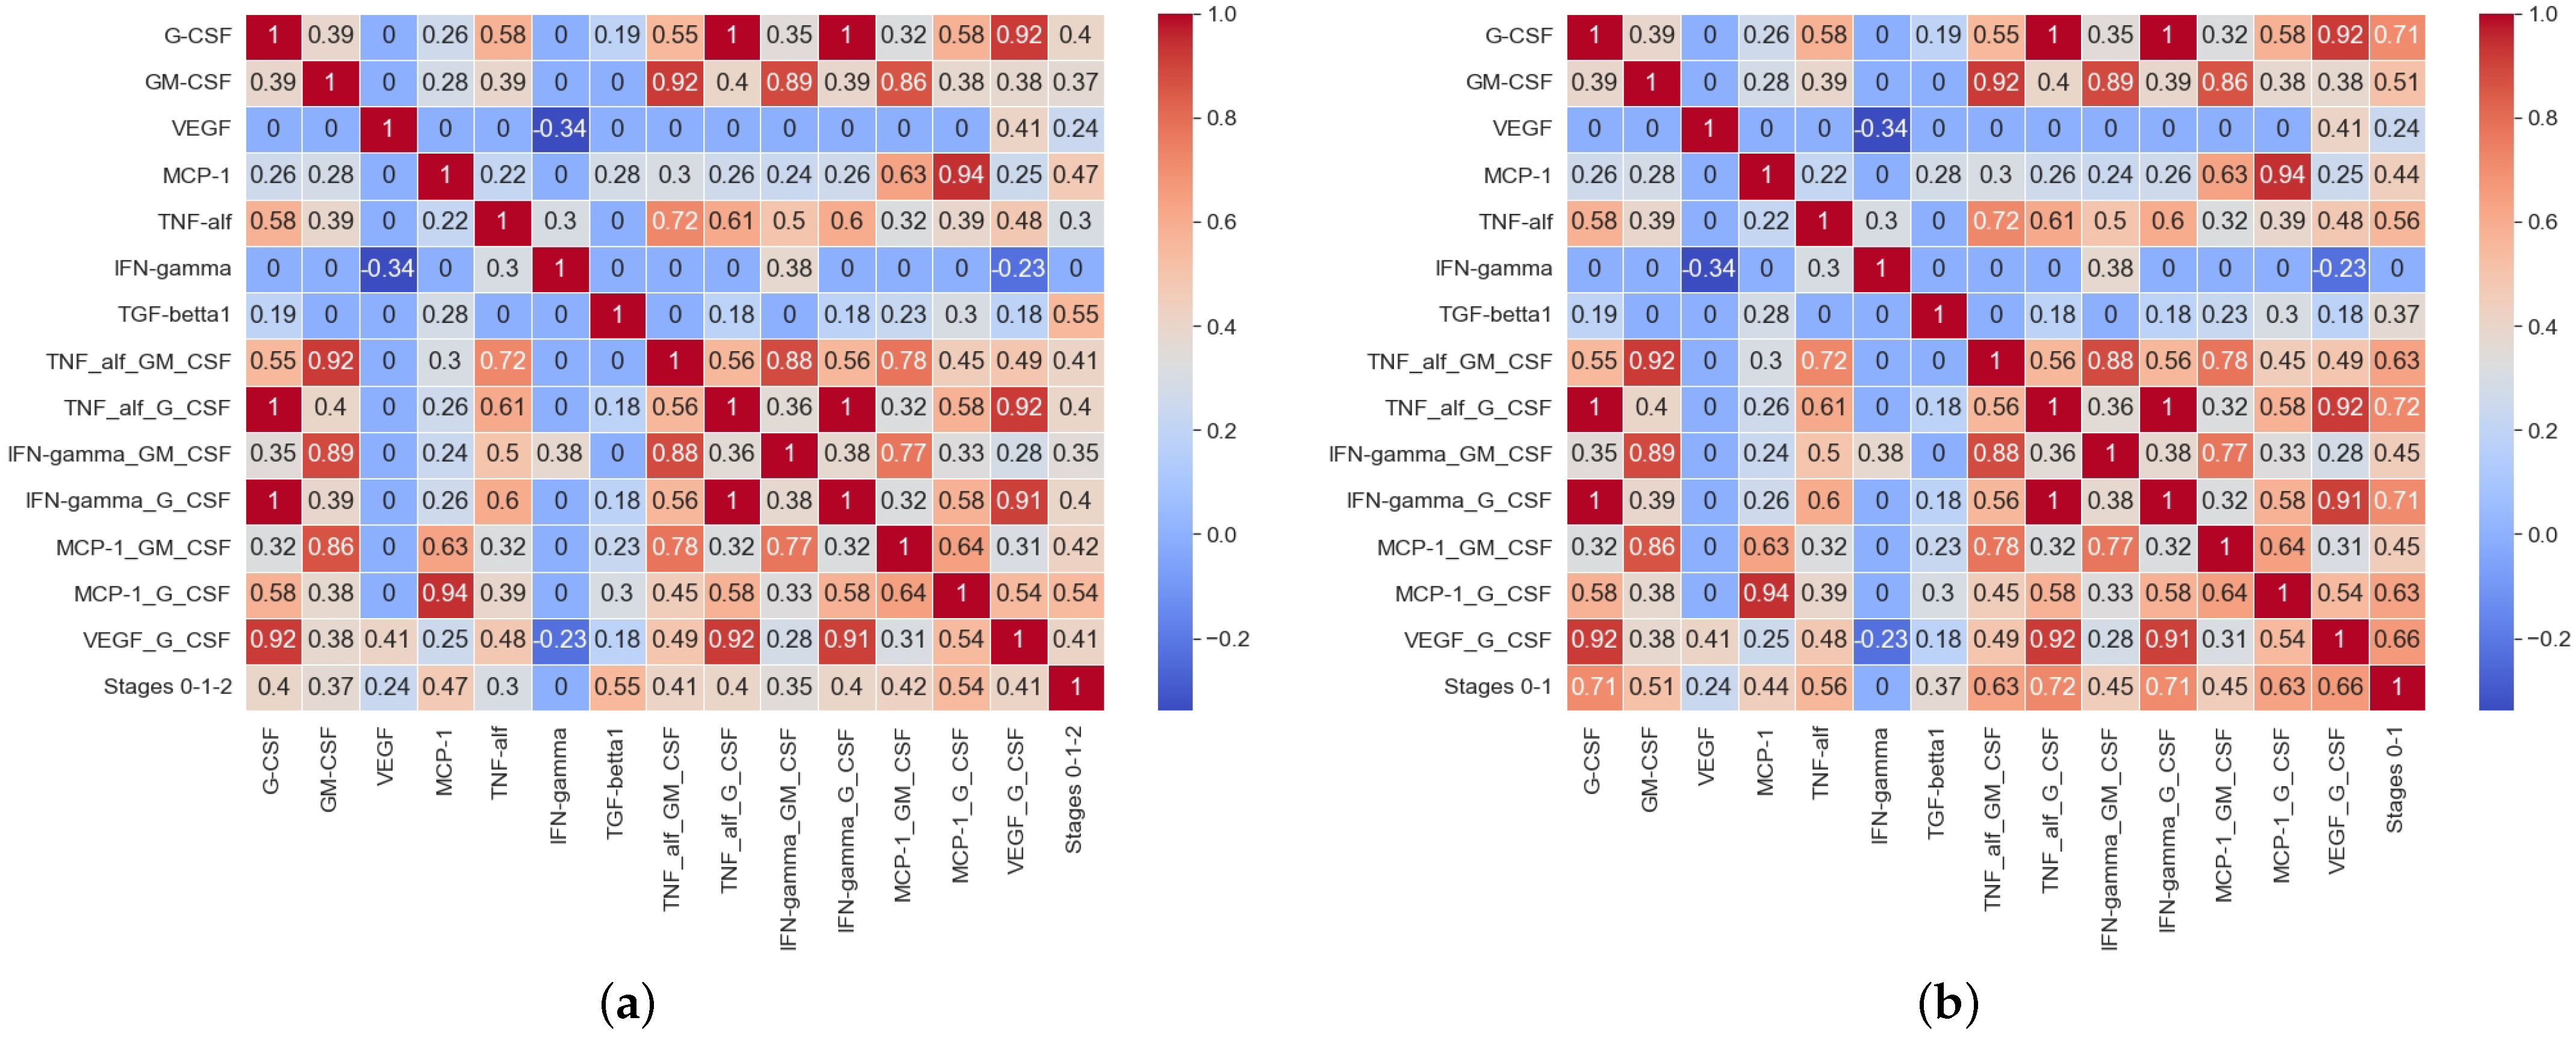
Figure 3 shows the matrix of paired correlation coefficients for the studied parameters for three groups of patients (no BC—stage 0, local cancer—stage 1, spread cancer—stage 2), and for two groups of patients, divided according to the principle—breast cancer is absent (stage 0) and breast cancer is diagnosed in any (local or spread) form (stage 1).
As can been seen in
Figure 3a, there was a positive correlation between the zero stage of BC (no BC), the local, and the spread BC stages and the cytokine concentrations in the blood serum: TGF–
1 (R = 0.58;
p < 0.05), MCP–1 (R = 0.5;
p < 0.05), and G–CSF (R = 0.43;
p < 0.05) showed positive correlations. meaning retained For GM–CSF (R = 0.41;
p > 0.05), TNF–
(R = 0.32;
p > 0.05), and VEGF (R = 0.24;
p > 0.05) the correlation with the BC stage was absent or had a non-linear nature. A completely different situation occurred when patients were divided into two groups according to the absence of BC and its presence. The results of the
t-test of the statistical significance of differences between these groups for the considered cytokines are shown in
Table 1.
From
Table 1, it follows that the concentrations of all considered cytokines, except for IFN–
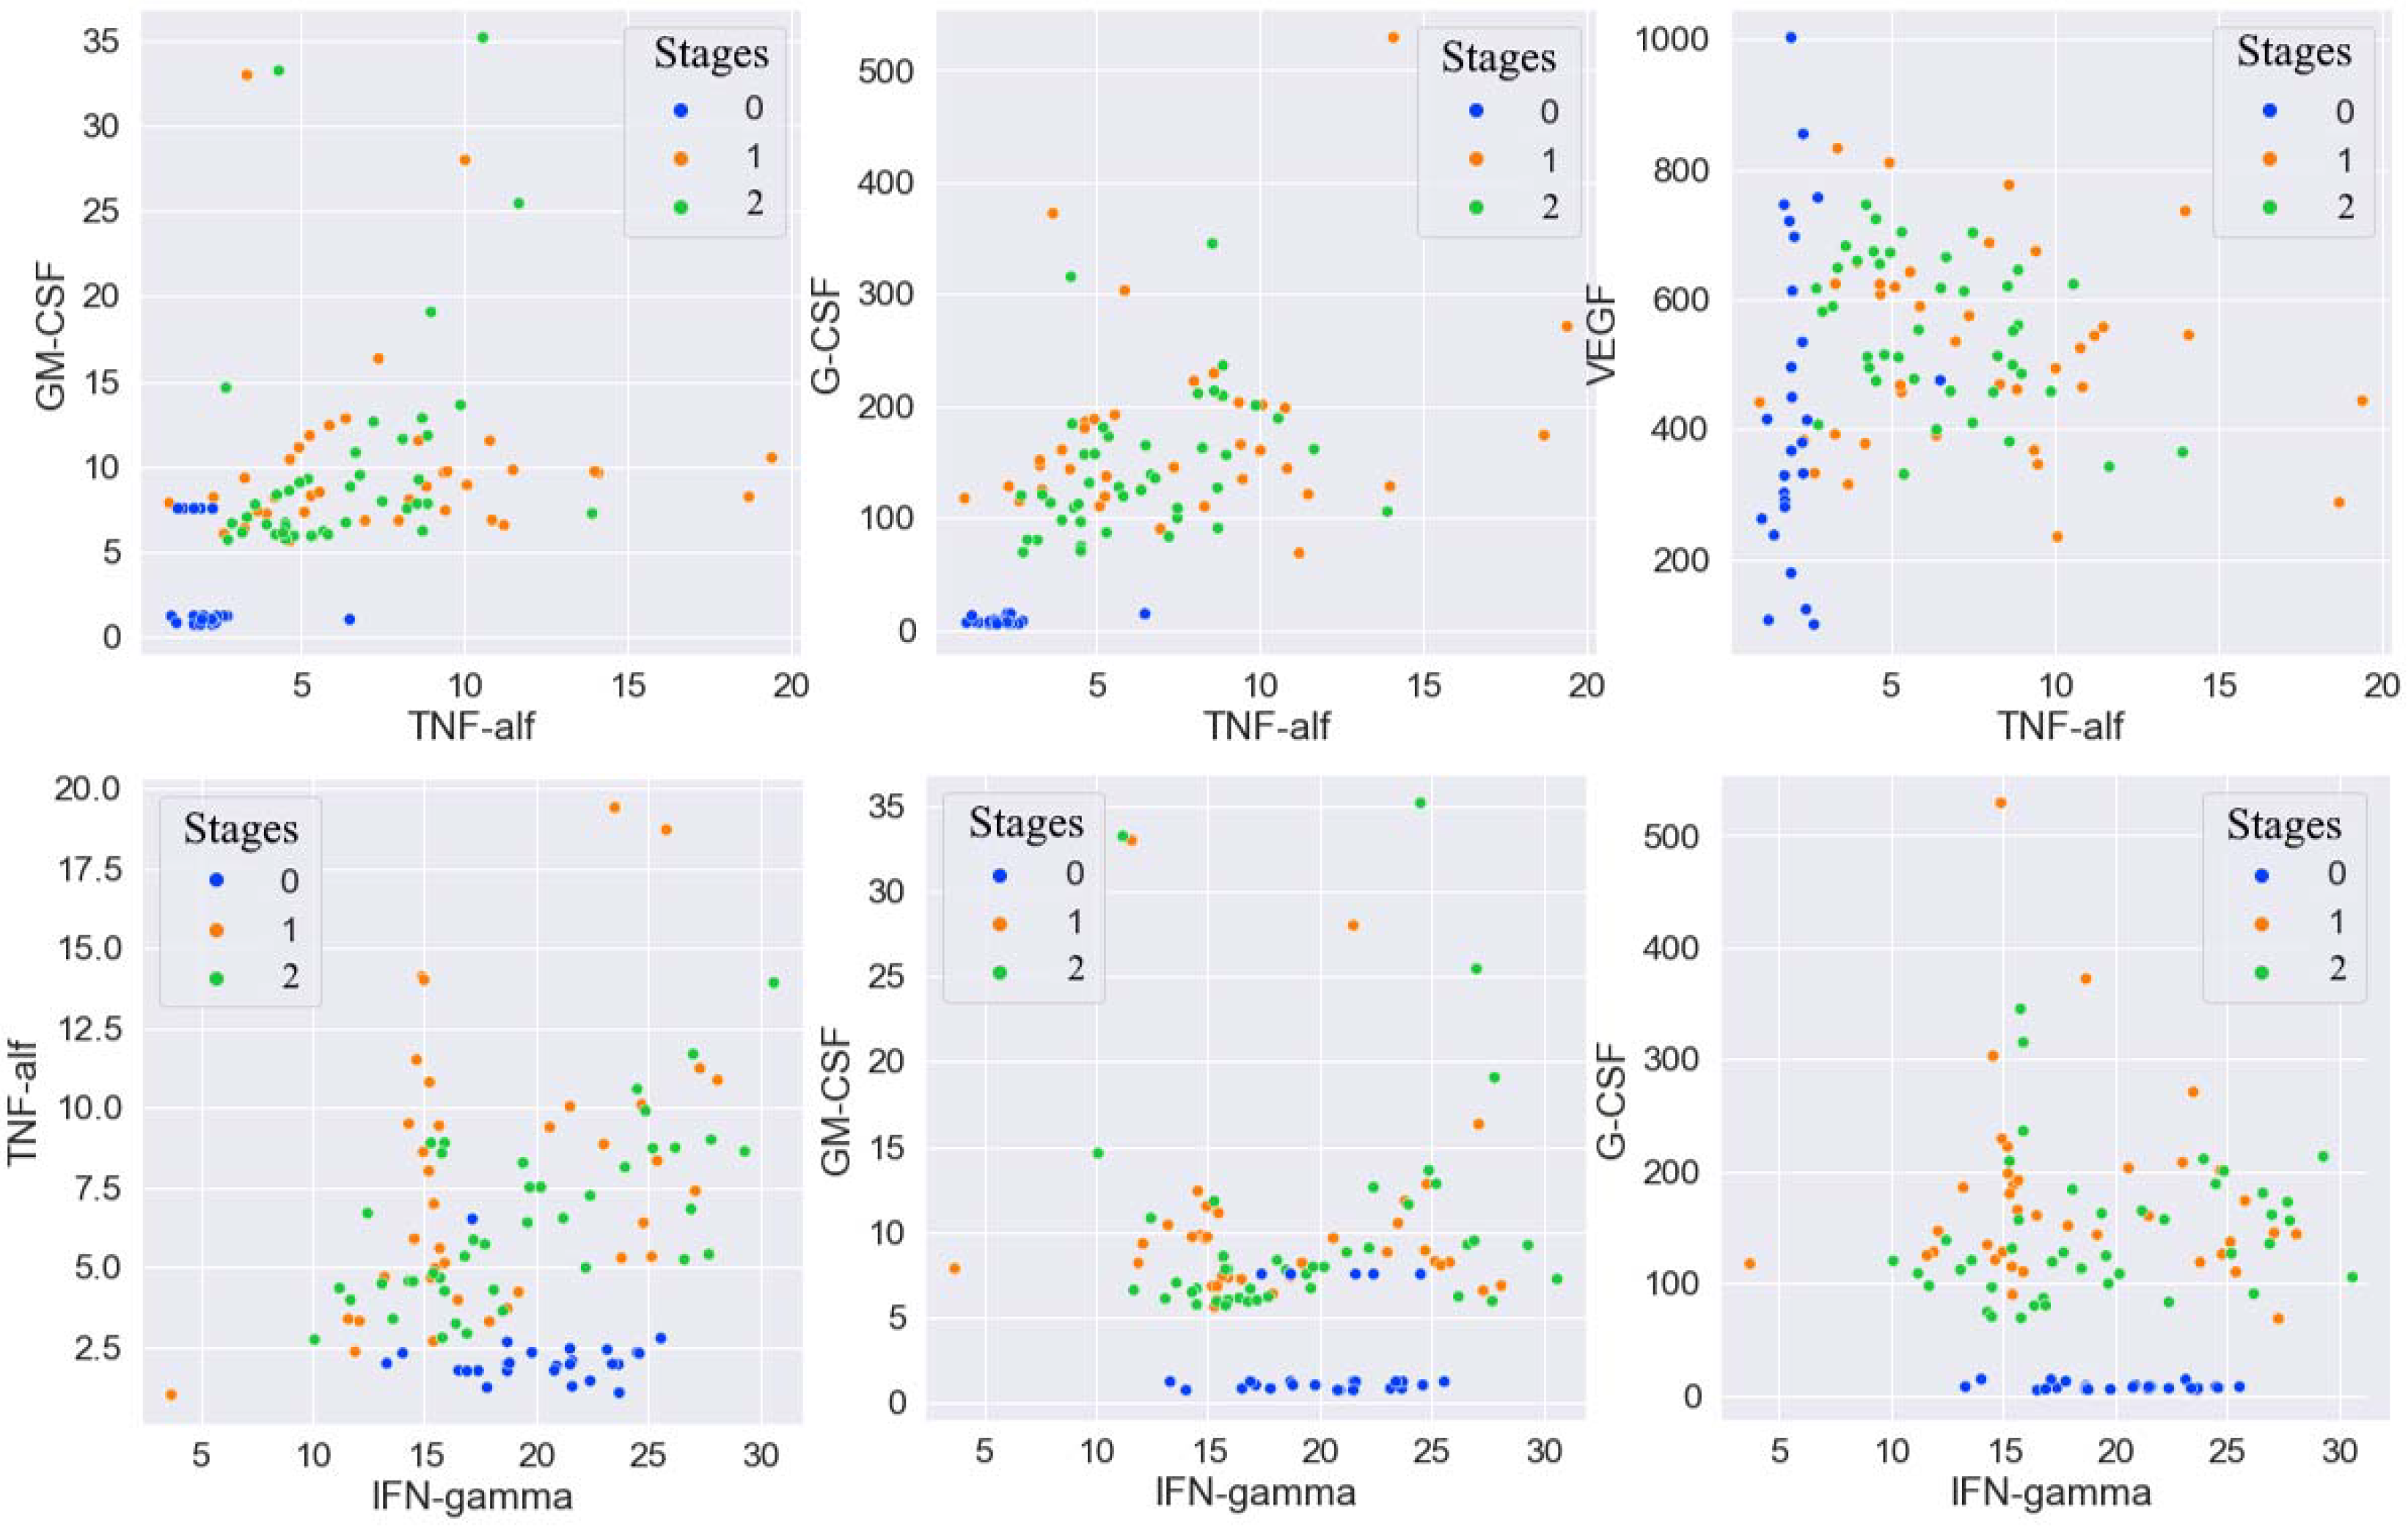
, were statistically significant and different for patients with and without BC. To visualize the obtained results, scatter diagrams were constructed for all pairwise combinations of cytokines. Some of these diagrams are shown in
Figure 4. As follows from the scatter diagrams, although IFN–
did not correlate in any way with the presence or absence of BC, combinations of IFN–
and some other cytokines made it possible to quite clearly identify the intervals for these cytokines values in which not a single case of BC was observed.
Based on the results of a preliminary statistical analysis, it was decided that it was necessary to construct new combinations of features for training a predictive machine learning model.
4. Machine Leaning and Predictive Algorithm
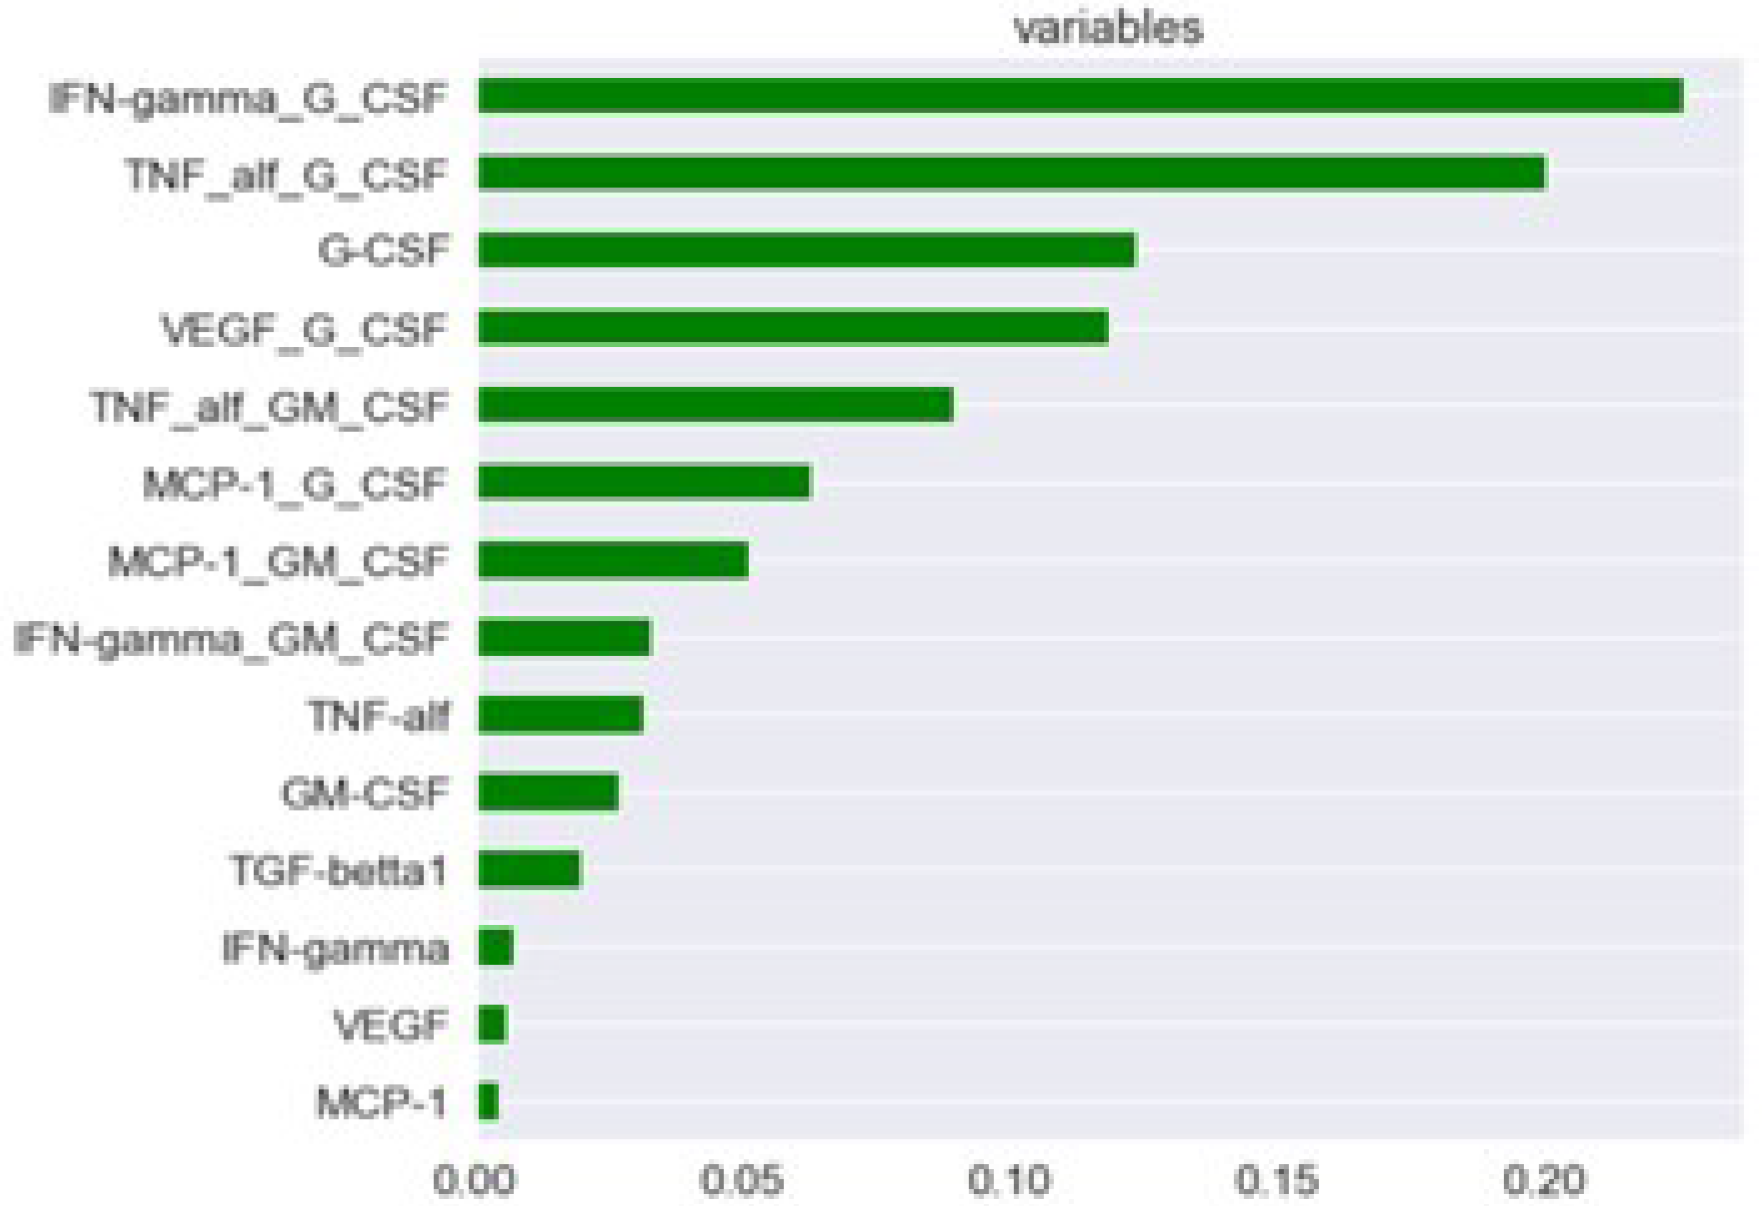
The following combinations of cytokines were taken as new features for training the predictive classification model: TNF– and GM–CSF, TNF– and G–CSF, IFN– and GM–CSF, IFN– and G–CSF, MCP–1 and GM–CSF, MCP–1 and G–CSF, VEGF, and G–CSF.
An importance diagram is shown in
Figure 5. As can be seen in
Figure 5, the vast majority of constructed parameters had a more significant effect on the target variable than the cytokines. Therefore, the model was trained on the constructed parameters and on the G–CSF cytokine.
The formulated problem was reduced to solving the classification problem when we assigned the patient to one of two categories (0—no BC and 1—yes BC) based on the values of the parameters. To solve the problem, the Gradient Boosting for Classification algorithm and supervised learning were used. Gradient Boosting is a machine learning technique that is widely used to solve regression and classification problems. In fact, it represents the decision as a set of weak prediction models, which are typically decision trees [
7,
8]. This method works well on samples with heterogeneous data and is able to effectively find non-linear relationships in data of various natures. The main set of patients was randomly divided into training and test sets, but in such a way that the resulting sets were statistically the same with a reliability coefficient no worse than 0.05. The best parameters for the Gradient Boosting for Classification algorithm were selected using a Randomized Search on Hyperparameters (RandomizedSearchCV), which allows for the quick exploration of a wide ranges of parameters of predictive algorithms and their impact on the accuracy of the generated forecast. For the case under consideration, the following parameters were recognized as the best parameters for the Gradient Boosting for Classification: n_estimators = 1500, min_samples_split = 8, min_samples_leaf = 3, max_features = 5, max_depth = 4, and learning_rate = 0.001, where n_estimators is the number of gradient boost steps; learning_rate is the learning rate; max_features is the number of features to consider when looking for the best split; and max_depth is the maximum depth of individual regression scores, which limits the node quantities in the tree.
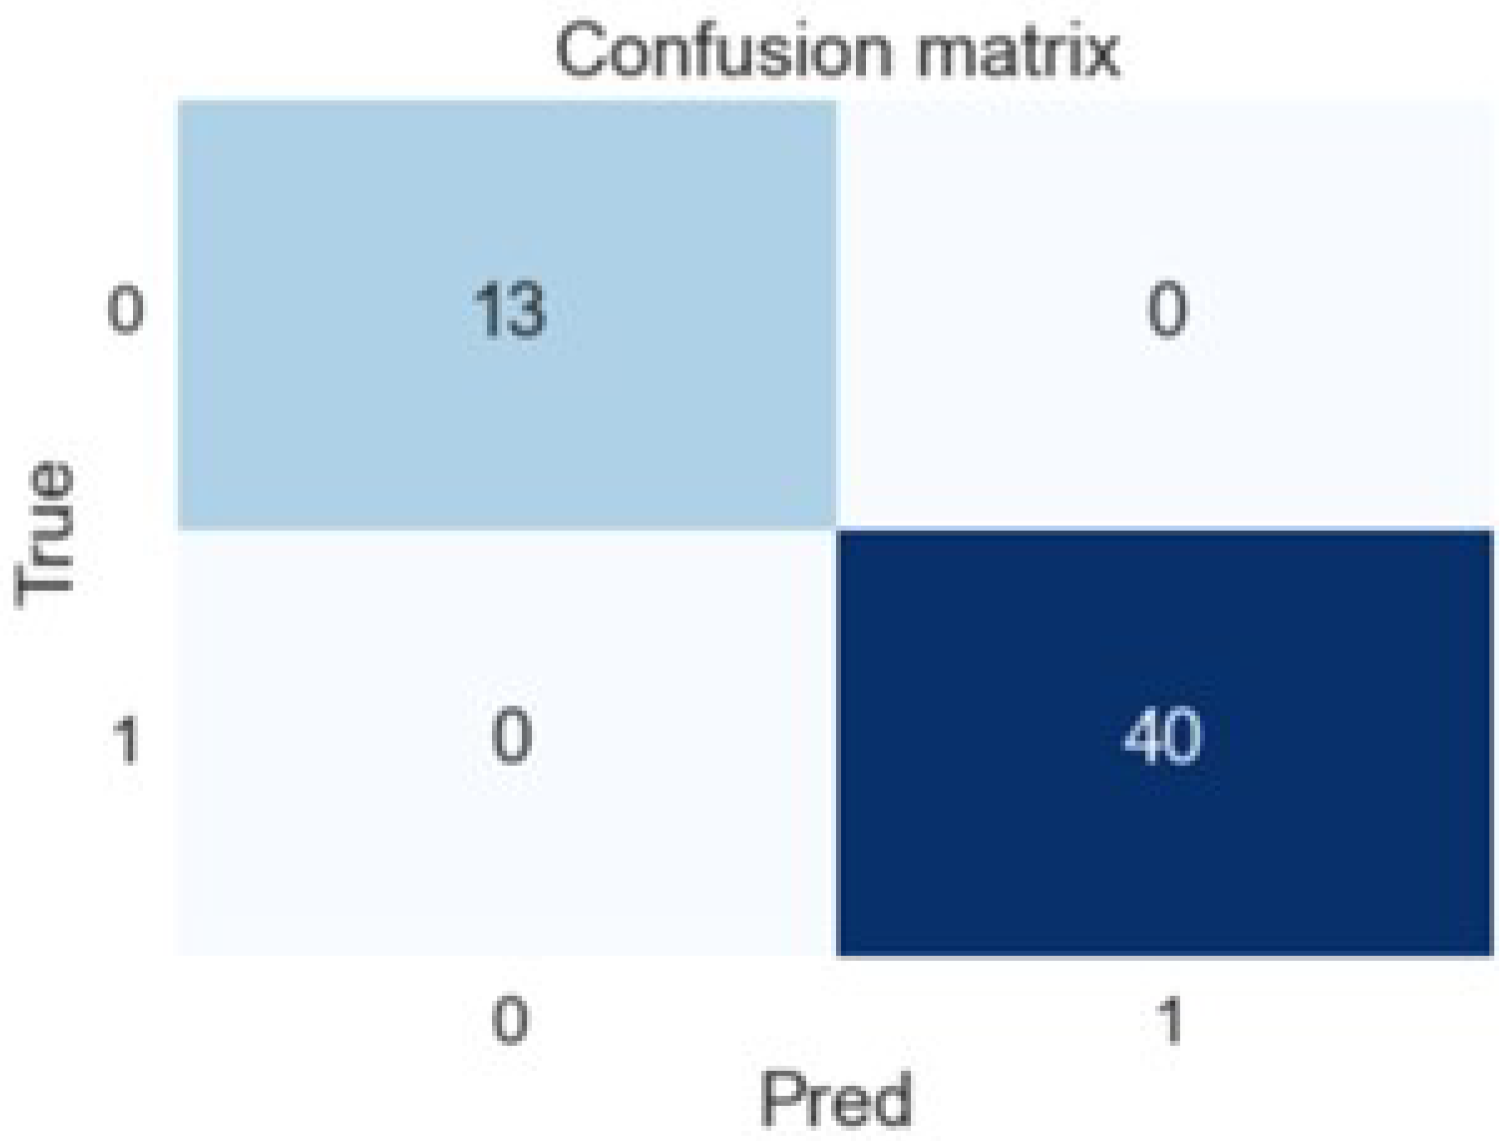
Calculating the ROC AUC metrics score on the test set gave the following results: an accuracy (overall correct predictions) of 1.0 and an AUC of 1.0. A confusion matrix is shown in
Figure 6. As can be seen in
Figure 6, all predicted (Pred) values of the target variable coincided with true (True) for the test set.
5. Conclusions
In this work, the predictive system for the early diagnosis of breast cancer was built based on machine learning methods. The concentration of cytokines in blood serum and their combinations were used for a prognosis. The accuracy of the prediction value being equal to 1 can be explained by the following reasons. Firstly, the model was trained on constructed features, which were pairs of cytokines. Furthermore, these pairs were defined at the stage of preliminary statistical analysis as combinations that were clearly different for patients who have BC and those who do not. Therefore, it was possible to divide the patients into two categories based on these pairs of cytokines. Secondly, the training and test sets were obtained randomly from the initial sample but in such a way that they were not statistically distinguishable. Third, the result obtained can be explained by the insufficient number of patients in the initial set. Therefore, as the next step, the further testing of the constructed predictive system for a larger quantity of patients has to be carried out. However, even at this stage, it can be concluded that the concentration of cytokines in the blood serum is applicable for the early diagnosis of breast cancer.
Author Contributions
Conceptualization, M.B. and Y.G.; methodology, M.B. and N.Z.; software, I.U.; validation, Y.G., N.Z. and V.M.; formal analysis, V.F. and V.M.; investigation, Y.G.; resources, M.B.; data curation, N.Z.; writing—original draft preparation, V.F. and I.U.; writing—review and editing, M.B., Y.G. and V.M.; visualization, Y.G.; supervision, N.Z.; project administration, M.B.; funding acquisition, V.M. All authors have read and agreed to the published version of the manuscript.
Funding
This research received no external funding.
Institutional Review Board Statement
Not applicable.
Informed Consent Statement
Not applicable.
Data Availability Statement
Not applicable.
Conflicts of Interest
The authors declare no conflict of interest.
References
- World Health Organization. Breast Cancer. 2021. Available online: Https://www.who.int/news-room/fact-sheets/detail/breast-cancer (accessed on 16 June 2022).
- National Cancer Institute. The Surveillance, Epidemiology, and End Results (SEER) Program. Cancer Stat Facts: Female Breast Cancer. 2022. Available online: Https://seer.cancer.gov/statfacts/html/breast.html (accessed on 16 June 2022).
- Lei, S.; Zheng, R.; Zhang, S.; Wang, S.; Chen, R.; Sun, K.; Wei, W. Global patterns of breast cancer incidence and mortality: A population-based cancer registry data analysis from 2000 to 2020. Cancer Commun. 2021, 41, 1183–1194. [Google Scholar] [CrossRef] [PubMed]
- Heer, E.; Harper, A.; Escandor, N.; Sung, H.; McCormack, V.; Fidler-Benaoudia, M.M. Global burden and trends in premenopausal and postmenopausal breast cancer: A population-based study. Lancet Glob. Health 2020, 8, e1027–e1037. [Google Scholar] [CrossRef] [PubMed]
- Xia, C.; Dong, X.; Li, H.; Cao, M.; Sun, D.; He, S.; Yang, F.; Yan, X.; Zhang, S.; Li, N.; et al. Cancer statistics in China and United States, 2022: Profiles, trends, and determinants. Chin. Med. J. 2022, 135, 584–590. [Google Scholar] [CrossRef] [PubMed]
- Gergenreter, Y.S.; Zakharova, N.B.; Barulina, M.A.; Maslyakov, V.V.; Fedorov, V.E. Analysis of the cytokine profile of blood serum and tumor supernatants in breast cancer. Acta Biomed. Sci. 2022, 7, 134–146. [Google Scholar]
- Piryonesi, S.M.; El-Diraby, T.E. Data Analytics in Asset Management: Cost-Effective Prediction of the Pavement Condition Index. J. Infrastruct. Syst. 2020, 26, 04019036. [Google Scholar] [CrossRef]
- Hastie, T.; Tibshirani, R.; Friedman, J.H. Boosting and Additive Trees. In The Elements of Statistical Learning, 2nd ed.; Springer: New York, NY, USA, 2009; pp. 337–384. [Google Scholar]
| Disclaimer/Publisher’s Note: The statements, opinions and data contained in all publications are solely those of the individual author(s) and contributor(s) and not of MDPI and/or the editor(s). MDPI and/or the editor(s) disclaim responsibility for any injury to people or property resulting from any ideas, methods, instructions or products referred to in the content. |
© 2023 by the authors. Licensee MDPI, Basel, Switzerland. This article is an open access article distributed under the terms and conditions of the Creative Commons Attribution (CC BY) license (https://creativecommons.org/licenses/by/4.0/).


 ,
, 


