
Influence of Vibroacoustic Phenomena from FFF Process on Surface Characteristics of Printed Parts †
by
 ,
,
Thiago Glissoi Lopes
1 ,
,
Isabela Müller Martins Rocha
2, 
Paulo Roberto Aguiar
1 and
Thiago Valle França
3,* 1
Department of Electrical Engineering, São Paulo State University, Avenida. Eng. Luiz Edmundo Carrijo Coube, 14-01, Bauru 17033-360, Brazil
2
Industrial Technical College “Prof. Isaac Portal Roldán”, Universidade Estadual Paulista, Avenida. Nações Unidas, 58-50, Bauru 17033-260, Brazil
3
Department of Mechanical Engineering, São Paulo State University, Avenida. Eng. Luiz Edmundo Carrijo Coube, 14-01, Bauru 17033-360, Brazil
*
Author to whom correspondence should be addressed.
†
Presented at the 1st International Electronic Conference on Processes: Processes System Innovation, 17–31 May 2022; Available online: https://sciforum.net/event/ECP2022 .
Eng. Proc. 2022, 19(1), 44; https://doi.org/10.3390/ECP2022-12615
Published: 17 May 2022
(This article belongs to the Proceedings of The 1st International Electronic Conference on Processes: Processes System Innovation)
Abstract
:The fused filament fabrication (FFF) process deals with the manufacturing of parts by adding fused plastic filaments in successive layers, following certain fill patterns. For fabrication to be successful, different filling parameters must be defined. Given the sequential nature of the FFF process, the fabrication of the first layer is considered one of the most critical points for fault detection. The FFF process takes place in a 3D printer, where the filling patterns are achieved by moving the extruder and/or printing table along the X, Y and Z axes. Different models of 3D printers move the axes in different ways. The optical profilometry method showed good results when analyzing different topographic characteristics, such as roughness and others related to the peaks and valleys of a printed surface, when moving only the extruder. However, given that the filament deposition occurs on the printing table, the most susceptible place for vibroacoustic phenomena during the process, the present work aims to evaluate, by means of optical profilometry, the surface characteristics of a region of a certain part manufactured by moving only the printing table. The results obtained demonstrate that the surface characteristics evaluated by optical profilometry are greatly influenced by the vibroacoustic phenomena, varying significantly from the values observed when only the extruder moves.
1. Introduction
The fused filament fabrication (FFF) process deals with the manufacturing of parts by adding fused plastic filaments in successive layers, following certain fill patterns [1]. For fabrication to be successful, several printing parameters must be correctly defined [2]. The incorrect definition of a certain printing parameter can have a negative effect on the quality of the product obtained [3]. The layer thickness parameter defines the dimension on the Z-axis of each deposited layer; therefore, a change in this parameter can compromise geometric fidelity. The filling pattern parameter is responsible for the way in which the tracks are deposited to fill the interior of the part, with each filling pattern presenting a different behavior in terms of strength, stiffness, and stress concentration. The infill density printing parameter specifies how much of the internal volume is actually filled; therefore, a change in this parameter may result in a less than expected resistant and rigid part [4].
Given the sequential nature of the FFF process, the fabrication of the first layer is considered one of the most critical points for fault detection [3,5]. If a fault is detected in the first layer, the FFF printing process may be stopped, avoiding unnecessary costs due to an incorrect part fabrication. In the work developed by [5], a first layer assessment showed that multiple surface failures can be detected in this stage. On the other hand, the work developed by [3] showed that with a first layer assessment, faults related to the geometry of the FFF printed part can also be detected in this stage.
The FFF process takes place in a 3D printer, where the filling patterns are achieved by moving the extruder and/or printing table along the X, Y and Z-axis. Different models of 3D printers move the axes in different ways [6,7,8,9]. The work developed by [7], which addresses a review on the impact of different IP on the properties obtained in printed parts, points out that in typical 3D printers of the FDM process, the movement for deposition on the X, Y and Z axes is only due to the movement of the extruder. In the work developed by [6] and by [8], 3D printers were used in which the movement for deposition on the X and Y-axis occurred solely by the extruder, while the movement for the deposition on the Z-axis is used only by the printing table. On the other hand, in the work developed by [9], the authors used a 3D printer in which the movement for the deposition on the X-axis was made only by the movement of the printing table, while the movement for printing on the Y and Z-axis occurs only by the movement of the extruder.
2. Optical Profilometry
A very important characteristic for the evaluation of parts is the surface quality. One of the most common parameters to assess a part’s surface quality is the surface roughness value. This is a result of it often being used as a production requirement, in which the part surface must possess a value between a predetermined range to allow for correct use [10].
A part’s surface quality can be quantified using a profilometer to map the surface’s profile [11]. This can be achieved either by a contact profilometry type technique or by a non-contact profilometry type technique. Optical profilometry is a non-contact type of profilometry where light is used to achieve a profile assessment. The advantages of the optical approach include its ability to generate 2D and 3D topography images, no risk of damaging the evaluating part due to its non-contact characteristic, as well as the capability to identify irregularities that contact profilometry cannot [12,13].
The optical profilometry method showed good results when analyzing different topographic characteristics, such as roughness and others related to the peaks and valleys of an FFF-printed surface when moving only the extruder [1]. However, given that the filament deposition occurs on the printing table, the most susceptible place for vibroacoustic phenomena during the process, the present work aims to evaluate, by means of optical profilometry, the surface characteristics of a region of a certain FFF-printed surface manufactured by moving only the printing table.
3. Materials and Methods
In order to achieve an evaluation of the surface characteristics under the movement of the printing table only, the first layer’s printing tests were performed under different printing conditions. Then, regions on the surfaces of the parts where only the printing table was moved in the printing process were selected for the optical profilometry evaluation.
The following sections will detail how the printing process and surface analysis processes were conducted.
3.1. Printing Process
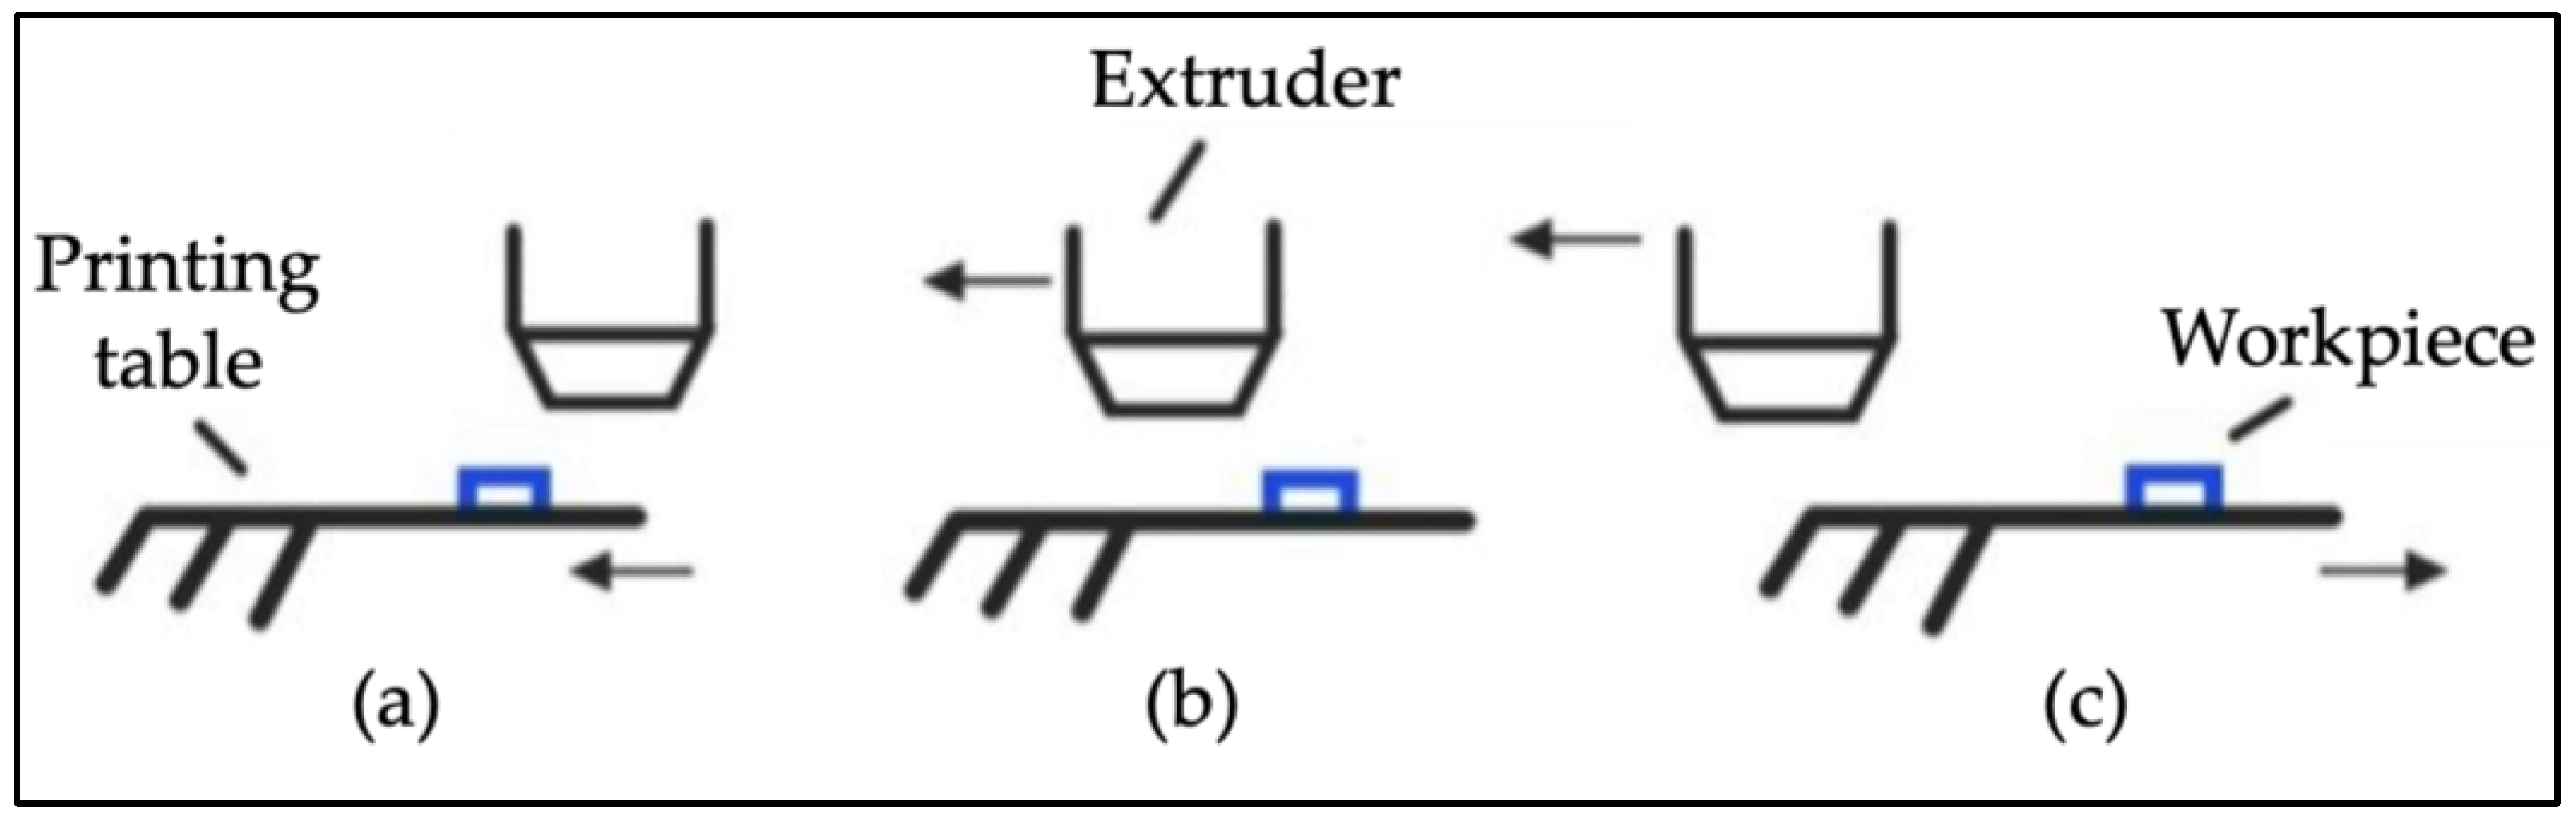
The print tests were conducted on a Graber i3 model cartesian 3D printer, manufactured by GTMax3D® (Americana, Brazil). This printer model includes an MK2B Dual Power PCB printing bed in contact with a thermistor type temperature sensor model NTC, which is located directly in contact with a 200 × 200 × 3 mm glass surface. This model of 3D printer conducts printing on the X-axis by moving the extruder and on the Y-axis by moving the printing table. Figure 1 shows how the Graber i3 achieves the printing movement, depending on the necessity of the fill pattern.
The Graber i3 also contains a Hotend Allmetal GTMax 3D model extruder, which has a nozzle diameter of 0.4 mm. This printer model, according to the manufacturer, is capable of achieving a printing resolution of ±0.05 mm in the X–Y and Z-axis. The PLA filaments utilized in the tests were manufactured by 3D Fila®. The print tests were controlled and supervised via a computer running the Repetier-Host® software (Hot-World GmbH & Co. KG, Willich, Germany). The connection between the computer and the 3D printer was made via a USB connection.
The printing conditions parametrization was conducted in the Slic3r® software, running as part of the Repetier-Host® software. In regard to the different printing conditions, three were established in reference to [1]. A regular printing (RP) condition, in which a regular printing surface was obtained, and two irregular printing conditions, irregular printing 1 (IP1) and irregular printing 2 (IP2), were achieved by means of altering the value of the Z offset post-processing parameter in the slicing step to 0.1 and −0.1 mm, respectively, in which the printing surfaces would show distinct defects.
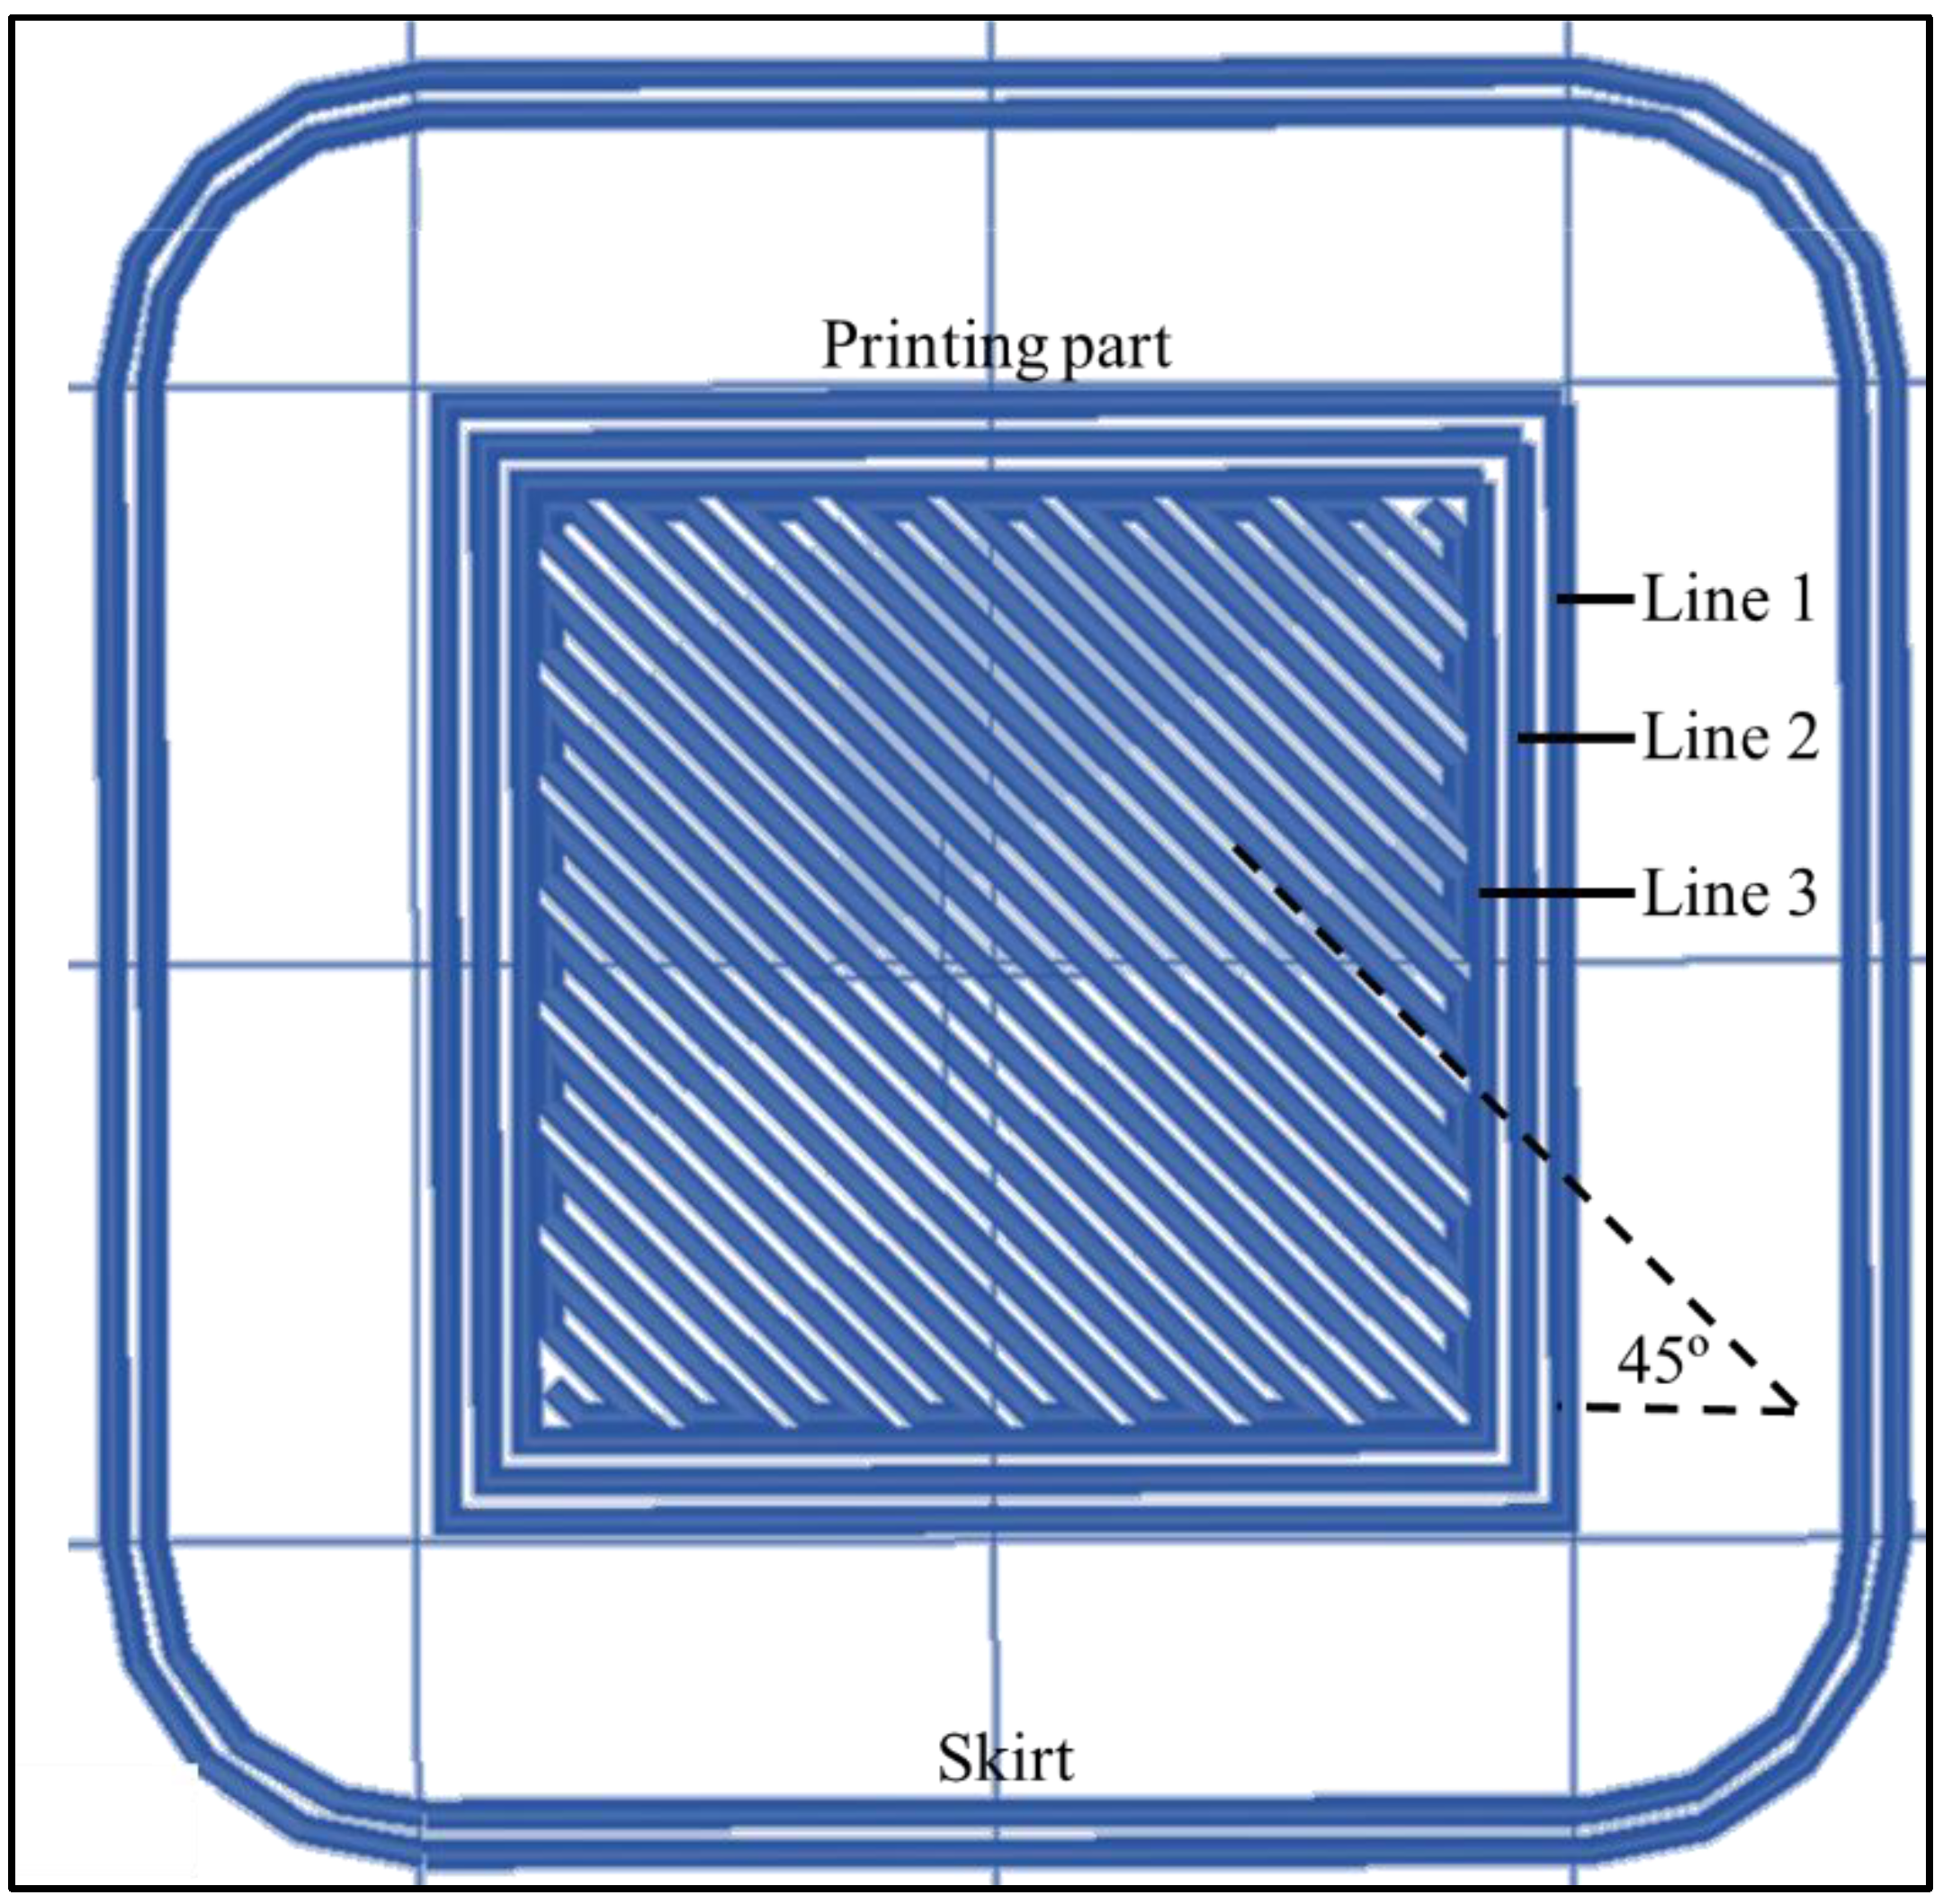
The digital model of the monolayer part was obtained by means of modeling in the SketchUp® (Trimble Inc., Sunnyvale, CA, USA) software version Make and was inspired by the part geometry utilized by [1]. Figure 2 shows the monolayer part model adopted for the printing tests after it has been sliced with regular printing condition post-processing parameters. The sliced model presents two distinct infill patterns, the external and the internal infill patterns. The external infill pattern, commonly referred to as the number of shells/contours/perimeters, consists of three contour lines, visually identified in Figure 2, that outline the four sides of the printed part. On the other hand, the internal infill pattern presents the fabrication of thirty raster lines, fabricated with a raster angle of 45°.
3.2. Profilometry Setup
The profilometry process was conducted using the same methodology and equipment used by [1]. To carry out the measurements of roughness and topography of the printed parts, the Veeco non-contact optical profilometer, model Wyko NT100, was used. This device has a vertical resolution (Z-axis) of 1 angstrom and horizontal (X and Y-axis) of 1 to 2.5 micron in all magnifications and uses white light interferometry for high-resolution three-dimensional surface measurements. The equipment is capable of measuring nanometric roughness and topographic measurements of up to 1 mm in height (Z-axis).
The Vertical Scanning Interferometry (VSI) measurement mode was applied, as the roughness and topography are in the micrometric order. A 2.5× magnification was used for all samples, considering a 0.5× multiplier lens and a 5× objective lens, generating images of 2.47 × 1.88 mm². From the images obtained in the process, it was possible to determine several measures of roughness.
3.3. Surface Analysis
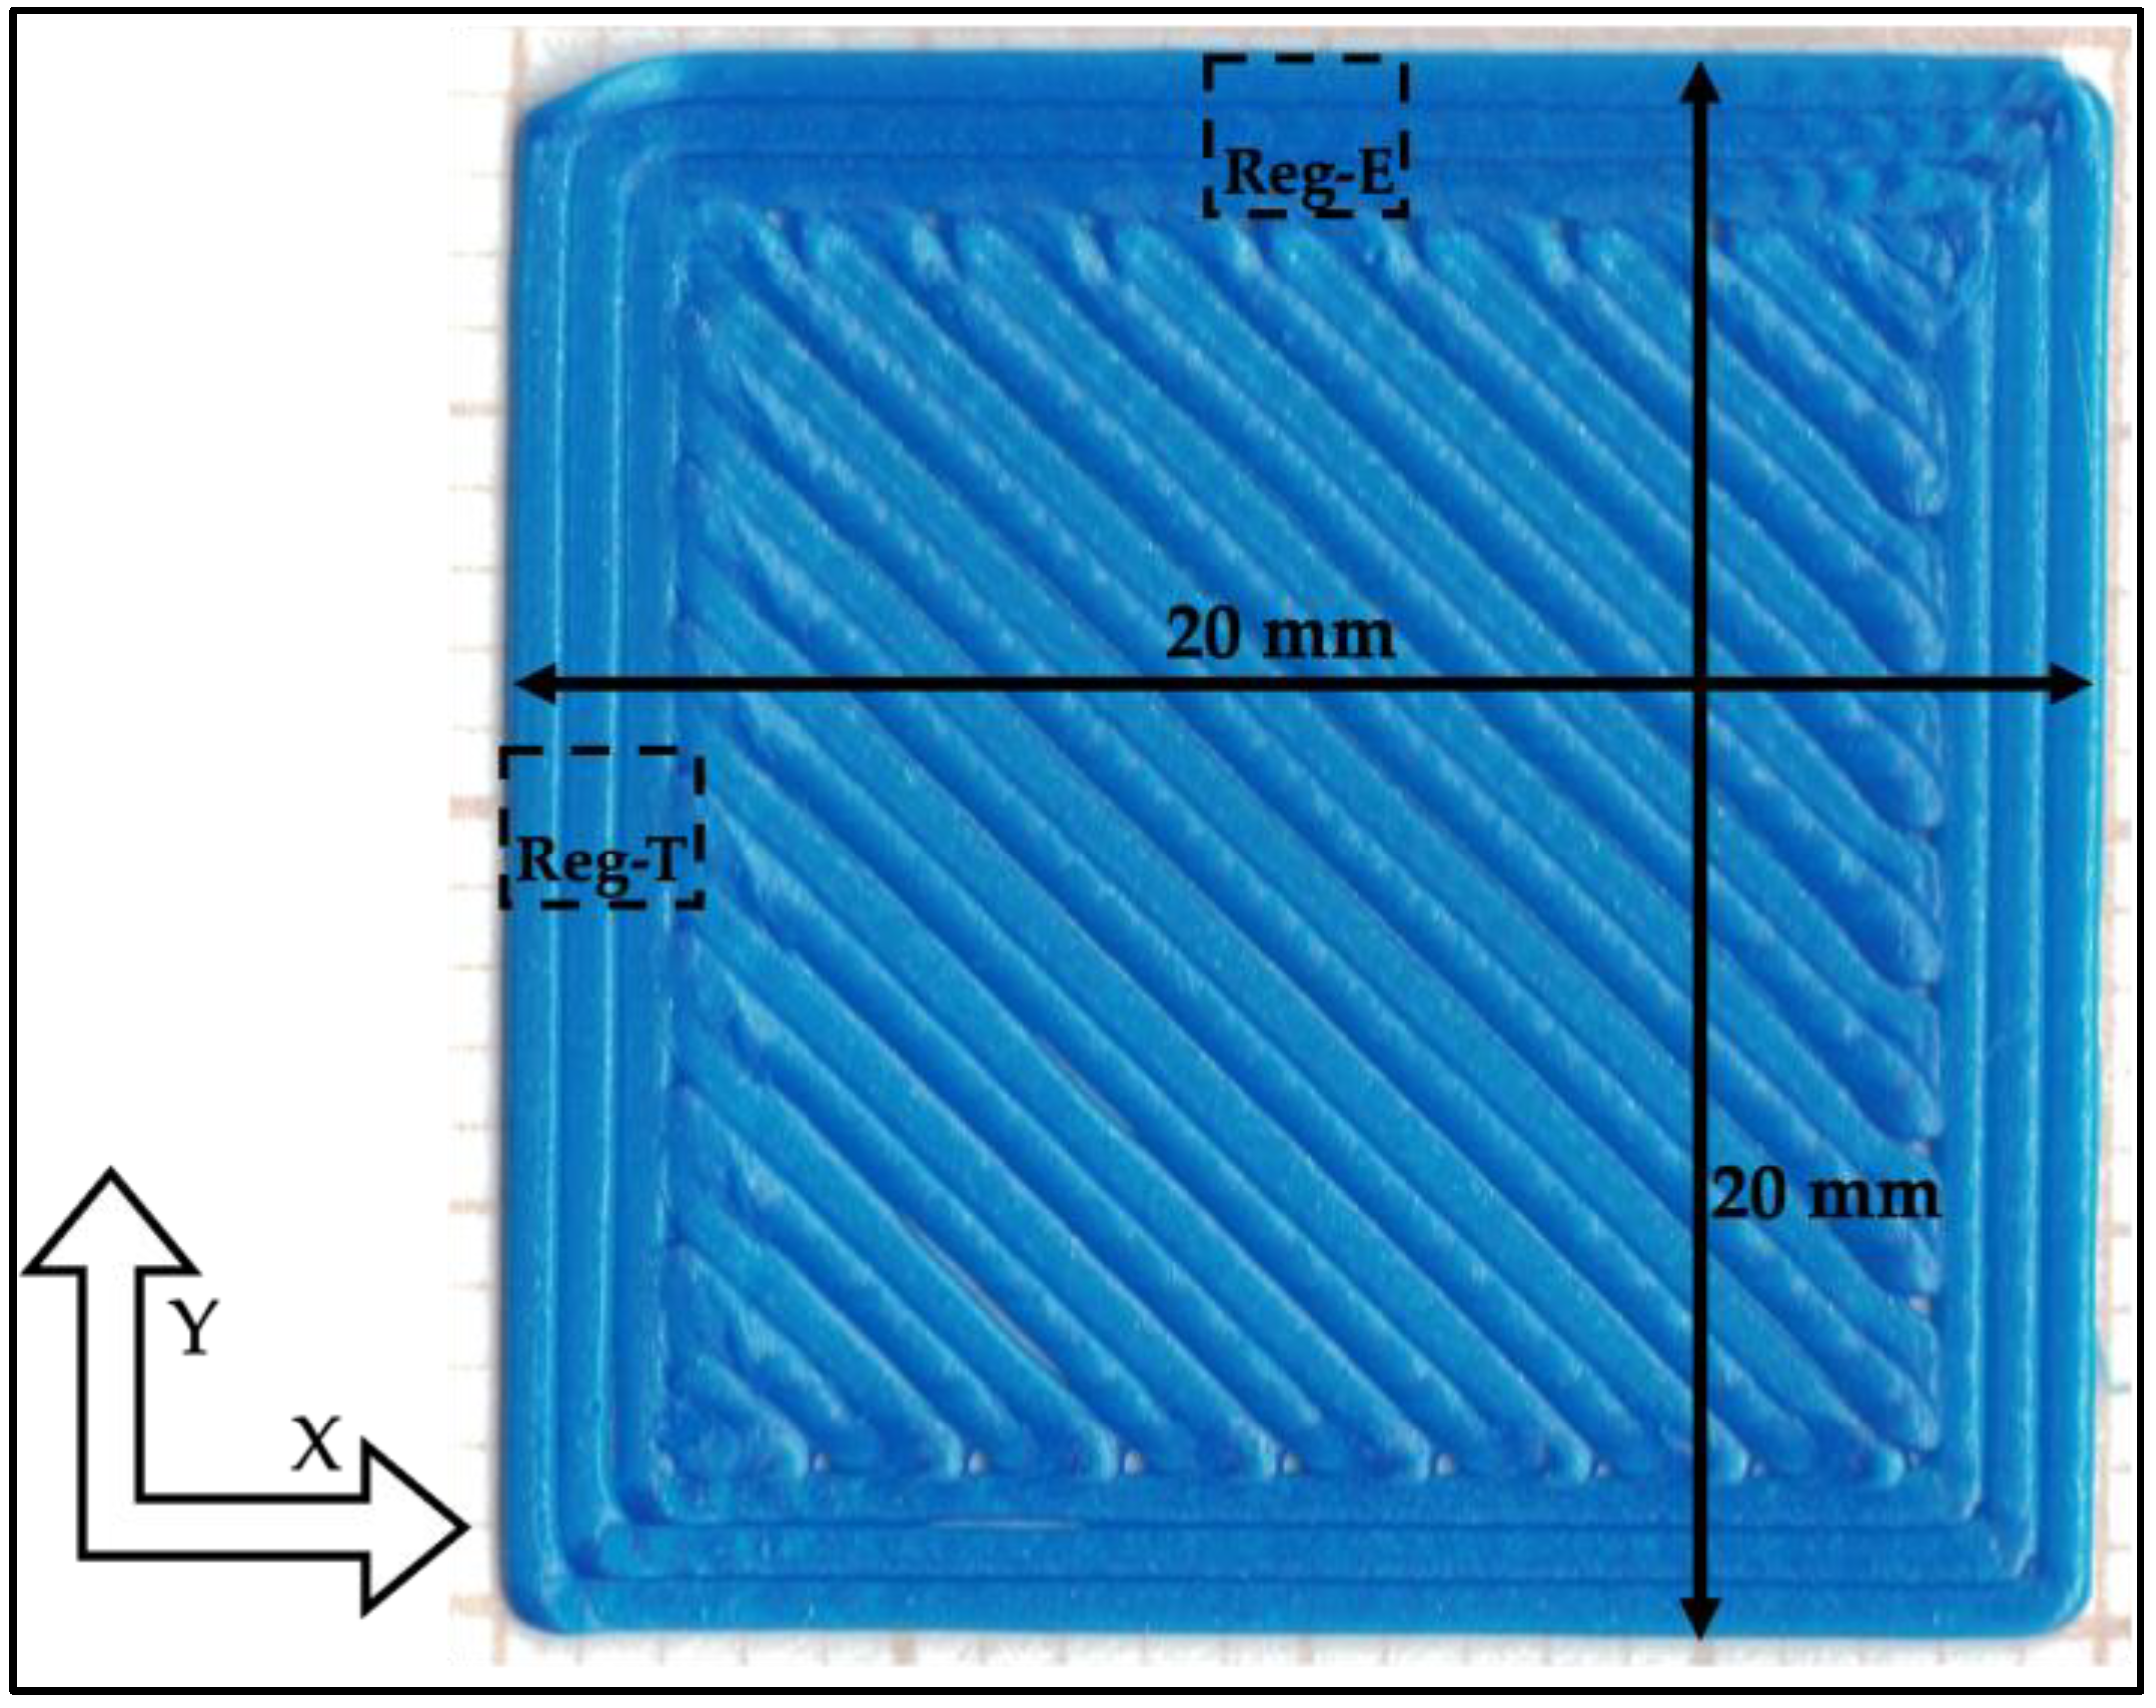
A region on the part was selected where printing was conducted with only the printing table movement. As can be seen on the part presented in Figure 3, the left side of the external infill pattern has lines parallel to the Y-axis; therefore, the region identified as Region-Table “Reg-T” was selected for the optical profilometry surface analysis. The region identified in Figure 3 as Region-Extruder “Reg-E” presents the region utilized by [1], where the upper side of the external infill pattern has lines parallel to the X-axis.
Surface analysis was performed using vision software version 4.20 to open and interact with the profiler images. Before conducting any analysis, a mask was applied to all images to improve contrast and exclude peripheral points. The histogram function in the Vision Mask Editor performed the masks, where the histogram of the point height was “cut” before the first and after the last height group, trying to avoid deleting valid points. The following parameters were then measured: width of the pathway (considered from the point of depression where the profile starts an upward curve and ends at the analog point on the other side of the wave); Ra, Rq and Rt profile, all measured in the same line used to measure the width of the track in the image.
4. Results and Discussion
The results obtained from the profilometry process on the “REG-T” are displayed in Table 1. It can be seen that the RP has a slightly lower surface roughness than IP1 and a dramatically lower roughness than IP2 for all the three studied parameters. The difference between the IP1 and RP conditions ranges from 5.82 μm for Ra to 28.23 μm for Rt, with an average difference of around 17 μm, suggesting that the experimental procedure indeed affected surface quality in regions where only the printing table is moved for printing. The small difference between Ra values could be due to either its nature, in the sense that a singular small, but deep, depression is enough to greatly influence the final result or the limited number of samples tested. In the case of IP2, the discrepancy is, on average, 173.22 μm higher than RP, such that even a quick visual inspection would be enough to reject the part in a production line; therefore, as much as the loss in quality can be quantified by the use of an optical profilometer, the analysis would not really be needed for most applications.
In general, the roughness results seem to agree with each other in terms of scale and ranking of the conditions. The considerable difference between the IP1 and the other printing conditions could be an effect of more frequent inter-track debonding caused by the somewhat looser filament deposition of this condition. Track widths seem consistent with what was to be expected, i.e., for a constant material feed rate and thus constant material volume, the track width is inversely proportional to the extruder’s relative height to the bed.
The results obtained from the profilometry process on the “REG-E”, which are described more in-depth by [1], are displayed in Table 2.
A comparative analysis of the roughness values displayed in Table 1 and Table 2 reveals that the differences that originated from the movement of the extruder or the printing table are more preeminent depending on the printing condition.
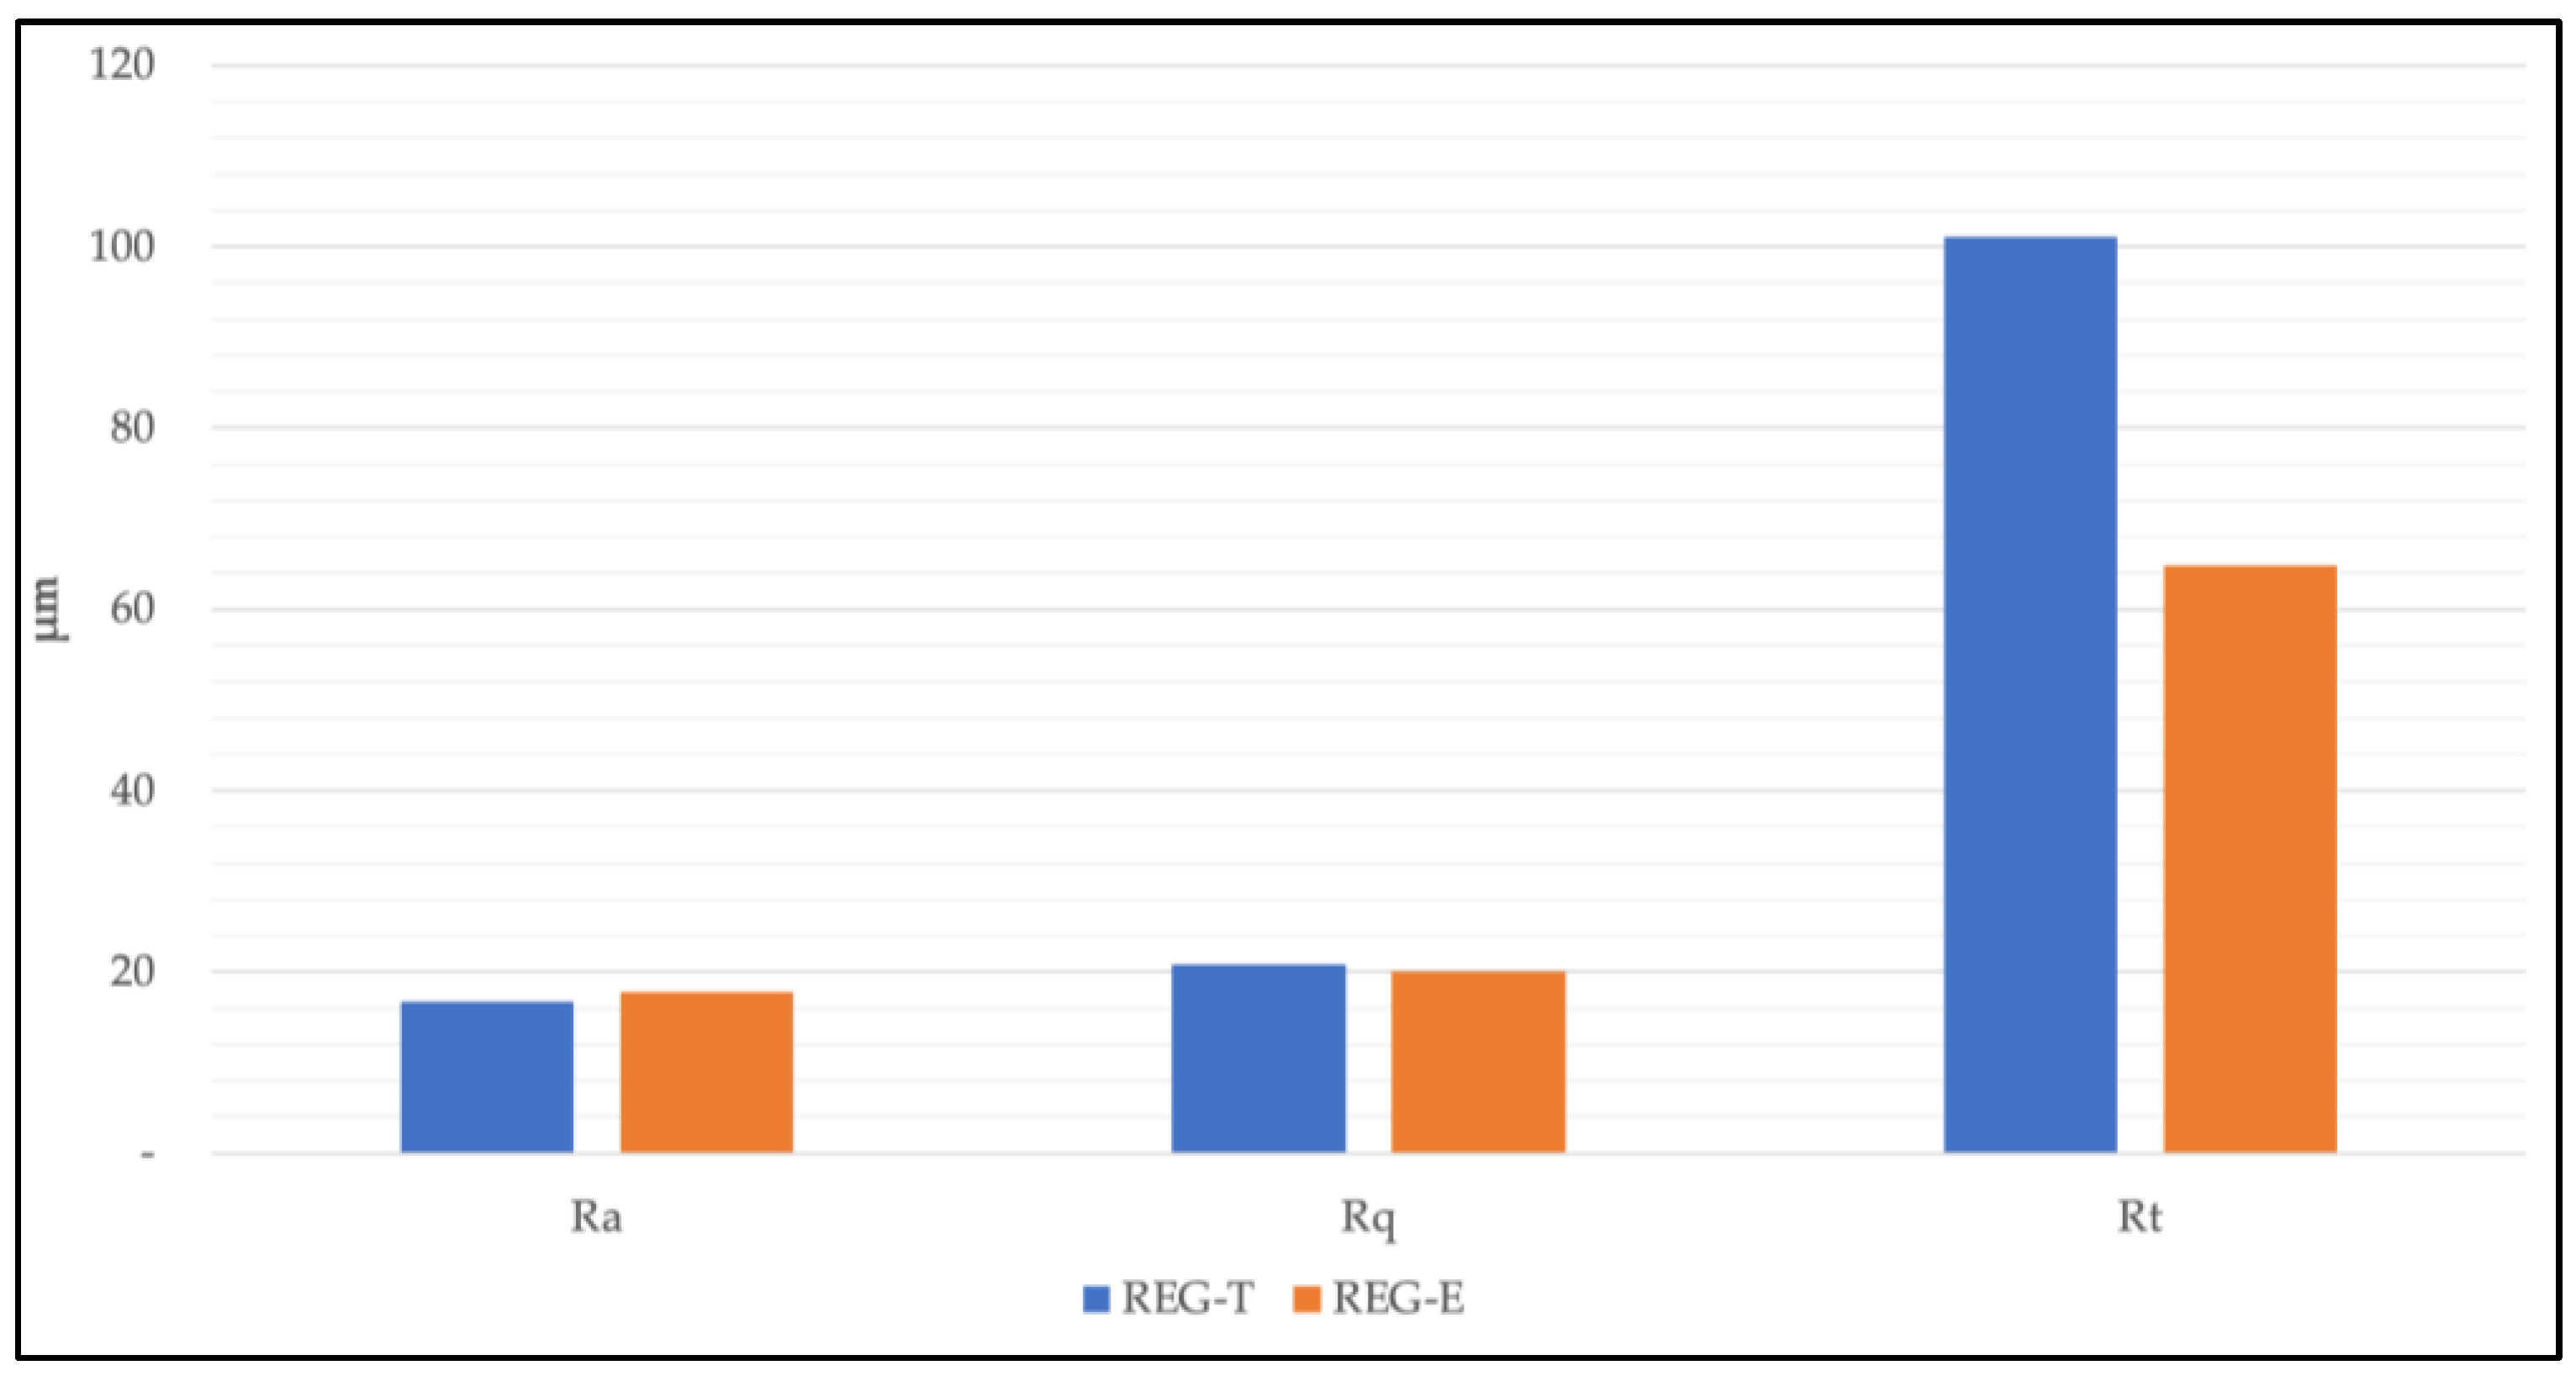
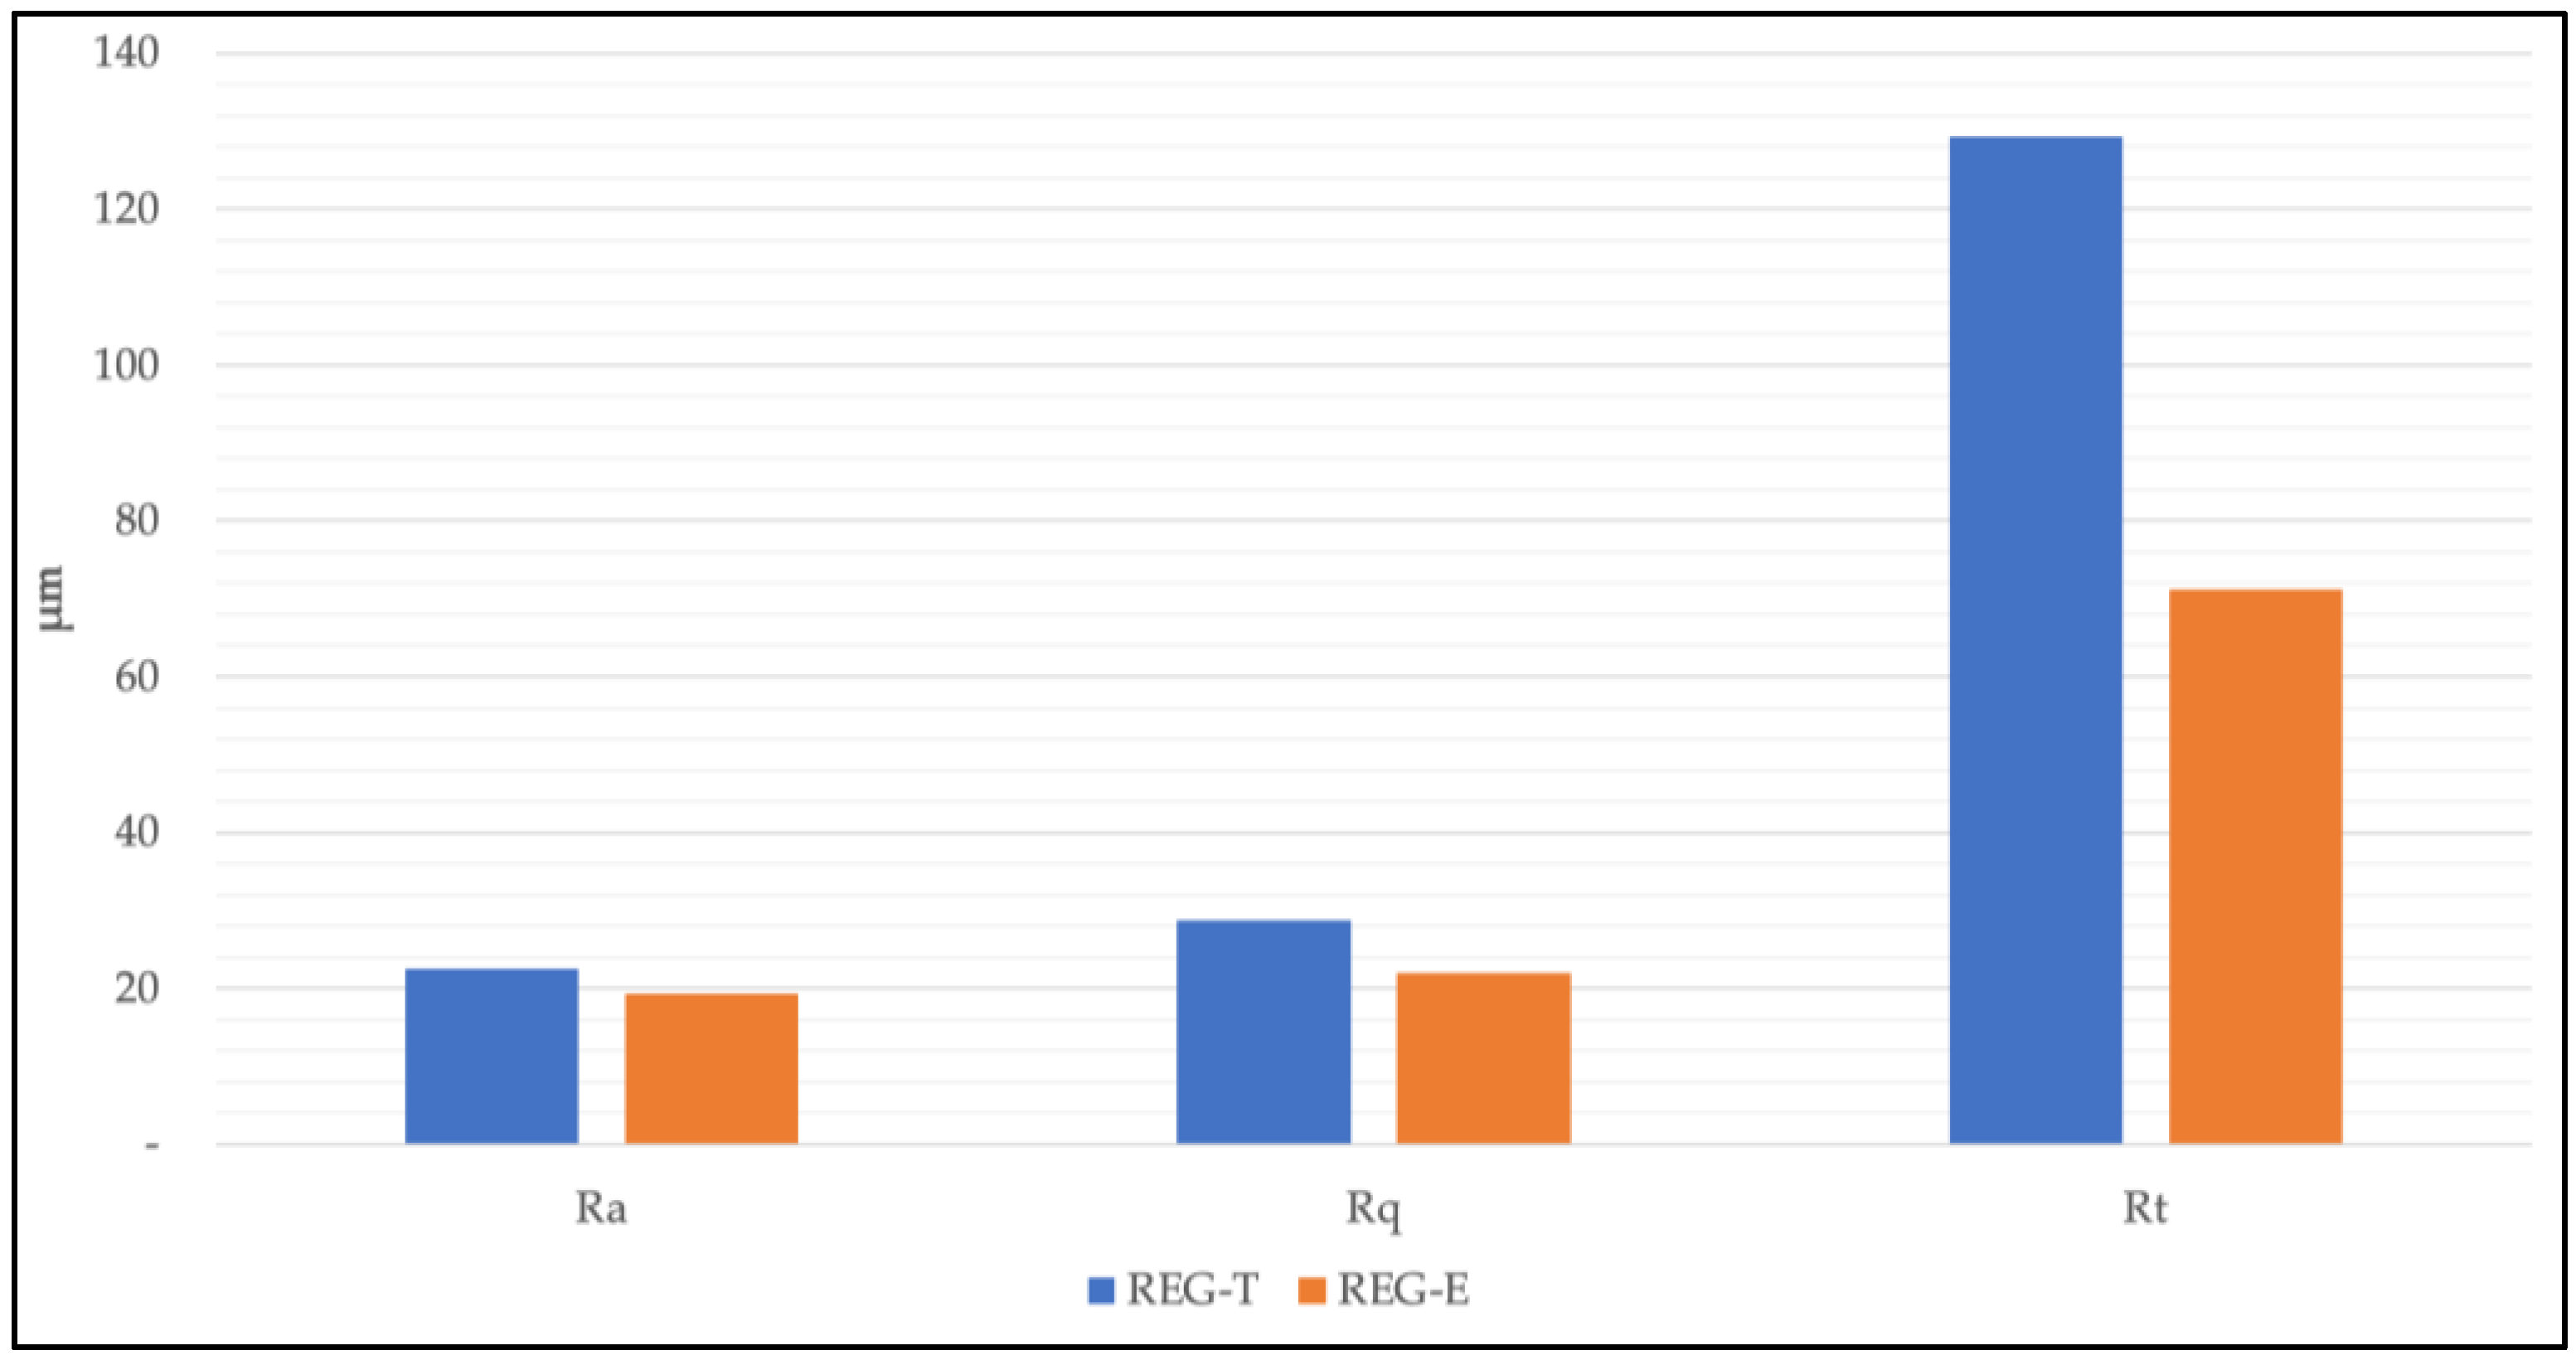
Figure 4 shows the surface analysis comparison between “REG-T” and “REG-E” for the Ra, Rq and Rt obtained under the RP printing condition. It is possible to observe that the Ra and Rq values are very close in the two regions. On the other hand, the Rt value shows a significantly rougher surface in the “REG-T” region when compared to the “REG-E” region. These results are evidence that the more preeminent vibroacoustic phenomena that originated from the table movement transcribed to an overall rougher surface.
In regard to the Ra, Rq and Rt values obtained under the IP1 printing condition, Figure 5 shows the surface analysis between “REG-T” and “REG-E”. It is possible to observe that, varying from what was seen for the RP printing condition, the IP1 comparison results show more preeminent differences for the Ra, Rq and Rt roughness values between the “REG-T” and “REG-E” regions. These results are evidence that the more preeminent vibroacoustic phenomena that originated from the table movement transcribed to an overall rougher surface, and different to what was perceived for the RP results, the more preeminent vibroacoustic phenomena effects are perceived for all Ra, Rq and Rt values.
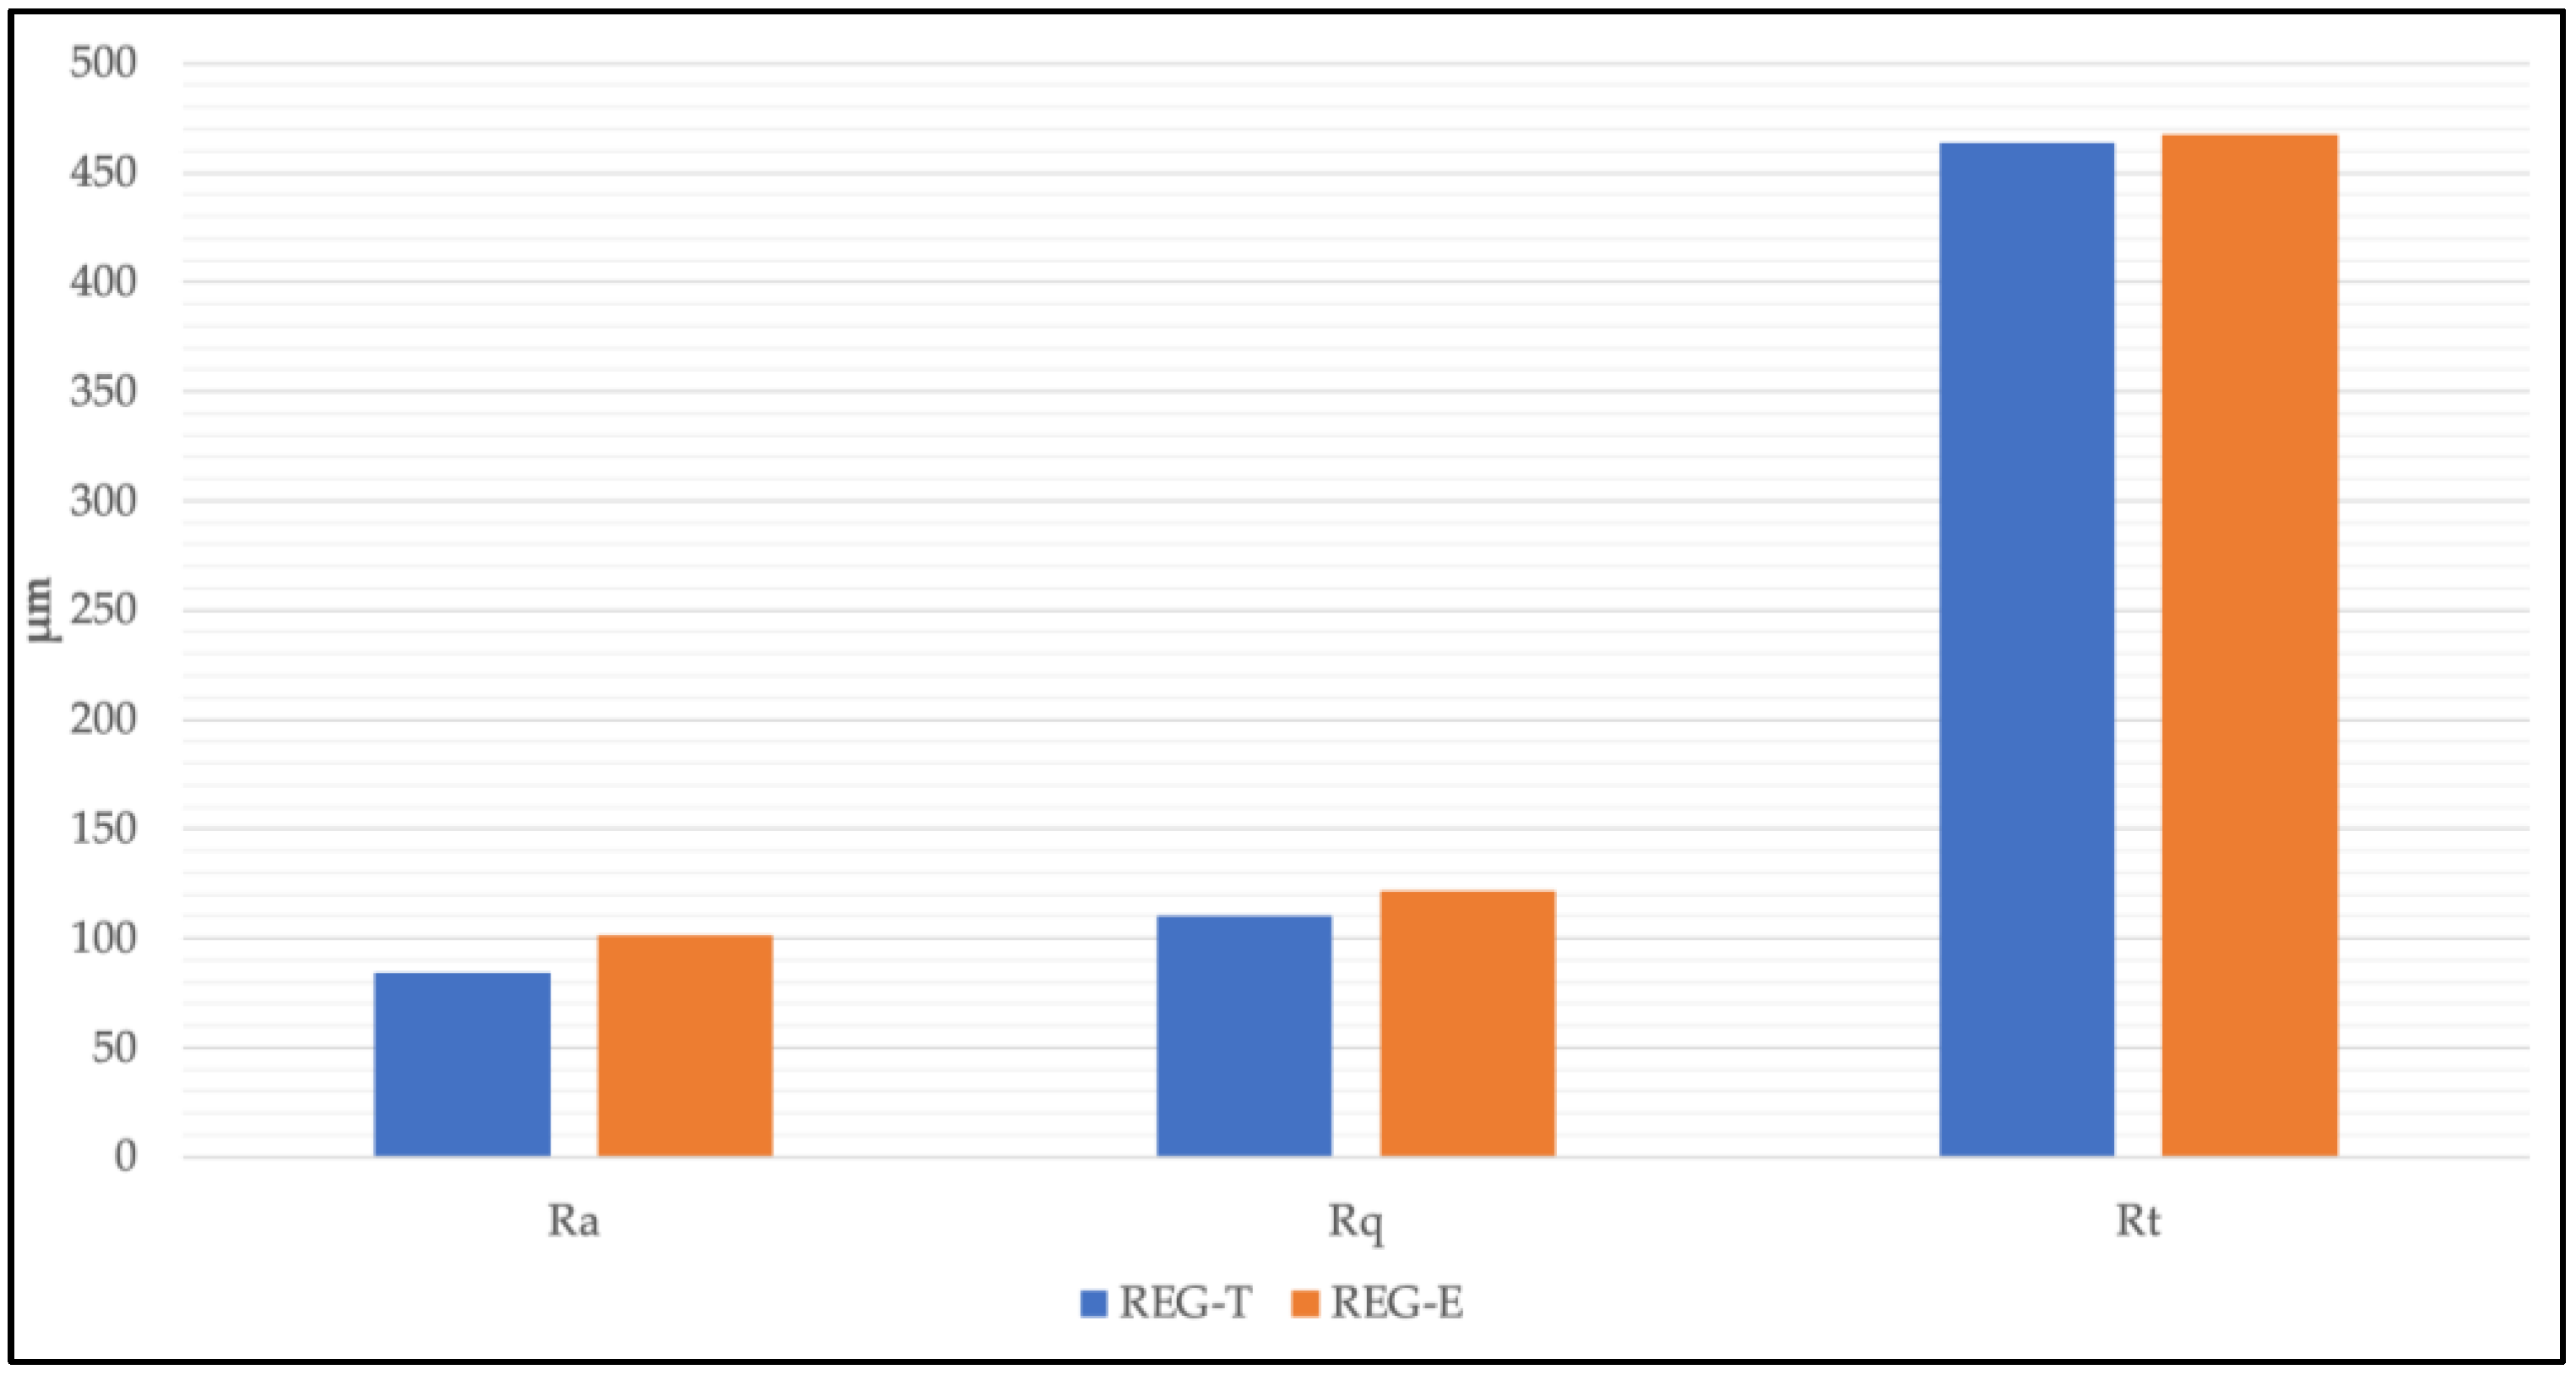
Lastly, for the Ra, Rq and Rt values obtained under the IP2 printing condition, Figure 6 shows the surface analysis between “REG-T” and “REG-E”. It is possible to observe that, varying from what was seen for the RP and IP1 printing conditions, the IP2 comparison results show more preeminent differences for the Ra and Rq roughness values between the “REG-T” and “REG-E” regions. These results are evidence that the more preeminent vibroacoustic phenomena that originated from the table movement transcribed to an overall rougher surface, and different to what was perceived for the RP and IP1 results, the more preeminent vibroacoustic phenomena effects are perceived for the Ra and Rq values.
5. Conclusions
The optical profilometry of the surfaces of the monolayer parts printed in PLA allowed the evaluation of surface roughness caused by the selection of different post-processing parameters in the printing parametrization of the FFF process on a region of the part obtained under table movement only. Through analysis of the obtained roughness values, it was possible to observe that the selection of certain post-processing parameters influences the surface parameters of the obtained parts.
Finally, it is concluded that the more preeminent vibroacoustic phenomena that originated from the printing table movement resulted in rougher surfaces, and this effect may be perceived differently depending on the printing condition, with certain printing conditions only varying in Rt value, while others only in Ra and Rq values. Moreover, it is emphasized that the approach performed in this work is an initial study, and additional studies are necessary in order to validate the proposed method under different slicing and printing conditions.
Author Contributions
The authors contributed equally to this work. All authors have read and agreed to the published version of the manuscript.
Funding
This work was funded in part by the São Paulo Research Foundation (FAPESP) (grants #2016/22038-8 and #08/53641-5) and by the Brazilian National Council for Scientific and Technological Development (CNPq) (grant #306774/2021-6).
Institutional Review Board Statement
Not applicable.
Informed Consent Statement
Not applicable.
Data Availability Statement
Not applicable.
Acknowledgments
Thanks go to São Paulo Research Foundation (FAPESP) and the Brazilian National Council for Scientific and Technological Development (CNPq).
Conflicts of Interest
The authors declare no conflict of interest.
References
- Lopes, T.G.; Carmo, M.; Queiroz, L.M.; Aguiar, P.; França, T. Feasibility of Optical Profilometry for Quality Characterization of Monolayer Parts Obtained by Fused Filament Fabrication. In Proceedings of the 26th International Congress of Mechanical Engineering, Virtual Conference, 22–26 November 2021. [Google Scholar] [CrossRef]
- Lopes, T.G.; Queiroz, L.M.; Bombonatti, V.; Carmo, M.; Aguiar, P.; França, T. The Influence of Printing Parameters on Monolayer Part Features in Fused Filament Fabrication. In Proceedings of the 26th International Congress of Mechanical Engineering, Virtual Conference, 22–26 November 2021. [Google Scholar] [CrossRef]
- Lopes, T.G.; Antonio, Z.R.F.; Junior, C.S.; Ruas, E.L.V.; Aguiar, P.R. A Primeira Camada Como Indicador de Qualidade Do Planejamento Do Processo De Impressão 3d. In Proceedings of the Anais do XXVII Simpósio de Engenharia de Produção (SIMPEP), Online, 9–11 November 2020; pp. 1–12. Available online: http://www.simpep.feb.unesp.br/anais_simpep.php?e=13 (accessed on 19 November 2020).
- Rodríguez-Panes, A.; Claver, J.; Camacho, A.M. The influence of manufacturing parameters on the mechanical behaviour of PLA and ABS pieces manufactured by FDM: A comparative analysis. Materials 2018, 11, 1333. [Google Scholar] [CrossRef] [PubMed] [Green Version]
- Carmo, M.G.F.D.; Lopes, T.G.; Bombonatti, V.S.; Aguiar, P.R.; França, T.V. Studying the Defects and Geometric Anomalies on Monolayer Parts Obtained via the Fused Deposition Modeling Process. Proceedings 2020, 69, 40. [Google Scholar] [CrossRef]
- Wang, A.; Song, S.; Huang, Q.; Tsung, F. In-Plane Shape-Deviation Modeling and Compensation for Fused Deposition Modeling Processes. IEEE Trans. Autom. Sci. Eng. 2016, 14, 968–976. [Google Scholar] [CrossRef]
- Abeykoon, C.; Sri-Amphorn, P.; Fernando, A. Optimization of fused deposition modeling parameters for improved PLA and ABS 3D printed structures. Int. J. Lightweight Mater. Manuf. 2020, 3, 284–297. [Google Scholar] [CrossRef]
- Galantucci, L.; Bodi, I.; Kacani, J.; Lavecchia, F. Analysis of Dimensional Performance for a 3D Open-source Printer Based on Fused Deposition Modeling Technique. Procedia CIRP 2015, 28, 82–87. [Google Scholar] [CrossRef] [Green Version]
- Krishnanand; Soni, S.; Taufik, M. Design and assembly of fused filament fabrication (FFF) 3D printers. Mater. Today Proc. 2020, 46, 5233–5241. [Google Scholar] [CrossRef]
- Zhang, X.; Zheng, Y.; Suresh, V.; Wang, S.; Li, Q.; Li, B.; Qin, H. Correlation approach for quality assurance of additive manufactured parts based on optical metrology. J. Manuf. Process. 2020, 53, 310–317. [Google Scholar] [CrossRef]
- Luo, D.; Taphanel, M.; Claus, D.; Boettcher, T.; Osten, W.; Längle, T.; Beyerer, J. Area scanning method for 3D surface profilometry based on an adaptive confocal microscope. Opt. Lasers Eng. 2019, 124, 105819. [Google Scholar] [CrossRef]
- Adi, S.; Adi, H.; Chan, H.-K.; Young, P.M.; Traini, D.; Yang, R.; Yu, A. Scanning White-Light Interferometry as a Novel Technique to Quantify the Surface Roughness of Micron-Sized Particles for Inhalation. Langmuir 2008, 24, 11307–11312. [Google Scholar] [CrossRef] [PubMed]
- Nieslony, P.; Krolczyk, G.; Zak, K.; Maruda, R.; Legutko, S. Comparative assessment of the mechanical and electromagnetic surfaces of explosively clad Ti–steel plates after drilling process. Precis. Eng. 2016, 47, 104–110. [Google Scholar] [CrossRef]
Figure 1.
Graber i3 movement for printing. (a) Y-axis movement, (b) X-axis movement, (c) X–Y-axis movement.
Figure 1.
Graber i3 movement for printing. (a) Y-axis movement, (b) X-axis movement, (c) X–Y-axis movement.

Figure 2.
Monolayer part digital model.

Figure 3.
Surface analysis region.

Figure 4.
RP surface analysis comparison.

Figure 5.
IP1 surface analysis comparison.

Figure 6.
IP2 surface analysis comparison.


Table 1.
Profile analysis data.
| Condition | Track Width (mm) | Ra (μm) | Rq (μm) | Rt (μm) |
|---|---|---|---|---|
| IP1 | 0.7486 | 22.52 | 28.82 | 129.31 |
| RP | 0.7166 | 16.70 | 20.79 | 101.08 |
| IP2 | 0.5828 | 84.07 | 110.36 | 463.80 |
Table 2.
Reference [1] profile analysis data.
Table 2.
Reference [1] profile analysis data.
| Condition | Track Width (mm) | Ra (μm) | Rq (μm) | Rt (μm) |
|---|---|---|---|---|
| IP1 | 0.7515 | 19.3 | 21.91 | 71.28 |
| RP | 0.7128 | 17.82 | 20.12 | 64.76 |
| IP2 | 0.5772 | 101.33 | 121.54 | 467.68 |
Publisher’s Note: MDPI stays neutral with regard to jurisdictional claims in published maps and institutional affiliations. |
© 2022 by the authors. Licensee MDPI, Basel, Switzerland. This article is an open access article distributed under the terms and conditions of the Creative Commons Attribution (CC BY) license (https://creativecommons.org/licenses/by/4.0/).
Share and Cite
MDPI and ACS Style
Lopes, T.G.; Rocha, I.M.M.; Aguiar, P.R.; França, T.V. Influence of Vibroacoustic Phenomena from FFF Process on Surface Characteristics of Printed Parts. Eng. Proc. 2022, 19, 44. https://doi.org/10.3390/ECP2022-12615
AMA Style
Lopes TG, Rocha IMM, Aguiar PR, França TV. Influence of Vibroacoustic Phenomena from FFF Process on Surface Characteristics of Printed Parts. Engineering Proceedings. 2022; 19(1):44. https://doi.org/10.3390/ECP2022-12615
Chicago/Turabian StyleLopes, Thiago Glissoi, Isabela Müller Martins Rocha, Paulo Roberto Aguiar, and Thiago Valle França. 2022. "Influence of Vibroacoustic Phenomena from FFF Process on Surface Characteristics of Printed Parts" Engineering Proceedings 19, no. 1: 44. https://doi.org/10.3390/ECP2022-12615