
PEM Electrolyser Digital Twin Embedded within MATLAB-Based Graphical User Interface †


Department of Electrical Engineering, Electronics and Automation, Universidad de Extremadura, Avenida de Elvas, s/n, 06006 Badajoz, Spain
*
Author to whom correspondence should be addressed.
†
Presented at the 1st International Electronic Conference on Processes: Processes System Innovation, 17–31 May 2022; Available online: https://sciforum.net/event/ECP2022 .
Eng. Proc. 2022, 19(1), 21; https://doi.org/10.3390/ECP2022-12676
Published: 31 May 2022
(This article belongs to the Proceedings of The 1st International Electronic Conference on Processes: Processes System Innovation)
Abstract
:In recent years, the use of hydrogen for various applications, such as energy storage in microgrids, vehicle fuel or other industrial processes, has led to the proliferation of PEM electrolysers based on water electrolysis (PEM WE) as hydrogen generators. On the other hand, a digital twin (DT) serves as a replica of the physical device within a virtual environment, whose aim is to mimic the behaviour of the physical device. By means of this digital replica, it is possible to study the behaviour of the PEM WE within the intended system or application in a controlled and safe way, without involving the other components of the system. Typically, the monitoring and control processes of a physical system are supported by graphical user interfaces (GUI). These graphical tools serve as an interactive bridge between the user and the system, facilitating the monitoring of the system as well as the acquisition and presentation of information resulting from its operation. MATLAB is a programming and computing platform that provides users with a variety of applications and toolboxes with very specific functions. Among them is App Designer, an application focused on GUI design and development. This paper describes the design and implementation of a MATLAB-based application that embeds a digital replica of a PEM WE and a GUI dedicated to its control, all framed in the operation of a smart microgrid powered by photovoltaic energy and supported by hydrogen generation and storage.
1. Introduction
The global energy paradigm currently in use is shifting in favour of the use of renewable energies, such as solar photovoltaic, wind or hydraulic, reducing dependence on fossil fuel consumption, as well as reducing the environmental impact. At the same time, new alternative energy sources such as biofuels or the use of non-polluting and easily obtainable gases such as hydrogen are being researched. The applications associated with this gas are diverse and extend across a multitude of sectors, such as healthcare [1], automotive [2] and energy [3].
This product is obtained by means of devices called electrolysers, capable of generating hydrogen through the electrochemical process of electrolysis applied to a compound. The architecture of these devices is very varied, with the Proton Exchange Membrane (PEM) type being one of the most widely used. These electrolysers are commonly used for the production of hydrogen from water, because the products resulting from electrolysis are non-polluting. In particular, if during this process the electrolyser is powered by a renewable energy source, the resulting product is called green hydrogen [4], highlighting the non-polluting quality of the process in all its parts.
In the context of the energy sector, electrolysers have gained relevance in the design and implementation of microgrids, playing a supporting role to the primary generation system through hydrogen generation and storage. This secondary system makes it possible to cope with short- and long-term energy variations in the system [5].
Due to their complex nature, the implementation of electrolysers in a system or process is not immediate and a study of their behaviour must be carried out to evaluate their interaction with the rest of the components. Digital twins are often used in this study. A digital twin (DT) or digital replica refers to the virtualization of a physical process or system with the aim of reproducing its operation in real time. The DT is composed of a model that describes the behaviour of the device and a set of real-time measurements taken from the system. The model uses these real-time input measurements to simulate the output values. As a result, the DT replicates the real-time operation of the device virtually. The model used in a DT can be of different types, such as based on equations of physical laws [6] or black box type, such as neural networks [7]. The implementation of a DT allows the study of the electrolyser independently of the inherent physical limitations of the equipment and the interaction with other elements [8]. On the other hand, the monitoring and control of a physical process is usually implemented through a graphical user interface (GUI) that provides the operator with a better understanding of the state of the system through a visual platform that presents the information necessary for its operation in a clear and orderly manner [9].
This paper presents a MATLAB-based application for the study of a PEM WE installed on a smart microgrid powered by photovoltaic energy and with a secondary hydrogen generation and storage system. The application integrates a DT of the electrolyser running on experimental measurements captured from the system in real time and a GUI to visualise and monitor the values of the system and the virtual counterpart.
2. Materials and Methods
This section is responsible for describing the designed application, the programming environment used, its operating principle and the model on which the DT used is based.
2.1. Programming Environment
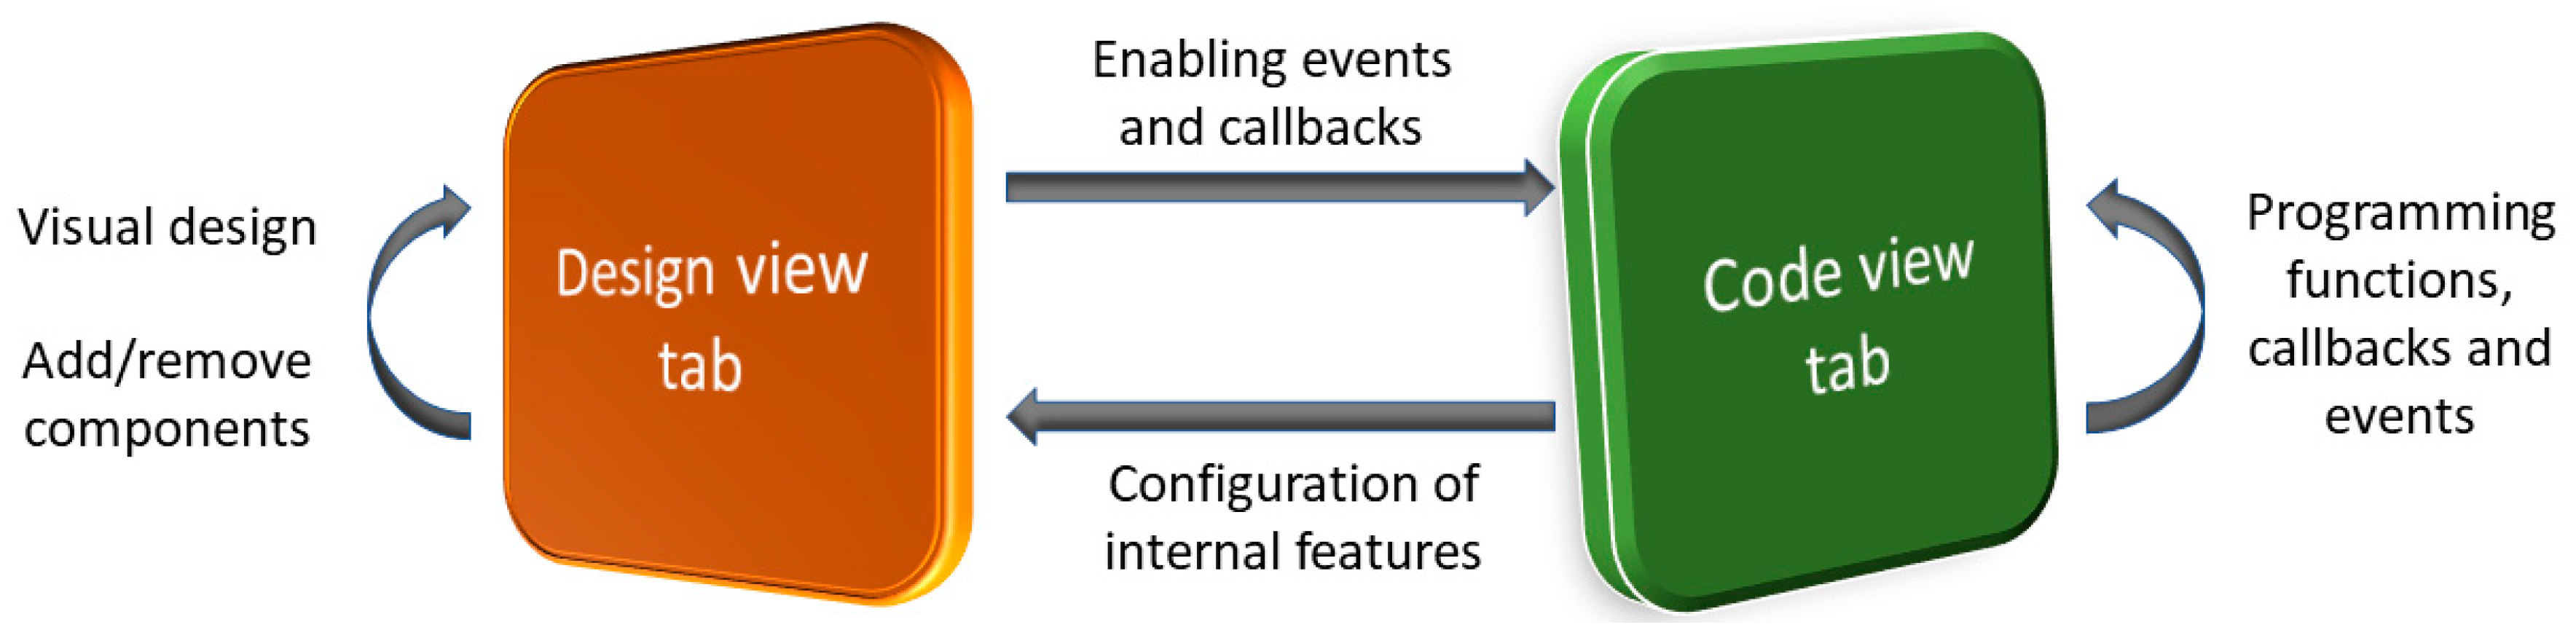
MATLAB software has a specific toolbox for application and GUI design called App Designer, which has been used for this work. The tools provided by this environment give it a versatility that allows the creation of applications and interfaces dedicated to multiple situations [10,11]. The handling of this environment is based on two tabs that separate the design of the application in its graphical aspect and its programming. The first tab, called design view, provides the user with a library of graphical components such as buttons, LEDs or graphics to determine the appearance of the interface. Secondly, the code view window allows the user to program the functions performed by the components in the first window using the MATLAB programming language, as well as to modify their internal characteristics. The diagram in Figure 1 shows the functions performed by each tab and their interaction.
2.2. Principle of Operation
The application designed aims to facilitate the operator’s study and comprehension of the operation of the PEM WE installed in the smart microgrid by means of a user-friendly and intuitive GUI. For this purpose, the application uses a single embedded DT and represents in real time the measured values of the installed PEM WE and those resulting from the simulation of the model included in the DT. The comparison of these values allows us to determine the suitability of the model used in the DT and thus to relate its behaviour to the performance of the real PEM WE.
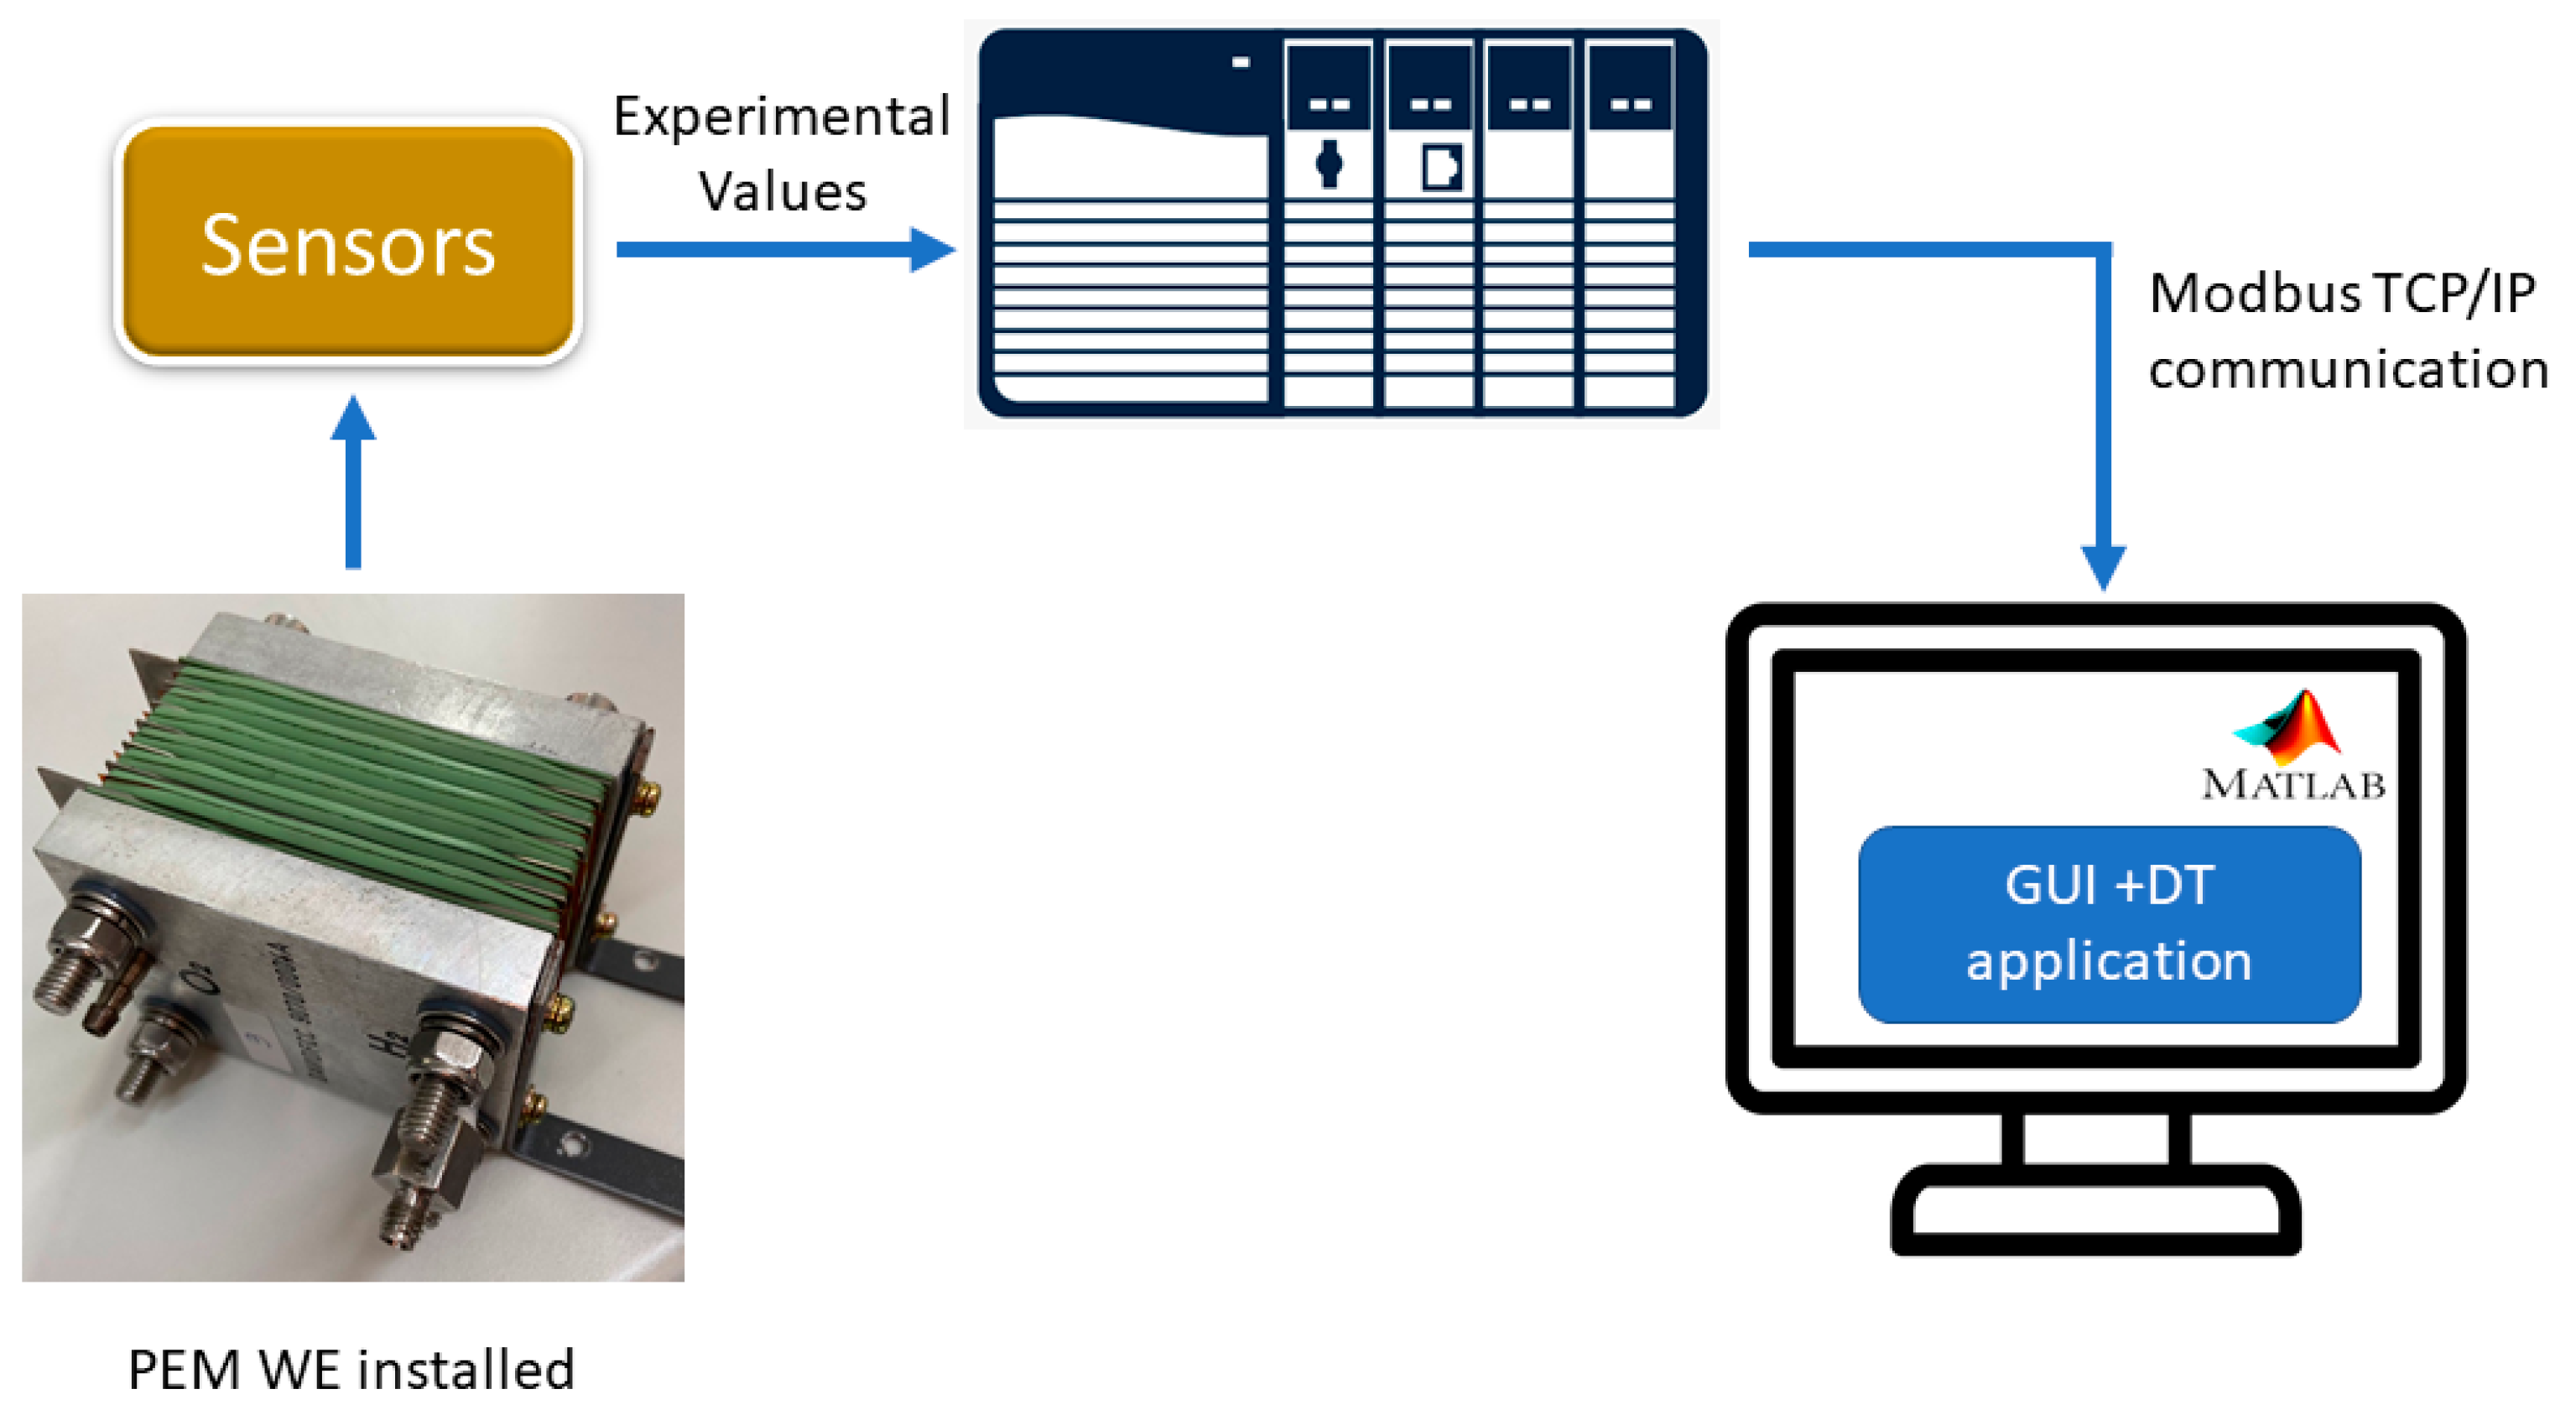
To obtain the experimental values, a PEM WE made up of 6 cells in series forming a stack is used. This stack is sensorised and connected to a programmable logic controller (PLC) to acquire the variables that characterise its operation, such as the consumed current, the voltage or the working temperature.
In order to use the DT of the electrolyser, it is necessary to have the experimental values measured by the PLC in MATLAB. Therefore, a communication between PLC-MATLAB is set up via the Modbus TCP/IP protocol. Modbus was created by Modicon in 1979 for data transmission between PLCs and quickly became a de facto standard due to its simplicity [12]. The TCP/IP version is a client/server protocol running on Ethernet.
Once the communication is established, the application simulates the model and presents the results on the interface. Figure 2 shows the described process and the interaction between the different components.
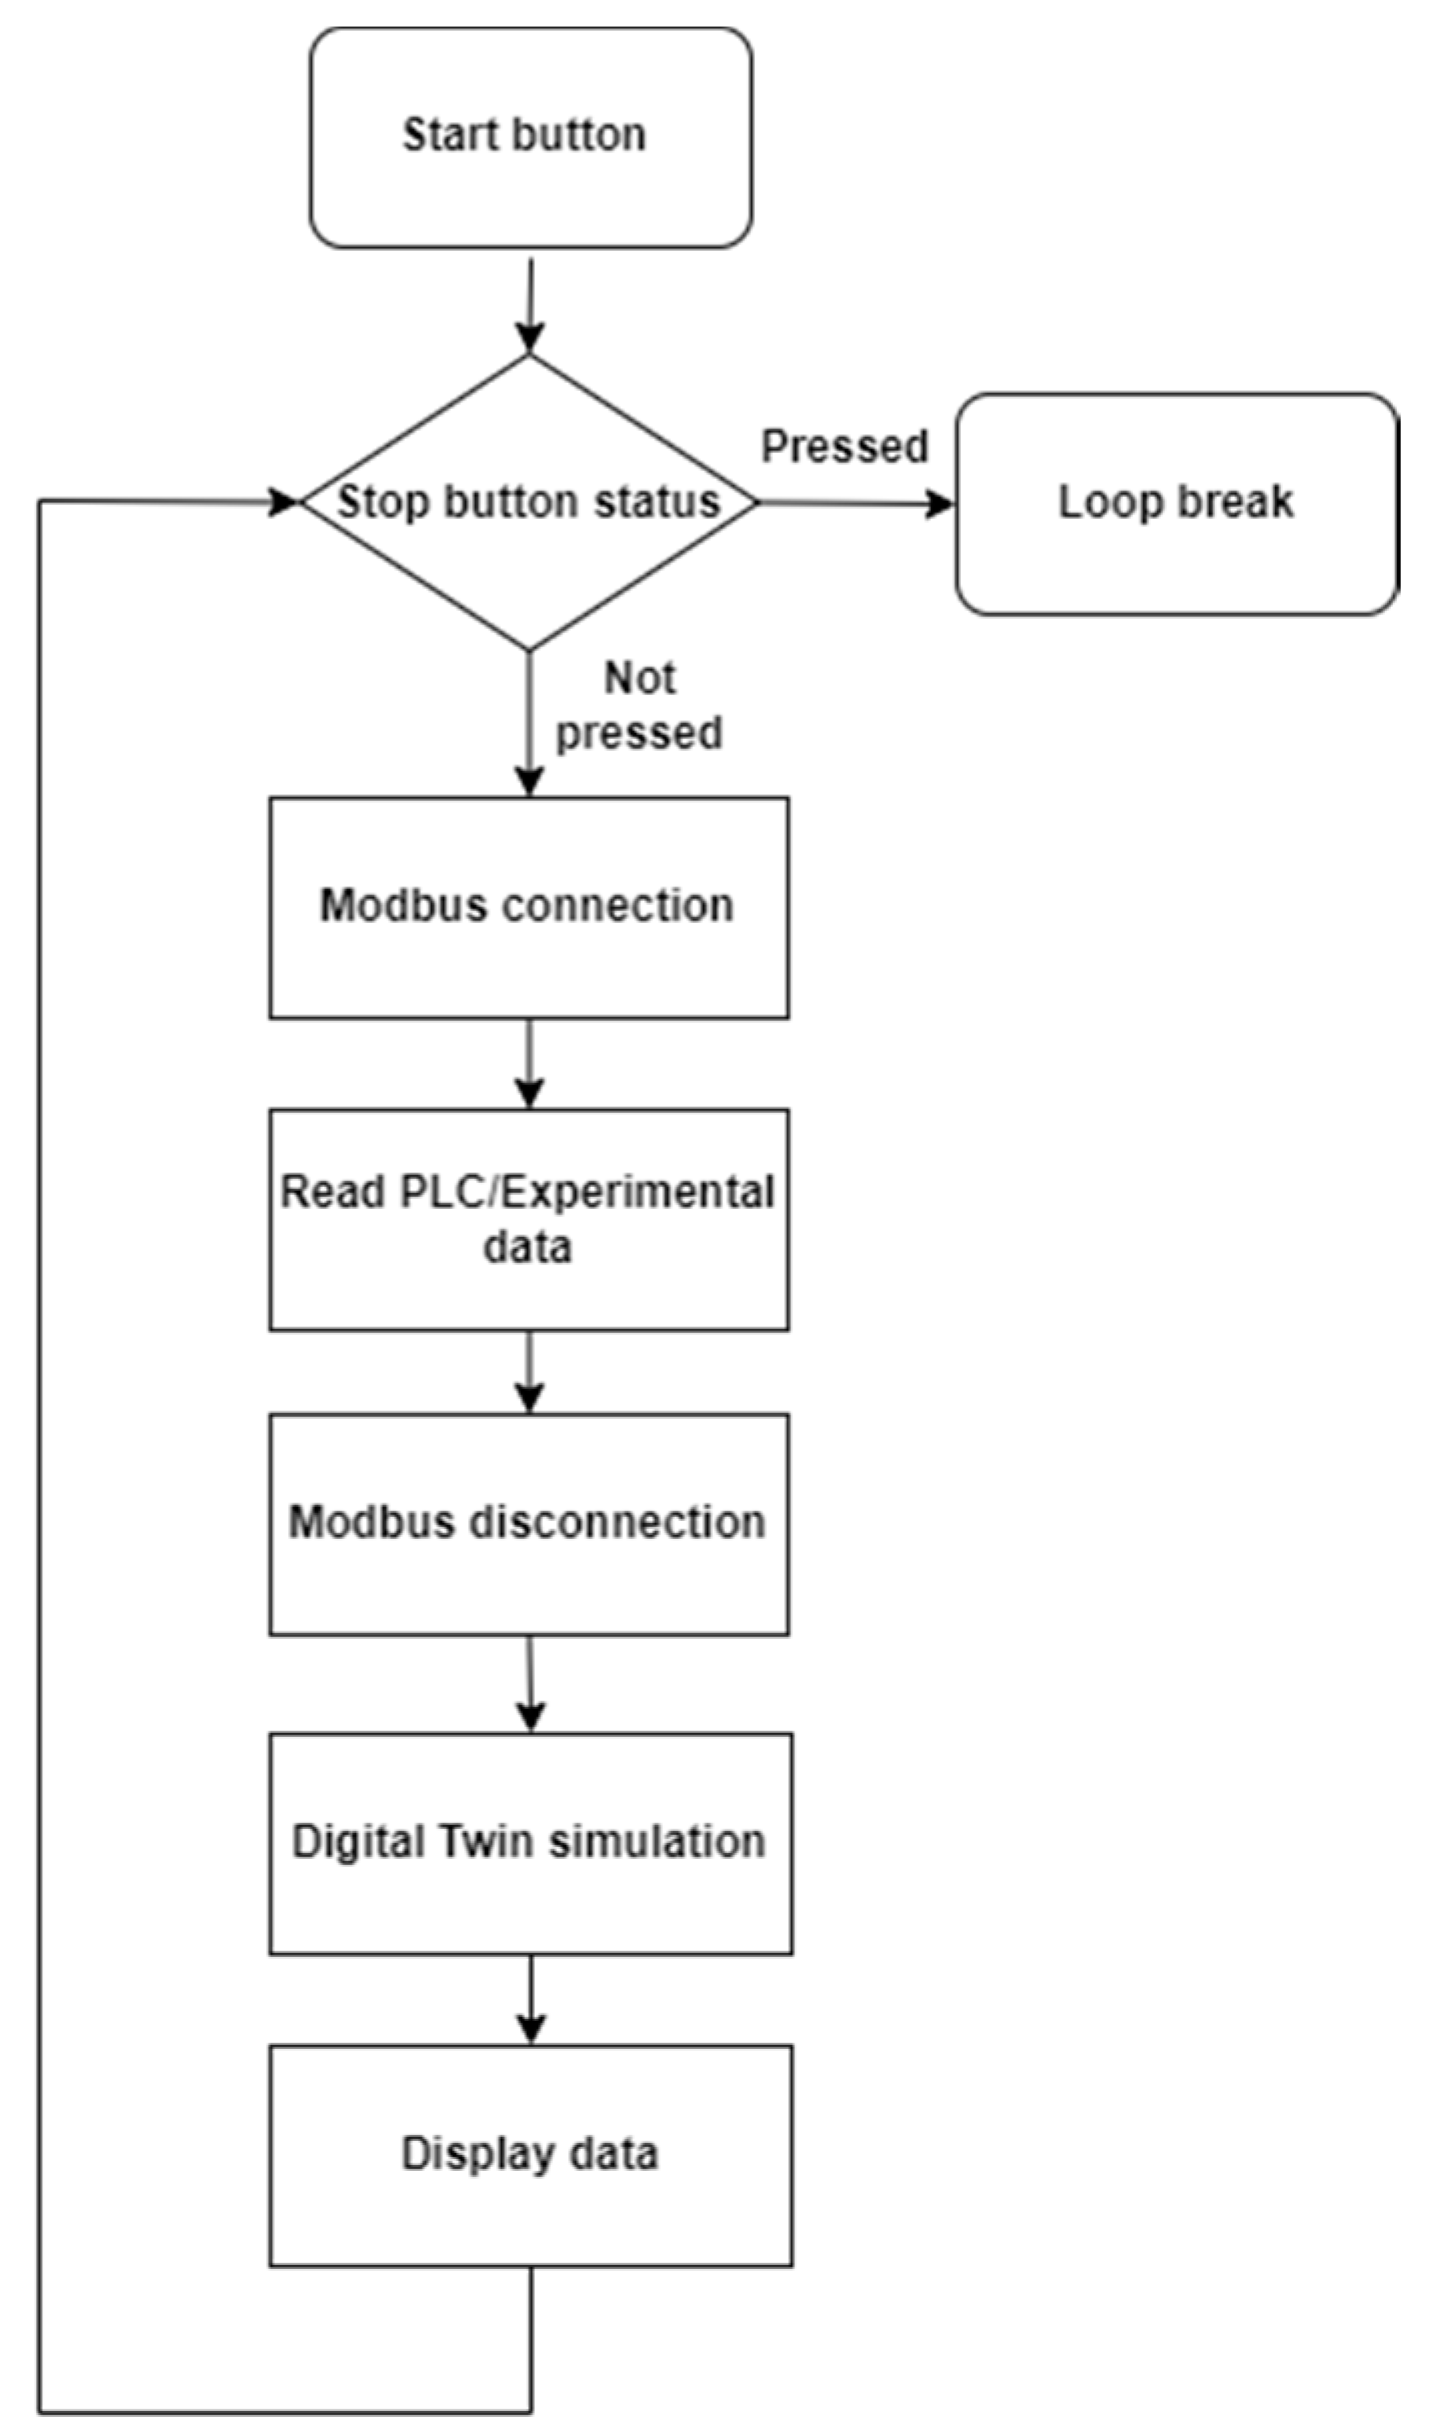
From the interface point of view, the application is controlled by two buttons called Start and Stop. The Start button executes a loop of actions comprising Modbus communication with the PLC, the execution of the DT model and the display of experimental and simulated values. This sequence of actions is executed uninterruptedly as long as the Stop button is not pressed. In this way, real-time operation of the model is achieved through a continuous reading of data. Figure 3 summarises the sequence of actions performed by the application by means of a flowchart.
2.3. Digital Twin
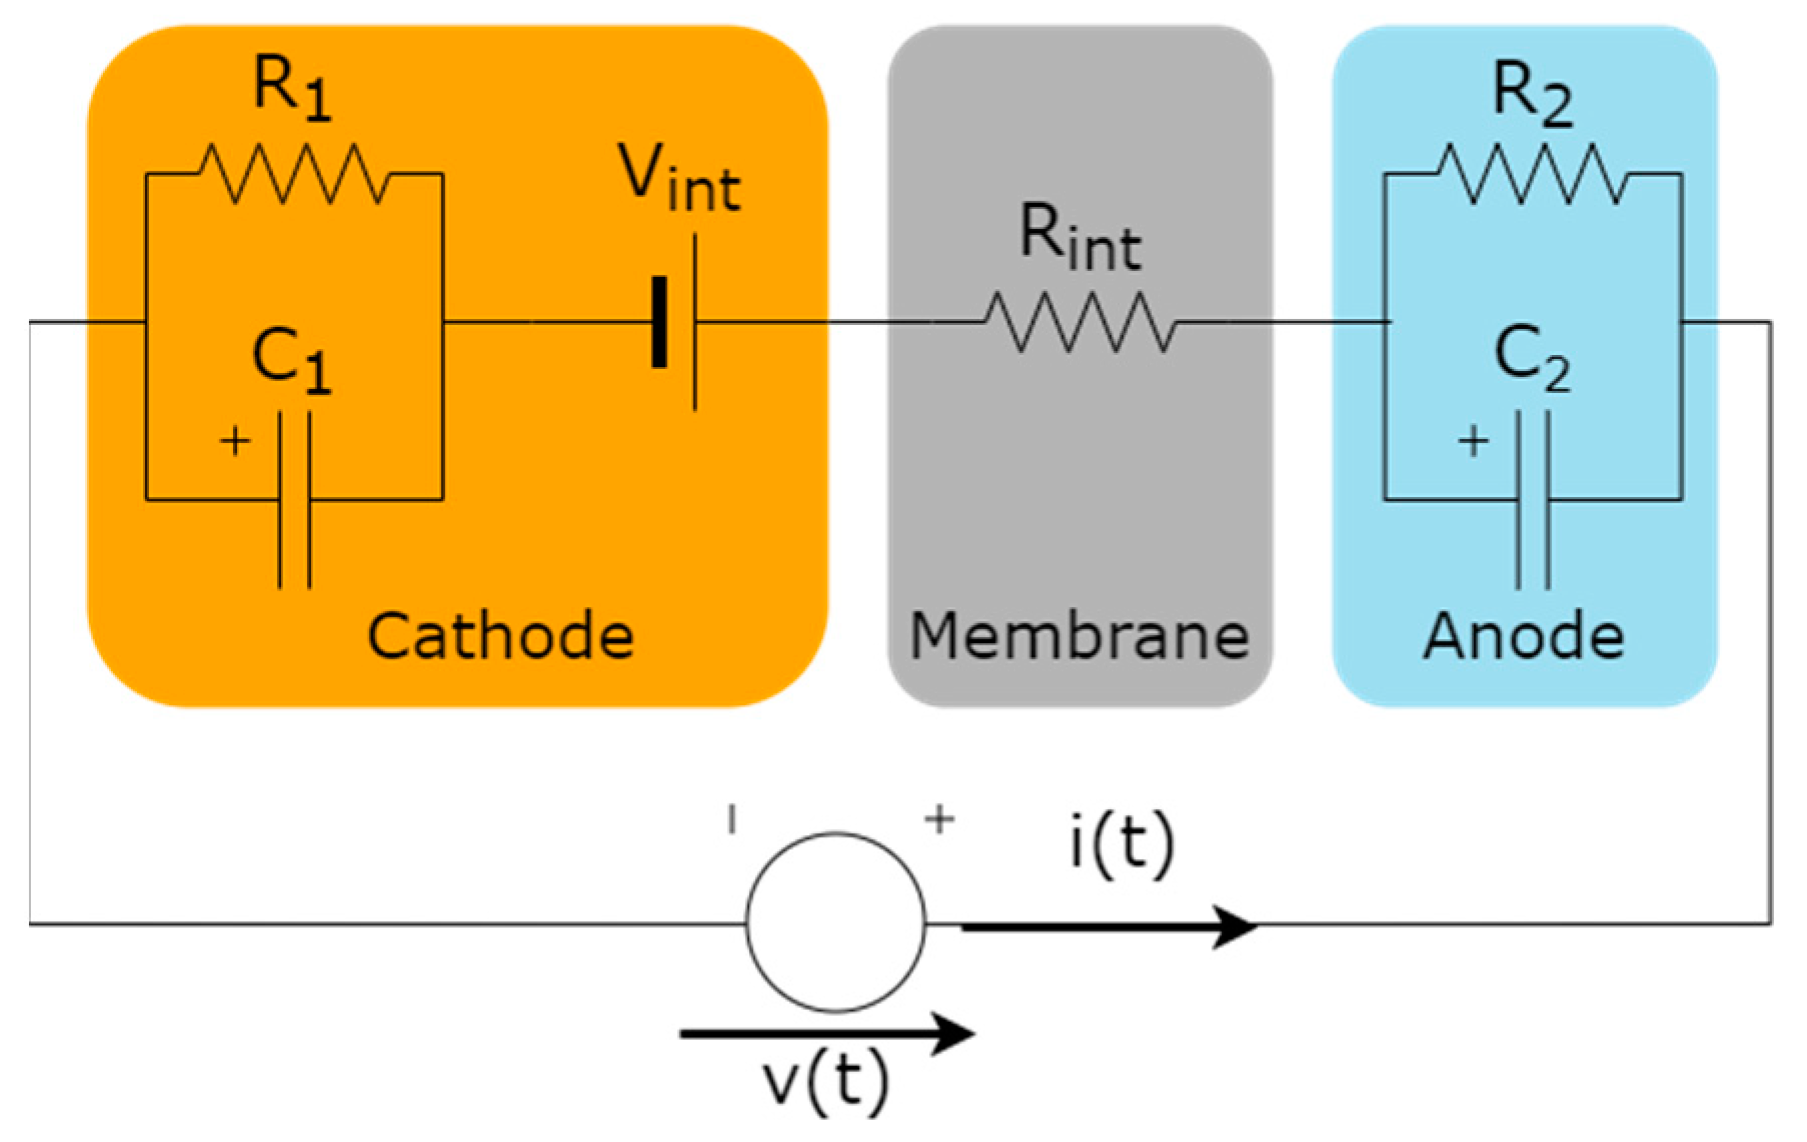
The DT implemented in the application uses a single model to simulate the operation of the PEM WE. It should be clarified that the aim of this article is not to develop an electrolyser model, so the application uses the model described in [13], due to its ease of compression and proven validity. This model is based on the equivalent electrical diagram shown in Figure 4, where each component is associated with a local effect of the electrolyser behaviour and its values are determined by a dynamic study of the device.
Derived from this electrical schematic, the following expressions are obtained. The electrolyser voltage V is determined in Equation (1) through the internal voltage Vint and the resistance Rtot, this resistance being the sum of R1 and R2.
The power consumed by the electrolyser is given by Equation (2):
The hydrogen flow rate is calculated from Equation (3), where Ncell, F and R are the total number of cells in the electrolyser, Faraday’s constant and the ideal gas constant, respectively.
Finally, Equation (4) expresses the efficiency of the electrolyser through the ratio of Vint to V.
3. Implementation and Results
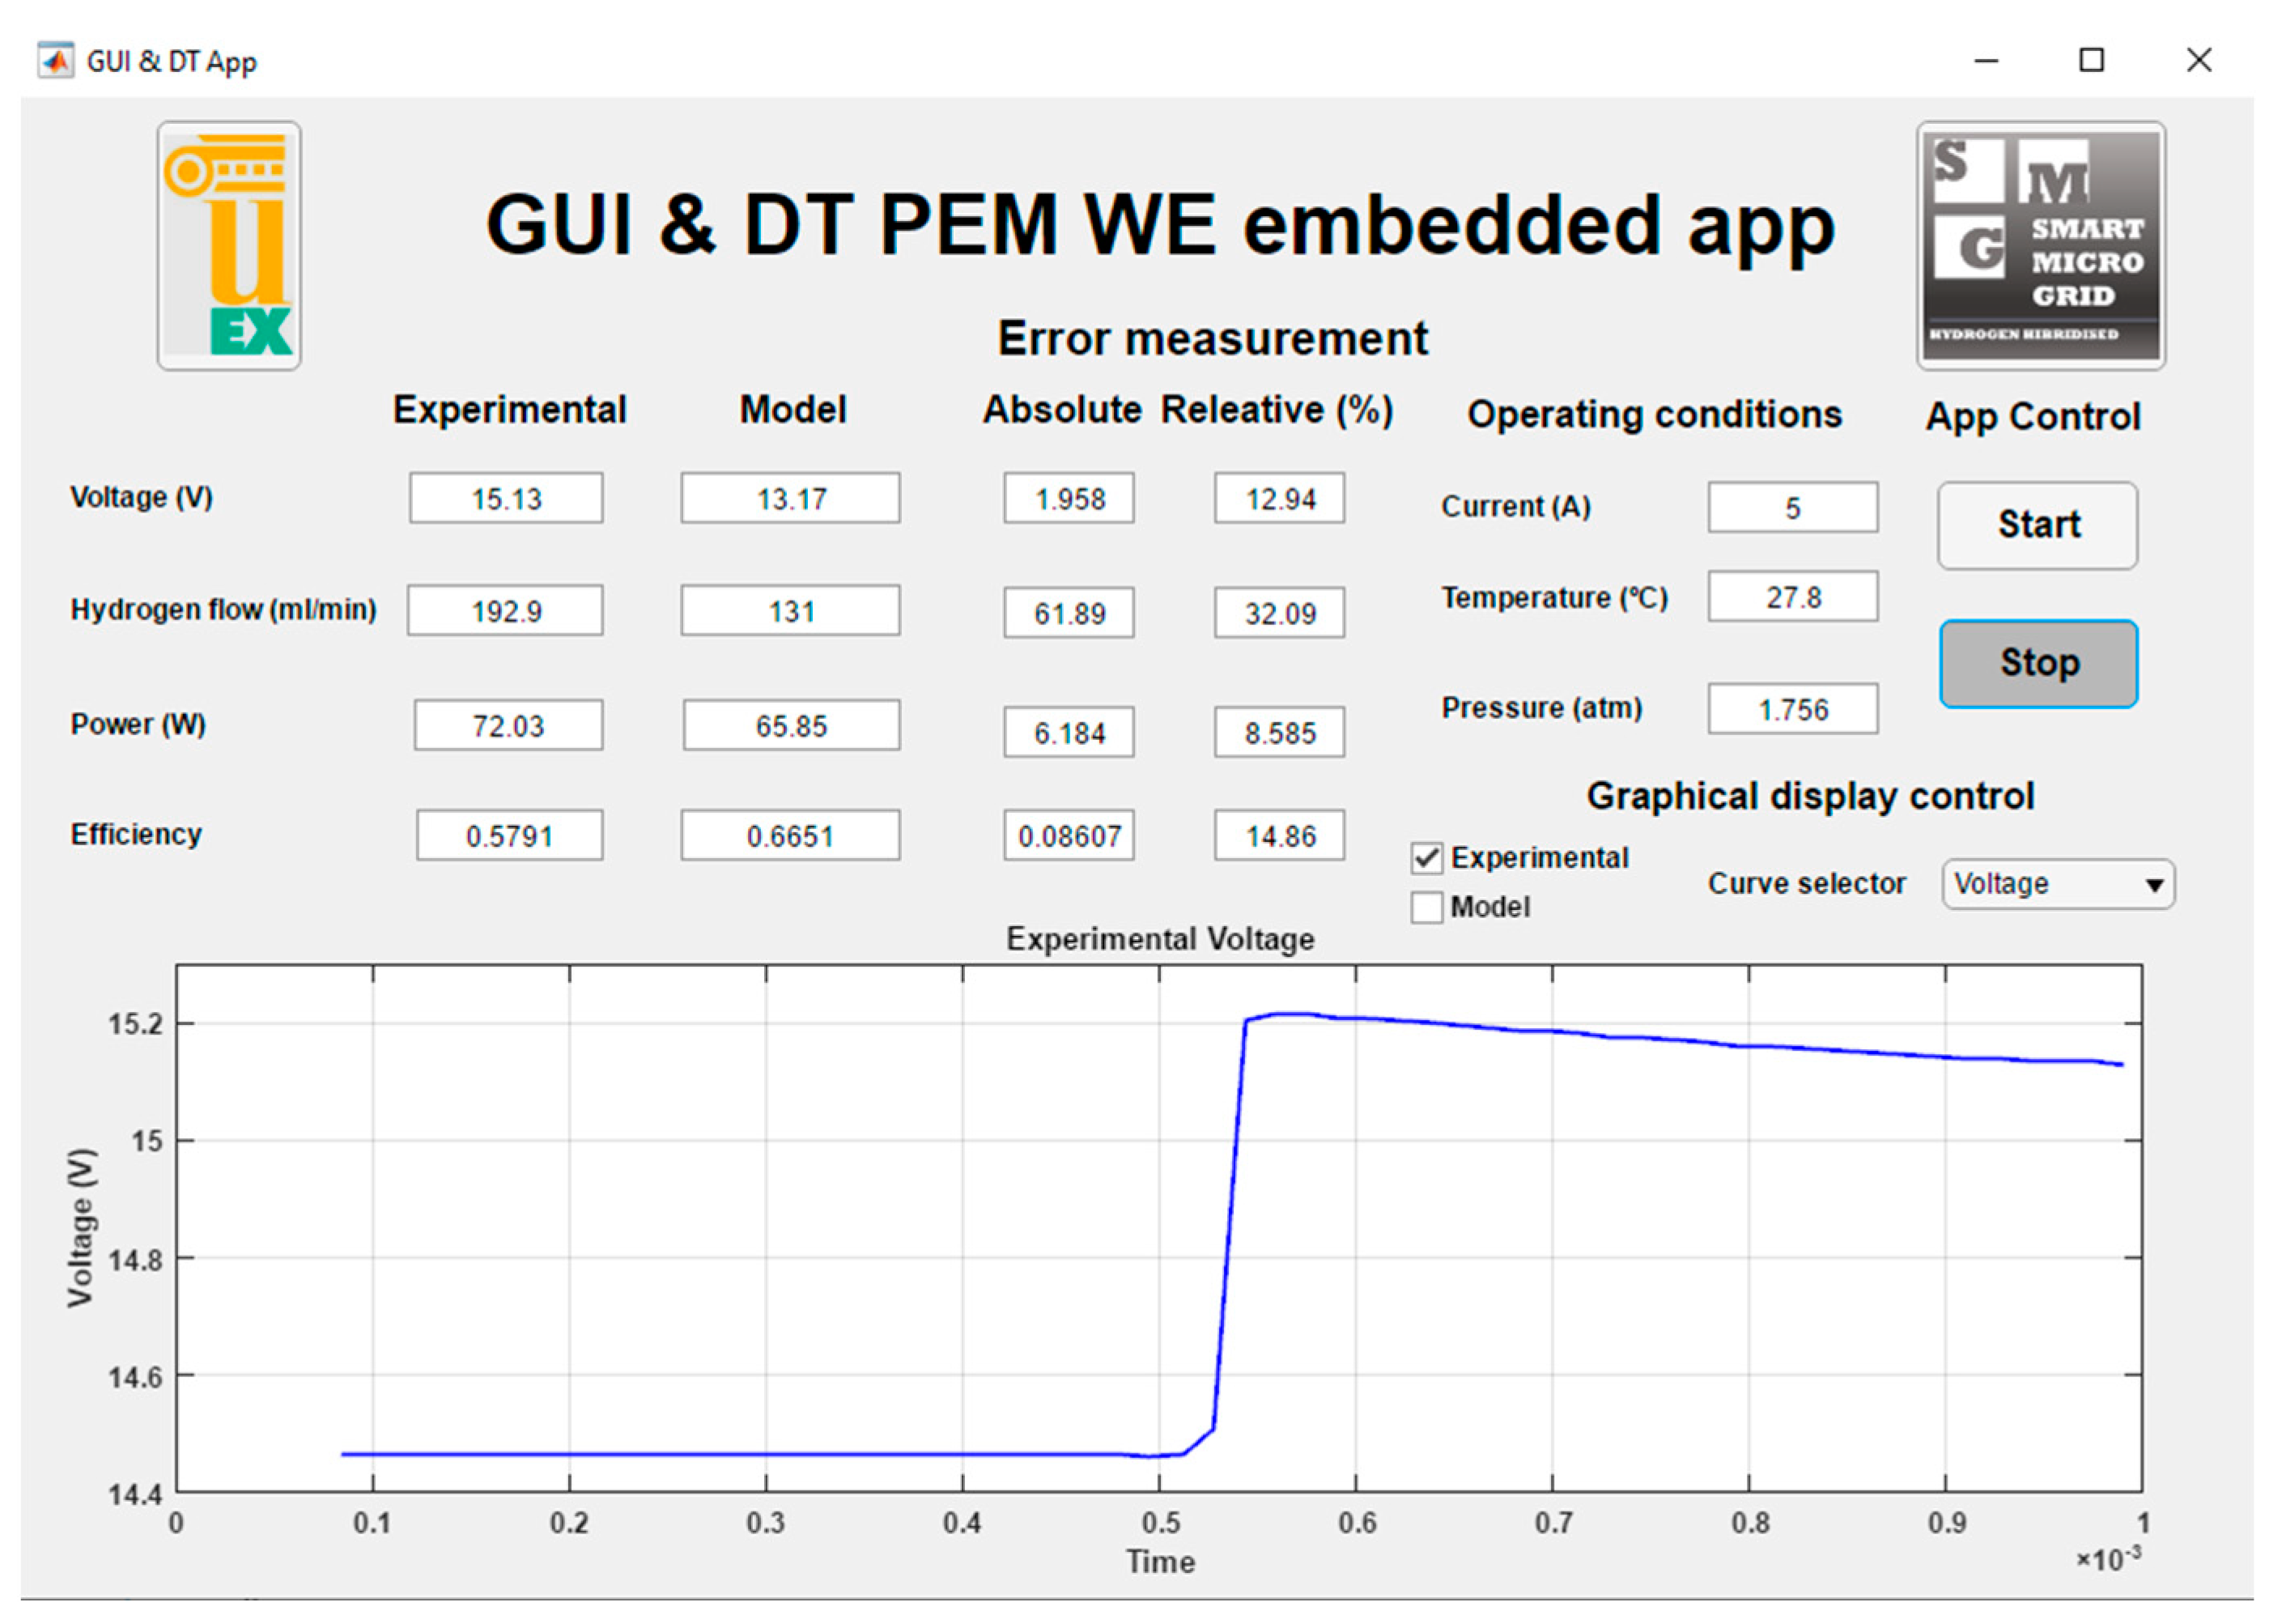
The appearance of the designed application during its execution is shown in Figure 5. The interface is divided into four zones. In the first area, the experimental and model-calculated instantaneous values are grouped together, as well as the absolute and relative errors between these values. In ‘Operating conditions’, the variables with common values in the experimental and model part are displayed, such as current, temperature and working pressure. Next, the ‘App Control’ buttons are located together. Finally, the lower part is occupied by a chart and a set of selectors positioned in the ‘Graphical display’ area. This graph allows the time variation of the variable selected in the drop-down menu to be represented, whether it is the experimental value, the model or both. An example of this is the variation in the experimental voltage as the current consumed increases from 3 to 5 A.
By means of the GUI presented, the application allows the monitoring of the most significant magnitudes of the PEM WE operation, as well as simulating the DT model and comparing both values numerically and graphically thanks to the indicators and the chart located in the GUI, respectively, highlighting the real-time capability of the application to perform these functions through its Modbus communication with the PLC.
4. Conclusions
This paper has presented a MATLAB-based application for the study of a PEM WE through a combination of interface and digital twin. The GUI provides a user-friendly environment and visualises the evolution of the operation of an experimental electrolyser by the means of a Modbus TCP/IP communication that allows the real-time reading of the data. This information is used by the embedded DT to simulate the behaviour of the electrolyser and return a series of results based on an equivalent electrical model according to [13].
Further works will address the implementation of new features that will provide the application with useful functionalities for the study of the electrolyser, while maintaining a user-friendly handling and appearance. Another future guideline deals with the development of a model for the installed PEM WE and its application for a new embedded DT.
Author Contributions
Conceptualization, F.J.F. and A.J.C.; Methodology, I.G.; Software, F.J.F.; Validation, A.J.C.; Investigation, F.J.F., I.G. and A.J.C.; Data curation, F.J.F.; Writing—original draft preparation, F.J.F. and I.G.; Writing—review and editing, I.G. and A.J.C.; Supervision, I.G. and A.J.C.; Project administration, A.J.C.; Funding acquisition; A.J.C. All authors have read and agreed to the published version of the manuscript.
Funding
This project was co-financed by the European Regional Development Funds FEDER and the Regional Government of Extremadura (IB18041).
Institutional Review Board Statement
Not applicable.
Informed Consent Statement
Not applicable.
Data Availability Statement
Data sharing not applicable.
Conflicts of Interest
The authors declare no conflict of interest.
References
- Yuan, X.; Liu, J.; Han, C.; Li, Y.; Feng, Y. Simultaneous nutrient-energy recovery from source-separated urine based on bioelectrically enhanced bipolar membrane-driven in-situ alkali production coupling with gas-permeable membrane system. Chem. Eng. J. 2022, 431, 134161. [Google Scholar] [CrossRef]
- He, H.; Wang, X.; Chen, J.; Wang, Y.-X. Regenerative Fuel Cell-Battery-Supercapacitor Hybrid Power System Modeling and Improved Rule-Based Energy Management for Vehicle Application. J. Energy Eng. 2020, 146, 04020060. [Google Scholar] [CrossRef]
- González, I.; Calderón, A.J.; Andújar, J.M. Novel remote monitoring platform for RES-hydrogen based smart microgrid. Energy Convers. Manag. 2017, 148, 489–505. [Google Scholar] [CrossRef]
- Noussan, M.; Raimondi, P.P.; Scita, R.; Hafner, M. The role of green and blue hydrogen in the energy transition—A technological and geopolitical perspective. Sustainability 2021, 13, 298. [Google Scholar] [CrossRef]
- Atlam, O.; Kolhe, M. Equivalent electrical model for a proton exchange membrane (PEM) electrolyser. Energy Convers. Manag. 2011, 52, 2952–2957. [Google Scholar] [CrossRef]
- Awasthi, A.; Scott, K.; Basu, S. Dynamic modeling and simulation of a proton exchange membrane electrolyzer for hydrogen production. Int. J. Hydrogen Energy 2011, 36, 14779–14786. [Google Scholar] [CrossRef]
- Bárkányi, Á.; Chován, T.; Németh, S.; Abonyi, J. Modelling for digital twins—Potential role of surrogate models. Processes 2021, 9, 476. [Google Scholar] [CrossRef]
- Zhao, D.; He, Q.; Yu, J.; Guo, M.; Fu, J.; Li, X.; Ni, M. A data-driven digital-twin model and control of high temperature proton exchange membrane electrolyzer cells. Int. J. Hydrogen Energy 2022, 47, 8687–8699. [Google Scholar] [CrossRef]
- Mancera, J.J.C.; Manzano, F.S.; Andújar, J.M.; Vivas, F.J.; Calderón, A.J. An optimized balance of plant for a medium-size PEM electrolyzer. Design, control and physical implementation. Electronics 2020, 9, 871. [Google Scholar] [CrossRef]
- Pérez-Rubio, M.C.; Hernández, Á.; Gualda-Gómez, D.; Murano, S.; Vicente-Ranera, J.; Ciudad-Fernández, F.; Villadangos, J.M.; Nieto, R. Simulation Tool and Online Demonstrator for CDMA-Based Ultrasonic Indoor Localization Systems. Sensors 2022, 22, 1038. [Google Scholar] [CrossRef] [PubMed]
- Broden, D.A.; Paridari, K.; Nordstrom, L. Matlab applications to generate synthetic electricity load profiles of office buildings and detached houses. In Proceedings of the 2017 IEEE Innovative Smart Grid Technologies—Asia: Smart Grid for Smart Community, ISGT-Asia 2017, Auckland, New Zealand, 4–7 December 2017; Institute of Electrical and Electronics Engineers Inc.: Piscataway, NJ, USA, 2018; pp. 1–6. [Google Scholar]
- González, I.; Calderón, A.J.; Portalo, J.M. Innovative multi-layered architecture for heterogeneous automation and monitoring systems: Application case of a photovoltaic smart microgrid. Sustainability 2021, 13, 2234. [Google Scholar] [CrossRef]
- Guilbert, D.; Vitale, G. Dynamic emulation of a PEM electrolyzer by time constant based exponential model. Energies 2019, 12, 750. [Google Scholar] [CrossRef] [Green Version]
Figure 1.
Structure and functioning of App Designer.

Figure 2.
Principle of operation.

Figure 3.
Flowchart of application operation.

Figure 4.
Equivalent electrical diagram of the PEM WE described in [13].
Figure 4.
Equivalent electrical diagram of the PEM WE described in [13].

Figure 5.
Designed application in operation.

Publisher’s Note: MDPI stays neutral with regard to jurisdictional claims in published maps and institutional affiliations. |
© 2022 by the authors. Licensee MDPI, Basel, Switzerland. This article is an open access article distributed under the terms and conditions of the Creative Commons Attribution (CC BY) license (https://creativecommons.org/licenses/by/4.0/).
Share and Cite
MDPI and ACS Style
Folgado, F.J.; González, I.; Calderón, A.J. PEM Electrolyser Digital Twin Embedded within MATLAB-Based Graphical User Interface. Eng. Proc. 2022, 19, 21. https://doi.org/10.3390/ECP2022-12676
AMA Style
Folgado FJ, González I, Calderón AJ. PEM Electrolyser Digital Twin Embedded within MATLAB-Based Graphical User Interface. Engineering Proceedings. 2022; 19(1):21. https://doi.org/10.3390/ECP2022-12676
Chicago/Turabian StyleFolgado, Francisco Javier, Isaías González, and Antonio José Calderón. 2022. "PEM Electrolyser Digital Twin Embedded within MATLAB-Based Graphical User Interface" Engineering Proceedings 19, no. 1: 21. https://doi.org/10.3390/ECP2022-12676