
Evaluation of Fluorescent Staining Capacity of Two New Nile Blue Analogues †
by
 and
and
João C. C. Ferreira
1,2,3, 
Rui P. C. L. Sousa
1,
Maria João M. F. Sousa
2,3 and
M. Sameiro T. Gonçalves
1,* 1
Centre of Chemistry (CQ-UM), Department of Chemistry, University of Minho, Campus of Gualtar, 4710-057 Braga, Portugal
2
Centre of Molecular and Environmental Biology (CBMA), Department of Biology, IBS-Institute of Science and Innovation for Bio-Sustainability, 4710-057 Braga, Portugal
3
IBS-Institute of Science and Innovation for Bio-Sustainability, University of Minho, Campus of Gualtar, 4710-057 Braga, Portugal
*
Author to whom correspondence should be addressed.
†
Presented at the 24th International Electronic Conference on Synthetic Organic Chemistry, 15 November–15 December 2020; Available Online: https://sciforum.net/conference/ecsoc-24 .
Chem. Proc. 2021, 3(1), 63; https://doi.org/10.3390/ecsoc-24-08383
Published: 14 November 2020
(This article belongs to the Proceedings of The 24th International Electronic Conference on Synthetic Organic Chemistry)
Abstract
:Benzophenoxazine fluorophores, including derivatives of Nile Blue, one of the best known in this family of compounds, have been used as histological stains due to their optical properties in the NIR region and stability. Given their potential, the synthesis of two new Nile Blue derivatives with different substituents on the amines of the positions 5 and 9 was performed, with the introduction of a sulfonamide group in one of the compounds. Photophysical properties of the compounds were evaluated in acidified ethanol and aqueous solution at physiological pH. The fluorescent staining capacity was evaluated by staining Saccharomyces cerevisiae with the compounds, followed by fluorescence microscopy.
1. Introduction
Small fluorescent molecules have emerged as essential tools for contemporary analytical methodologies applied in the biosciences field [1]. In this field, benzo[a]phenoxazines, that include Nile Blue, the best known of this family of compounds, present a set of features that makes them good fluorescent probes for biological applications [2,3,4]. They emit fluoresce in the near-infrared (NIR) region of the spectrum, a region that does not interfere with the natural fluorescence of biological compounds. Furthermore, they are characterized by presenting high photostability, molar absorption molar coefficients and modest Stokes shifts, great features for fluorescent applications [5,6]. As such, they have been used in covalent and non-covalent labeling of amino acids, proteins and DNA, among other biological material [7,8,9,10].
Considering all these facts, the synthesis of two new benzo[a]phenoxazinium chlorides possessing one ethyl group at 9-amino position and a methyl group at 10-position, with a propylamino or a 3-(propylsulfonamido)propyl)amino group at the 5-amino position, was carried out. Photophysical properties in ethanol acidified with trifluoroacetic acid (TFA) and in aqueous solution at physiological pH were measured. The fluorescent staining pattern was evaluated in staining Saccharomyces cerevisiae with the compounds, followed by fluorescence microscopy analysis.
2. Results and Discussion
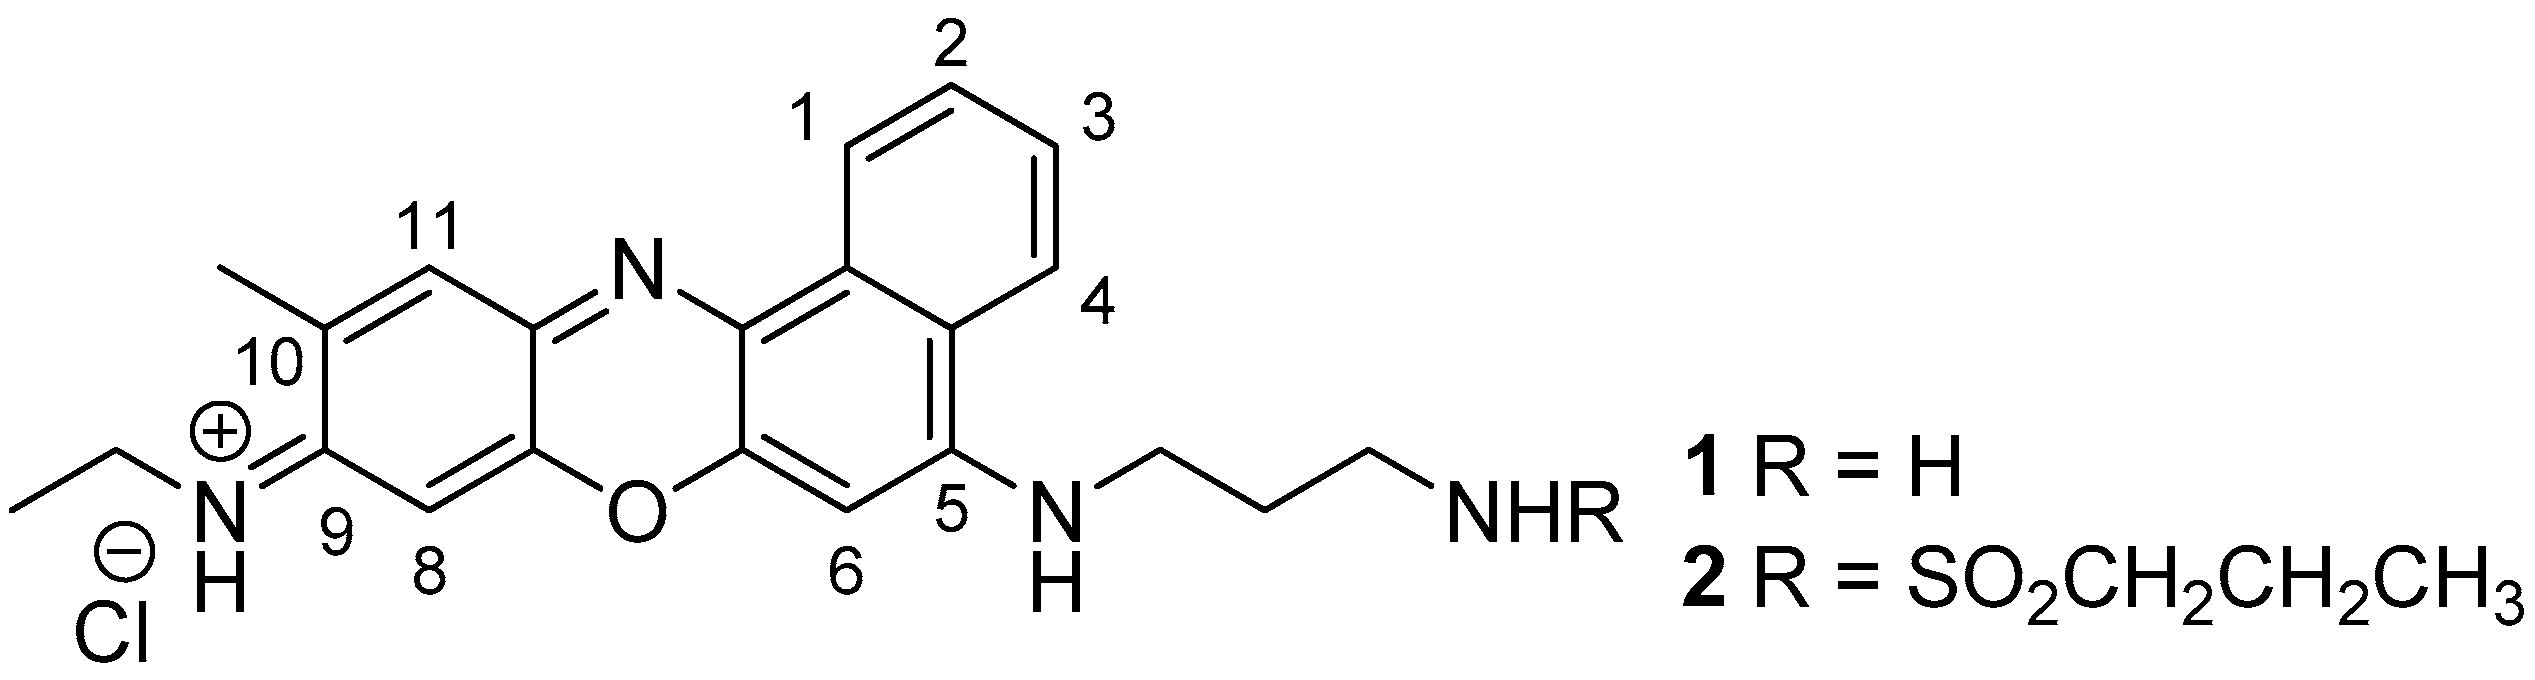
Benzo[a]phenoxazinium chlorides 1 and 2 were synthesized by condensation of 5-(ethylamino)-4-methyl-2-nitrosophenol hydrochloride with N1-(naphthalen-1-yl)propane-1,3-diamine hydrobromide or N-(3-(naphthalen-1-ylamino)propyl)propane-1-sulfonamide, respectively. Nitrosophenol hydrochloride was obtained by nitrosation of the 3-(ethylamino)-4-methylphenol with sodium nitrite in the presence of hydrochloric acid. The two benzo[a]phenoxazinium chlorides 1 and 2 were obtained as blue solids in 44 and 56% yields, respectively, and characterized by the usual analytical techniques (Figure 1).
Photophysical properties of benzo[a]phenoxazinium chlorides 1 and 2 were evaluated through absorption and emission spectra of 10−6 M solutions in ethanol acidified with TFA and aqueous solution at physiological pH. The relative fluorescence quantum yields (ΦF) were determined using Oxazine 1 as a standard (ΦF = 0.11 in ethanol) at a wavelength of excitation (λexc) of 590 nm. Results are presented in Table 1.
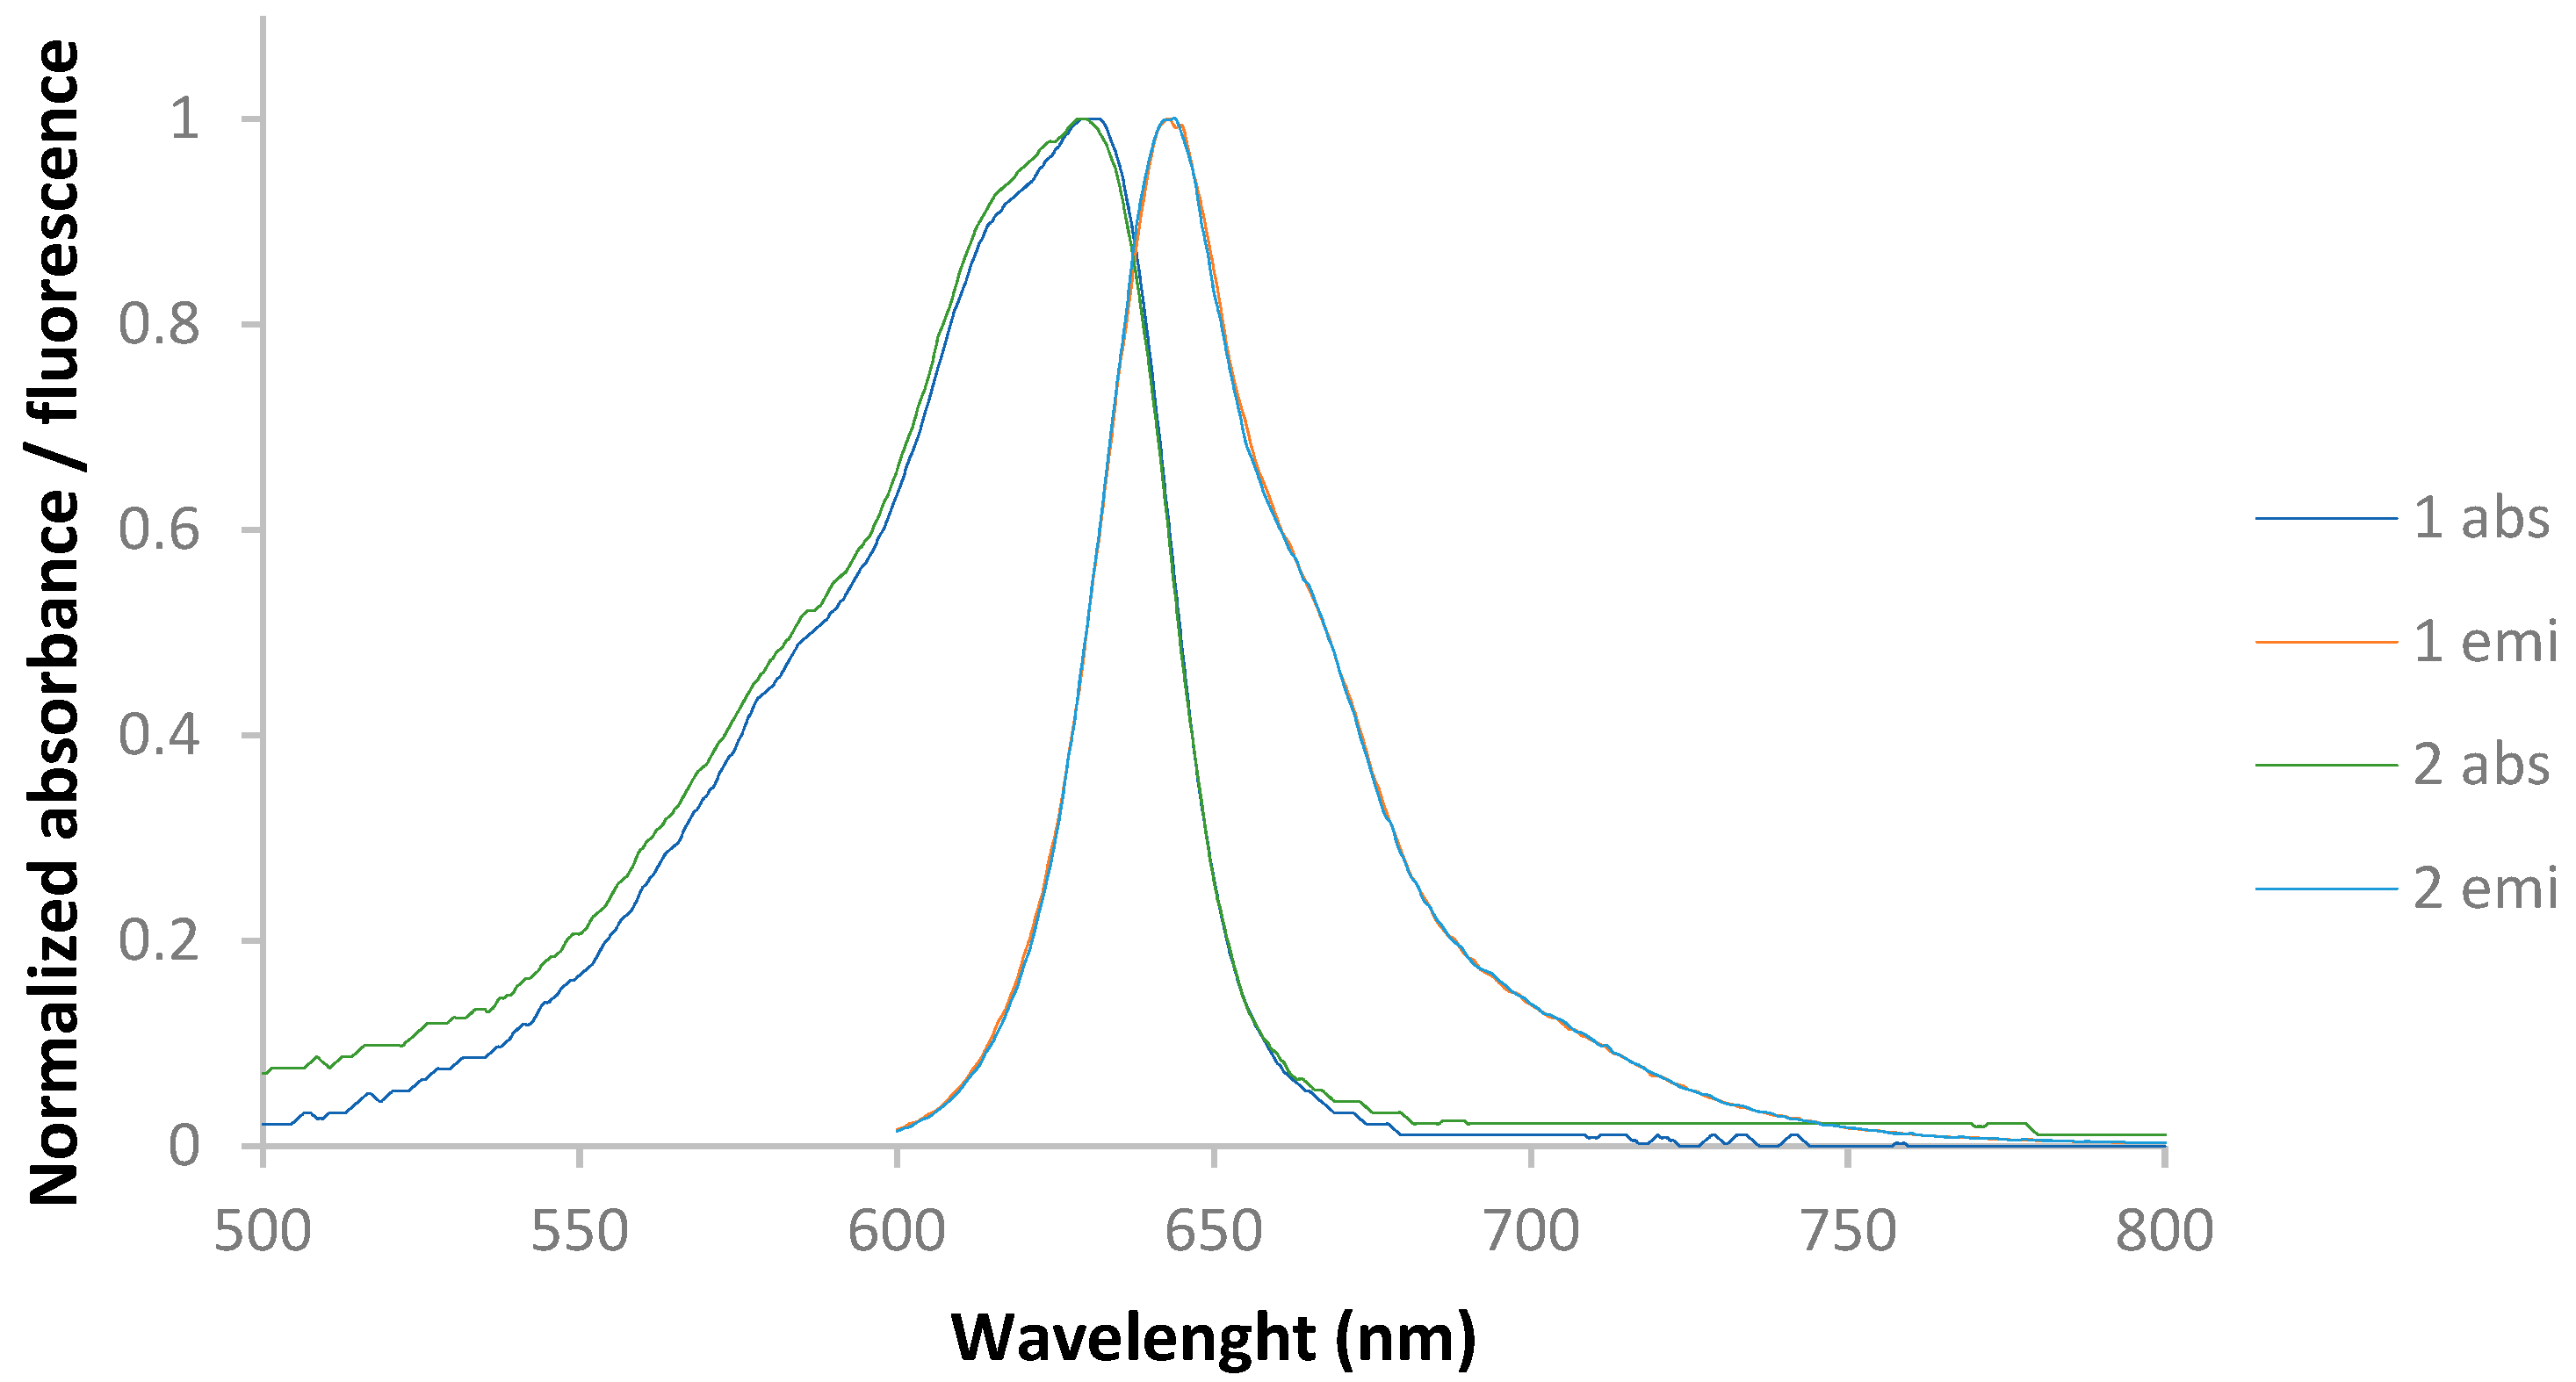
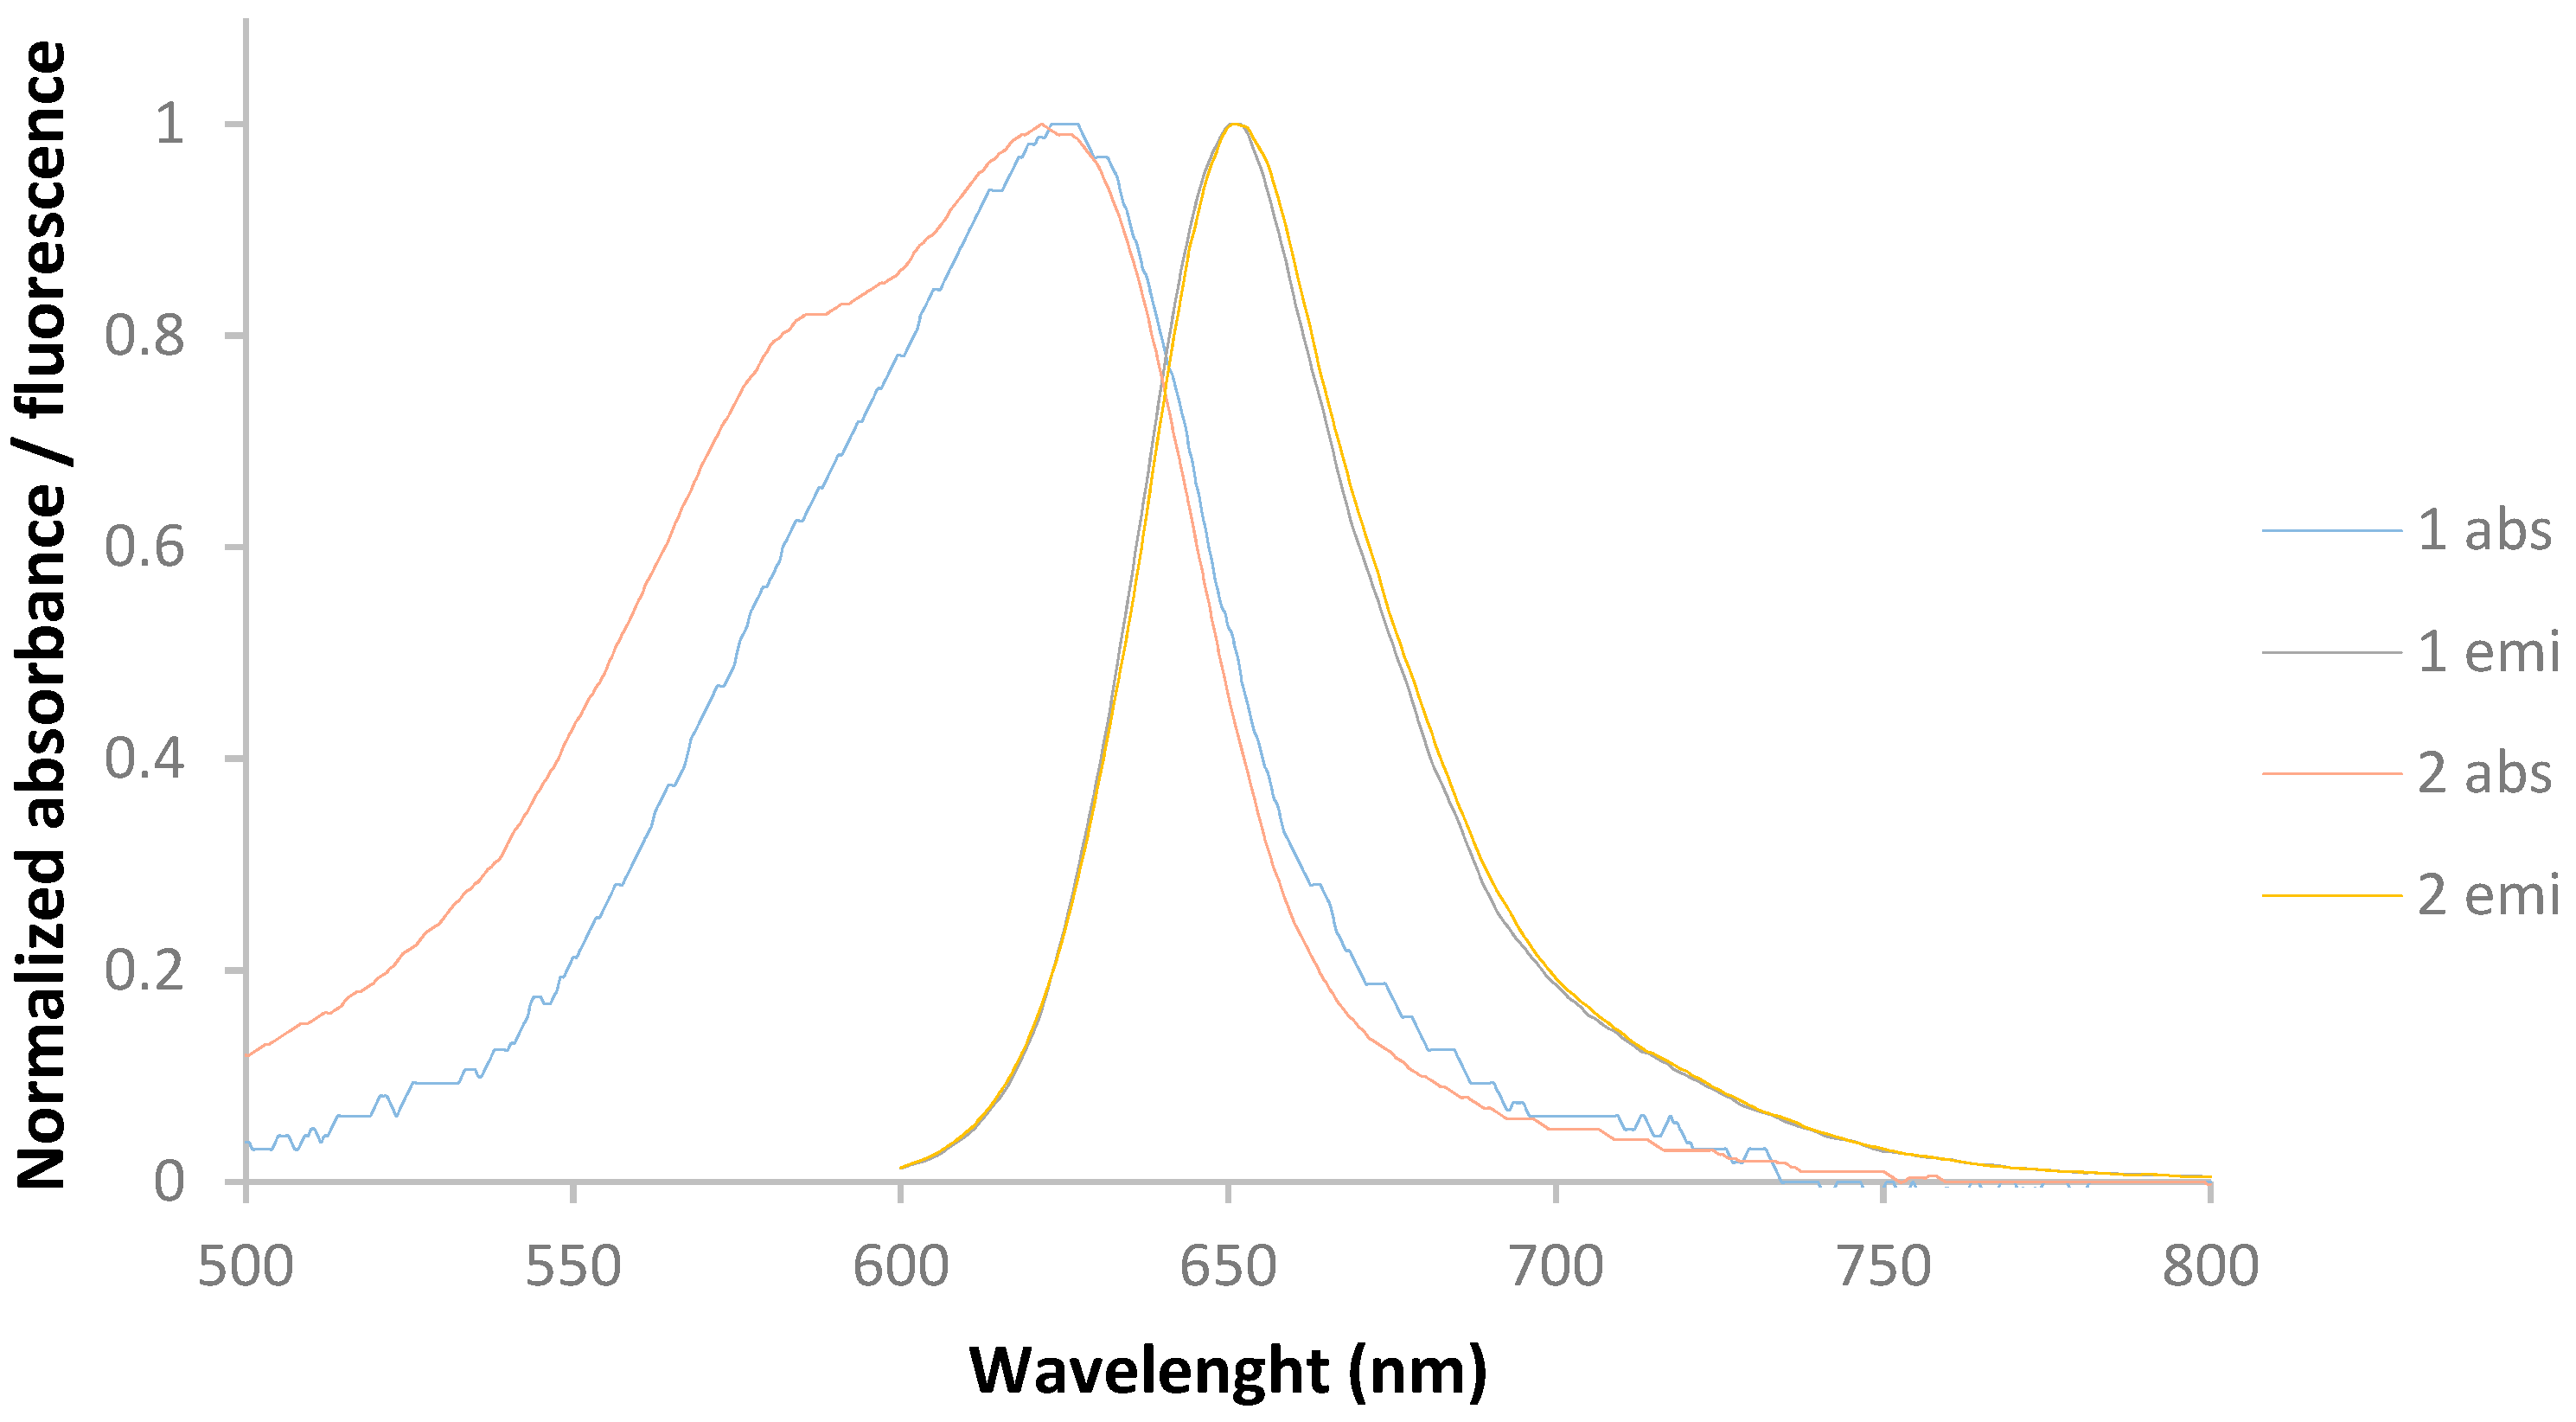
In acidic ethanol and pH 7.4 maximum absorption wavelengths (λabs) for both compounds were 621 or 627 nm, with molar extinction coefficients in its logarithmic form (Log ε) between 3.90 and 5.17. The maximum emission wavelengths (λemi) were found to be in the range of 643–651 nm at excitation of 590 nm, with moderate Stokes shifts (∆λ 16–28 nm). In general, it is clear that in ethanol both compounds show higher values for Log ɛ and for ΦF, which is expected. It can also be seen that, even though λabs is similar in both solvents, λemi is higher in water, which leads to higher Stokes shifts.
Figure 2 and Figure 3 show normalized absorption and emission spectra of the two benzo[a]phenoxazinium chlorides 1 and 2 in acidified ethanol and aqueous solutions at physiological pH, respectively.
In order to evaluate the fluorescent staining capacity of the compounds, the intracellular distribution of the benzo[a]phenoxazinium chlorides 1 and 2 was assessed by fluorescence microscopy.
S. cerevisiae W303-1A cells were incubated with 12.5 µM of 1 and 2 for two hours and observed on the fluorescence microscopy. It was observed that the incubation resulted in the accumulation of both compounds within the cells, as it was detected near infrared fluorescence emission from the cell cytoplasmatic material upon excitation with a far-red filter setup. However, it was noticed that compound 1 presented a not so specific fluorescence staining of the cell (Figure 4), in contrast with compound functionalized with the sulfonamide group 1 (data not show) which leaded to a more specific pattern.
In previous studies, it has been observed that compounds of this class stained with a greater specificity the vacuolar membrane and/or on the perinuclear membrane of the endoplasmic reticulum [11]. As such, in order to identify if the fluorescence staining pattern of compound 2 exhibited the same phenotype, S. cerevisiae W303-1A1 pDF01-VBA1-YEGFP cells (expressing a vacuolar protein VBA1 fused with a GFP, which allow the identification of the vacuolar membrane) were incubated with 12.5 µM of 2, for two hours, and co-stained the cells with DAPI, to observe the nuclei, that are surrounded by the endoplasmic reticulum. Upon this incubation it was possible to identify by co-localization analysis, that the compound 2 accumulates at the vacuolar membrane (green arrows) and at the perinuclear membrane of the endoplasmic reticulum (yellow arrows) (Figure 4).
3. Experimental
3.1. Typical Procedure for the Preparation of benzo[a]phenoxazinium Chlorides (Illustrated for 2)
To a solution of 5-(ethylamino)-4-methyl-2-nitrosophenol hydrochloride (0.071 g, 3.80 × 10⁻⁴ mol, 1.5 eq.) in methanol, concentrated hydrochloric acid (0.118 mL) and N-(3-(naphthalen-1-ylamino)propyl)propane-1-sulfonamide (0.067 g, 2.19 × 10⁻⁴ mol, 1 eq.) were added and the resulting solution was refluxed for 20 h. The progress of the reaction was monitored by TLC (dichloromethane/methanol 9:1). After evaporation of the solvent and column chromatography purification on silica gel (mixtures of increasing polarity of dichloromethane/methanol as the eluent), compound 1 was obtained as a blue solid (0.044 g, 48%). mp = 141.2–143.5 °C. Rf = 0.57 (dichloromethane/methanol 9:1). FTIR (KBr 1%): υmax 3380, 3290, 2975, 2931, 2873, 1641, 1592, 1563, 1544, 1450, 1385, 1313, 1257, 1186, 1140, 1087, 1008, 965, 893, 822, 782 cm−1. 1H RMN δH (CD3OD, 400 MHz) 1.05 (t, J = 7.6 Hz, 3H, NHSO2CH2CH2CH3), 1.32–1.39 (m, 3H, NHCH2CH3), 1.81 (sext, J = 7.6 Hz, 2H, NHSO2CH2CH2CH3), 2.05–2.15 (m, 2H, NHCH2CH2CH2NHSO2), 2.35 (s, 1H, CH3) 3.02–3.08 (m, 2H, NHSO2CH2CH2CH3), 3.20–3.30 (m, 2H, NHCH2CH2CH2NHSO2), 3.50–3.60 (m, 2H, NHCH2CH3), 3.80–3.87 (m, 2H, NHCH2CH2CH2NHSO2), 6.90 (s, 1H, H-8), 7.03 (s, 1H, H-6), 7.75 (s, 1H, H-11), 7.82 (t, J = 7.6 Hz, 1H, H-3), 7.92 (t, J = 7.6 Hz, 1H, H-2), 8.34 (d, J = 8.0 Hz, 1H, H-4), 8.96 (d, J = 8.0 Hz, 1H, H-1) ppm. 13C RMN δC (CD3OD, 100.6 MHz) 13.21 (NHSO2CH2CH2CH3), 14.12 (NHCH2CH3), 17.61 (CH3), 18.39 (NHSO2CH2CH2CH3), 30.21 (NHCH2CH2CH2NHSO2), 39.71 (NHCH2CH3), 41.32 (NHCH2CH2CH2NHSO2), 42.78 (NHCH2CH2CH2NHSO2), 54.44 (NHSO2CH2CH2CH3), 94.03 (C-6), 94.52 (C-8), 123.68 (C-4), 124.82 (Ar-C), 125.59 (C-1), 128.97 (Ar-C), 130.80 (C-3), 132.44 (Ar-C), 132.69 (C-2), 132.73 (C-11), 132.93 (Ar-C), 134.53 (Ar-C), 149.64 (C-10), 153.15 (Ar-C), 156.92 (C-9), 158.71 (C-5) ppm.
3.2. Procedure for Fluorescence Staining
Saccharomyces cerevisiae W303-1A and W303-1 pDF01-VBA1-YEGFP were grown respectively on YEPD (1% yeast extract, 2% peptone, 2% glucose) and synthetic complete medium SC (2% glucose, 0.5% ammonium sulfate, 0.7% yeast nitrogen base w/o amino acids, 0.2% dropout mix, 0.01% histidine and tryptophan, 0.02% leucine) agar plates. A sample of the cultures was used to prepare cell suspensions that were incubated overnight at 30 °C and 120 rpm, in liquid YEPD and SC, until they reached an optical density of approximately 0.8 at 640 nm. An aliquot of W303-1A culture was collected and incubated with 12.5 µM of 1 and 2 in PBS at 30 °C for two hours. In the same way, the W303-1 pDF01-VBA1-YEGFP strain was incubated with 12.5 µM of 2.
Cells were centrifuged at 3000 rpm for 5 min, rinsed two times in PBS and resuspended in 30 μL of PBS. W303-1 pDF01-VBA1-YEGFP cells were also incubated with DAPI (final concentration 10 µg/mL), to allow the visualization of the nuclei. The samples were then analyzed on an Olympus BX6F2 fluorescence microscope, with appropriate filter cubes: U-FDICT (differential interference contrast), U-FYW (Far-Red), U-FUNA (blue), U-GFP (Green), with a 60× oil immersion objective. All treatment conditions were performed in three independent experiments and the images presented are representative of the results obtained.
4. Conclusions
Two new benzo[a]phenoxazinium chlorides were successfully synthetized. Photophysical studies in acidic ethanol and aqueous solution at physiological pH showed that compounds displayed fluorescence with λemi between 643 and 651 nm and fluorescent quantum yields up to 0.58 in acidified ethanol. The two compounds were able to stain the cells. The compound functionalized with the sulphonamide group 2 exhibited a better and more specific fluorescence staining pattern, with preferential accumulation on the vacuolar membrane and perinuclear membrane of the endoplasmic reticulum. The result seems to be associated with the polarity of the compounds, as compound 2 is considerably more nonpolar, higher Log P value (2.20), than 1, Log P (0.96).
Institutional Review Board Statement
Not applicable.
Informed Consent Statement
Not applicable.
Acknowledgments
Thanks are due to Fundação para a Ciência e Tecnologia (FCT) and FEDER (European Fund for Regional Development)-COMPETE-QRENEU for financial support through the research centres CQ/UM (UID/QUI/0686/2016 and UIDB/00686/2020) and CBMA (PEst-OE/BIA/UI4050/2014 and UID/BIA/04050/2020), as well as a PhD grant to J.C.F. (SFRH/BD/133207/2017). The NMR spectrometer Bruker Avance III 400 is part of the National NMR Network (PTNMR) and are partially supported by Infrastructure Project No 022161 (co-financed by FEDER through COMPETE 2020, POCI and PORL and FCT through PIDDAC).
Conflicts of Interest
The authors declare no conflict of interest.
References
- Gonçalves, M.S.T. Fluorescent labeling of biomolecules with organic probes. Chem. Rev. 2009, 109, 190–212. [Google Scholar] [CrossRef] [PubMed]
- Frade, V.H.J.; Gonçalves, M.S.T.; Coutinho, P.J.G.; Moura, J.C.V.P. Synthesis and spectral properties of long-wavelength fluorescent dyes. J. Photochem. Photobiol. A Chem. 2007, 185, 220–230. [Google Scholar] [CrossRef]
- Jose, J.; Burgess, K. Syntheses and properties of water-soluble Nile Red derivatives. J. Org. Chem. 2006, 71, 7835–7839. [Google Scholar] [CrossRef] [PubMed]
- Firmino, A.D.G.; Gonçalves, M.S.T. Bifunctionalised long-wavelength fluorescent probes for biological applications. Tetrahedron Lett. 2012, 53, 4946–4950. [Google Scholar] [CrossRef]
- Yuan, L.; Lin, W.; Zheng, K.; He, L.; Huang, W. Far-red to near infrared analyte-responsive fluorescent probes based on organic fluorophore platforms for fluorescence imaging. Chem. Soc. Rev. 2013, 42, 622–661. [Google Scholar] [CrossRef] [PubMed]
- Jose, J.; Ueno, Y.; Burgess, K. Water-soluble nile blue derivatives: Syntheses and photophysical properties. Chem. Eur. J. 2009, 15, 418–423. [Google Scholar] [CrossRef] [PubMed]
- Alves, C.M.A.; Naik, S.; Coutinho, P.J.G.; Gonçalves, M.S.T. Novel long alkyl side chain benzo[a]phenoxazinium chlorides: Synthesis, photophysical behaviour and DNA interaction. Tetrahedron 2009, 65, 10441–10452. [Google Scholar] [CrossRef]
- Salomi, B.S.B.; Mitra, C.K.; Gorton, L. Electrochemical and spectrophotometric studies on dyes and proteins labelled with dyes. Synth. Met. 2005, 155, 426–429. [Google Scholar] [CrossRef]
- Rama, R.B.; Naik, S.; Coutinho, P.J.G.; Gonçalves, M.S.T. Novel Nile Blue derivatives as fluorescent probes for DNA. Dyes Pigments 2013, 99, 220–227. [Google Scholar] [CrossRef]
- Frade, V.H.J.; Barros, S.A.; Moura, J.C.V.P.; Coutinho, P.J.G.; Gonçalves, M.S.T. Synthesis of short and long-wavelength functionalised probes: Amino acids’ labelling and photophysical studies. Tetrahedron 2007, 50, 12405–12418. [Google Scholar] [CrossRef]
- Leitão, M.I.P.S.; Rama Raju, B.; Cerqueira, N.M.F.S.A.; Sousa, M.J.; Gonçalves, M.S.T. Benzo[a]phenoxazinium chlorides: Synthesis, antifungal activity, in silico studies and evaluation as fluorescent probes. Bioorg. Chem. 2020, 98, 103730. [Google Scholar] [CrossRef] [PubMed]
Figure 1.
Structures of benzo[a]phenoxazinium chlorides 1 and 2.

Figure 2.
Normalized absorption and emission spectra of compounds 1 and 2 in acidified ethanol.

Figure 3.
Normalized absorption and emission spectra of compounds 1 and 2 in aqueous solution at physiological pH.
Figure 3.
Normalized absorption and emission spectra of compounds 1 and 2 in aqueous solution at physiological pH.

Figure 4.
Compounds 1 and 2 intracellular distribution. Differential interference contrast (DIC) and far red fluorescence microscopy images of W303-1A cells after incubation with 1 (12.5 µM). DIC, far red, green and blue fluorescence microscopy images of W303-1A pDF01-VBA1-YEGFP cells after incubation with 2 (12.5 µM) co-stained with DAPI. Samples were stained in PBS at 30 ° for two hours and visualized by epifluorescence microscopy with a 60× oil immersion objective. Green arrows indicate compound accumulation on vacuolar membrane and yellow arrows indicate compound accumulation on the perinuclear membrane of endoplasmic reticulum.


Table 1.
Photophysical data of compounds 1 and 2 in acidified ethanol and aqueous solutions at pH 7.4 (λexc 590 nm).
Table 1.
Photophysical data of compounds 1 and 2 in acidified ethanol and aqueous solutions at pH 7.4 (λexc 590 nm).
| Compound | 1 | 2 |
|---|---|---|
| Log P | 0.96 | 2.20 |
| Acidified ethanol | ||
| λabs (nm) | 627 | 627 |
| Log ε (M−1 cm−1) | 5.17 | 4.60 |
| λemi (nm) | 644 | 643 |
| ΦF | 0.58 | 0.58 |
| ∆λ (nm) | 17 | 16 |
| pH 7.4 | ||
| λabs (nm) | 627 | 621 |
| Log ε (M−1 cm−1) | 3.90 | 4.40 |
| λemi (nm) | 651 | 649 |
| ΦF | 0.24 | 0.20 |
| ∆λ (nm) | 24 | 28 |
Publisher’s Note: MDPI stays neutral with regard to jurisdictional claims in published maps and institutional affiliations. |
© 2020 by the authors. Licensee MDPI, Basel, Switzerland. This article is an open access article distributed under the terms and conditions of the Creative Commons Attribution (CC BY) license (https://creativecommons.org/licenses/by/4.0/).
Share and Cite
MDPI and ACS Style
Ferreira, J.C.C.; Sousa, R.P.C.L.; Sousa, M.J.M.F.; Gonçalves, M.S.T. Evaluation of Fluorescent Staining Capacity of Two New Nile Blue Analogues. Chem. Proc. 2021, 3, 63. https://doi.org/10.3390/ecsoc-24-08383
AMA Style
Ferreira JCC, Sousa RPCL, Sousa MJMF, Gonçalves MST. Evaluation of Fluorescent Staining Capacity of Two New Nile Blue Analogues. Chemistry Proceedings. 2021; 3(1):63. https://doi.org/10.3390/ecsoc-24-08383
Chicago/Turabian StyleFerreira, João C. C., Rui P. C. L. Sousa, Maria João M. F. Sousa, and M. Sameiro T. Gonçalves. 2021. "Evaluation of Fluorescent Staining Capacity of Two New Nile Blue Analogues" Chemistry Proceedings 3, no. 1: 63. https://doi.org/10.3390/ecsoc-24-08383