
Evaluation of Organophosphate Pesticide Residues in Food Using the Partial Least Squares Method †


Coriolan Dragulescu Institute of Chemistry, Romanian Academy, Bul. Mihai Viteazu 24, 300223 Timisoara, Romania
*
Author to whom correspondence should be addressed.
†
Presented at the 24th International Electronic Conference on Synthetic Organic Chemistry, 15 November–15 December 2020; Available online: https://ecsoc-24.sciforum.net/.
Chem. Proc. 2021, 3(1), 19; https://doi.org/10.3390/ecsoc-24-08307
Published: 14 November 2020
(This article belongs to the Proceedings of The 24th International Electronic Conference on Synthetic Organic Chemistry)
Abstract
:Organophosphorus (OP) chemicals were broadly used as insecticides and in the treatment of human diseases such as malaria mosquitoes, parasitosis, myasthenia, and glaucoma. The OP toxicity is well known. They can cause environmental and health problems and have the possibility to accumulate in the food chain. The acceptable daily intake (ADI) can be considered as a measure of the effect of pesticide residues in food on human health. In this paper, the partial least squares (PLS) approach is used to evaluate the ADIs (expressed as pADIs) of a series of 46 structurally diverse OPs. OP structures were pre-optimized using the MMFF94s force field, and structural descriptors were calculated for the minimum energy conformers. This dataset was divided into 26 training compounds, and 20 pesticides were included in the prediction set. Several criteria to check the model robustness, overfitting, and the potential outliers in the X and Y space were employed. The PLS results indicated that new experimental toxicological data would be needed for five out of the 46 OPs, to improve their known ADI values, for qualitative and quantitative dietary long-term risk assessments.
1. Introduction
Pesticides are generally used to prevent and control insects, pests, and diseases in the field crops, such as animal and bird repellents, food storage protectants, mold-killing substances, antifouling products, soil sterilants, and wood preservatives [1,2]. Initially, the main use of pesticides was to diminish pest attack. Simultaneously, increased use of chemical pesticides has resulted in pollution of the environment and also caused many long-term changes in society. Pesticides are necessary to the farmer in his fight against plant pests and diseases. Today, it is anticipated that as much as 45% of the world’s crops are damaged by plant pests and diseases. Thus, it is important to employ pesticides to protect the crops, both during their growth and their later storage and transport. However, the arbitrary and incautious use of pesticides generated extensive contamination in the food chain.
The organophosphorus pesticides (OPs) were introduced as replacements for the organochlorine pesticides, after the tendency of DDT and its metabolites to bioaccumulate in ecosystems and cause adverse health effects, particularly in top predators, led to the legal prohibition or restraint of their use in the 1970s [3]. As a result of the increased use of OPs, even though they originally were considered to be less dangerous to the environment due to their low persistence, different ecotoxicological problems appeared related to their high acute toxicity. The unreasonable use of organophosphate pesticides can generate environmental pollution problems due to their stability, high toxicity, and capacity to accumulate in the food chain [4].
The organophosphorus insecticides have a common mechanism in the inhibition of acetylcholinesterase enzyme. Their relative potential toxicity in humans, rodents, and insects differ in their biotransformation and accumulation among these species [5]. The binding of OPs to carboxylesterases, cholinesterases, and other targets, which have been identified as receptors and enzymes involved in the hydrolysis of endobiotics, plays a key role in limiting the binding of OP compounds to acetylcholinesterase (AChE) [6]. Phosphorylation of AChE, which hydrolyzes acetylcholine and thus finishes its neurotransmitter activity, is the principal mechanism of OP toxicity in mammals, insects, and nematodes, with 70% to 90% inhibition usually proving lethal.
The risk assessment of chemicals is usually divided into similar but separate practices, depending on whether the evaluated chemical causes cancer (is a carcinogen) or not (is non-carcinogen) [7]. The major difference in the calculations of carcinogenic and non-carcinogenic risks involves the method by which risks from low level exposures are determined (Winter, 1992). For non-carcinogenic effects, it is assumed that a toxicity threshold exists, and exposures at levels below this threshold should not cause any effects. This measured quantity is identified as the no-observed-adverse-effect level (NOAEL). The existence of a NOAEL suggests that a toxicity threshold exists, and this concept of a threshold provides the basis for non-carcinogenic risk assessment [8].
The Joint FAO/WHO Expert Committee on Food Additives (JECFA) proposed, for the first time in 1958, the ‘acceptable daily intake’ (ADI) concept to assess the pesticide residue in food [9] with irrelevant modifications in 1962 [10,11], 1974, and 1987 [12]. Later, hundreds of food additives and pesticide residues were evaluated and reevaluated by these two international expert groups [13]. The ADIs, used nationally and internationally in the development of food standards, have proved adequate in allowing the careful use of agrochemicals and in protecting the health of the consumer [14].
ADI represents an estimate of the amount of a food additive, expressed on a bodyweight basis that can be ingested daily over a lifetime without significant risk to health [11]. The World Health Organization (WHO) and the United States Environmental Protection Agency (U.S. EPA) have determined an ADI for an actual risk management decision in the regulatory process of pesticide safety standards.
The determination of acceptable daily intake (ADI) for the toxicological assessment implies collection of all significant data, establishing the no-effect level using the most sensitive indicator of the toxicity, and applying an appropriate safety factor for humans [13]. The ADI is determined based on known data at one time. Therefore, it is impossible to be certain about the safety of a chemical, and the ADI may be revised for the new toxicological data.
ADI (considered as health-based control) values of some pesticides were modeled previously by Kim [14] using the multiple linear regression (MLR) approach. He concluded that a robust QSAR approach would be helpful for identifying significant information about the uncertainty of ADI values, as preliminary human health risk assessment for certain pesticides.
This paper presents the application of the partial least squares (PLS) method to evaluate the accessible daily intake (pADIs) values of a series of 46 diverse organophosphorus pesticides (http://www.inchem.org/pages/pims.html (accessed on 6 April 2020)) based on their molecular structure. Molecular mechanics calculations based on the MMFF94s force field were employed to model the pesticide structures. Structural features were computed from the minimum energy structures and were related to the pADI values. Several criteria were checked to establish the model robustness and outliers in the X and Y space.
2. Methods
2.1. Definition of Target Property and Structural Descriptors
The pesticide residues in food expressed as the acceptable daily intake (ADI) (mg/kg bodyweight), molar converted to pADI (http://www.inchem.org/pages/pims.html (accessed on 6 April 2020)), was considered as the dependent variable for 46 organophosphorus pesticides (Table 1).
The OP structures were pre-optimized using the MMFF94 molecular mechanics force field included in the Omega (Omega v.2.5.1.4, OpenEye Scientific Software, Santa Fe, NM, USA. http://www.eyesopen.com (accessed on 20 April 2020)) software [15,16]. For conformer generation, the maximum number of conformers per compound set of 400 and an RMSD value of 0.5 Å were used during the conformer ensemble generation.
The conformers of minimum energy were further employed to derive the structural parameters, using the DRAGON (Dragon Professional 5.5, 2007, Talete S.R.L., Milano, Italy) and InstantJChem (Instant JChem (2020) version 20.15.0, Chemaxon, Budapest, Hungary, http://www.chemaxon.com (accessed on 27 April 2020)) softwares.
2.2. Partial Least Squares (PLS) Method
The partial least squares (PLS) approach [17] was employed to relate the pADI values to the calculated OP structural descriptors, using the SIMCA (SIMCA P+12 12.0.0.0 2008, Umetrics, Sweden, www.umetrics.com (accessed on 27 April 2020)) program. Stable, correct, and highly predictive models can be obtained by the PLS approach. The model quality was verified using the squared correlation regression coefficient R2(CUM) and the squared cross-validated correlation coefficient, Q2(CUM). The variables importance in the projection (VIP) values and the sign of the variables’ coefficients were used to explain the descriptor influence on the pADIs. The leave-7-out cross-validation procedure was employed to select the most significant principal components and to check the internal model validation.
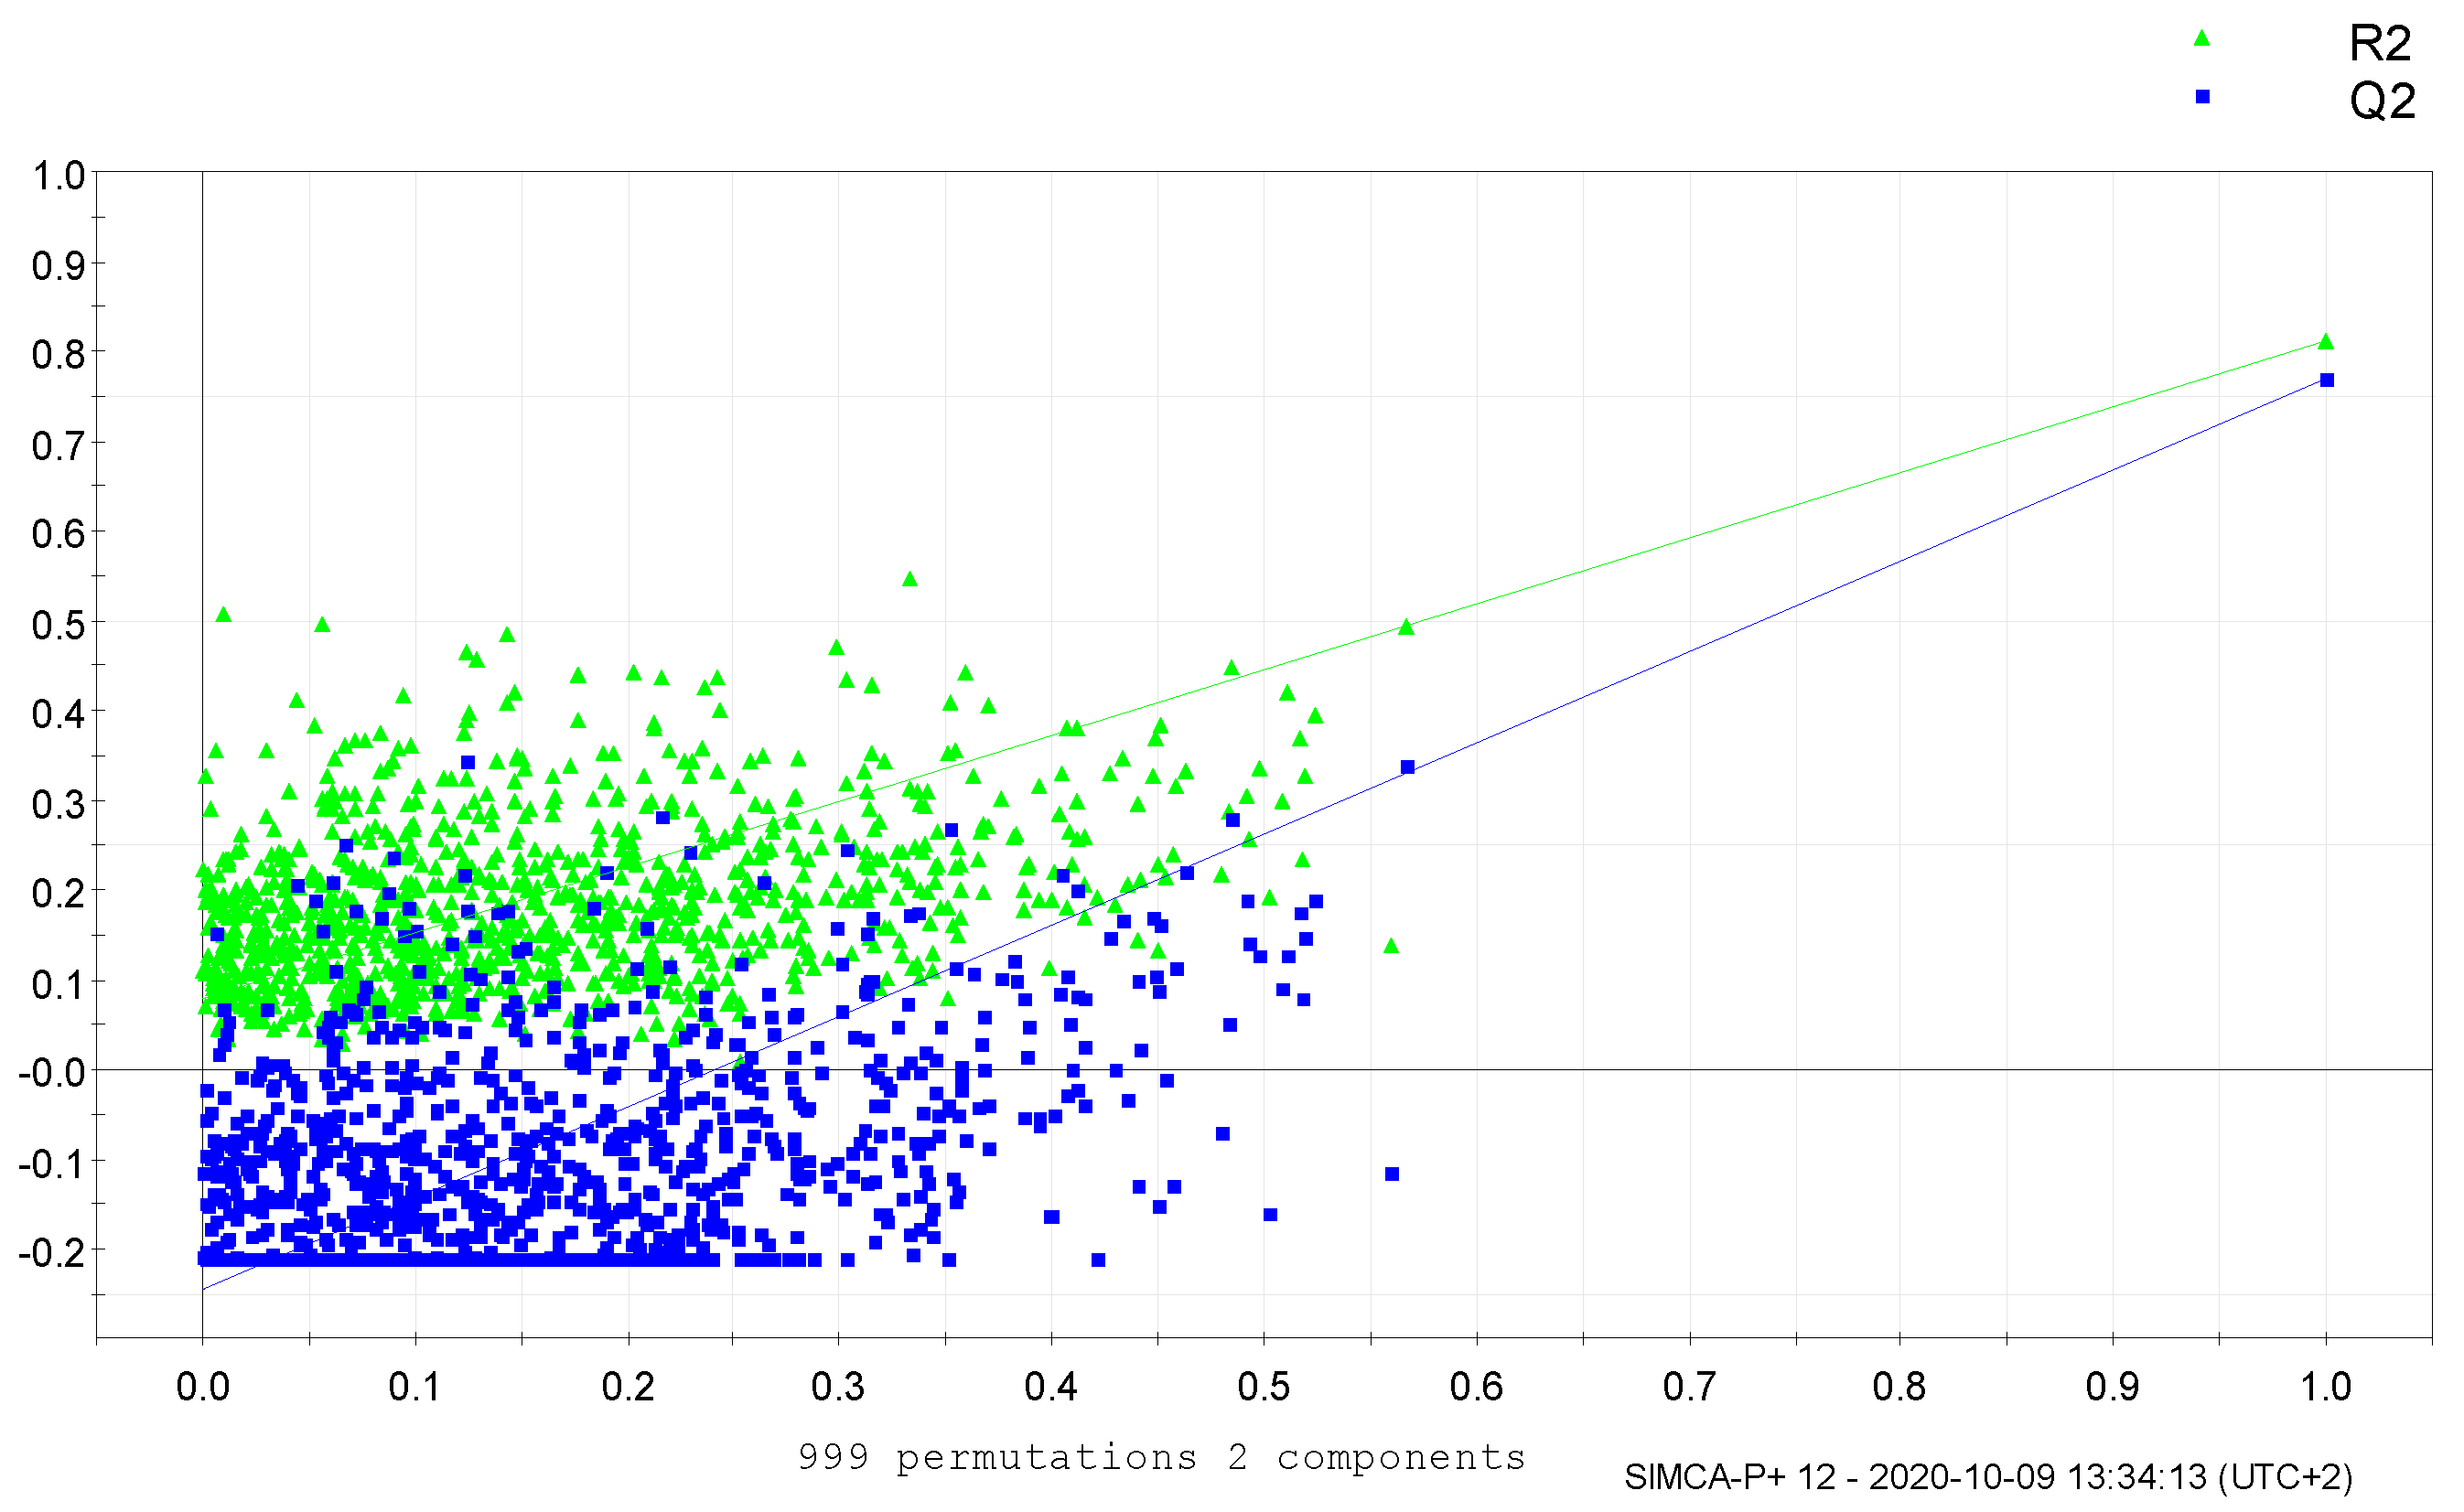
The Y-randomization test was employed to test the model robustness and overfitting. In this procedure, the Y-variable is randomly shuffled using the same structural descriptors. The obtained PLS models (after 999 randomizations) must have minimal r2 and q2 values [18].
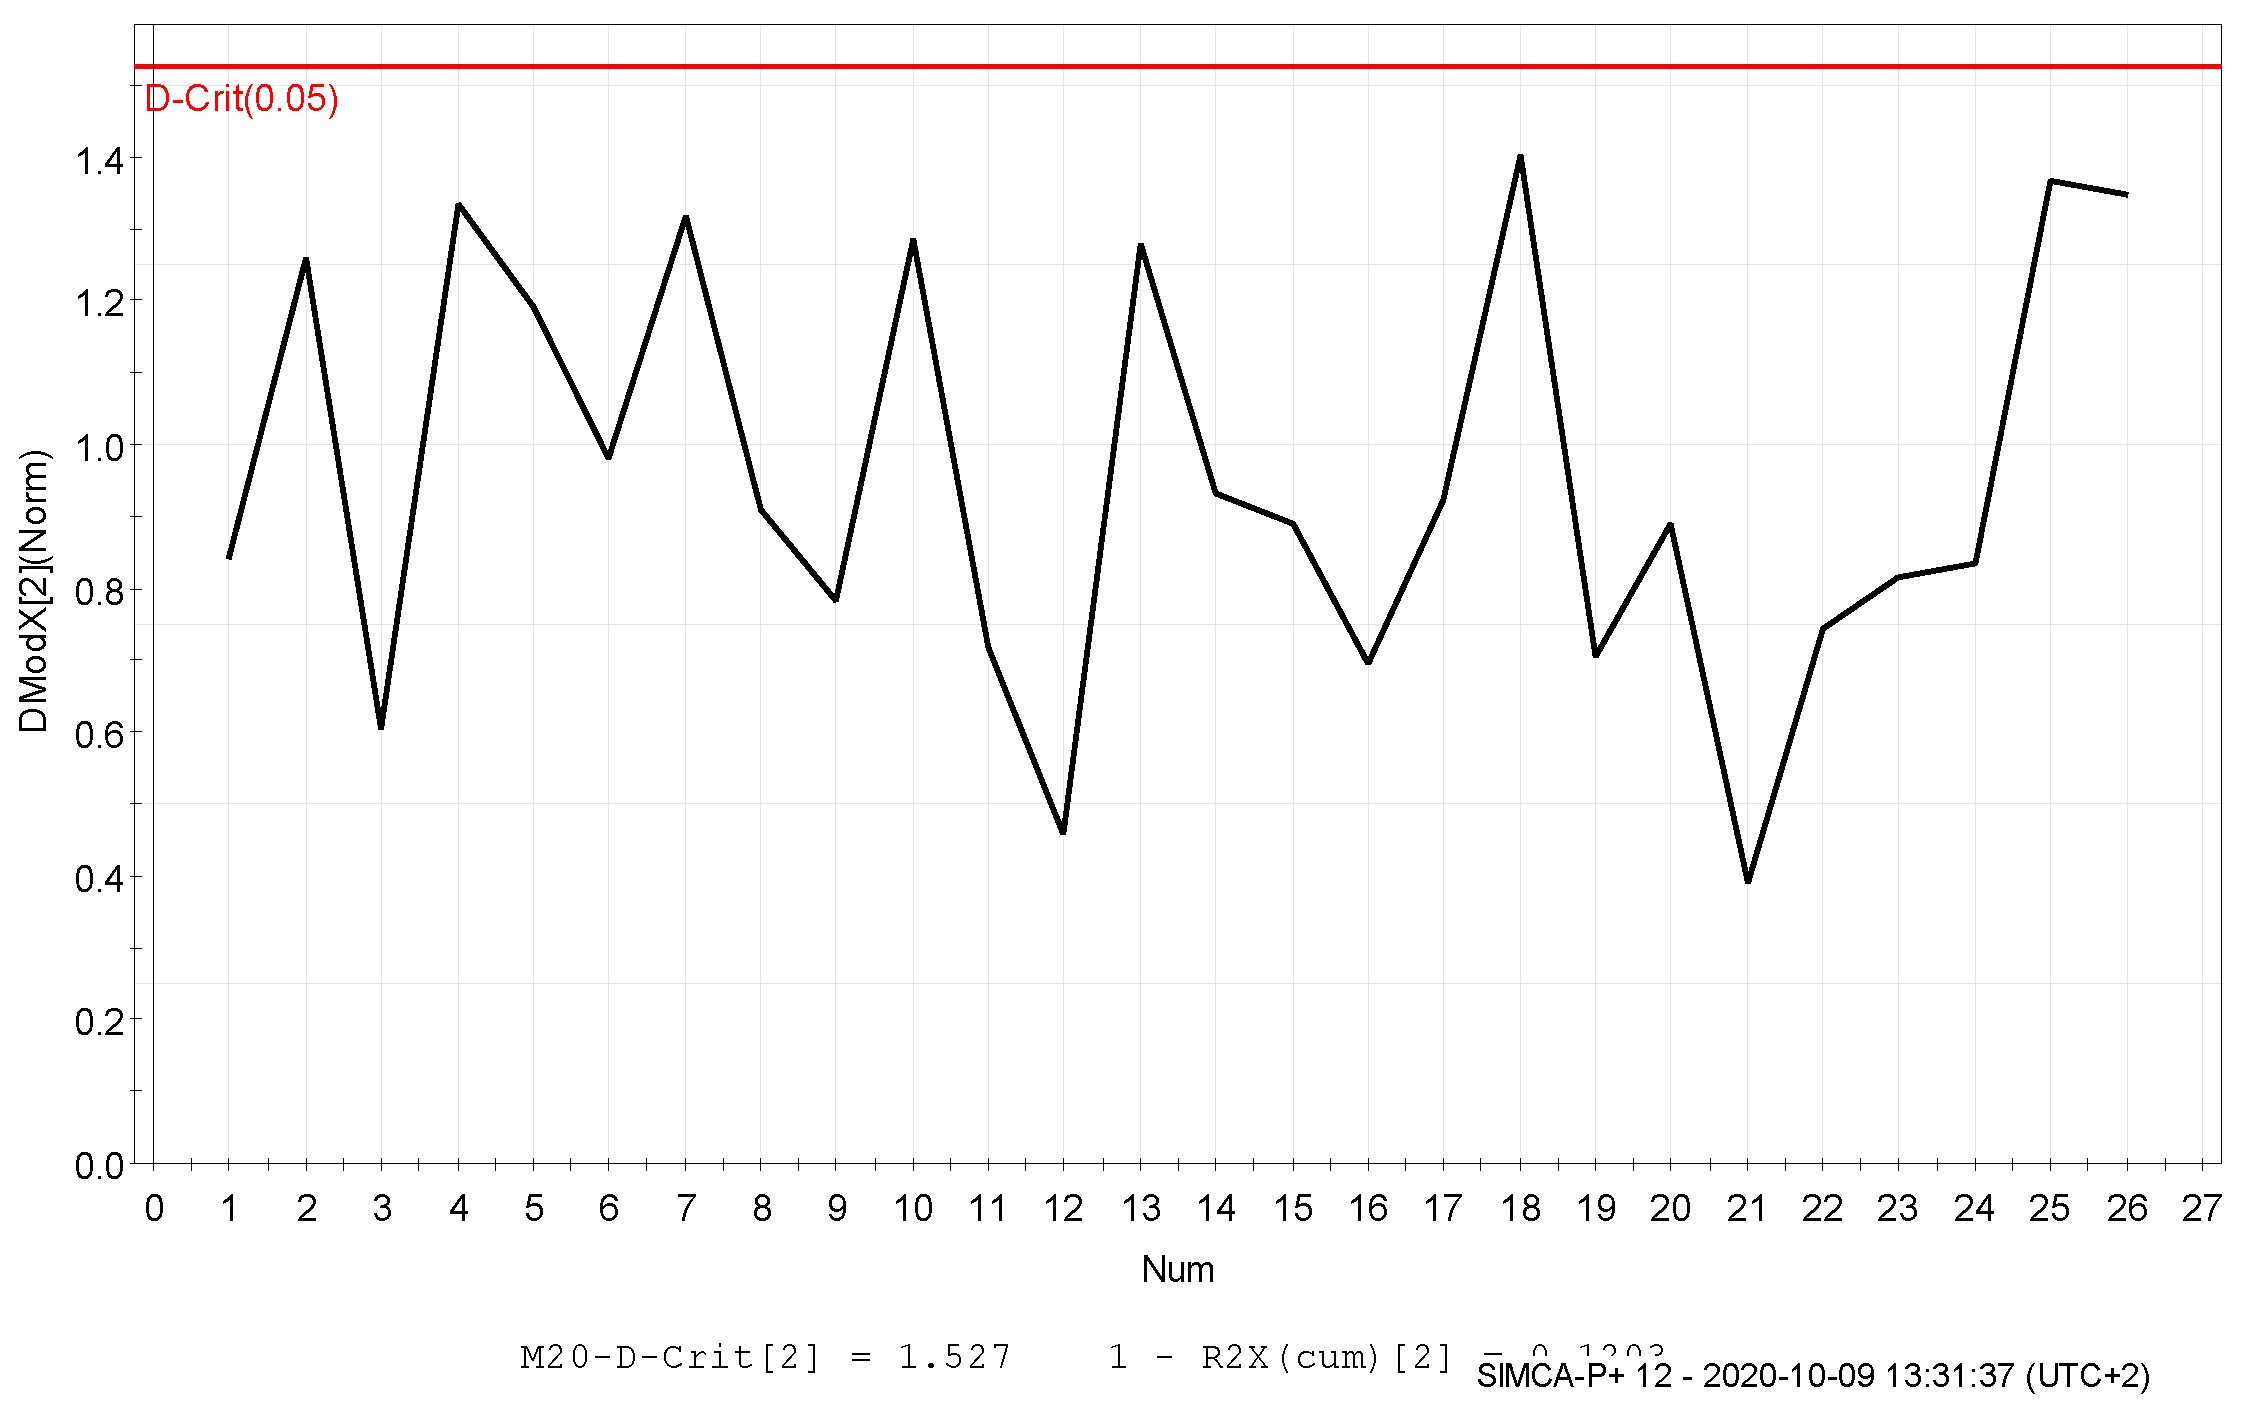
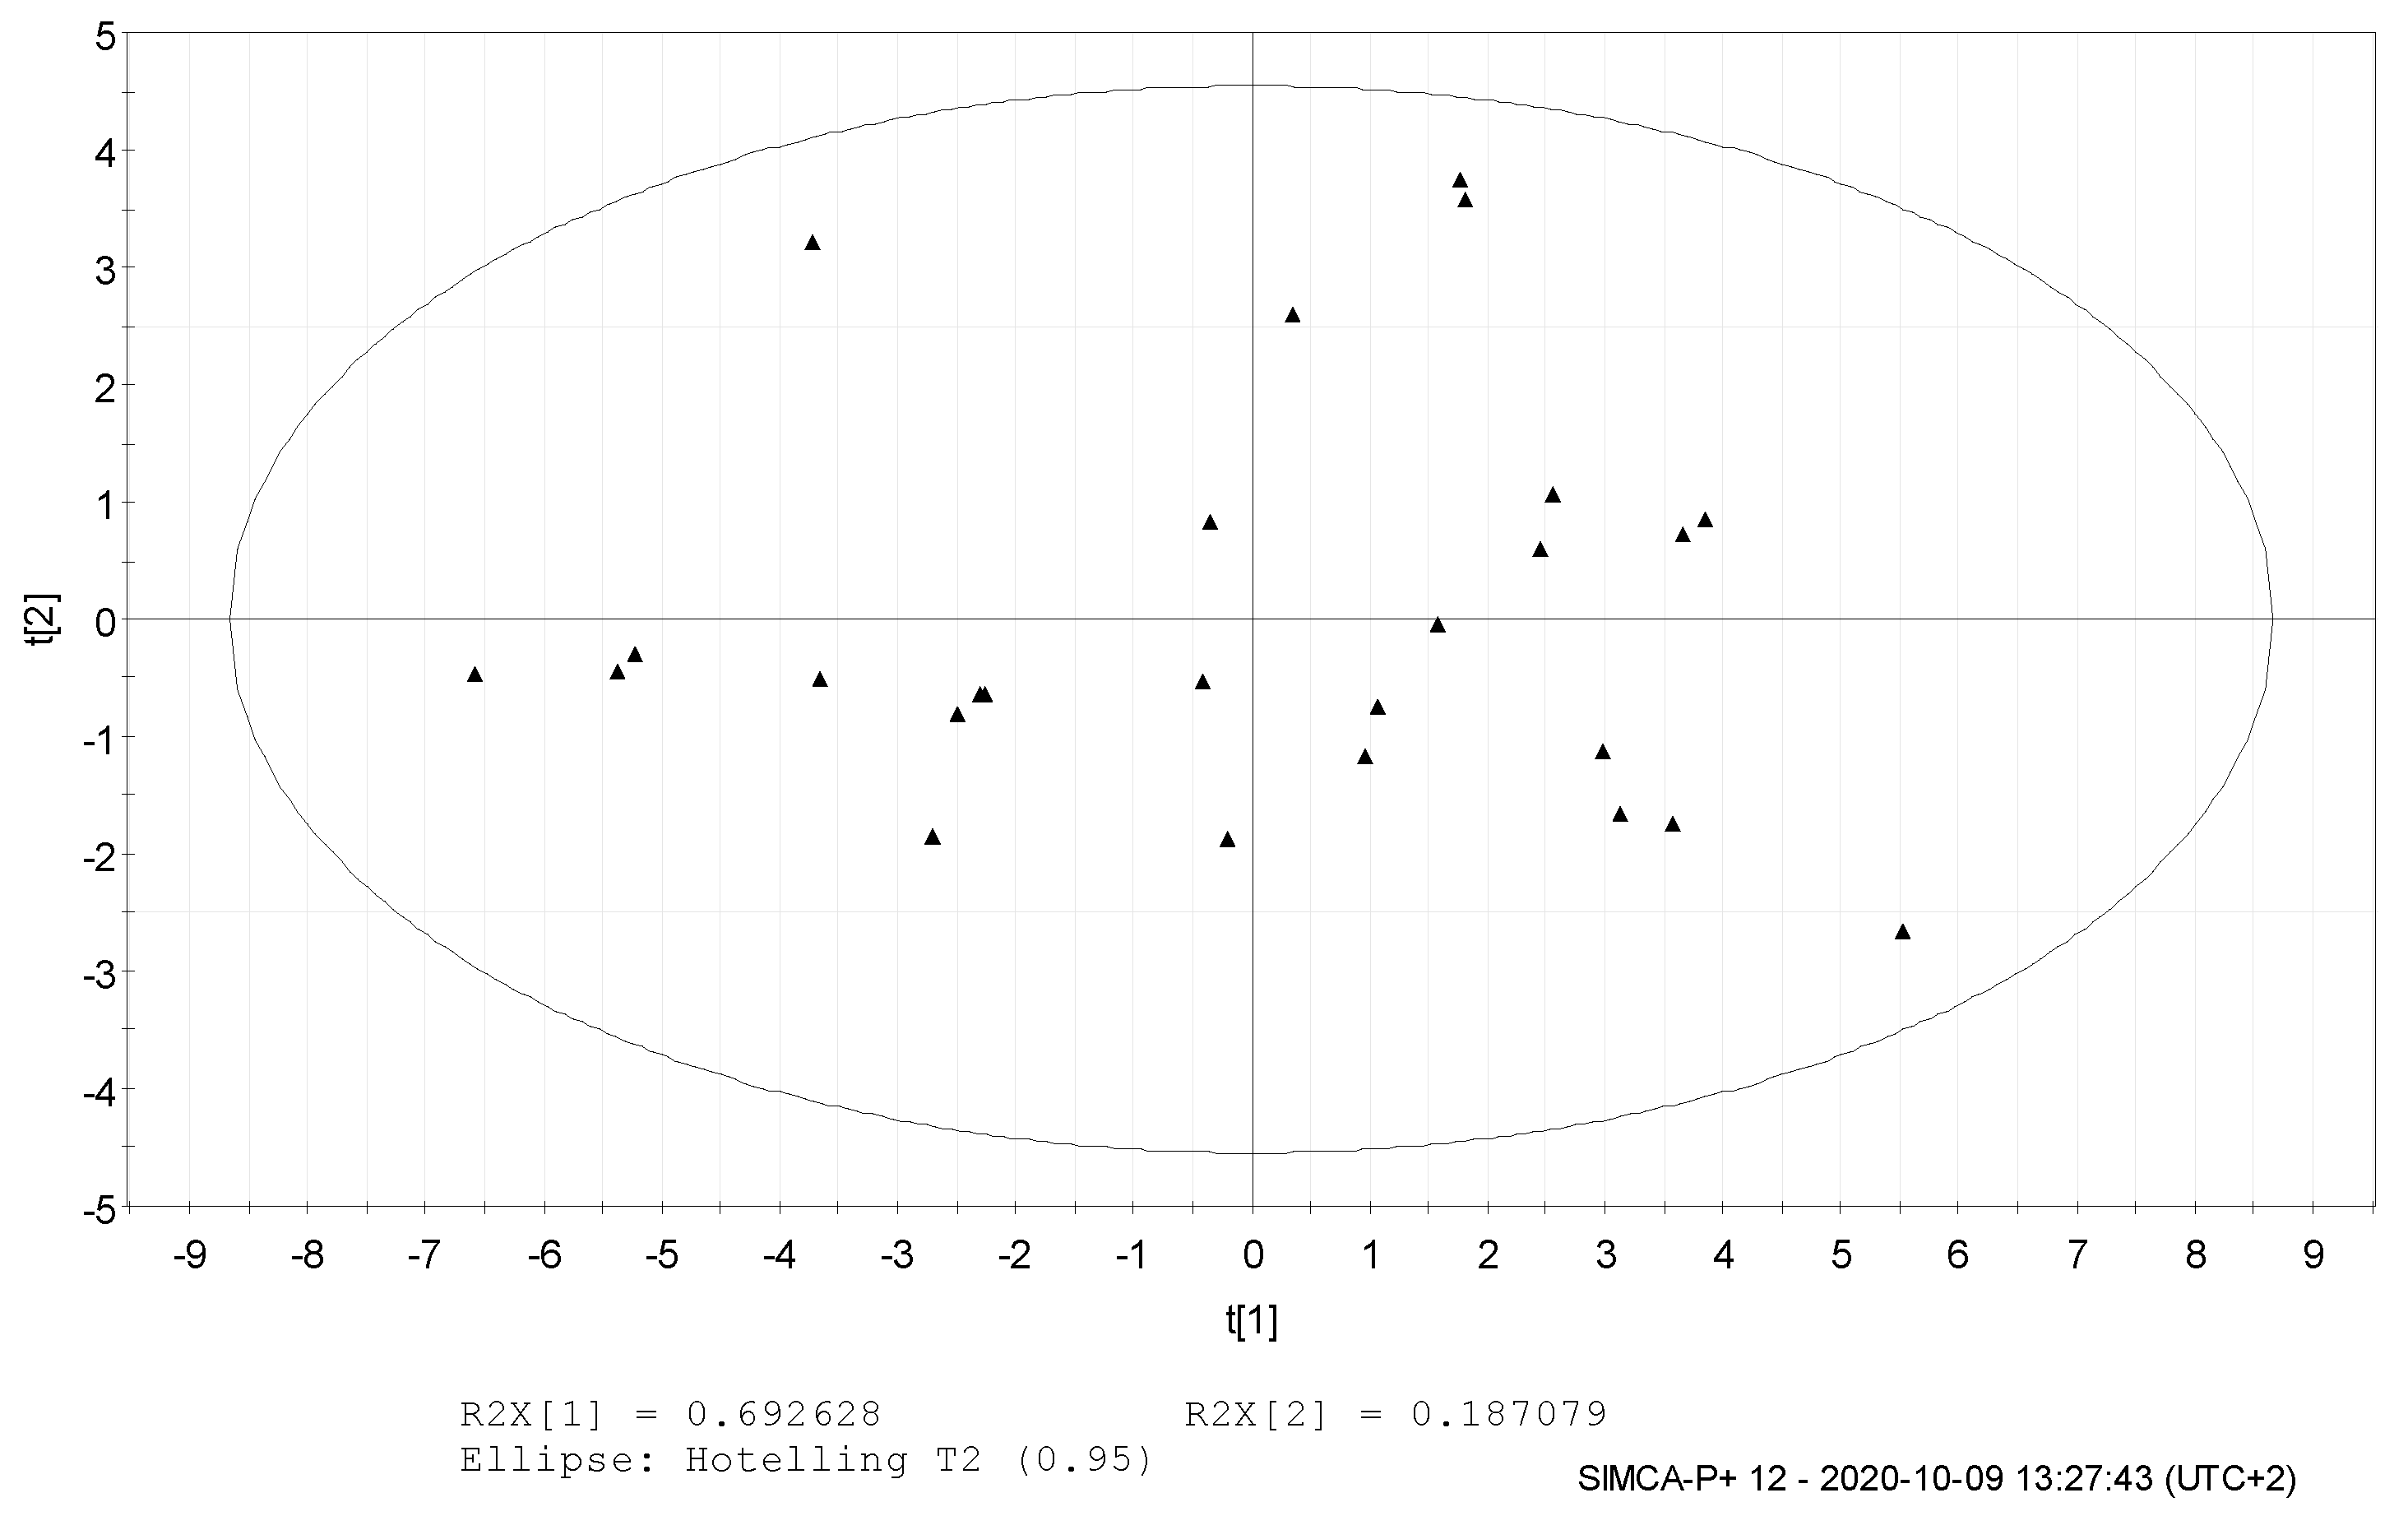
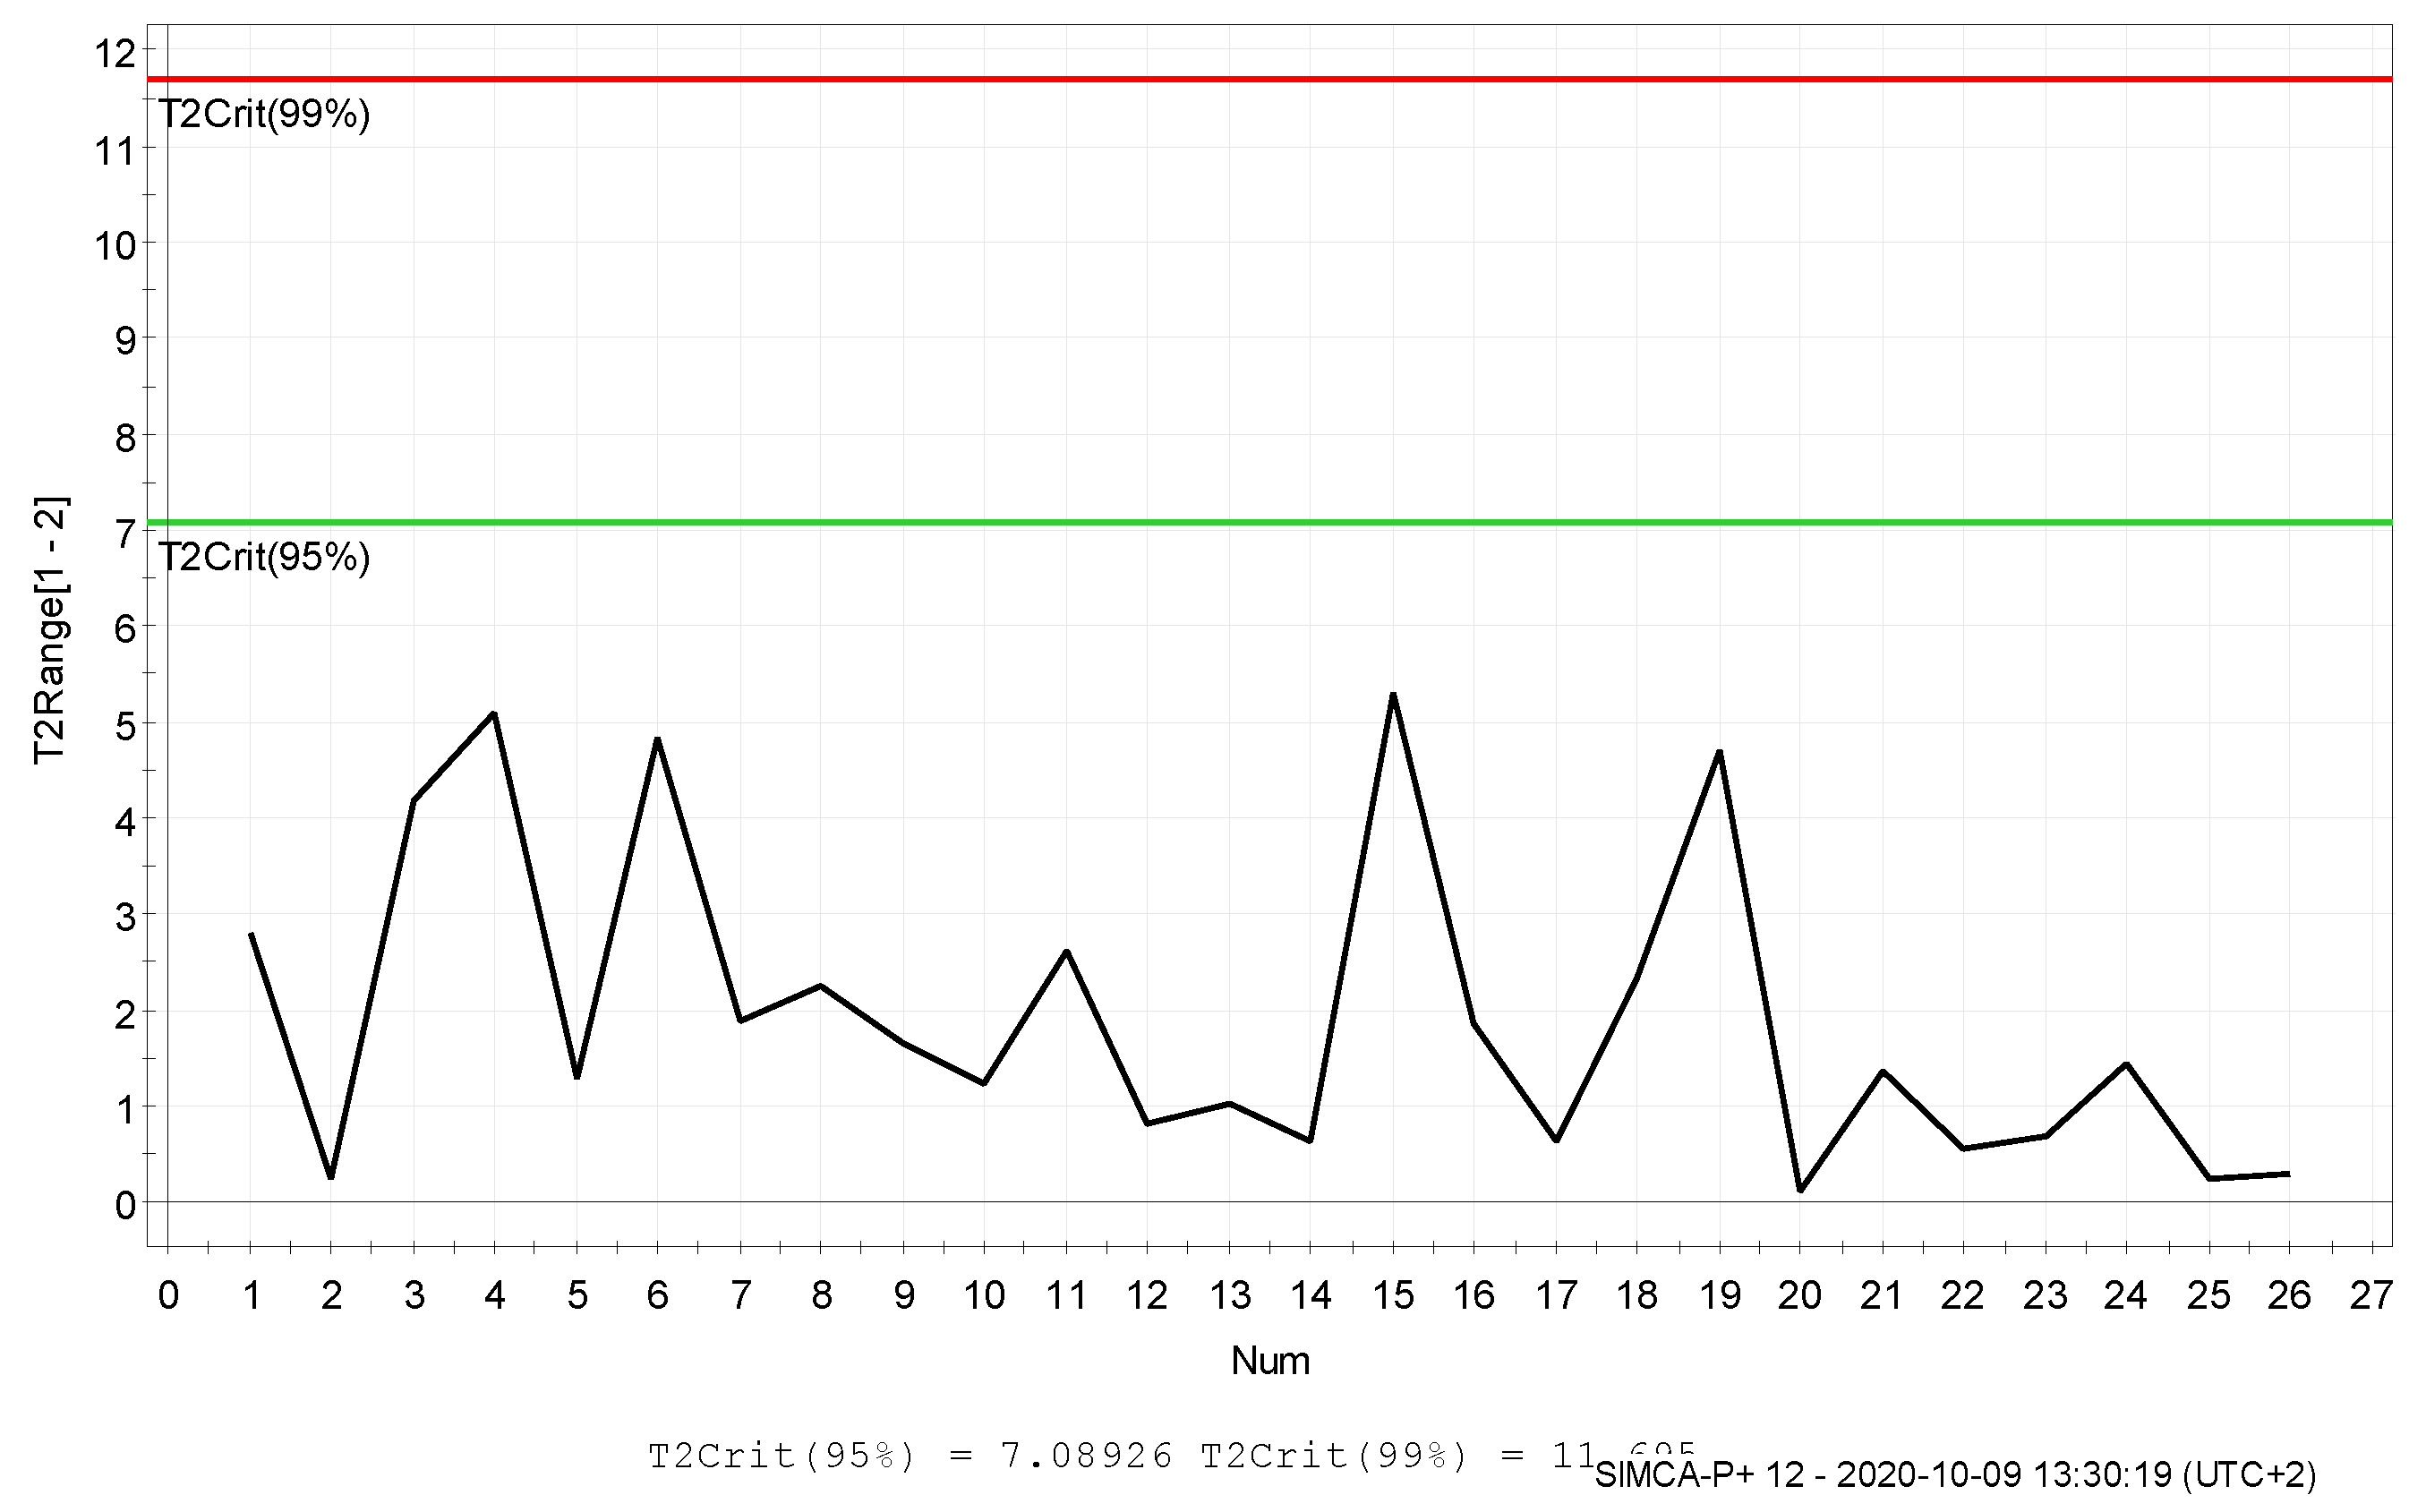
Several criteria to check the potential outliers in the X and Y space were employed in the training and prediction sets: the score scatter plot, at the significance level of 0.05; the distance to the model in X space (for the selected dimension), for the observations used to fit the model (DmodX, with a significance level of 0.05); and the probability of belonging to the model in the X space, for new observations in the prediction set combined with Hotelling’s T2 when the latter is outside the critical limit (PmodXPS+), The Hotelling’s T2 Range plot (which displays the distance from the origin in the score space for each selected observation, with a significance limit of 0.01).
3. Results and Discussion
The X matrix of OP descriptors were analyzed using the PCA approach. A model with six significant components (N = 46 and X = 1733) was obtained; the first three components explain 51.5% of the information content.
The following PLS statistical results: R2X(CUM) = 0.21, R2Y(CUM) = 0.365, and Q2(CUM) = 0.141 were obtained for one principal component for the entire set of compounds. They demonstrated the model’s low fitting results ( and are the cumulative sum of squares of all the X and Y values). Therefore, the noise variables (e.g., coefficient values insignificantly different from 0) were excluded from this model.
The dataset was divided randomly into training and validation (43% of the total number of compounds) sets. The compounds 1, 2, 4, 5, 7, 9, 14, 15, 19, 23, 26, 29, 30, 33, 38, 39, 43, 46, 42, and 45 were included in the prediction set (Table 1).
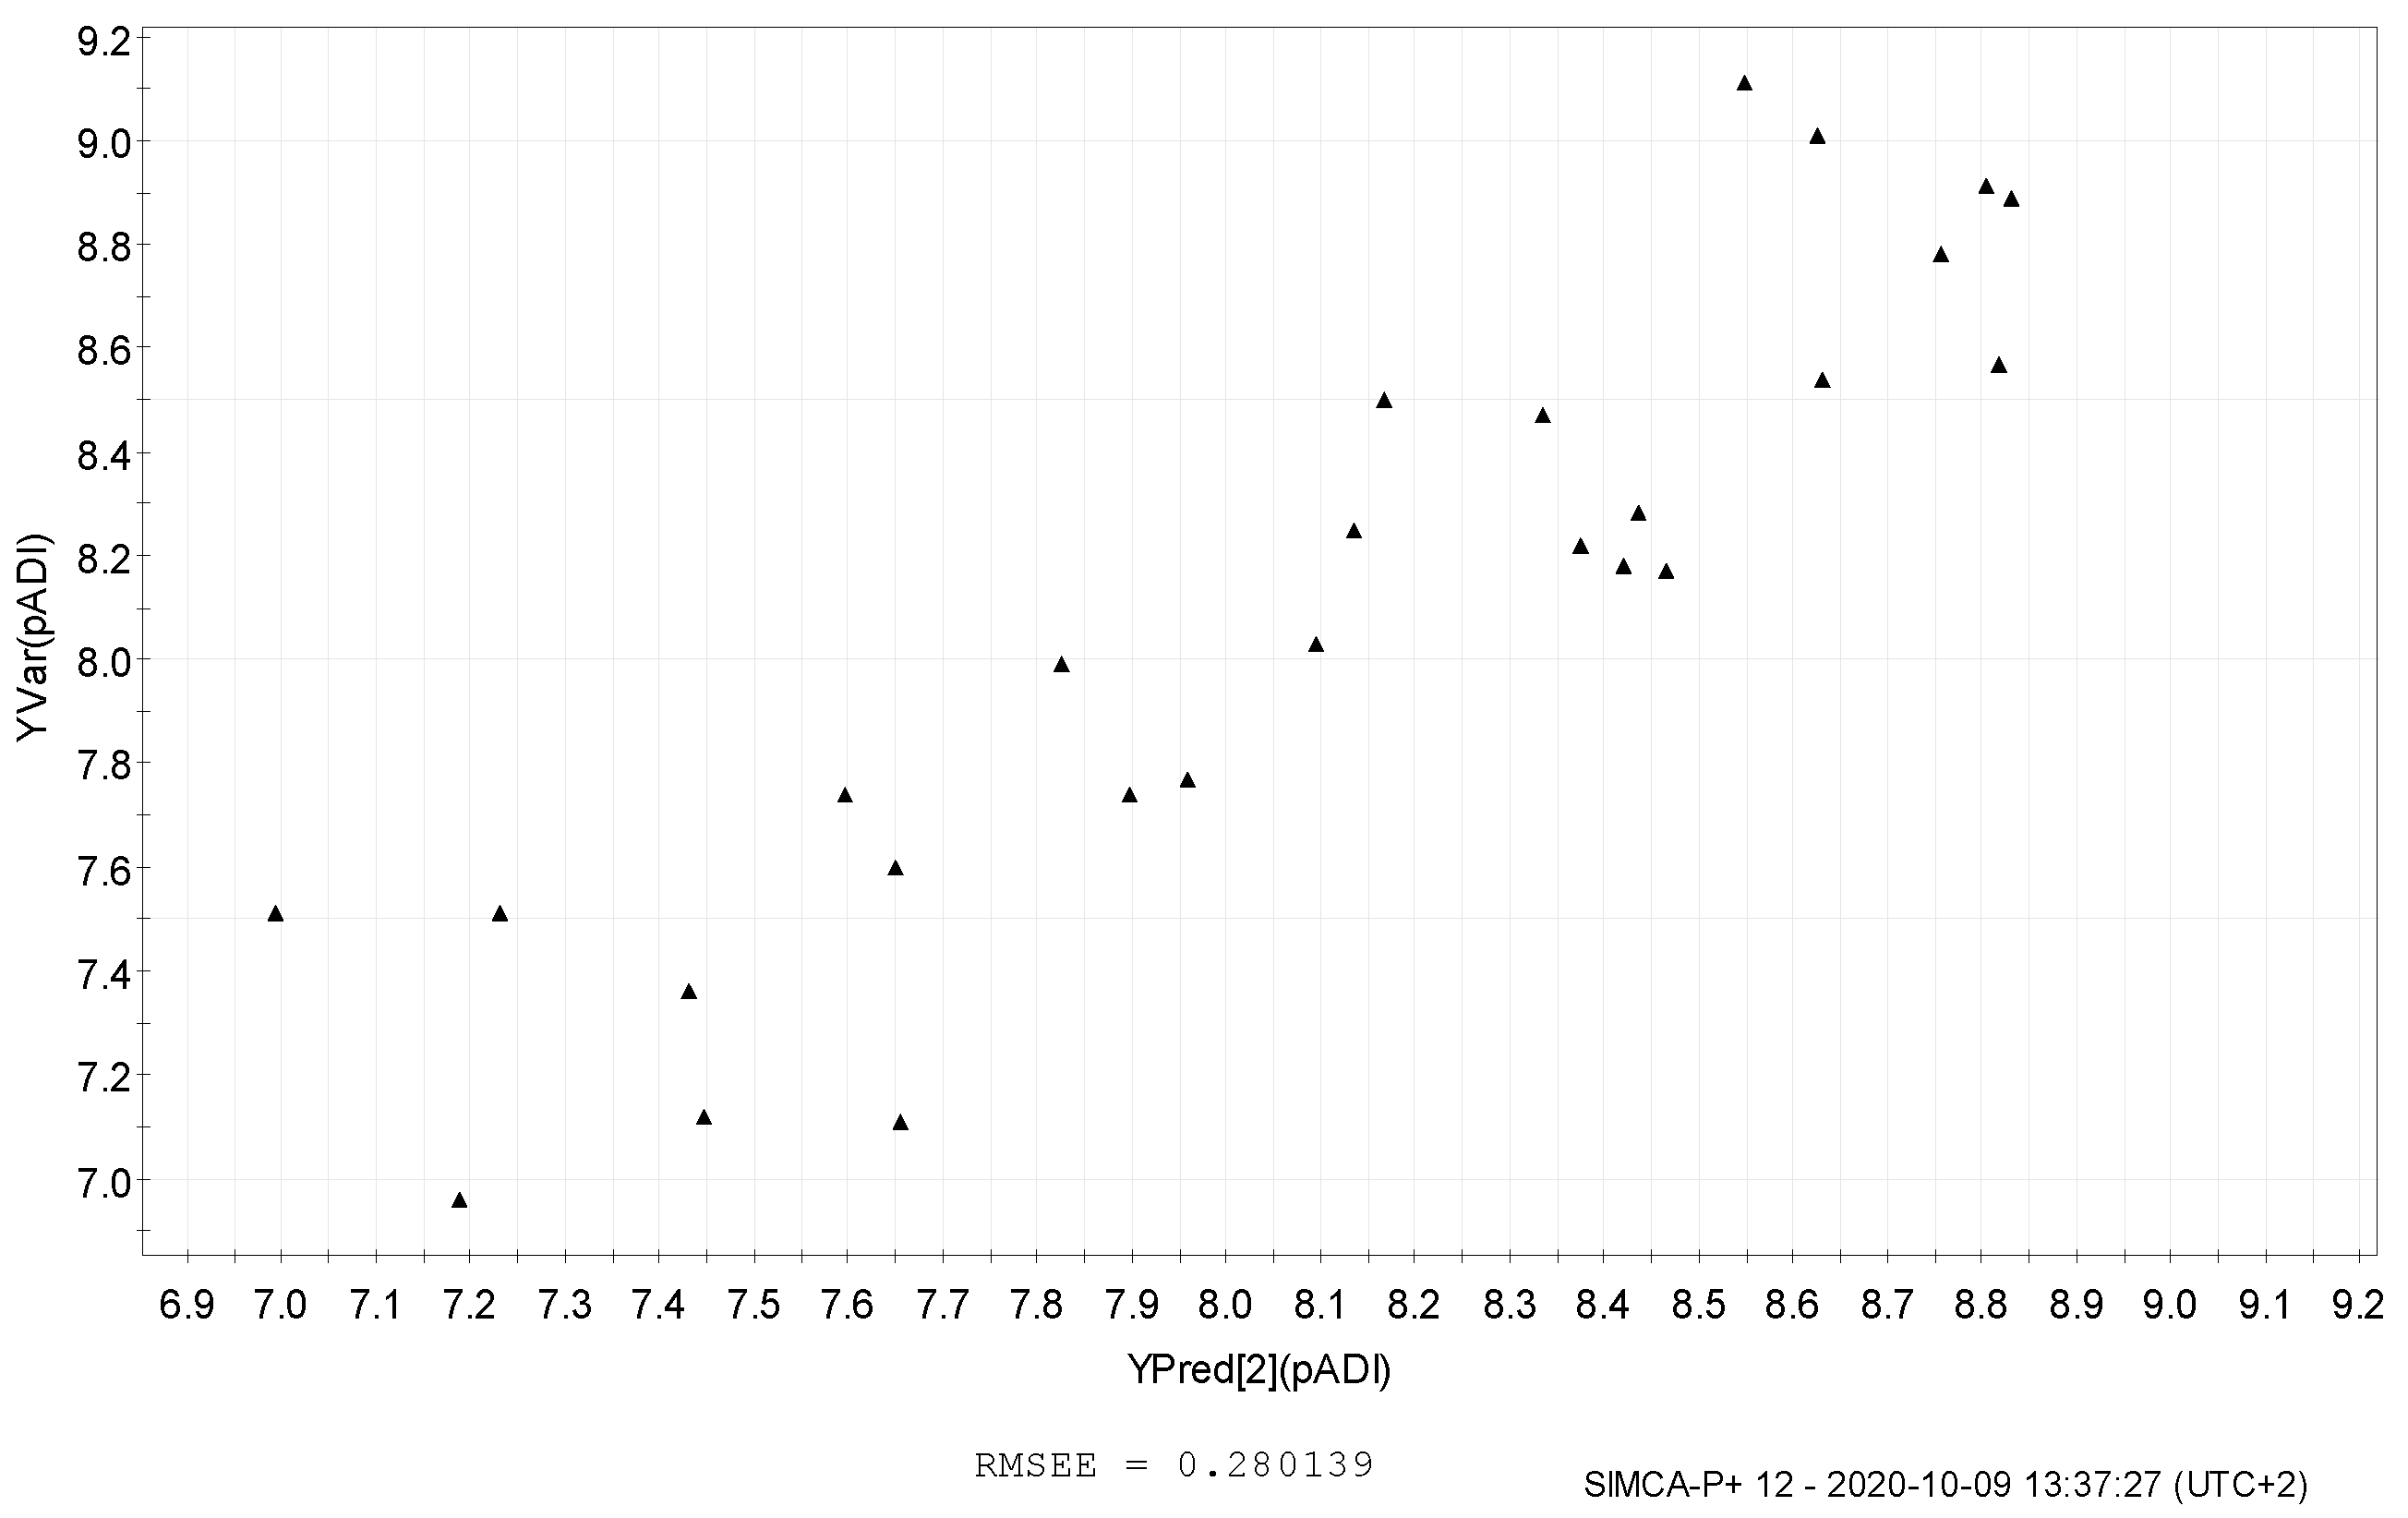
A robust and stable model with two significant principal components, which explains 88% of the information content of the descriptor matrix (for 16 structural descriptors), with R2Y(CUM) = 0.81 and Q2(CUM) = 0.77, was obtained. The descriptor coefficients and the VIP values included in the final PLS model are presented in Table 2.
The normal distribution pattern of descriptors [19] of the training and prediction sets were checked with a probability of 90% to find the X-outliers (for the training set) and the prediction compounds residing outside the AD, using the descriptor pool of the training and prediction set (included in the best PLS model). According to this criterion, compound 25 was found as a potential outlier for the training set. This assumption was not confirmed by the PModXPS+ criterion (Table 3), according to which compounds 9, 14, 19, 42, and 45 do not belong to the prediction X space.
The distance to the X model plot is presented in Figure 1, the score scatter plot for the best PLS model in Figure 2, and The Hotelling’s T2 range plot of the best PLS model is presented in Figure 3.
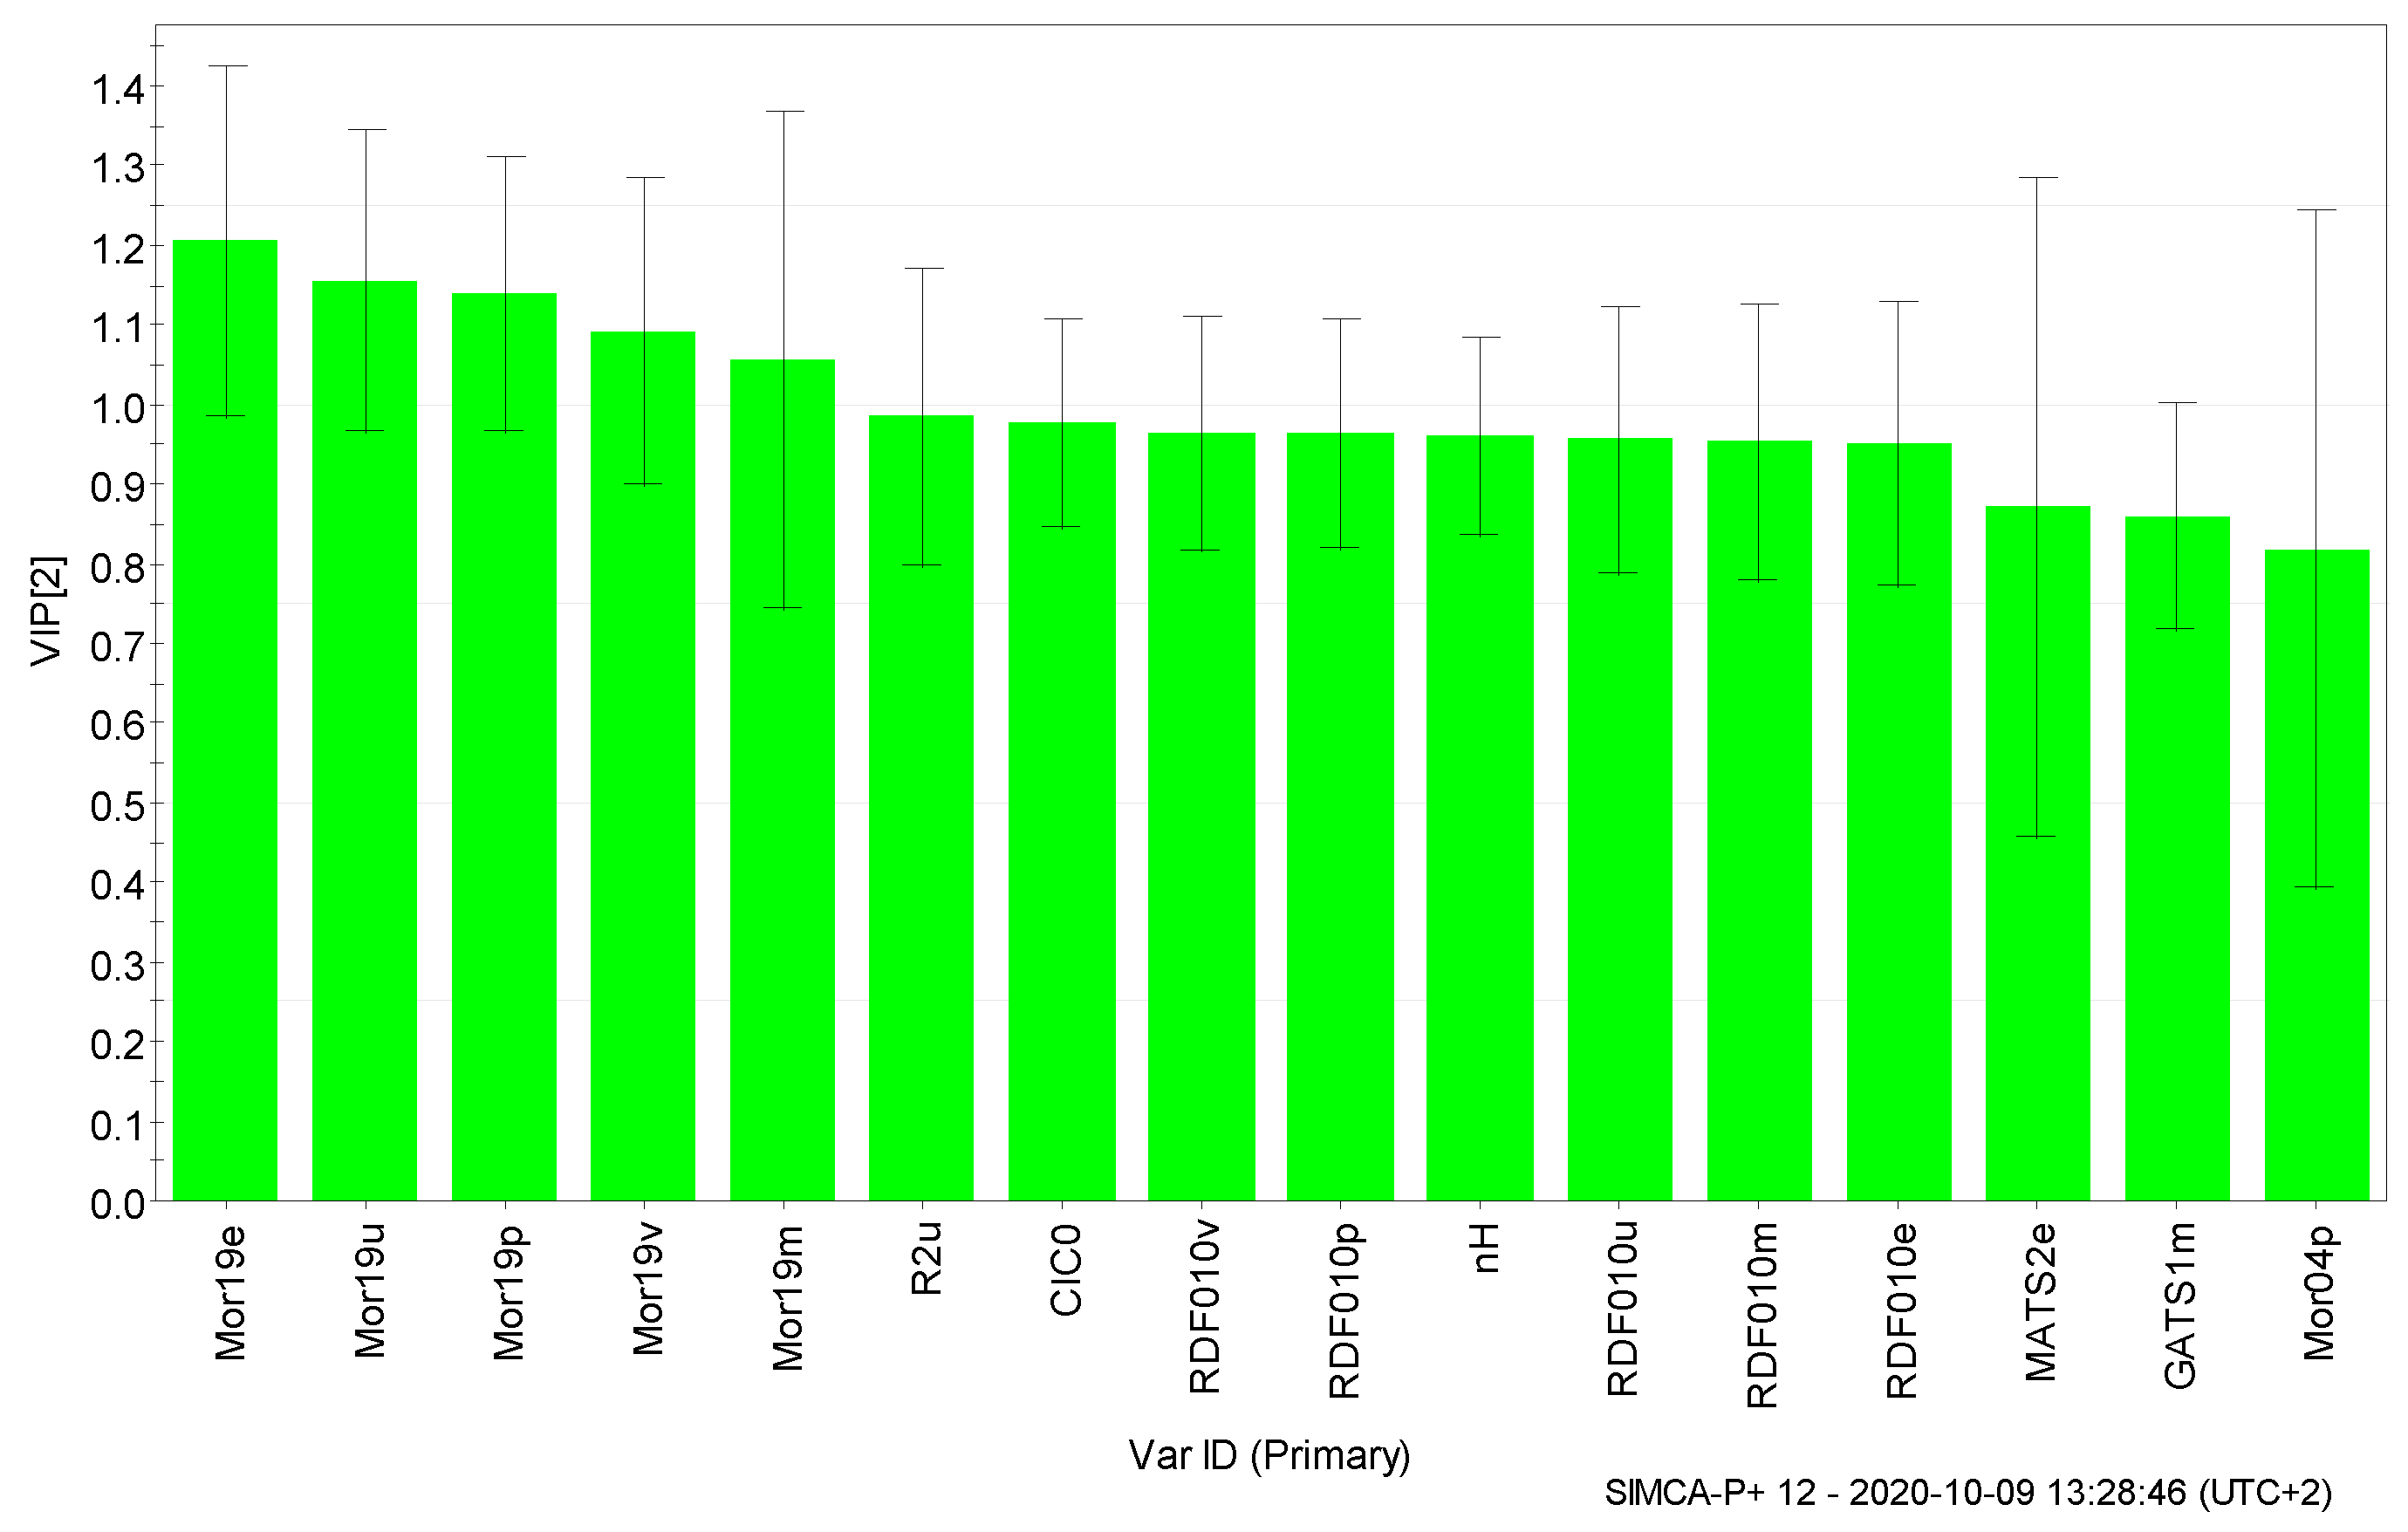
The Hotelling’s T2 range plot confirms the absence of leverage compounds and outliers. The coefficient and VIP plots are presented in Figure 4 and Figure 5, respectively.
In the y-scrambling test performed for the PLS model, a significant low scrambled r2 () and cross-validated q2 () values were obtained for 999 trials. Figure 6 shows that in the case of all the randomized models, the values of and for the PLS model were <0.5 (/ of 0.113/−0.428). The low calculated and values indicate no chance correlation for the PLS chosen model.
The experimental versus calculated pADIs plot is presented in Figure 7.
The final PLS model is robust and has good fitting results. All the criteria of this model used to check the presence of outliers in the X and Y space indicate that compounds 9, 14, 19, 42, and 45 do not belong to the predicted X space. For these compounds, new experimental toxicological data would be needed, to revise their known ADI values, for qualitative and quantitative dietary long-term risk assessments.
4. Conclusions
The acceptable daily intake (ADI), considered to be a measure of qualitative and quantitative dietary long-term risk assessments, was modeled for a series of 46 organophosphorus (OP) pesticides using the partial least squares approach. Molecular mechanics calculations using the MMFF94s force field gave pesticide conformer ensembles. The calculated descriptors of the resulting structures of minimum energy were related to the pADIs using the PLS method. Several criteria to verify the model stability and the potential outliers in the X and Y space were applied to establish if new experimental toxicological data would be needed for this dataset. Five OPs were found as potential outliers in the X and Y space, and new ADIs would be needed to be established for these compounds.
Author Contributions
G.I. analyzed the data; S.F.-T. performed molecular modeling calculations, the statistical analysis, and wrote the paper. All authors have read and agreed to the published version of the manuscript.
Institutional Review Board Statement
Not applicable.
Informed Consent Statement
Informed consent was obtained from all subjects involved in the study.
Data Availability Statement
Publicly available datasets were analyzed in this study. This data can be found here: http://www.inchem.org/pages/pims.html.
Acknowledgments
This project was financially supported by Project 1.1 of the Coriolan Dragulescu Institute of Chemistry of the Romanian Academy. Access to the OpenEye Ltd. and Chemaxon Ltd. software is greatly acknowledged by the authors.
Conflicts of Interest
The authors declare no conflict of interest.
References
- Renwick, A.G. Pesticide residue analysis and its relationship to hazard characterisation (ADI/ARfD) and intake estimations (NEDI/NESTI). Pest Manag. Sci. 2002, 58, 1073–1082. [Google Scholar] [CrossRef] [PubMed]
- Bhanti, M.; Taneja, A. Contamination of vegetables of different seasons with organophosphorous pesticides and related health risk assessment in northern India. Chemosphere 2007, 69, 63–68. [Google Scholar] [CrossRef] [PubMed]
- Galloway, T.; Handy, R. Immunotoxicity of organophosphorous pesticides. Ecotoxicology 2003, 12, 345–363. [Google Scholar] [CrossRef] [PubMed]
- Guodong, D.; Pei, W.; Ying, T.; Jun, Z.; Yu, G.; Xiaojin, W.; Rong, S.; Guoquan, W.; Xiaoming, S. Organophosphate pesticide exposure and neurodevelopment in young Shanghai children. Environ. Sci. Technol. 2012, 46, 2911–2917. [Google Scholar] [CrossRef] [PubMed]
- Casarett and Doull’s Toxicology. The Basic Science of Poisons, 9th ed.; Klaassen, C.D., Amdur, M.O., Doull, J., Eds.; McGraw-Hill Education: New York, NY, USA; Chicago, IL, USA; San Francisco, CA, USA; Athens, Greece; London, UK; Madrid, Spanish; Mexico City, Mexico; Milan, Italy; New Delhi, Indian; Singapore; Sydney, Australia; Toronto, ON, Canada, 2019. [Google Scholar]
- Casida, J.E.; Quistad, G.B. Serine hydrolase targets of organophosphorus toxicants. Chem. Biol. Interact. 2005, 157, 277–283. [Google Scholar] [CrossRef] [PubMed]
- Chun, O.K.; Kang, H.G. Estimation of risks of pesticide exposure, by food intake, to Koreans. Food Chem. Toxicol. 2003, 41, 1063–1076. [Google Scholar] [CrossRef]
- Joint FAO/WHO Expert Consultation on the Application of Risk Analysis to Food Standards Issues (1995: Geneva, Switzerland), World Health Organization. Food Safety Team & Food and Agriculture Organization of the United Nations. Application of Risk Analysis to Food Standards Issues: Report of the Joint FAO/WHO Expert Consultation, Geneva, Switzerland, 13–17 March 1995. World Health Organization. Available online: https://apps.who.int/iris/handle/10665/58913 (accessed on 4 March 2020).
- Joint FAO/WHO Expert Committee on Food Additives. World Health Organization & Food and Agriculture Organization of the United Nations: Procedures for the Testing of Intentional Food Additives to Establish Their Safety for Use: Second Report of the Joint FAO/WHO Expert Committee on Food Additives [Meeting Held in Geneva from 17 to 24 June 1957]. WHO Techn. Rep. Ser., No. 144, FAO Nutrition Meetings. Report Series, No. 17. 1958. Available online: https://apps.who.int/iris/handle/10665/40403 (accessed on 4 March 2020).
- WHO Expert Committee on Pesticide Residues. World Health Organization & Food and Agriculture Organization of the United Nations: Principles Governing Consumer Safety in Relation to Pesticide Residues: Report of a Meeting of a WHO Expert Committee on Pesticide Residues Held Jointly with the FAO Panel of Experts on the Use of Pesticides in Agriculture [Meeting held in Rome from 9 to 16 October 1961]. WHO Tech. Rep. Ser., No. 240. 1962. Available online: https://apps.who.int/iris/handle/10665/40536 (accessed on 4 March 2020).
- Joint FAO/WHO Expert Committee on Food Additives; World Health Organization & Food and Agriculture Organization of the United Nations. Evaluation of the Toxicity of a Number of Antimicrobials and Antioxidants: Sixth Report of the Joint FAO/WHO Expert Committee on Food Additives [Meeting Held in Geneva from 5 to 12 June 1961]. WHO Tech. Rep. Ser. No. 228. FAO Nutrition Meetings. Report Series No. 31. 1962. Available online: https://apps.who.int/iris/handle/10665/40518 (accessed on 4 March 2020).
- WHO International Programme on Chemical Safety; Joint FAO/WHO Expert Committee on Food Additives; WHO Task Group on Updating the Principles for the Safety Assessment of Food Additives and Contaminants in Food; International Labour Organization. Principles for the Safety Assessment of Food Additives and Contaminants in Food, Published under the Joint Sponsorship of the United Nations Environment Programme, the International Labour Organisation, and the World Health Organization in Collaboration with the Food and Agriculture Organization of the United Nations. WHO, Environmental Health Criteria No. 70. 1987. Available online: https://apps.who.int/iris/handle/10665/37578 (accessed on 4 March 2020).
- Lu, F.C. Acceptable daily intake: Inception, evolution, and application. Regul. Toxicol. Pharmacol. 1988, 8, 45–60. [Google Scholar] [CrossRef]
- Rubery, E.D.; Barlow, S.M.; Steadman, J.H. Criteria for setting quantitative estimates of acceptable intakes of chemicals in food in the U.K. Food Addit. Contam. 1990, 7, 287–302. [Google Scholar] [CrossRef] [PubMed]
- Hawkins, P.C.D.; Skillman, A.G.; Warren, G.L.; Ellingson, B.A.; Stahl, M.T. Conformer generation with OMEGA: Algorithm and validation using high quality structures from the Protein Databank and Cambridge Structural Database. J. Chem. Inf. Model. 2010, 50, 572–584. [Google Scholar] [CrossRef] [PubMed]
- Hawkins, P.C.D.; Nicholls, A. Conformer generation with OMEGA: Learning from the data set and the analysis of failures. J. Chem. Inf. Model. 2012, 52, 2919–2936. [Google Scholar] [CrossRef] [PubMed]
- Wold, H.; Kotz, S.; Johnson, N.L. (Eds.) Encyclopedia of Statistical Sciences; Wiley: New York, NY, USA, 1985; Volume 6, p. 581. [Google Scholar]
- Roy, P.P.; Paul, S.; Mitra, I.; Roy, K. On two novel parameters for validation of predictive QSAR models. Molecules 2009, 14, 1660–1701. [Google Scholar]
- Roy, K.; Kar, S.; Ambure, P. On a simple approach for determining applicability domain of QSAR models. Chemometr. Intell. Lab. Syst. 2015, 145, 22–29. [Google Scholar] [CrossRef]
Figure 1.
DmodX plot of the final PLS model.

Figure 2.
Score scatter plot of the final PLS model.

Figure 3.
The Hotelling’s T2 range plot of the final PLS model.

Figure 4.
The coefficient plot of the final PLS model.

Figure 5.
VIP plot for the final PLS model.

Figure 6.
Y-scramble plots for the PLS model.

Figure 7.
Experimental versus calculated pADIs plot for the final PLS model.


Table 1.
The organophosphorus pesticide structures, the experimental (pADIexp) pesticide residues in food, and PmodXPS + [2] values derived from the PLS model.
Table 1.
The organophosphorus pesticide structures, the experimental (pADIexp) pesticide residues in food, and PmodXPS + [2] values derived from the PLS model.
| No | Structure | pADIexp | PmodXPS + [2] | No | Structure | pADIexp | PmodXPS + [2] |
|---|---|---|---|---|---|---|---|
| 1 * |  | 6.79 | 0.424 | 24 |  | 7.11 | 0.593 |
| 2 * |  | 7.8 | 0.292 | 25 |  | 8.54 | 0.657 |
| 3 |  | 6.96 | 0.729 | 26* |  | 7.22 | 0.183 |
| 4 * |  | 6.99 | 0.138 | 27 |  | 8.22 | 0.903 |
| 5 * |  | 8.84 | 0.084 | 28 |  | 7.6 | 0.607 |
| 6 |  | 8.25 | 0.181 | 29 * |  | 7.55 | 0.055 |
| 7 * |  | 7.54 | 0.676 | 30 * |  | 8.48 | 0.739 |
| 8 |  | 7.51 | 0.962 | 31 |  | 8.17 | 0.093 |
| 9 *,** |  | 6.46 | 0.039 | 32 |  | 8.57 | 0.894 |
| 10 |  | 8.89 | 0.129 | 33 * |  | 8.85 | 0.368 |
| 11 |  | 8.18 | 0.245 | 34 |  | 7.77 | 0.658 |
| 12 |  | 7.74 | 0.519 | 35 |  | 7.12 | 0.999 |
| 13 |  | 7.36 | 0.139 | 36 |  | 8.03 | 0.853 |
| 14 *,** |  | 8.96 | 0.016 | 37 |  | 9.11 | 0.764 |
| 15 * |  | 8.01 | 0.561 | 38 * |  | 8.57 | 0.981 |
| 16 |  | 8.28 | 0.625 | 39 * |  | 7.2 | 0.400 |
| 17 |  | 8.91 | 0.808 | 40 |  | 8.78 | 0.741 |
| 18 |  | 7.99 | 0.162 | 41 |  | 8.47 | 0.112 |
| 19 *,** |  | 8.78 | 0.001 | 42 *,** |  | 7.01 | 0.006 |
| 20 |  | 7.51 | 0.882 | 43 * |  | 7.91 | 0.409 |
| 21 |  | 7.74 | 0.996 | 44 |  | 8.5 | 0.122 |
| 22 |  | 9.01 | 0.166 | 45 *,** |  | 7.41 | 0.000 |
| 23 * |  | 8.44 | 0.408 | 46 * |  | 7.56 | 0.081 |
* Test compounds included in the partial least squares (PLS) model. ** Outliers in the X space.
Table 2.
The PLS coefficients in descending order of the variables importance in the projection (VIP values *).
Table 2.
The PLS coefficients in descending order of the variables importance in the projection (VIP values *).
| No | Variable ID * | CoefCS [2] | VIP [2] |
|---|---|---|---|
| 1 | CIC0 | 0.052 | 0.976 |
| 2 | GATS1m | 0.133 | 0.860 |
| 3 | MATS2e | 0.131 | 0.872 |
| 4 | Mor04p | 0.125 | 0.818 |
| 5 | Mor19e | 0.123 | 1.205 |
| 6 | Mor19m | 0.139 | 1.057 |
| 7 | Mor19p | 0.101 | 1.139 |
| 8 | Mor19u | 0.107 | 1.156 |
| 9 | Mor19v | 0.089 | 1.093 |
| 10 | nH | 0.036 | 0.961 |
| 11 | R2u | 0.075 | 0.985 |
| 12 | RDF010e | 0.031 | 0.951 |
| 13 | RDF010m | 0.031 | 0.953 |
| 14 | RDF010p | 0.036 | 0.963 |
| 15 | RDF010u | 0.033 | 0.957 |
| 16 | RDF010v | 0.036 | 0.963 |
* CIC0—complementary information content (neighborhood symmetry of 0-order) (topological descriptors), GATS1m—Geary autocorrelation—lag 1/weighted by atomic masses (2D autocorrelations), MATS2e—Moran autocorrelation—lag 2/weighted by atomic Sanderson electronegativities (2D autocorrelations), Mor04p—3D-MoRSE—signal 04/weighted by atomic polarizabilities (3D-MoRSE descriptors), Mor19e—D-MoRSE—signal 19/weighted by atomic Sanderson electronegativities (3D-MoRSE descriptors), Mor19m—3D-MoRSE—signal 19/weighted by atomic masses (3D-MoRSE descriptors), Mor19p—3D-MoRSE—signal 19/weighted by atomic polarizabilities (3D-MoRSE descriptors), Mor19u—3D-MoRSE—signal 19/unweighted (3D-MoRSE descriptors), Mor19v—3D-MoRSE—signal 19/weighted by atomic van der Waals volumes (3D-MoRSE descriptors), nH—number of Hydrogen atoms (constitutional descriptors), R2u—R autocorrelation of lag 2/unweighted (GETAWAY descriptors), RDF010e—Radial Distribution Function—1.0/weighted by atomic Sanderson electronegativities (RDF descriptors), RDF010m—Radial Distribution Function—1.0/weighted by atomic masses (RDF descriptors), RDF010p—Radial Distribution Function—1.0/weighted by atomic polarizabilities (RDF descriptors), RDF010u—Radial Distribution Function—1.0/unweighted (RDF descriptors), and RDF010v—Radial Distribution Function—1.0/weighted by atomic van der Waals volumes (RDF descriptors).
Publisher’s Note: MDPI stays neutral with regard to jurisdictional claims in published maps and institutional affiliations. |
© 2020 by the authors. Licensee MDPI, Basel, Switzerland. This article is an open access article distributed under the terms and conditions of the Creative Commons Attribution (CC BY) license (https://creativecommons.org/licenses/by/4.0/).
Share and Cite
MDPI and ACS Style
Ilia, G.; Funar-Timofei, S. Evaluation of Organophosphate Pesticide Residues in Food Using the Partial Least Squares Method. Chem. Proc. 2021, 3, 19. https://doi.org/10.3390/ecsoc-24-08307
AMA Style
Ilia G, Funar-Timofei S. Evaluation of Organophosphate Pesticide Residues in Food Using the Partial Least Squares Method. Chemistry Proceedings. 2021; 3(1):19. https://doi.org/10.3390/ecsoc-24-08307
Chicago/Turabian StyleIlia, Gheorghe, and Simona Funar-Timofei. 2021. "Evaluation of Organophosphate Pesticide Residues in Food Using the Partial Least Squares Method" Chemistry Proceedings 3, no. 1: 19. https://doi.org/10.3390/ecsoc-24-08307