Article

New Approaches in Electroanalytical Determination of Triazines-Based Pesticides in Natural Waters

by
Fernanda C. O. L. Martins
and
Djenaine De Souza
*
Laboratory of Electroanalytical Applied to Biotechnology and Food Engineering (LEABE), Campus of Patos de Minas, Chemistry Institute, Federal Uberlândia University, Major Jerônimo Street, 566, Patos de Minas 38700-002, MG, Brazil
*
Author to whom correspondence should be addressed.
Analytica 2023, 4(2), 84-101; https://doi.org/10.3390/analytica4020008
Submission received: 1 March 2023 / Revised: 28 March 2023 / Accepted: 29 March 2023 / Published: 31 March 2023
(This article belongs to the Section Electroanalysis)

Abstract

:
This study describes the preparation and use of a dental amalgam electrode for the voltammetric determination of triazine-based pesticides ametryn, atrazine, and simazine in natural waters, using square wave voltammetry. The experimental and voltammetric parameters were previously optimized, and analytical curves were constructed to calculate analytical parameters. The detection limits presented values that were lower than the maximum limits of residues permitted in natural water by the Brazilian Environmental Agency, 100 µg L−1 (100 ppb), and around the values obtained using other electrodic surfaces or high-performance liquid chromatography, traditionally used in triazine levels determination. Furthermore, the recovery percentages in pure electrolyte and natural waters were around 100%, demonstrating that the methodology proposed is suitable for determining triazines contamination in natural water samples, based on an environmentally friendly procedure.

1. Introduction

Chemical compounds that act as herbicides are largely employed in agricultural practices to control weeds and eliminate diverse pests. Their use can minimize agricultural work, reduce the cost of production, decrease topsoil erosion, increase crop yields, and consequently produce profits [1]. Among herbicides, triazines are the chemical class that is most widely employed in diverse agricultural productions, due to their high efficiency. In Brazil, ametryn (2-ethylamine-4-isopropylamine-6-methylthio-s-triazine), atrazine (2-chloro-4-ethylamine-6-isopropylamine-s-triazine), and simazine (2-chloro-4,6-bis(ethylamine)-s-triazine) are mainly used in the production of corn, sorghum, and sugar cane [2,3]; their chemical structures are shown in the insert in Figure 1.
Ametryn (AM), atrazine (AT), and simazine (SI) present moderate soil sorption, resulting in natural water contamination. In the last years, researchers have shown the accumulative effects on the human body, which promote alterations in the metabolism, produce undesirable reactions, and consequently, alteration in hormone functions, development of some cancer types, and teratogenic effects [4]. Hence, these substances have a maximum limit permitted in natural waters, according to the United States and the European Union, of 3.0 µg L−1 [5] and 0.1 µg L−1 [6], respectively. On the other hand, in Brazil, a level of 100 µg L−1 for AM, AT, and SI is permitted [3,7,8]. Therefore, their determination in natural waters is highly demanded, due to their undesirable environmental and human health effects.
Some reports have demonstrated the use of chromatographic, electroanalytical, and spectroscopic techniques to identify and quantify triazines in natural water samples, as presented in Table 1 [9,10,11,12,13]. Chromatographic techniques have predominance, due to their applicability in complex samples and suitable analytical parameters, and are widely employed with preconcentrations of the target compounds and diverse sample treatment steps. However, the cost of acquisition and maintenance of the instrumentation is expensive. Nonetheless, electroanalytical techniques promote an abridgment in the sample preparation steps, provide suitable sensitivity and robustness, present low cost, are facility operational, and minimize the generation of wastes (chemicals and solvents) [14].
Among the electroanalytical techniques, square wave voltammetry (SWV) is the most largely employed in determining different triazines, including AM, AT, and SI [8,13,22]. The SWV responses can be used to obtain detailed information regarding the electrochemical behavior of triazines in environmental samples, mainly its analytical determination in natural waters. Moreover, SWV presents convenient analytical features, including high sensitivity, accuracy, precision, large linear dynamic range, and simplicity in the experimental procedure [23].
Moreover, the SWV responses are powerfully related to adequate choices of the working electrode material, due to the redox reactions that occur on the interface electrode/electrolyte. For triazine analysis, the hanging mercury drop electrode (HMDE) is quite frequently employed for the reason of its complete renovation of the surface and excellent reproducibility. Nonetheless, waste production provoked the prohibition of the HMDE’s use worldwide, encouraging researchers to search for new materials with similar properties to these traditional mercury electrodes.
Among them, the solid amalgam electrode has been an excellent alternative in determining electrochemically reducible compounds, including triazines [24]. In addition, these electrodes can be prepared to mix a specific ratio between mercury and other metals, such as copper, silver, gold, iridium, and bismuth, among others [25,26,27]. The use of dental amalgam electrodes (DAEs) also has been reported as a suitable alternative material in substituting for HMDEs, due to their very simple and well-established construction procedure in dental clinical practice. Furthermore, DAEs contain only silver and mercury that are chemically bound as a stable Ag2Hg3 alloy. DAEs are considered a nontoxic electrode because they do not have free liquid mercury, following the guidelines of green analytical chemistry [27,28,29].
Thus, the main goal of this study was the construction, characterization, and application of a DAE coupled to the SWV technique in the electrochemical behavior study, and the development of an electroanalytical procedure for determining AM, AT, and SI levels in natural water samples.

2. Materials and Methods

2.1. Instrumentation and Reagents

The voltammetric experiments were performed using a potentiostat/galvanostat, model PGSTAT 101, plus NOVA software version 2.1.2, both from Metrohm-Eco Chemie. All solutions were prepared using purified water using a reverse osmosis model OS20 LX system from Gehaka. The pH adjustment of the solutions was made in a pH meter from Tecnopon, model MPA 210, equipped with a 3.00 mol L−1 Ag/AgCl/Cl glass combined electrode. The mass measurements were achieved in an analytical balance with a precision of ±0.0001 g from Bel Engineering, model M214A.
The physical characterization of the DAE was carried out by morphology and elemental analyses using scanning electron microscopy (SEM) and energy dispersive X-ray (EDX) techniques, respectively, performed with a scanning electron microscope LEO model 440 coupled to an SiLi detector at 63 eV. The alloy produced in the DAE preparation was examined by X-ray diffraction (XRD), employing a Rigaku diffractometer (Rigaku Corp., Tokyo, Japan) model D-Max 2500 PC, with Cu/40 kV/150 mA radiation and a fixed monochromator, in which a 2θ range from 20.00 to 60.00 was used with step intervals of 0.020 deg and a photon-counting time of 10 s per step. The match program Crystallographic Search-Match [30] was used to identify the components of the final DAE.
All chemicals were of analytical-reagent grade. AM (95%), AT (97%), and SI (95%) were obtained from Ouro Fino Agricultural Company, from Minas Gerais, Brazil, and used without purification. In addition, 1.00 × 10⁴ mol L−1 stock solutions of herbicides were daily and individually prepared using pure acetonitrile as the solvent, stored in a dark flask, and kept in a refrigerator to prevent degradation. All materials employed in the voltammetric experiments were preliminarily washed with a neutral detergent, ethanol 96° GL, and pure water, to remove organic wastes.

2.2. Electrochemical Cell

A conventional glass cell with a Teflon® cap containing three electrodes and a supporting electrolyte was used in all of the voltammetric experiments. A homemade DAE, a platinum wire, and an Ag/AgCl/KCl (3.00 mol L−1) electrode were used as working, auxiliary, and reference electrodes, respectively. The DAE was prepared according to the procedure employed in dental clinics, as described by De Souza et al. [27]. Thus, a suitable quantity of analytical grade liquid mercury and fine silver powder (particle size 5–9 µm, purity 99.90%, Sigma-Aldrich São Paulo, SP, Brazil) were vigorously blended and inserted into a glass capillary tube with an inner diameter of about 0.30 mm, and pressed for full compaction. After this, the metals were formed into an alloy used in dental amalgams, and an electric contact was provided by a copper wire affixed with conductive silver glue. The resulting solid amalgam discs presented a geometric area of 0.071 mm2, and were polished with ultra-fine sandpaper, washed with water, and used in all of the voltammetric experiments.
Before the voltammetric experiments, the DAE surface was activated by the electrochemical procedure previously described [24,27], which consisted of applying −2.20 V for 600 s in an electrochemical cell containing 0.20 mol L−1 of KCl solution, under constant stirring. This activation procedure was repeated every time in each new series of experiments with a specific triazine, or after longer breaks than one hour in the voltammetric experiments. Before each potential scan, in the electrolyte containing the triazine understudy, the surface was renovated by application of −2.20 V over 30 s, with stirring of the solution, previously deoxygenated by bubbling N2 [27] (White Martins, with 99.99% of purity). As a result, a decrease in the charge transfer resistance and removal of the adsorbed products from the DAE surface was promoted.

2.3. Experimental and Voltammetric Optimization

Initially, AM, AT, and SI voltammetric responses were evaluated in oxalic and Britton–Robinson (BR) buffer, sodium sulfate, and sodium perchlorate solution, which served as supporting electrolytes in pH intervals from 0.5 to 5.0, depending on the electrolyte tested. For this, 10 mL of each supporting electrolyte plus 1.00 × 10⁻⁵ mol L−1 of each standard triazine solution were transferred into the electrochemical cell, and SWV experiments were performed from 0.00 V to −1.20 V at 25 ± 1 °C, using a pulse amplitude (a) of 50 mV, a pulse potential frequency (f) of 100 s−1, and a scan potential increment (ΔEs) of −2 mV.
After selecting a supporting electrolyte with adequate pH values, the voltammetric parameters (f, a, and ΔEs) were also individually evaluated, considering the intensity of peak current (Ip), peak potential (Ep) values, and the variation in the half-peak width (ΔEp1/2), which were responsible for sensitivity in the analyses.

2.4. Analytical Parameters

After the experimental and voltammetric optimization, analytical curves were generated using the standard addition method, enabling the calculation of the limits of detection (LOD) and limits of quantification (LOQ) according to IUPAC guidelines, using the standard deviation of the mean current (Sb) measured at the reduction potentials of each triazine, considering 10 voltammograms of the blank solution in pure electrolytes, and the slope of the straight line of each analytical curve (s) [31,32].
The methodology’s accuracy was verified using recovery curves performed in supporting electrolytes and the standard addition method, considering experiments that were realized in triplicate for each triazine. The recovery value (%R) was calculated considering the ratio between the concentration value obtained by extrapolating the recovery curves constructed in the corresponding artificially spiked electrolyte, and the triazine concentration previously added in the electrochemical cell [31,32].
The methodological precisions for the AM, AT, and SI determinations using the DAE were calculated considering the repeatability (intraday precision) and reproducibility (interday precision) experiments, respectively. Repeatability experiments were accomplished using ten voltammetric analyses on the same day, and in the same triazine solution. Meanwhile, the reproducibility experiments were performed using five voltammetric analyses on different days and solutions, considering each triazine. Relative standard deviations (RSD) for repeatability and reproducibility were calculated from the standard deviations of the mean current values obtained [31,32].

2.5. Application of the Proposed Methodology

Interfering effects were studied in water samples collected from three distinct points of the Paranaíba River, located at Patos de Minas city, Minas Gerais state, Brazil, in order to evaluate the applicability of the proposed methodology. These samples were characterized by different organic matter contents, measured by biochemical oxygen demand (BOD) [33]. Sample 1 (−18.6554°; −46.5128°) was collected in the area located near agricultural plantations of corn, sorghum, and soybean, without significant urban and industrial pollution. Sample 2 (−18.6024°; −46.5405°) was collected near the urban area, where the pollution level by industrial and urban activities is high. Sample 3 (−18.4983°; −46.5603°) was collected in a region after the river traversed all of the city, and with the contribution of higher organic matter contents originating from agricultural, urban, and industrial residues.
All of the samples were used without pre-treatment steps or/and clean up, except by simple filtration to remove all solid particulate components. Posteriorly, 1.0 mL of each sample was added into an electrochemical cell containing 9.0 mL of supporting electrolyte. As described above, voltammograms using different triazine concentrations were obtained in the supporting electrolyte for analytical curve construction. Then, LODs and LOQs were calculated in each sample, and for each triazine. After this, recovery curves were built using the natural water samples to prepare the supporting electrolyte, employing previously artificial contamination by 2.00 × 10⁻⁶ mol L−1 of each triazine separately. These experiments were performed to evaluate the influence of components of each sample in the signal current for each triazine, and to verify the robustness of the proposed procedure.

3. Results and Discussion

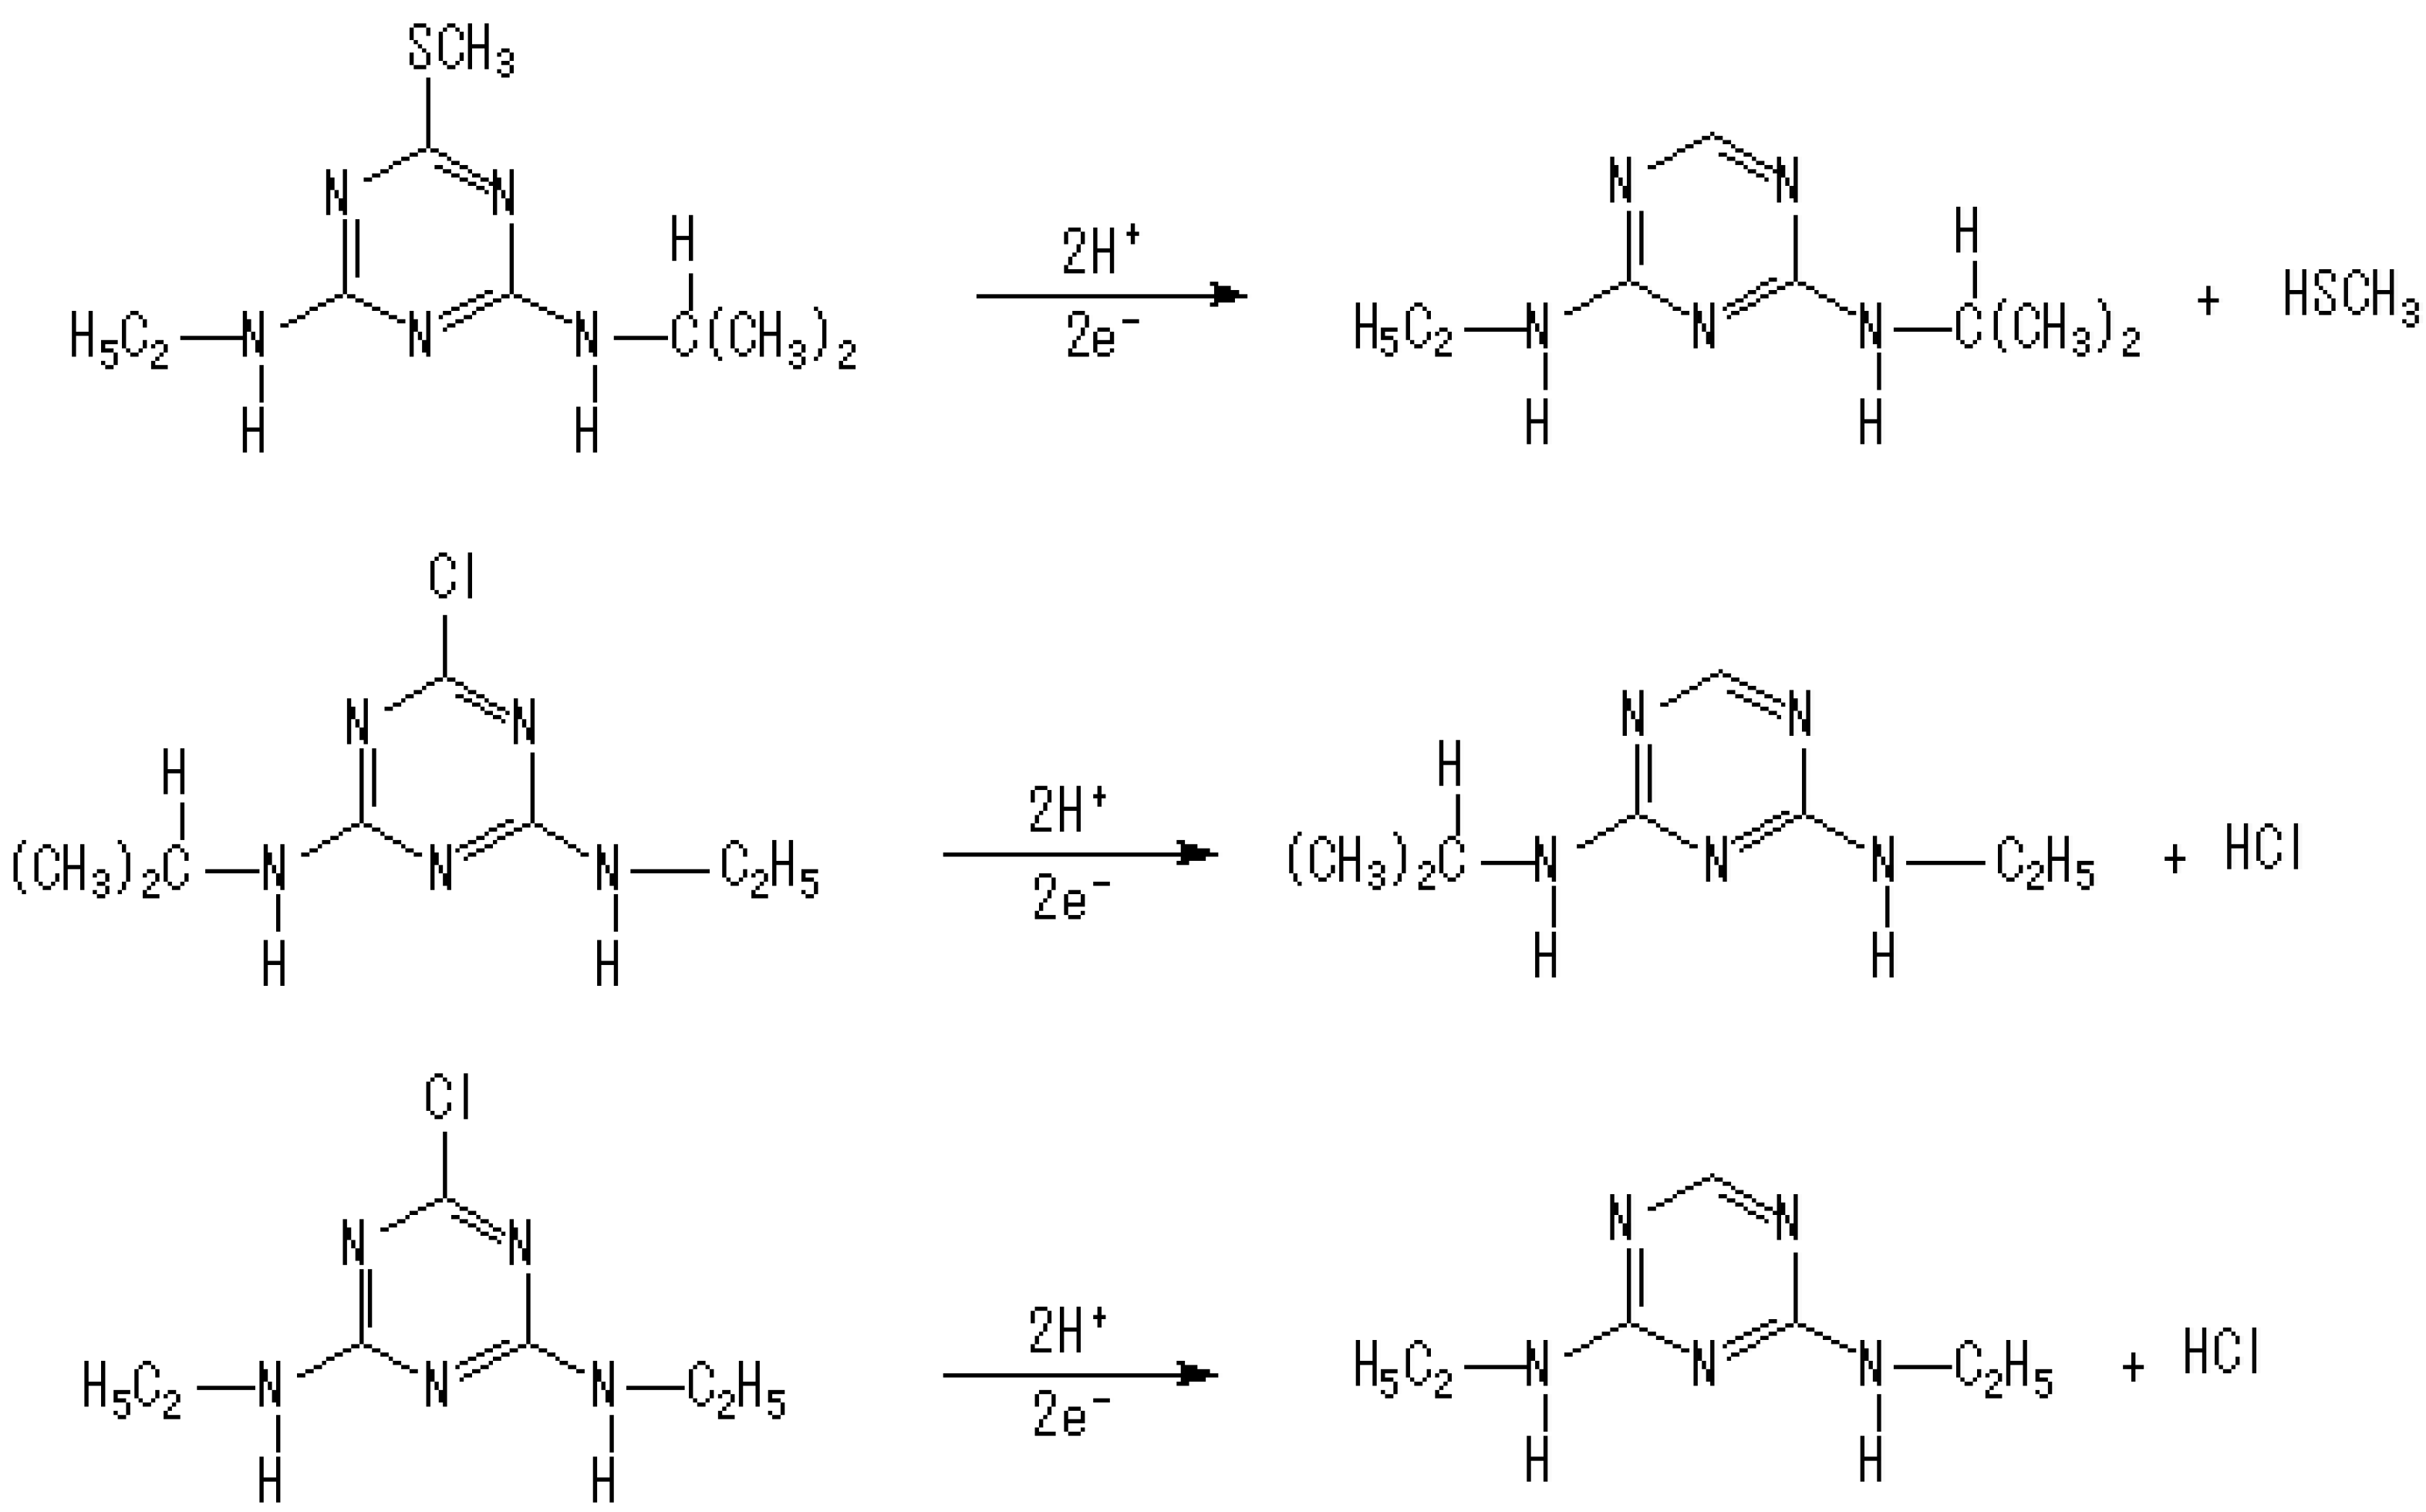
3.1. Characterization of DAE

The DAE was characterized to evaluate its chemical composition, morphology, and the alloy type formed during the amalgamation process, using EDX, SEM, and XDR, respectively. The results observed by EDX analysis showed that the metal ratio of the DAE was 45.0% and 55.0% for silver and mercury (Ag/Hg; m/m), respectively. These values were around the ratios initially weighted in the preparation steps, 50% for each element, and the difference observed can be related to some loss during the assembling process. Additionally, no oxide formation or the presence of silver and free mercury was observed, in agreement with previously published research [27,28].
The SEM analysis using 1000 times magnification showed that the DAE had a rough and irregular morphology. However, it was observed with 5000 times magnification that there was a crystalline type of structure present formed by compact and globular crystals. It was also observed that the DAE morphology was not modified after polishing of the electrode, indicating that mechanical polishing did not affect its physical crystalline structures.
XRD analysis allied to commercial software [30], containing databases of standards for all possible crystalline structures of all compounds containing oxygen, silver, and mercury, permitted the determination of the crystallographic structure of the DAE. Thus, the observed diffraction lines correspond to Ag2Hg3 and Ag3Hg2 phases, and no diffraction lines were observed corresponding to oxide formation and silver or free mercury, indicating an environmentally friendly electrode according to recommendations by Green Analytical Chemistry guidelines [34].

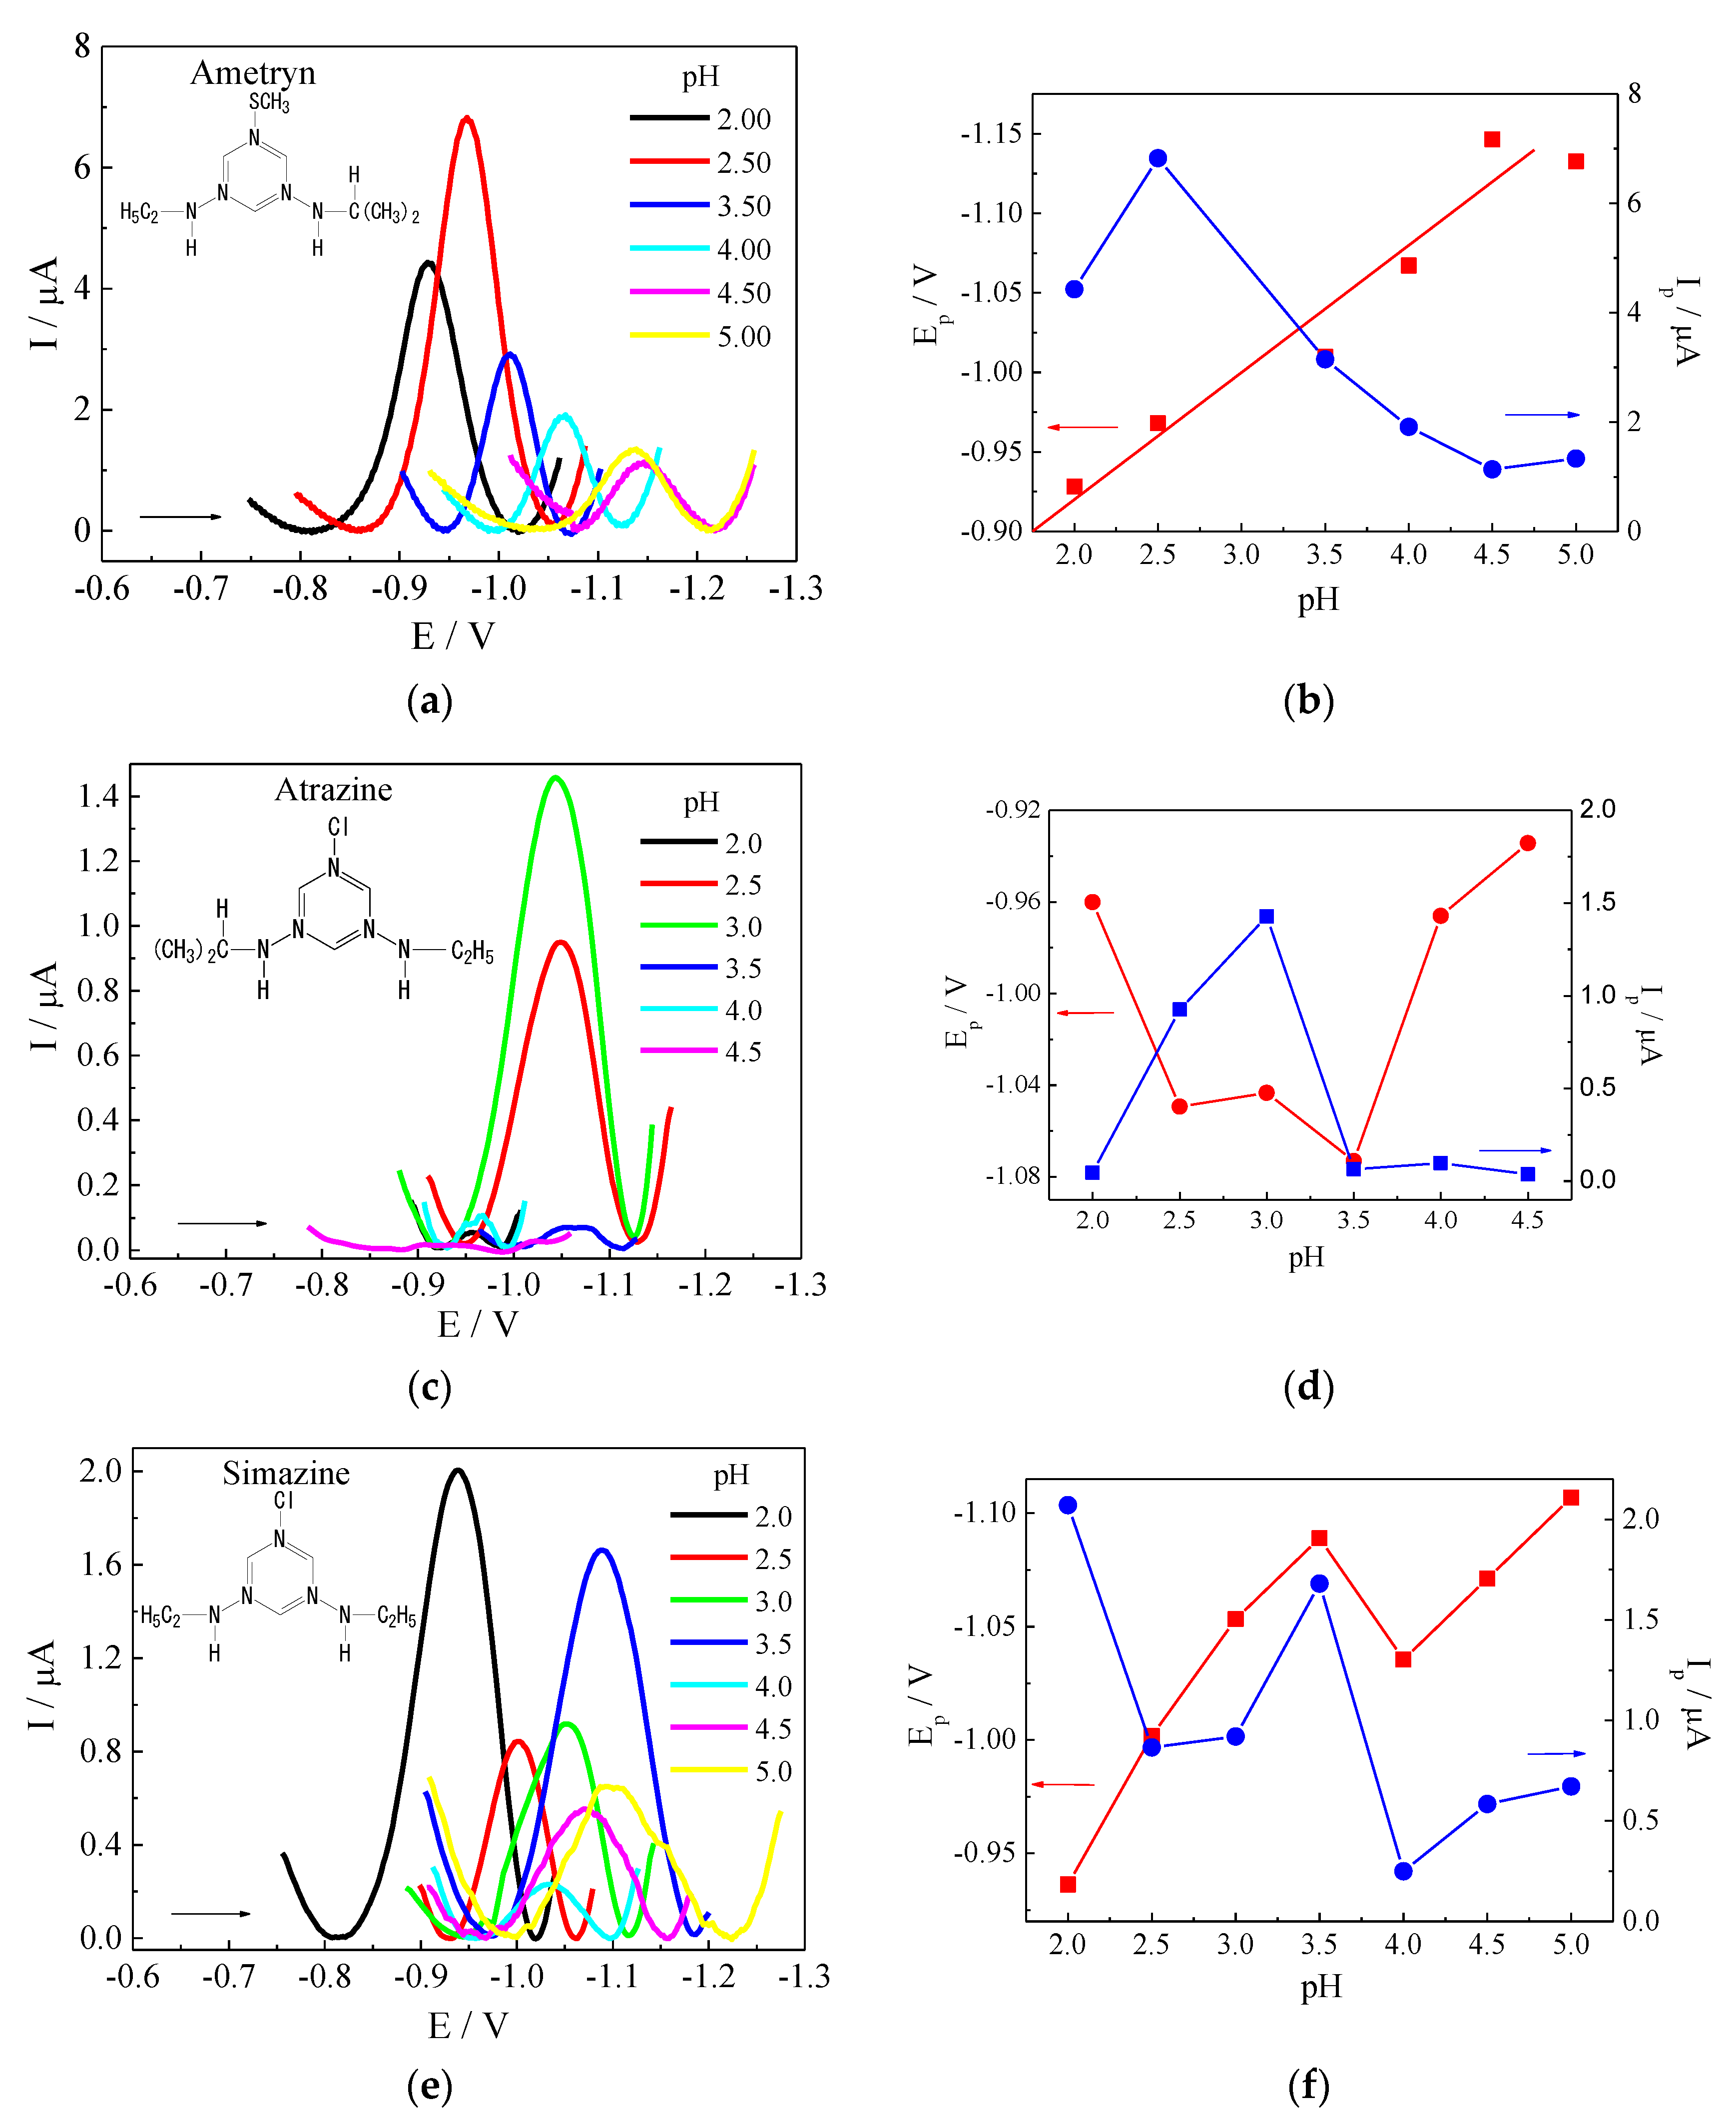
3.2. Experimental Optimization

According to the tested electrolyte, preliminary experiments concerning the adequate choice of supporting electrolytes were performed in BR and oxalic buffer, sodium sulfate, and sodium perchlorate, with pH values from 0.5 to 5.0. For this, scan potentials were performed from 0.0 V to −1.2 V using SWV experiments with f = 100 s−1, a = 50 mV, and ΔEs = −2 mV. In all of the SWV experiments, the observed conditions were the peak current (Ip), peak potential (Ep), and half-peak width variation (ΔEp1/2) values to obtain suitable sensitivity and selectivity. Hence, these preliminary experiments demonstrated that the higher analytical signals for AM, AT, and SI were obtained in the BR buffer, and the SWV experiments performed in the pH intervals from 2.0 a 5.0 are shown in Figure 1, in which the inserts indicate the respective relationships between Ip and Ep with pH values for each triazine.
As demonstrated in Figure 1, a well-defined cathodic peak was observed for AM, in which the Ep shifted towards more negative values when the pH values were increased. The Ip had a maximum value at pH 2.5, below the value of pKa reported in the literature [2], indicating that at pH 2.5, the reduction reaction of the AM occurred in its protonated form. Moreover, the relationship between Ep and pH values, exhibited in Equation (1), indicated that the electrochemical reduction process involved the same number of protons and electrons, as observed using the copper solid amalgam electrode (CuSAE) and HMDE [13,23]:
E p V = 0.760 + 0.079 pH
For AT was observed the presence of a well-defined voltammetric peak only at a pH between 2.5 and 3.0, which correspond to values above the pKa reported in the literature [2] (pH > pKa). This voltammetric behavior indicates that when pH values are higher than pKa, the redox reaction is related to forming a very reactive intermediate species. In other words, after the electron transfer undergoes some chemical reaction, there is a chemical reaction coupled to the electron transfer [35]. Furthermore, no linear relationship was observed between the Ep and pH values, indicating that using the DAE produced voltammetric responses that were considerably different from those obtained under the CuSAE and the HMDE. However, the signals observed were suitable for the development of electroanalytical procedures. It was observed for SI a well-defined voltammetric peak for all pH values. Still, the maximum of Ip occurred at a pH between 2.0 and 3.5, at values above the pKa reported (pH > pKa) and presenting a considerable increase in the ΔEp1/2. These responses indicate that AT reduction under the DAE probably occurred with the formation of very reactive chemical species, followed by protonation steps. Additionally, linear relationships between Ip and Ep with pH values were not observed, indicating that protonation was not the determining step in the redox reaction kinetics [36].
Considering all triazine signals presented in Figure 1, it is possible to estimate the possible redox reaction on the DAE according to the structural formulas of triazine and basic electrochemical aspects of the organic compounds reduction process [37]. Thus, a possible redox reaction on the DAE can occur with the AM’s thiomethyl group (-SCH3), presenting an intense interaction with the silver and mercury present in the DAE composition, which promoted the best voltammetric signals when compared to similar signals obtained for AT and SI. Furthermore, the authors observed a considerable increase in the current signals under the DAE, according to organic electrochemistry information [8,13,14,24,35,36,37] and previous research using HMDEs and CuSAEs. It could be related to the presence of silver and mercury in the electrode’s composition, improving the interaction between AM and the electrode surface and, consequently, improving the final responses.
The redox reactions of AT and SI probably involved a previous protonation of the heterocyclic ring at the nitrogen atom, followed by a two-electron reduction of the triazine ring. An unstable intermediate was yielded that was stabilized by the release of an HCl molecule. The differences observed were related to differences in the molecule symmetry, as shown in the Figure 1 inserts. Additionally, a pH of 2.5 was selected for all posterior voltammetric analyses of triazines because this pH value occurred in well-defined voltammetric peaks, with lower ΔEp1/2 and lower Ep values, improving the selectivity and reducing possible interference effects in complex samples, such as natural waters, respectively.
In addition, voltammetric experiments were performed to evaluate the reproducibility of the voltammetric signals for all triazines, which consisted of the DAE mechanical polishing, solution agitation, and DAE electrochemical renovation, where all procedures were carried out between each voltammetric experiment.
In this way, it was observed that the polishing promoted considerable alterations in the electrode surface, resulting in alterations in the signal intensities for each triazine. Moreover, solution agitation did not promote a complete cleaning of the DAE, mainly for AT. Finally, it was observed that the electrochemical renovation by application of −2.2 V for 30 s enabled a complete renovation of the DAE surface, resulting in suitable repeatability and reproducibility in the voltammetric signals, with Ep values at −1.05 V, −0.97 V, and −0.99 V for AM, AT, and SI, respectively.

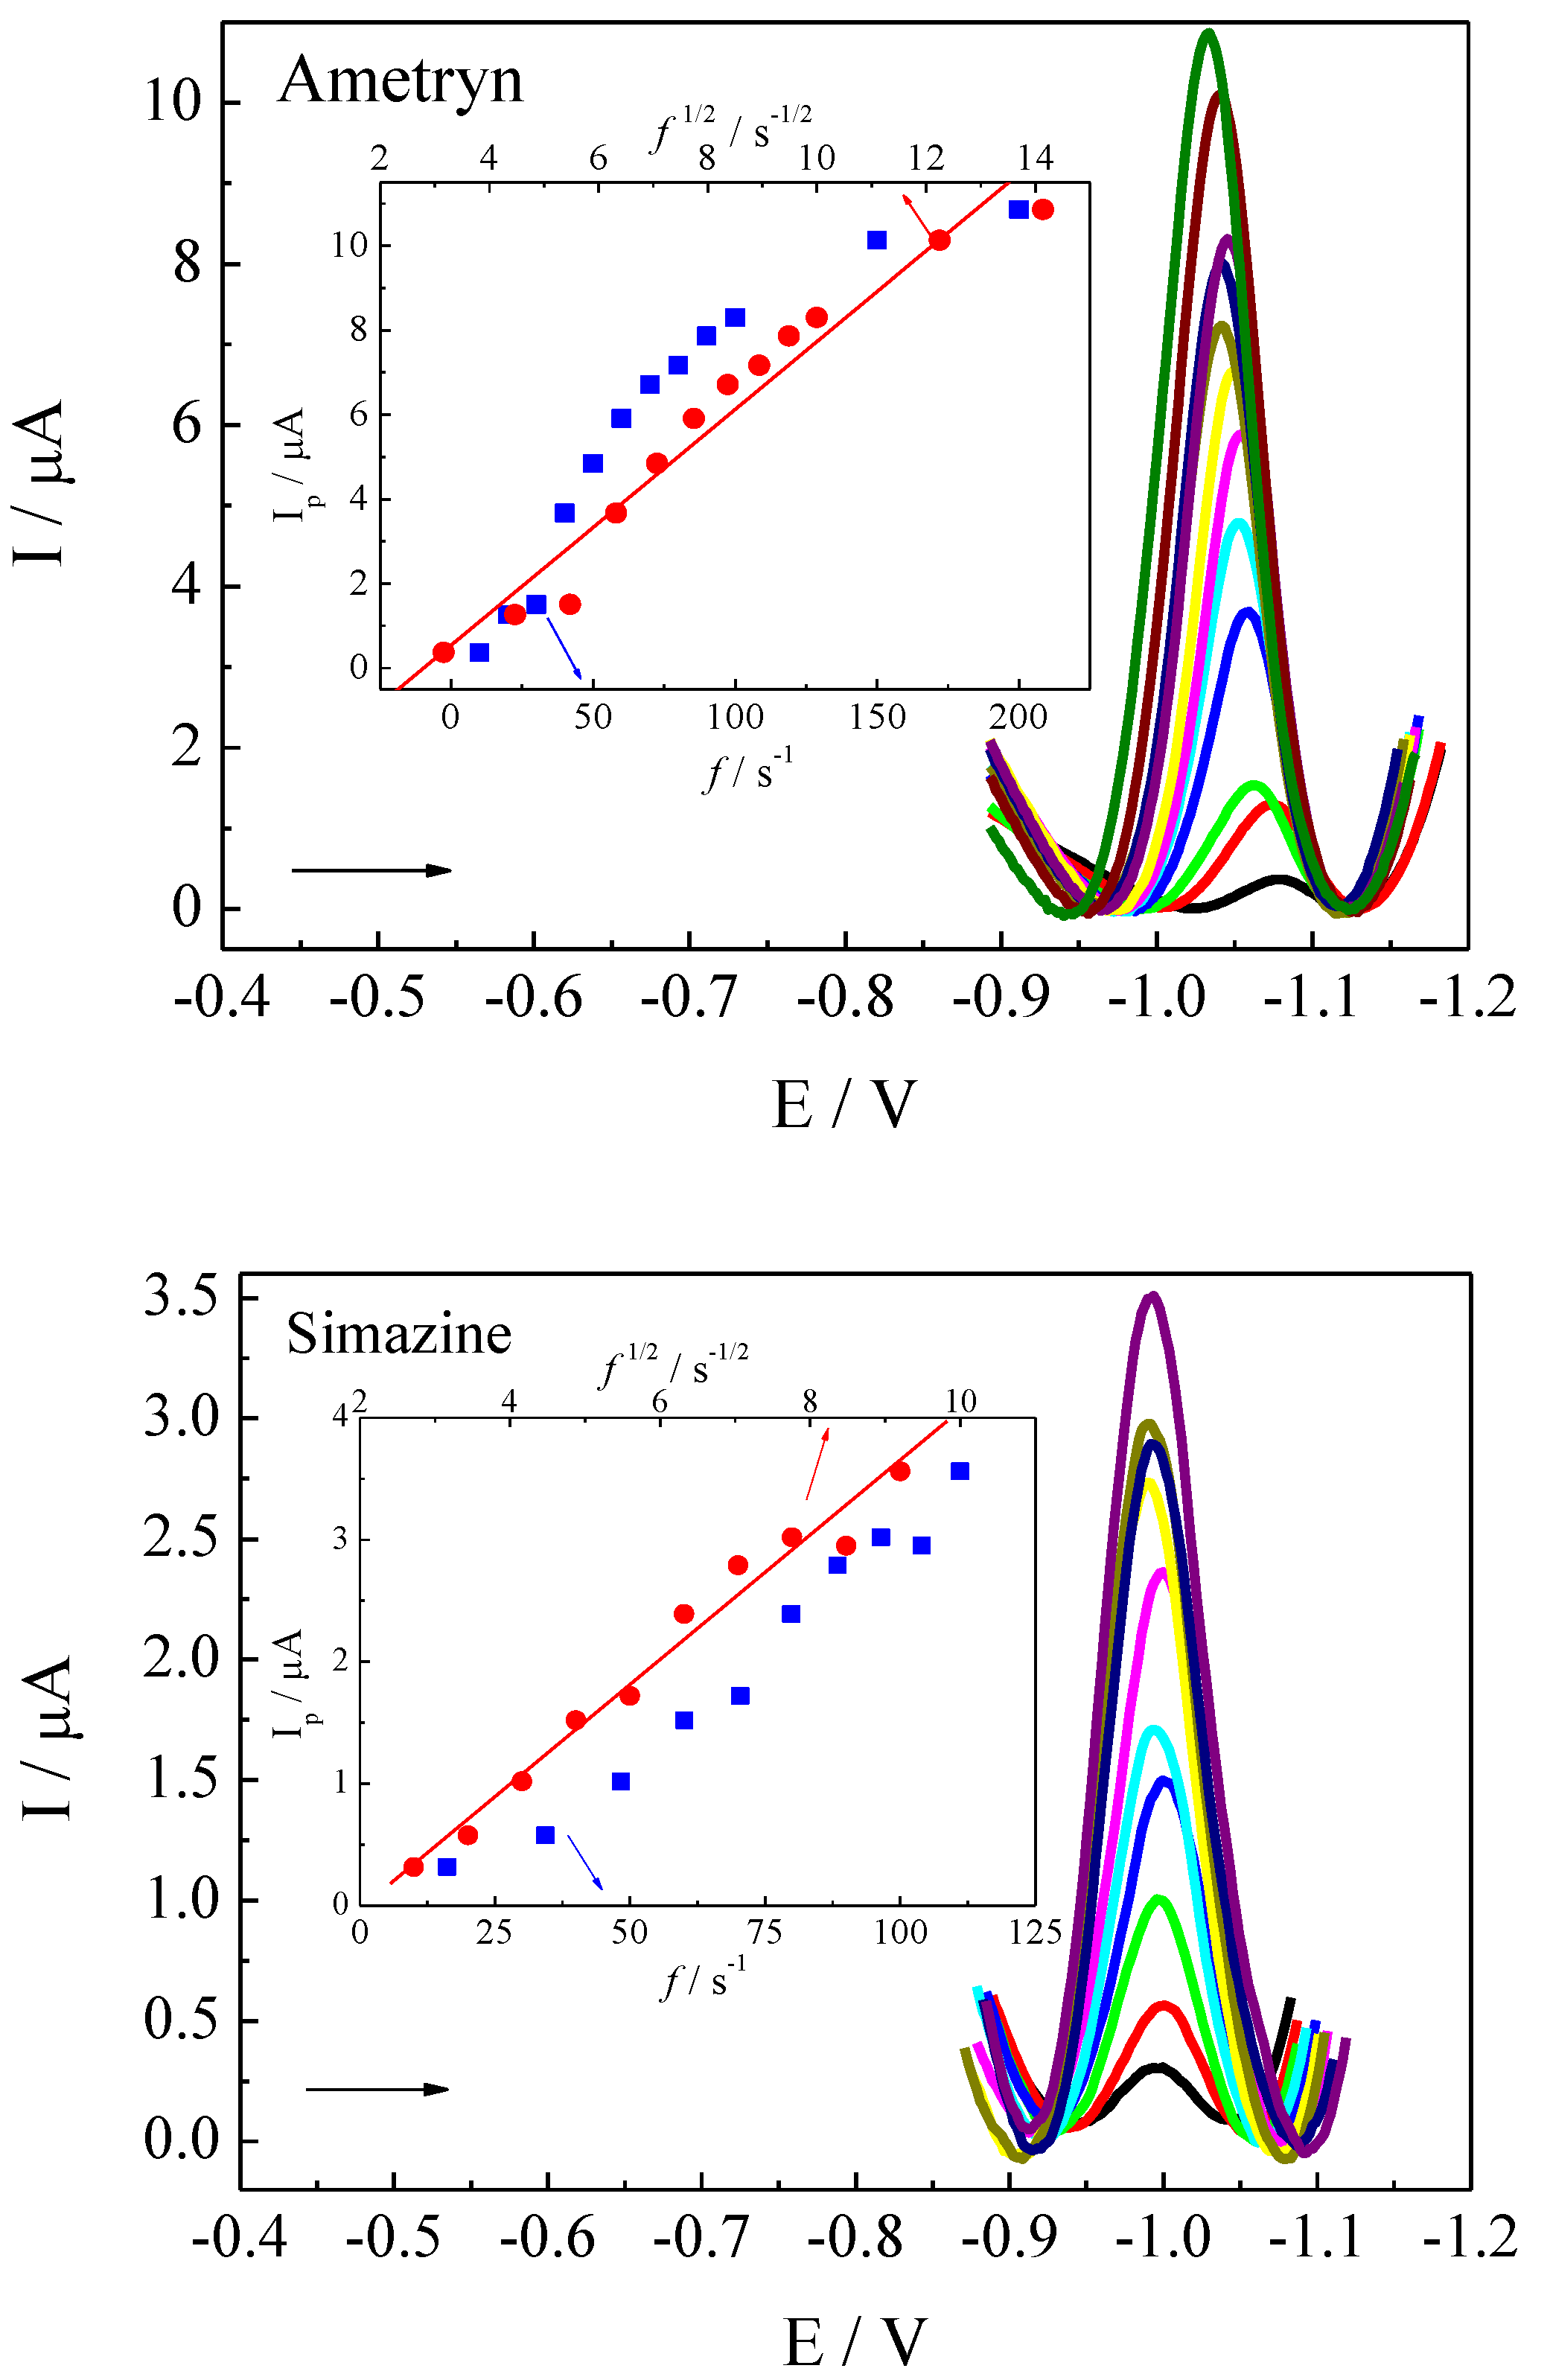
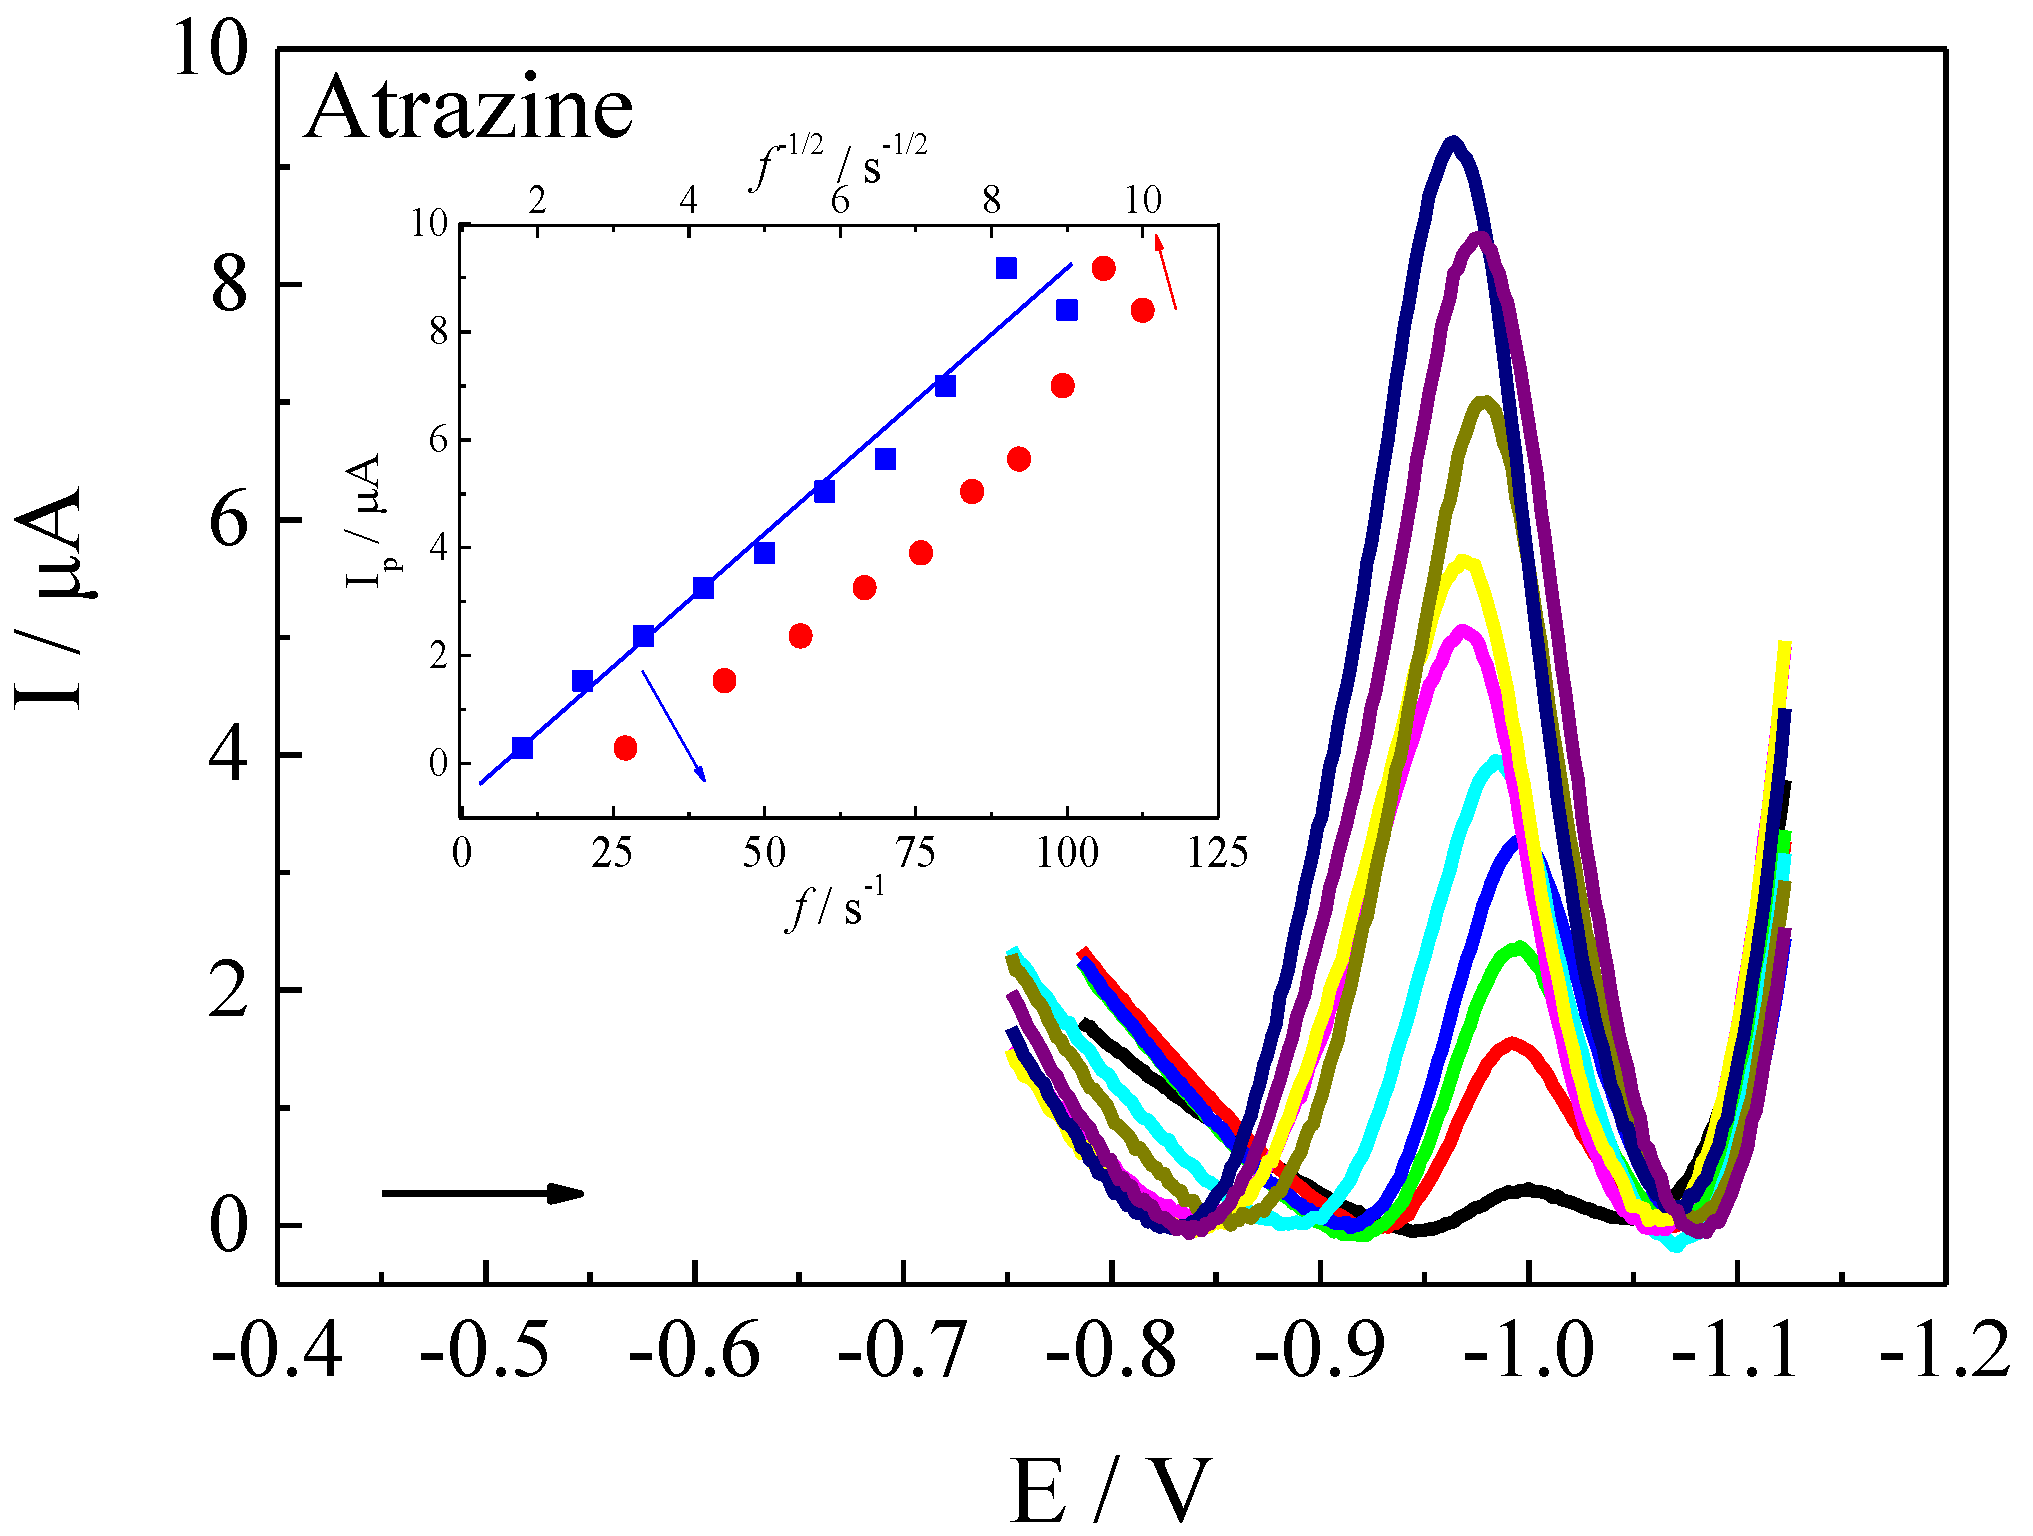
3.3. Voltammetric Parameters Optimization

The voltammetric parameters were optimized using 1.00 × 10⁻⁵ mol L−1 of each triazine in BR buffer (pH 2.5), and the relationships between Ip and Ep with a, ΔEs, and f parameters were individually evaluated in the range from 5 mV to 50 mV, from −2 mV to −10 mV, and from 10 s−1 to 200 s−1, respectively. The voltammograms obtained with the variation in the f values plus the relationships between Ip and f are shown in Figure 2 for AM, AT, and SI. Using SWV theory and these voltammograms analyses, it is possible to observe the presence of the process of adsorption or reaction in solution and the reversibility or irreversibility of the electrochemical process. Moreover, the voltammetric responses analysis with the variations of the voltammetric parameters allows the optimization of the best values to obtain sensitivity and selectivity in the proposed procedures [23,38].
Considering the signals shown in Figure 2, it can be observed that a proportional increase in the Ip values until 100 s−1 occurred and a dislodgment in the Ep values to a less negative direction. This behavior indicates lower energy associated with electron transfer at a higher scan rate or higher frequencies, typical of fast redox reactions [23].
Furthermore, a linear relationship between the Ip and the f square root for AM and SI can be observed, as presented in the inserts of each voltammogram. Demonstrating a voltammetric profile typical of the redox reaction with electrodic kinetics controlled by the AM and SI diffusion rates from the bulk solution to the DAE interface. Additionally, these linear relationships can indicate redox reactions involving reactant adsorption, where the -SCH3 group from the AM structure was probably adsorbed onto the DAE surface due to the interaction mainly with the silver present in the DAE’s composition.
The relationship between f and Ip values of AT presented a linear dependence, typical of redox reactions where the kinetics are controlled by the reactant adsorption process, followed by product adsorption, confirming the intense voltammetric peak enlargement. These conclusions originated from considerations of the theoretical model proposed by Lovric et al. for SWV experiments, and from previous studies published on triazine-based pesticide analysis using HMDE [8,13,22,23].
Furthermore, as shown in Figure 2, the increase in the f values promoted a shift towards less negative values in the Ep, which varied linearly with the logarithmic value of the frequency according to the following expression, known as Lovric’s Equation [27]:
Δ E p Δ log f = 2.3 RT α nF
where R is the gas constant; T is the temperature; α is the electron transfer coefficient; n is the number of electrons; and F is the Faraday constant. From Equation (2), a plot of ΔEp vs. Δlog (f) yielded a straight line curve defined by Equations (3)–(5) for AM, AT, and SI, respectively:
E p = 1.13 + 0.046 log f
E p = 1.05 + 0.042 log f
E p = 1.06 + 0.038 log f
According to these equations, the slopes of the experimental curves were 46 mV, 42 mV, and 38 mV, for AM, AT, and SI, respectively. Considering α = 0.75, the typical value to fast redox reactions, and substituting the known values of R, F, and T (room temperature), n was determined to equal 2 for all three triazines, following a probable mechanism presented in Figure 3. Electrochemical mechanisms for AM and AT have largely been discussed in previously published studies in which HMDEs and CuSAEs were used as working electrodes [8,22,37].
Thus, the results obtained in this research allied to those of the abovementioned studies, and it can be ascertained that the most probable mechanism for the reduction of AM involves the reduction of bond of carbon–SCH3, and AT is related to the reduction of the carbon–chloride bond. On the other hand, the redox mechanism of SI was not explored. Still, based on the analysis of the chemical structure and the results presented in this research, we can suppose that an AT-like mechanism occurred in which a two-electron reduction of the triazine ring yielded an unstable intermediate that was stabilized by the release of an HCl molecule, as shown in Figure 3. Finally, 100 s−1 was selected as the f parameter for subsequent experiments in all triazine analyses.
Finally, the other two parameters employed in SWV, a and ΔEs, were individually evaluated. SWV signals performed for values from 5 to 50 mV showed that an increase in a value promoted a linear increase in Ip for all three triazines. Furthermore, considering the Ep values, it was observed that using 50 mV of a parameter led to the best separation of peak potentials and that the ΔEp1/2 values remained practically constant. Thus, a 50 mV value was a suitable parameter to obtain sensitivity and selectivity in the proposed procedure.
For all of the triazines, an increase in ΔEs values promoted a decrease in the analytical signals, accompanied by a considerable reduction in the voltammograms’ resolutions, probably due to a point number reduction collected in the voltammograms’ construction by the use of the NOVA 2.1.2 software, as described in the Experimental Section. For this, −2 mV was selected as a suitable scan increment for the posterior experiments.

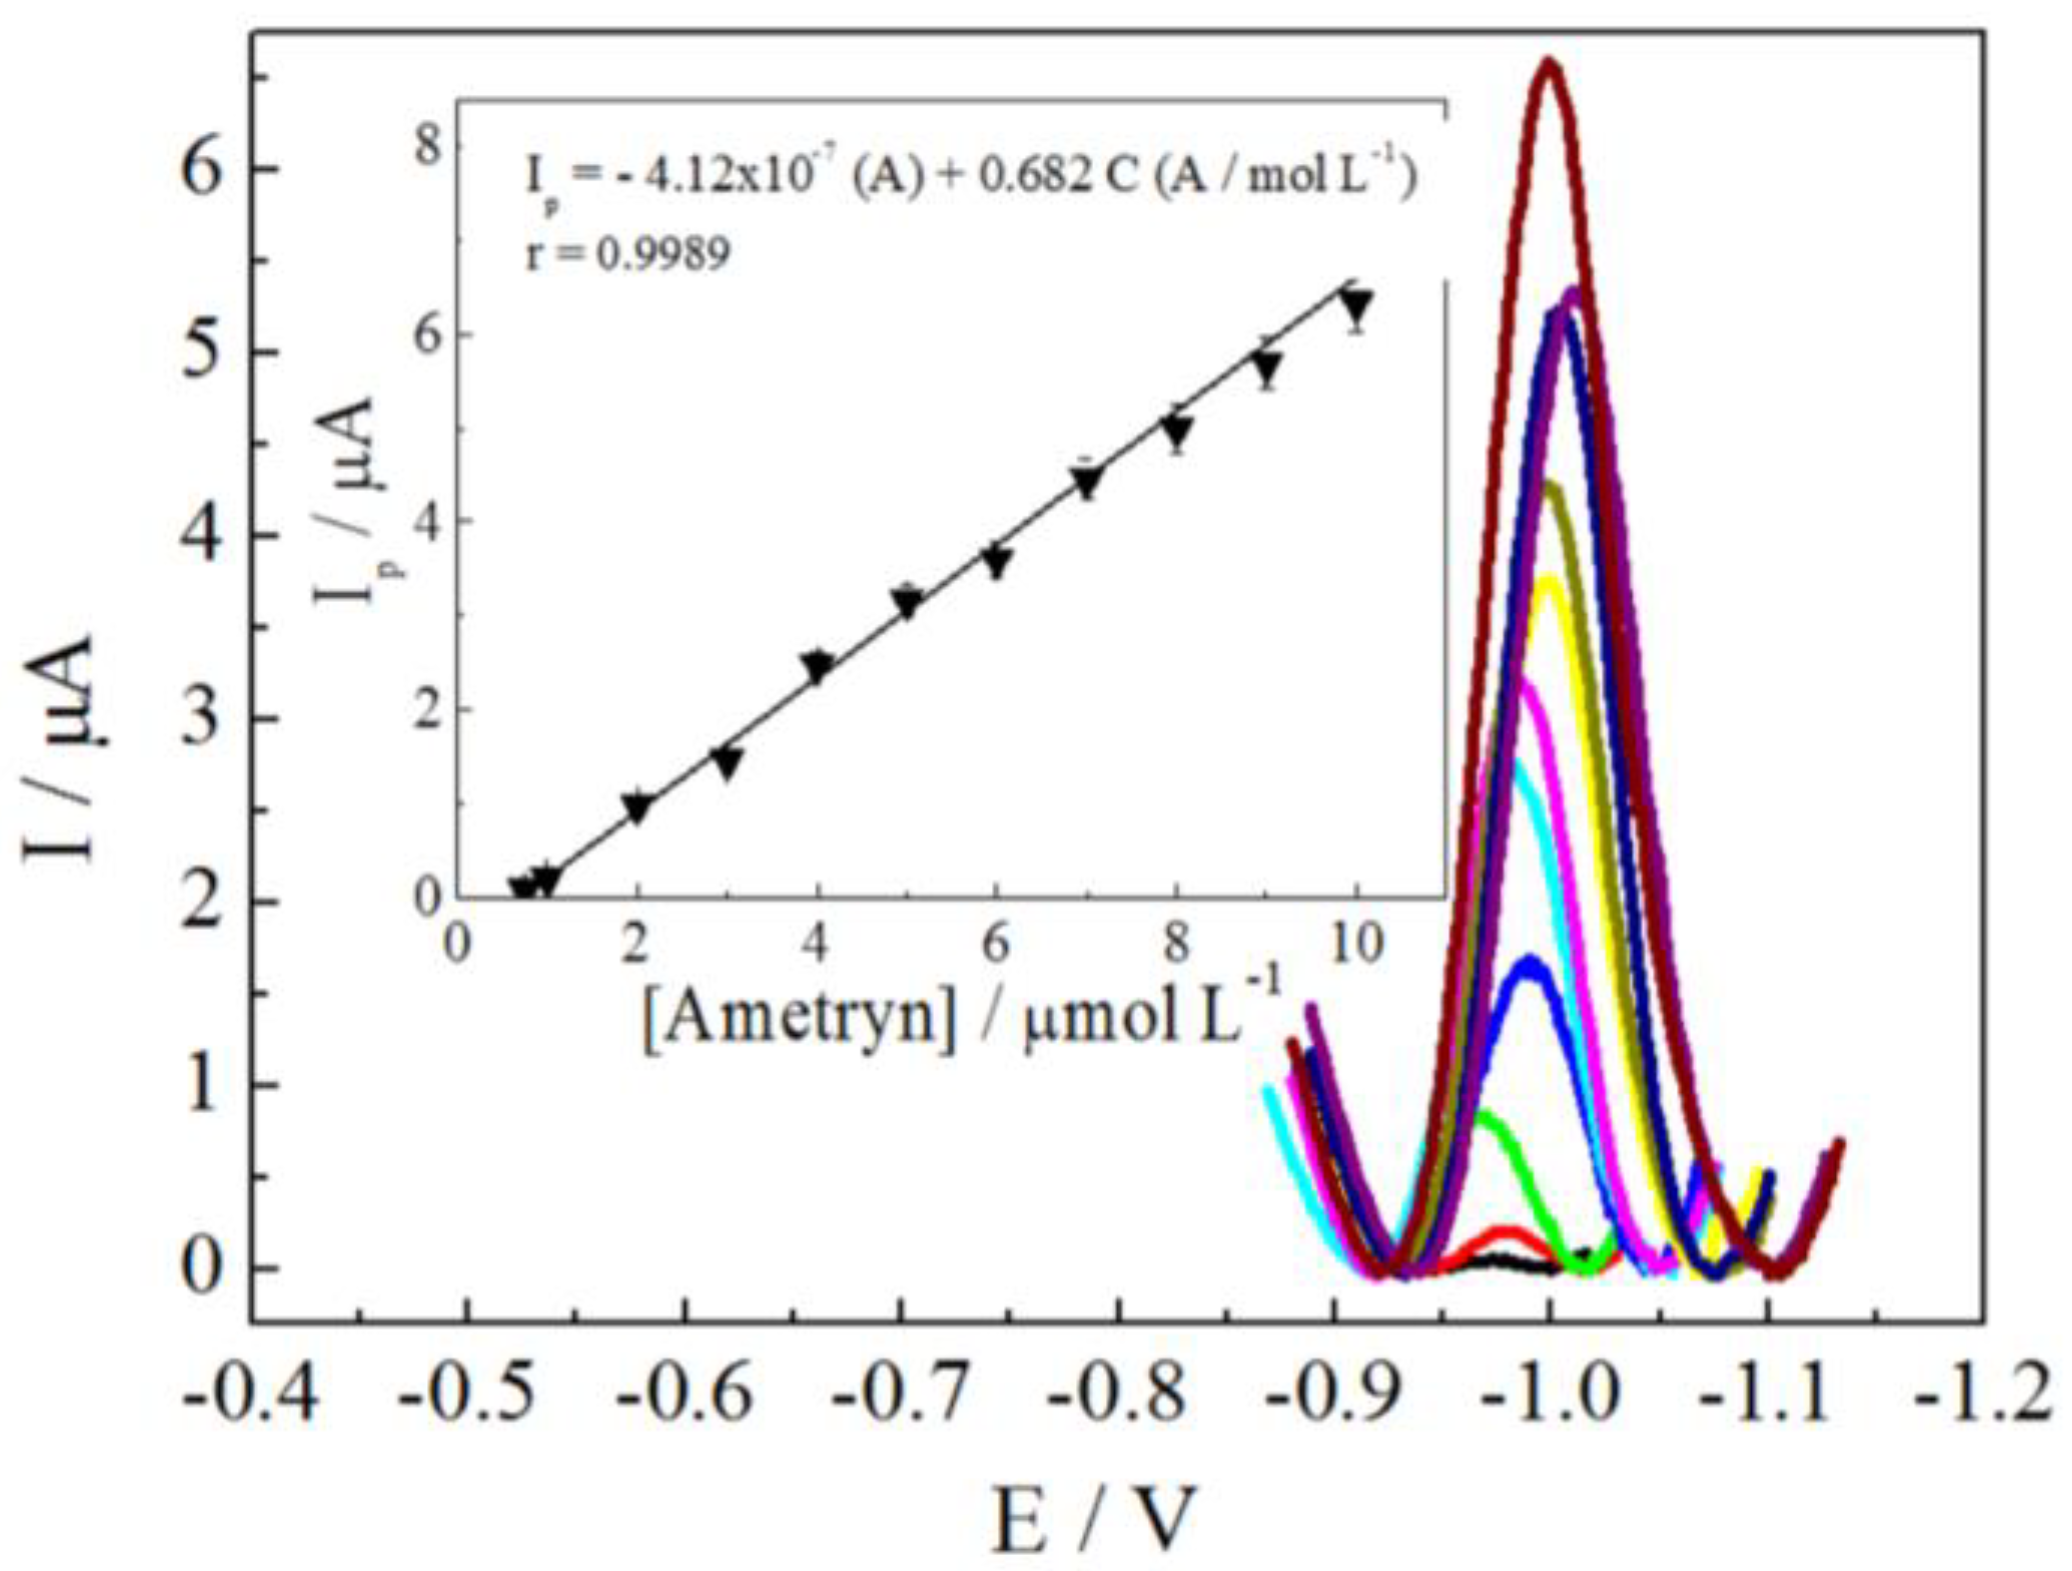
3.4. Analytical Parameters

The experimental (BR buffer, pH 2.5) and voltammetric (f = 100 s−1, a = 50 mV, and ΔEs = −2.0 mV) conditions were used in the construction of analytical curves for AM, AT, and SI using the DAE, considering a concentration range from 7.50 × 10⁻⁷ mol L−1 to 1.00 × 10⁻⁵ mol L−1. Figure 4 shows the SWV plus the average of the three analytical curves obtained for AM, where a linear increase in the voltammetric signals can be observed following an increase in the concentration added in the electrochemical cell, as observed in the AT and SI data. Furthermore, no significant alterations in the Ep and ΔEp1/2 values were observed with the increase in the concentration for all of the triazines.
The average curves and the linear adjustments are represented by Equations (6)–(8), considering AM, AT, and SI, respectively:
I p A = 4.12 × 10 7 ± 4.51 × 10 8 A + 0.680 ± 0.0197   C A M A   L / mol
I p A = 3.62 × 10 7 ± 3.43 × 10 8 A + 0.658   ± 0.0443   C A T A   L / mol
I p A = 3.19 × 10 7 ± 1.01 × 10 8 A + 0.503 ± 0.0418   C S I A   L / mol
For each analytical curve equation, the confidence interval (CI) for interception and slope was calculated according to the following:
CI = value ± t   s / n  
where value is the medium value of the interception or slope, t is the tabulated t value considering an assurance level of 99%, n is the number of determinations, and s is the standard deviation of the intercept or slope values. These calculations were performed, and the values are presented in Equations (6)–(8), for AM, AT, and SI, respectively. The CI values calculated correspond to 10.9%, 9.46%, and 3.17% variations considering the intercepts of the analytical curves for AM, AT, and SI, respectively. The slope variations calculated correspond to 2.89%, 6.73%, and 8.31% for AM, AT, and SI, respectively.
Furthermore, the averages of the three analytical curves for AM, AT, and SI presented a different intercept than zero, and the AM and SI presented a negative intercept. In this way, t-tests for significance were performed to determine if the difference between the intercepts obtained in these analytical curves and the standard values originating from random error were significant [39]. These calculations were performed according to the following:
t = x ¯ μ n s
where   x ¯ is the average from intercept values obtained, µ is the standard value expected when the intercept is zero, n is the determination number, s is the standard deviation of the current responses, and the other symbols are similar to those used in the CI calculations. The calculated │t│ values were 9.02, 9.71, and 3.13 for AM, AT, and SI, respectively. They were lower than the critical value (tcritical = 9.92) at an assurance level of 99%, indicating that no considerable differences occurred between the medium value calculated and the theoretical value, and that the intercept values were free of random errors.
Evaluations of the linearity of the analytical curves showed correlation coefficient (r) values of 0.9989, 0.9952, and 0.9963 for AM, AT, and SI, respectively, indicating good linearity evidence (r > 0.99) [40].
The LOD and LOQ values of the proposed procedure were calculated, as described in the Experimental Section, where the LOD values obtained were 1.20 × 10⁻⁷ mol L−1 (27.3 µg L−1), 1.24 × 10⁻⁷ mol L−1 (26.8 µg L−1), and 1.62 × 10⁻⁷ mol L−1 (32.8 µg L−1) for AM, AT, and SI, respectively. On the other hand, the LOQ calculated values were 3.64 × 10⁻⁷ mol L−1 (82.7 µg L−1), 3.76 × 10⁻⁷ mol L−1 (81.1 µg L−1), and 4.92 × 10⁻⁷ mol L−1 (99.2 µg L−1) for AM, AT, and SI, respectively.
These results presented values that were around one magnitude order higher than values previously published using HMDEs or enzyme-modified electrodes, which produce toxic waste or present irreversible inhibition of enzymes and high costs, respectively. However, the proposed procedure in this research enables the detection of triazines in natural water samples, where the maximum value allowed by the CONAMA (the National Council for the Environment—Brazil) for natural waters is 100 µg L−1, for any triazine-based pesticide [7]. In addition, the LOD and LOQ values calculated in this research were compared with those previously obtained using high-performance liquid chromatographic techniques [39,41,42] that employed sample preparation steps, resulting in increased costs and time for the analyses.
The precision of the proposed procedure was evaluated through experiments of repeatability and reproducibility, as described in the Experimental Section. The experiments were performed in an electrochemical cell containing 2.00 × 10⁻⁷ mol L−1 of AM, AT, and SI, separately, and used the previously optimized SWV parameters. The reproducibility was evaluated from experiments realized on various days (interday precision) and calculating the RSD values, which resulted in 2.58%, 4.24%, and 4.75% for AM, AT, and SI, respectively. The repeatability experiments of the three triazines were carried out simultaneously and in the same solution (intraday precision), and obtained RSD values of 2.13%, 3.56%, and 2.62% for AM, AT, and SI, respectively. Thus, these RSD values indicate good precision of the proposed procedure [40].
The accuracy was assessed using recovery curve measurements, performed by spiking a known concentration of each triazine (2.00 × 10⁻⁶ mol L−1, where [triazine]added). Thus, they were individually added to the electrochemical cell, followed by the standard addition method in the pure supporting electrolyte in which the voltammetric signals were evaluated [40]. Finally, the recovery percentages were used to evaluate and quantify the added triazines. In this way, the recovery concentrations ([triazine]recovered) were identified graphically, with the abscissa axis denoting the concentration of each triazine in the electrochemical cell. Extrapolating the curve along this axis yielded the artificially spiked concentration, allowing for the calculation of the recovery values (%R), as shown in Equation (11):
% R = triazine recovered triazine added x 100
The recovery curves were obtained in triplicate, and the average %R values obtained were 100.5%, 100.2%, and 99.6% for AM, AT, and SI, respectively. These results presented values that were in a suitable range for analytical applications, which are acceptable values from 80 to 120% for recovery percentages [32], indicating that the proposed procedure can be successfully applied in the analytical determination of AM, AT, and SI, with good accuracy in the analytical results.
Finally, all of the analytical results obtained and discussed above are presented in Table 2, with all merit figures for the analytical determination of AM, AT, and SI employing a DAE allied to SWV. Thus, these data verify that the proposed methodology provides a suitable alternative method for the electrochemical determination of triazines with no waste generation, and uses an environmentally friendly sensor compared with the traditional mercury electrodes; moreover, this method eliminates the need for high-cost instrumentation with pre-treatments of the samples that are typically used by high-performance liquid chromatography.

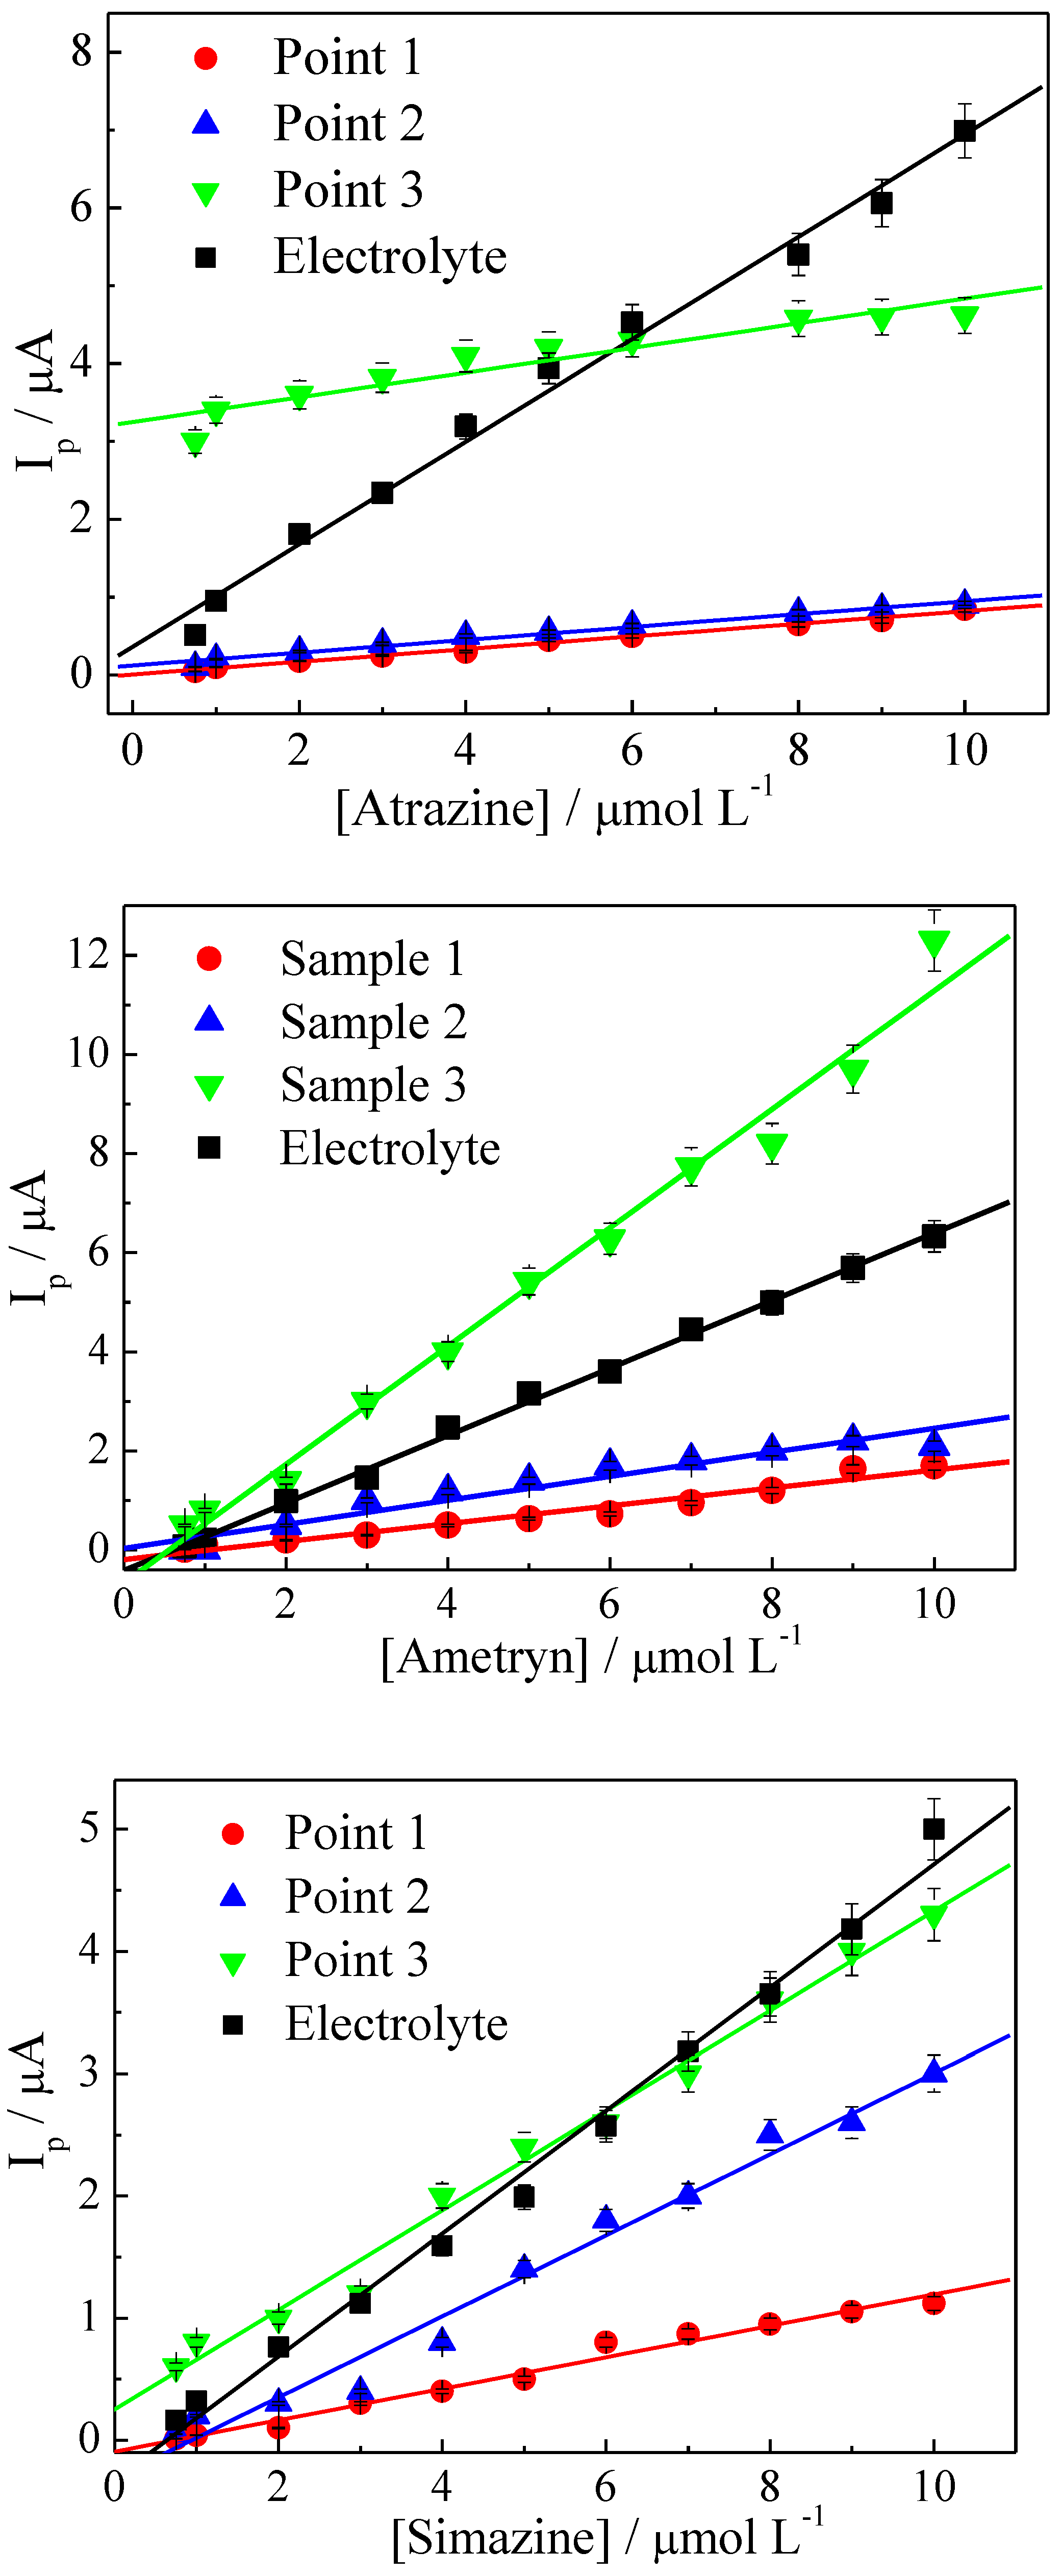
3.5. Analytical Applications

The Alto Paranaíba region, Minas Gerais states, Brazil, has intensively employed triazine-based pesticides in its agricultural practices, similarly to other Brazilian regions and other countries. For this, the procedure presented above was applied to analyze natural water samples collected from three points of the Paranaíba river, as described in the Experimental Section. These samples were characterized by BOD analyses, which indicated the presence of 10.8 mg L−1, 11.6 mg L−1, and 15.4 mg L−1, of total organic compounds, considering sample 1, sample 2, and sample 3, respectively. These levels are directly related to different levels of organic matter, including wastes from agricultural, industrial, and urban activities.
All of the water samples were used as received, with only a simple filtration to remove solid particles. Then, 1.0 mL of each sample was added to an electrochemical cell containing 9.0 mL of BR buffer at pH 2.5, and SWV experiments on the DAE were conducted to obtain the analytical curves. In this way, the influences of the sample chemical compositions were evaluated. The analytical curves obtained under these new experimental conditions are presented in Figure 5, considering all of the triazines. These experiments were performed only to evaluate the components samples’ interferences in the analytical signals. According to the plots, it can be considered that the samples did not contain any triazine. In this way, the efficiency of the proposed procedure was observed in complex samples, which were characterized by different BOD values.
Considering the curves of Figure 5, it can be observed that the increase in the BOD values promoted a similar increase in the slopes of the analytical curves. Moreover, the composition of the water samples probably influenced the diffusion coefficients or the redox reaction rate of triazines under the DAE in the optimized parameters employed. However, in sample 3, a considerable increase in the slope of the analytical curve occurred, probably due to the elevated BOD values (15.4 mg L−1) and the presence of another organic compound with the same triazine potential for reduction.
Additionally, the AM and SI redox reactions were controlled by the diffusion rate of electroactive species from bulk solutions to interface electrodes. The component sample effects in the analytical signals were lower than the effects in the AT responses, which involved the reactants’ adsorption processes as determining steps in the redox reactions. The results of the linear regression from the straight lines presented in Figure 5 are shown in Table 3, jointly with the DL and QL values calculated for each sample and each triazine.
All of the data presented in Table 3 were obtained without pre-treatment steps to remove interferent compounds in each sample. They were only filtrated and diluted to represent each real composition of each sample, with all matrix interferents added in the voltammetry responses. The calculated values of the LOD and LOQ represent the matrix interference effects that promoted alterations in the analytical responses according to BOD values measured for each sample. Even so, these results indicate that the proposed procedure enables the detection of AM, AT, and SI in natural water samples with a concentration range interval and linearity that are around or below the maximum levels permitted by specific legislation [7].
Recovery experiments were also performed to evaluate the interference of organic and inorganic components in natural water samples. The samples were artificially spiked with 2.00 × 10⁻⁶ mol L−1 of each triazine, with individual experiments performed using the proposed procedure and the standard addition method. The recovery data for all three triazines presented values that were similar to those obtained in the pure electrolyte, as shown in Table 4. Thus, the components of the samples practically did not interfere with the voltammetric signals, being suitable for the electroanalytical determination of triazine-based pesticides in natural waters.

4. Conclusions

The novelty of the proposed methodology is rooted in the use of a DAE as a voltammetric sensor for triazines-based pesticides detection in natural waters, without any pre-treatment or extraction procedure, without the use of chemically modified surfaces, and without the use of mercury as a voltammetric sensor.
The DAE was constructed in a manner similar to that used by dental clinics for at least 20 years, which resulted in a surface with compact and globular crystals. Physical characterization indicated the chemical composition and the morphology, which confirmed the quantities of each component and the predominance of Ag2Hg3 and Ag3Hg2 phases, without mercury or silver, evidencing the production of an environmentally friendly sensor.
The experimental (supporting electrolyte and pH of the medium) plus the voltammetric (f, a, and ΔEs) parameters were optimized to obtain the best voltammetric responses, considering sensitivity and selectivity. Using BR buffer at pH 2.5, with f = 100 s−1, a = 50 mV, and ΔEs = −2 mV, resulted in single and well-defined irreversible redox voltammetric peaks related to the two-electron transfer. For AM, these electrons corresponded to a reduction of the carbon–SCH3 bond; AT and SI were associated with the reduction of the triazinic ring, yielding an unstable intermediate that was stabilized by the release of an HCl molecule, as previously observed, through the use of traditional mercury or copper solid amalgam electrodes.
Analytical parameters (e.g., linear concentration range, correlation coefficient, the slope of the analytical curve, confidence interval, detection and quantification limits, relative standard deviation, and recovery percentages) were calculated in a pure electrolyte, allowing suitable sensitivity and selectivity associated with an elevated level of repeatability and reproducibility. Additionally, the analytical data obtained using the DAE presented values that were similar to those previously published using copper solid amalgam electrodes. However, the DAE preparation was simplified due to the mechanical amalgamation that allowed for the control of electrode composition and the yield of a very reproducible surface. Hence, the proposed procedure was successfully applied to determine AM, AT, and SI levels in spiked natural water, which represented different degrees of pollution from agricultural, urban, and industrial activities on the basis of BOD.

Author Contributions

Conceptualization, F.C.O.L.M. and D.D.S.; methodology, F.C.O.L.M. and D.D.S.; software, F.C.O.L.M. and D.D.S.; validation, F.C.O.L.M. and D.D.S.; formal analysis, F.C.O.L.M. and D.D.S.; investigation, F.C.O.L.M. and D.D.S.; resources, D.D.S.; data curation, D.D.S.; writing—original draft preparation, F.C.O.L.M. and D.D.S.; writing—review and editing, D.D.S.; visualization, F.C.O.L.M. and D.D.S.; supervision, D.D.S.; project administration, D.D.S.; funding acquisition, D.D.S. All authors have read and agreed to the published version of the manuscript.

Funding

This research was funded by the Minas Gerais State Research Support Foundation (FAPEMIG), process APQ-01878-22.

Data Availability Statement

Not applicable.

Conflicts of Interest

The authors declare no conflict of interest.

References

  1. LeBarom, H.; McFarland, J.; Burvide, O. (Eds.) The Triazine Herbicides 50 Years Revolutionizing Agriculture, 1st ed.; Elsevier: Amsterdam, The Netherlands, 2008. [Google Scholar]
  2. Hornsboy, A.G.; Wauchope, R.D.; Herner, A.E. (Eds.) Pesticide Properties in the Environment; Springer: New York, NY, USA, 1996. [Google Scholar]
  3. ANVISA. Regularização de Produtos—Agrotóxicos. Available online: http://portal.anvisa.gov.br/registros-e-autorizacoes/agrotoxicos/produtos/monografia-de-agrotoxicos/autorizadas (accessed on 19 June 2019).
  4. Reserved, A.R. Hayes Handbook of Pesticide Toxicology, 3rd ed.; Elsevier: Amsterdam, The Netherlands, 2011. [Google Scholar]
  5. FDA. Pesticide Analytical Manual Volume I (PAM) 3rd Edition. Available online: https://www.fda.gov/food/laboratory-methods-food-safety/pesticide-analytical-manual-volume-i-pam-3rd-edition (accessed on 20 January 2021).
  6. EU Commission. EU Pesticides Database. Available online: http://ec.europa.eu/food/plant/pesticides/eu-pesticides-database/public/?event=activesubstance.detail&language=EN&selectedID=972 (accessed on 20 January 2021).
  7. CONAMA. RESOLUÇÃO No 357, DE 17 DE MARÇO DE 2005. DOU. 2005. Available online: http://www2.mma.gov.br/port/conama/res/res05/res35705.pdf (accessed on 19 January 2021).
  8. Garbellini, G.S.; Pedrosa, V.A.; Salazar-Banda, G.R.; Avaca, L.A. Electroanalytical methodologies for the determination of triazine herbicides by square wave voltammetry and deconvolution techniques. Quim. Nova 2007, 30, 2025–2030. [Google Scholar] [CrossRef]
  9. Zhou, T.; Ding, J.; Ni, L.; Yu, J.; Li, H.; Ding, H.; Chen, Y.; Ding, L. Preparation of magnetic superhydrophilic molecularly imprinted resins for detection of triazines in aqueous samples. J. Chromatogr. A 2017, 1497, 38–46. [Google Scholar] [CrossRef] [PubMed]
  10. Islam, K.; Kumar, S.; Chand, R.; Han, D.; Kim, Y. Fast detection of triazine herbicides on a microfluidic chip using capillary electrophoresis pulse amperometric detection. Microelectron. Eng. 2012, 97, 391–395. [Google Scholar] [CrossRef]
  11. Yang, Q.; Chen, B.; He, M.; Hu, B. Sensitive determination of seven triazine herbicide in honey, tomato and environmental water samples by hollow fiber based liquid-liquid-liquid microextraction combined with sweeping micellar electrokinetic capillary chromatography. Talanta 2018, 186, 88–96. [Google Scholar] [CrossRef] [PubMed]
  12. Supraja, P.; Tripathy, S.; Vanjaria, S.R.K.; Singh, V.; Singhb, S.G. Electrospun tin (IV) oxide nanofiber based electrochemical sensor for ultrasensitive and selective detection of atrazine in water. Biosens. Bioelectron 2019, 141, 111441. [Google Scholar] [CrossRef] [PubMed]
  13. De Souza, D.; De Toledo, R.A.; Mazo, L.H.; Avaca, L.A.; Machado, S.A.S. Determination of triazine herbicides: Development of an electroanalytical method utilizing a solid amalgam electrode that minimizes toxic waste residues, and a comparative study between voltammetric and chromatographic technique. Anal. Bioanal. Chem. 2007, 387, 2245–2255. [Google Scholar] [CrossRef]
  14. Wang, J. Stripping Analysis: Principles, Instrumentation, and Applications, 1st ed.; VCH Publishers Inc.: New York, NY, USA, 1985. [Google Scholar]
  15. Jiang, Y.; Qinb, Z.; Liang, F.; Li, J.; Sun, Y.; Wang, X.; Ma, P.; Song, D. Vortex-assisted solid-phase extraction based on metal-organic framework/chitosan-functionalized hydrophilic sponge column for determination of triazine herbicides in environmental water by liquid chromatography-tandem mass spectrometry. J. Chrom. A 2021, 1638, 461887. [Google Scholar] [CrossRef]
  16. Lei, Y.; Chen, B.; You, L.; He, M.; Hu, B. Polydimethylsiloxane/MIL-100(Fe) coated stir bar sorptive extraction-high performance liquid chromatography for the determination of triazines in environmental water samples. Talanta 2017, 175, 158–167. [Google Scholar] [CrossRef]
  17. Rodríguez-González, N.; Beceiro-González, E.; González-Castroa, M.J.; Alpendurada, M.F. On-line solid-phase extraction method for determination of triazine herbicides and degradation products in seawater by ultra-pressure liquid chromatography–tandem mass spectrometry. J. Chrom. A 2016, 1470, 33–41. [Google Scholar] [CrossRef]
  18. Qing-Xiang Zhou, Q.X.; Gao, Y.Y. Combination of ionic liquid dispersive liquid-phase microextraction and high performance liquid chromatography for the determination of triazine herbicides in water samples. Chin. Chem. Lett. 2014, 25, 745–749. [Google Scholar] [CrossRef]
  19. Roldán-Pijuán, M.; Lucena, R.; Cárdenas, S.; Valcárcel, M.; Kabir, A.; Furton, K.G. Stir fabric phase sorptive extraction for the determination of triazine herbicides in environmental waters by liquid chromatography. J. Chrom. A 2015, 1376, 35–45. [Google Scholar] [CrossRef] [PubMed]
  20. Svorc, L.; Rievaj, M.; Bustin, D. Green electrochemical sensor for environmental monitoring of pesticides: Determination of atrazine in river waters using a boron-doped diamond electrode. Sens. Act. B Chem. 2013, 181, 294–300. [Google Scholar] [CrossRef]
  21. Zhang, J.; Wang, C.; Niu, Y.; Li, S.; Luo, R. Electrochemical sensor based on molecularly imprinted composite membrane of poly(o-aminothiophenol) with gold nanoparticles for sensitive determination of herbicide simazine in environmental samples. Sens. Act. B Chem. 2017, 249, 747–755. [Google Scholar] [CrossRef]
  22. De Souza, D.; De Toledo, R.A.; Suffredini, H.B.; Mazo, L.H.; Machado, A.S. Characterization and Use of Copper Solid Amalgam Electrode for Electroanalytical Determination of Triazines-Based Herbicides. Electroanalysis 2006, 18, 605–612. [Google Scholar] [CrossRef]
  23. Mirceski, V.; Komorsky-Lovric, S.; Lovric, M. Square-Ware Voltammetry Theory and Application, 1st ed.; Springer: Berlin/Heidelberg, Germany, 2007. [Google Scholar]
  24. Gonçalves-Filho, D.; Silva, C.G.; De Souza, D. Pesticides determination in foods and natural waters using solid amalgam-based electrodes: Challenges and trends. Talanta 2020, 212, 120756. [Google Scholar] [CrossRef]
  25. Yosypchuk, B.; Barek, J. Analytical Applications of Solid and Paste Amalgam Electrodes. Crit. Rev. Anal. Chem. 2009, 39, 189–203. [Google Scholar] [CrossRef]
  26. Yosypchuk, B.; Novotný, L. Nontoxic Electrodes of Solid Amalgams. Crit. Rev. Anal. Chem. 2002, 32, 141–151. [Google Scholar] [CrossRef]
  27. De Souza, D.; Melo, L.C.; Correia, A.N.; De Lima-Neto, P.; Fatibello-Filho, O.; Mascaro, L.H. Utilização de eletrodos sólidos de amálgama para a determinação analítica de compostos orgânicos e inorganicos. Quim. Nova 2011, 34, 487–496. [Google Scholar] [CrossRef]
  28. Melo, L.C.; Salazar-Banda, G.R.; Machado, S.A.S.; Lima-Neto, P.; De Souza, D.; Correia, A.N. A simple and sensitive detection of diquat herbicide using a dental amalgam electrode A comparison using the chromatographic technique. Talanta 2009, 79, 1216–1222. [Google Scholar] [CrossRef]
  29. Mikkelsen, Ø.; Schrøder, K.H. Amalgam Electrode for Electroanalysis. Electroanalytical 2003, 15, 679–687. [Google Scholar] [CrossRef]
  30. Cryosystems, O. Crystallographica. Available online: https://connect.oxcryo.com/software/cglegacy/ (accessed on 1 January 2019).
  31. Mocak, J.; Bond, A.M.; Mitchell, S.; Scollary, G. International Union of Pure and Applied Chemistry Analytical Chemistry Division Commission on Electroanalytical Chemistry a Statistical Overview of Standard (Iupac and Acs) and New Procedures for Determining the Limits of Detection and Quantification: Ap. Pure Appl. Chern 1997, 69, 297–328. [Google Scholar] [CrossRef]
  32. Committee, A.M. Recommendations for the Definition, Estimation and Use of the Detection Limit. Analyst 1987, 112, 199–204. [Google Scholar]
  33. APHA. Standard Methods for examination of water and wastewater. An. Hidrol. Médica 2012, 21, 183–190. [Google Scholar]
  34. de la Guardia, M.; Garrigues, S. Handbook of Green Analytical Chemistry; John Wiley & Sons: New York, NY, USA, 2012. [Google Scholar]
  35. Grimshaw, J. Electrochemical Reactions and Mechanisms in Organic Chemistry, 1st ed.; Elsevier: Hoboken, NJ, USA, 2000. [Google Scholar]
  36. Compton, R.G.; Banks, C.E. Understanding Voltammetry, 3rd ed.; World Scientific Publishing Europe: London, UK, 2018. [Google Scholar]
  37. Fry, A.J. Synthetic Organic Electrochemistry, 2nd ed.; John Wiley & Sons: New York, NY, USA, 1989. [Google Scholar]
  38. Scholz, F. (Ed.) Electroanalytical Methods: Guide to Experiments and Applications, 2nd ed.; Springer: New York, NY, USA, 2010. [Google Scholar]
  39. Miller, J.N.; Miller, J.C. Statistics and Chemometrics for Analytical Chemistry, 6th ed.; Pearson: New York, NY, USA, 2010; Volume 46. [Google Scholar]
  40. Christian, G.D.; Dasgupta, P.K.; Schug, K.A. Analytical Chemistry, 7th ed.; Wiley: New York, NY, USA, 2014. [Google Scholar]
  41. Rodríguez-González, N.; González-Castro, M.J.; Beceiro-González, E.; Muniategui-Lorenzo, S. Development of a matrix solid phase dispersion methodology for the determination of triazine herbicides in marine sediments. Microchem. J. 2017, 133, 137–143. [Google Scholar] [CrossRef]
  42. Khana, S.; Hussain, S.; Wong, A.; Foguel, M.V.; Gonçalves, L.M.; Gurgoe, M.I.P.; Sotomayor, M.P.T. Synthesis and characterization of magnetic-molecularly imprinted polymersfor the HPLC-UV analysis of ametryn. React. Funct. Polym. 2018, 122, 175–182. [Google Scholar] [CrossRef] [Green Version]
Figure 1. Square wave voltammograms of 1.00 × 10⁻⁵ mol L−1 of AM, AT, and SI on the DAE using BR buffer with different pH values and a = 50 mV, ∆Es = −2 mV, and f = 100 s−1. Their respective chemical structures are shown as an insert on the left side. The relationships between Ip and Ep with pH values are shown on the right side. (a,b) are data from AT, (c,d) are data from AM, and (e,f) are data from SI.
Analytica 04 00008 g001
Figure 2. Square wave voltammograms of the 1.00 × 10⁻⁵ mol L−1 of AM, AT, and SI on the DAE using BR buffer at pH 2.5 with a = 50 mV, ∆Es = −2 mV, and different values of f for AM from 10 to 200 s−1, and AT and SI from 10 to 125 s−1. Inserts show the relationships between Ip and f and f 1/2 values for each triazine.
Analytica 04 00008 g002aAnalytica 04 00008 g002b
Figure 3. Possible mechanisms for electrochemical reduction reactions of AM, AT, and SI under the DAE.
Analytica 04 00008 g003
Figure 4. Square wave voltammograms of AM on the DAE using BR buffer at pH 2.5 with f = 100 s−1, a = 50 mV, and ∆Es = −2 mV, in a concentration range from 7.50 × 10⁻⁷ mol L−1 to 1.00 × 10⁻⁵ mol L−1. The insert corresponds to the mean of the analytical curves obtained.
Analytica 04 00008 g004
Figure 5. Analytical curves were obtained for AM, AT, and SI in the range from 7.50 × 10⁻⁷ mol L−1 to 1.00 × 10⁻⁵ mol L−1 in BR buffer at pH 2.5 and three water samples (sample 1, sample 2, and sample 3), and using the DAE allied to SWV with f = 100 s−1, a = 50 mV, and ∆Es = −2 mV.
Analytica 04 00008 g005
Table 1. Chromatographic and electroanalytical techniques previously used in triazines analyses.
AnalytesMethodSamplesLOD (µg L−1)PrecisionRecovery (%)Ref.
TriazinesHPLC-MS/MSDrinking, tap, and environmental
water
0.014–0.0450.4–14.578.9−118.6[15]
TriazinesHPLC-UVEnvironmental water, East Lake water, and local pond water samples0.021–0.0792.3–6.394.0–118[16]
Triazines and degradation productsUHPLC-MS/MSSeawater0.008–0.2170.0–3.980.3–99.8[17]
TriazinesHPLC-UVWater0.05–0.063.2–8.985.1–100[18]
TriazinesUHPLC-DADWater0.08–0.471.4–11.875–126[19]
AtrazineSWV coupled with BDDERiver water2.152.992–100[20]
SimazineCV coupled to MIP/ATP@AuNPs/ATP/Au electrodeSoil, and tap and river water2.623.191–97[21]
Atrazine and ametrynSWV coupled with CuSAENatural water3.023.4–3.993–94[22]
HPLC = high-performance liquid chromatography; UHPLC = ultra-high performance liquid chromatography; MS/MS = tandem mass spectrometry; UV = ultraviolet–visible spectroscopy; DAD = diode-array detection; SWV = square wave voltammetry; BDDE = boron-doped diamond electrode; CuSAE = copper solid amalgam electrode; CV = cyclic voltammetric.
Table 2. Analytical parameters for the determination of triazines on a DAE using a pure electrolyte, where LR is the linearity range, r is the correlation coefficient, the slope is the sensitivity, CI is the confidence interval, Sb is the blank standard from the reduction potential values of triazines, and LOD and LOQ are the limits of detection and quantification, respectively.
ParameterAmetrynAtrazineSimazine
LR (µmol L−1)0.750–10.00.750–10.00.750–10.0
r0.99890.99520.9963
Intercept (A)−4.12 × 10−73.62 × 10−7−3.19 × 10⁻⁷
Slope (A/mol L−1)0.6800.6580.503
CI of intercept (A)±4.51 × 10⁻⁷±3.43 × 10⁻⁷±1.01 × 10⁻⁶
CI of slope (A/mol L−1)±0.197±0.443±0.418
Sb (A)2.47 × 10−82.47 × 10−82.47 × 10⁻⁸
LOD (mol L−1)1.20 × 10⁻⁷ (27.3 µg L−1)1.24 × 10⁻⁷ (26.8 µg L−1)1.62 × 10⁻⁷ (32.7 µg L−1)
LOQ (mol L−1)3.64 × 10⁻⁷ (82.7 µg L−1)3.76 × 10⁻⁷ (81.1 µg L−1)4.92 × 10⁻⁷ (99.2 µg L−1)
Error in repeatability (%)2.134.254.75
Error in reproducibility (%)2.583.562.62
Recovery (%)100.5100.299.6
Table 3. Analytical parameters for determining triazines in natural water samples using the DAE allied to SWV, where LR is the linearity range, r is the correlation coefficient, and DL and QL are detection and quantification limits, respectively.
SampleLR
(µmol L−1)
rSlope
(A/mol L−1)
DL
(µmol L−1)
Ametryn
10.7500–10.000.98240.18060.4522
(102.8 ppb)
20.7500–10.000.98240.18060.4522
(102.8 ppb)
30.7500–10.000.98240.18060.4522
(102.8 ppb)
Atrazine
10.7500–10.000.99590.081400.1003
(21.63 ppb)
20.7500–10.000.99000.082490.9901
(213.5 ppb)
30.7500–10.000.94740.15850.5153
(111.1 ppb)
Simazine
10.7500–10.000.99090.12880.6341
(127.9 ppb)
20.7500–10.000.99030.33160.2462
(49.65 ppb)
30.7500–10.000.99530.40780.2003
(40.39 ppb)
Table 4. Analytical parameters obtained in natural water samples for AT, AM, and SI detection using the DAE allied to SWV. The same parameter was evaluated in supporting electrolytes, and the data were evaluated using medium values from three recovery curves. The numbers 1, 2, and 3 correspond to each sample employed.
AmetrynAtrazineSimazine
123123123
Added
(µmol L−1)
2.0002.0002.0002.0002.0002.0002.0002.0002.000
Recovered (µmol L−1)2.117 ± 0.1302.196 ± 0.06271.952 ± 0.4412.188 ± 0.06162.132 ± 0.1932.044 ± 0.1201.786 ± 0.2322.060 ± 0.4042.197 ± 0.112
Recovery
(%)
1061109810910710289103110
Disclaimer/Publisher’s Note: The statements, opinions and data contained in all publications are solely those of the individual author(s) and contributor(s) and not of MDPI and/or the editor(s). MDPI and/or the editor(s) disclaim responsibility for any injury to people or property resulting from any ideas, methods, instructions or products referred to in the content.

