Review

Advances in Simple and Chiral-HPLC Methods for Antiallergic Drugs and Chiral Recognition Mechanism

1
Department of Chemistry, Jamia Millia Islamia, New Delhi 110025, India
2
Jubilant Biosys Limited, Knowledge Park-II, Greater Noida 201310, India
3
Division of Chemistry, School of Basic and Applied Sciences, Galgotias University, Greater Noida 201310, India
4
Pharmaceutical and Medicinal Chemistry Department, National Research Centre, Dokki, Cairo 12311, Egypt
5
Department of Pharmacy, Analytical and Bioanalytical Chemistry, University “G. d’Annunzio” of Chieti-Pescara, Build B, Level 2, Via dei Vestini, 31, 66100 Chieti, Italy
*
Authors to whom correspondence should be addressed.
Analytica 2023, 4(1), 66-83; https://doi.org/10.3390/analytica4010007
Submission received: 21 January 2023 / Revised: 26 February 2023 / Accepted: 7 March 2023 / Published: 16 March 2023

Abstract

:
Among many diseases, allergy appears to be a serious problem for human beings. Various forms of allergic disorders make people tense, leading to some other health issues. Many medications, including nonracemic and racemic ones, are used to treat this problem. It is important to have exact analysis strategies just to see any medication side effects, plasma profiles, and working efficiency. Therefore, efforts are made to review simple and chiral HPLC methods for antiallergic drugs; HPLC is the best analytical technique. The highlights in this article include the world scenario, causes of allergy, the effect of allergy on the economy, the mechanism of allergy in humans, classes of antiallergic drugs, simple drugs, chiral drugs, analysis by HPLC, and the chiral recognition mechanism. Moreover, attempts are also made to highlight the management of allergies and future perspectives.

1. Introduction

Since ancient times, allergy has been of great concern globally [1]. Generally, allergy is not a serious disease but disturbs the peace of mind, work, and economy of a country [2]. Sometimes, allergies may be a life-threatening problem. For example, anaphylaxis involves a life-threatening hypersensitivity reaction. There are various types of allergies concerning different objects such as foods, seasons, pets, metals, aerosols, and much more. The food products showing allergies are milk, egg, wheat, fish, shellfish, peanut, sulfite, soy, casein, etc. The seasonal factors are spring, summer, fall, and winter allergies. The spring season is a good source of pollen production and ragweed pollen production [3]. The most common allergic pets are dogs and cats. Other sources of allergy are poison ivy, hives (urticaria), oak, sumac, dust, hay fever, chemicals, sun reactions of the skin, allergic conjunctivitis (pink eye), drugs, cosmetics, insect stings (bee stings), mold, pollen, nickel, etc. Symptoms are mild, such as itching, rhinitis, itchy red spots on the skin, rashes, and watery or itchy eyes, on first exposure to an allergic source. Contrarily, the symptoms may be worse on continuous exposure to the allergens. Severe symptoms include diarrhea, chest tightness, abdominal pain, difficulty in swallowing, dizziness, anxiety, facial blushing, vomiting, heart palpitations, bulging of the face/eyes/tongue, faintness, wheezing, breathing difficulty, and insentience [4].
The exact reason for allergy is not known so far, but some factors may be responsible, including mechanization, suburbanization, air contamination, climate variation, and the hygiene hypothesis [5,6]. Additionally, climate change is supposed to be responsible for spreading allergies, for instance, allergic conjunctivitis, anaphylaxis, asthma, and allergic rhinitis. It has been noted that there is a close relationship between climate change and allergy [7,8,9]. The effect of allergenic pollen on the development of allergies greatly relies upon annual volume duration and intensity of exposure, as well as the allergenicity of pollen. In general, tree pollen is the most abundant contributor to the greatest annual production of aeroallergens, followed by weeds and grasses [6]. On the other hand, air quality and food materials show some implications. Similarly, the increasing number of vehicles, power plants, and industries in cities upsurging CO2 levels in the environment is also a big factor [10]. Changes in temperature and weather global warming are also responsible for increasing allergies in humans such as fungal bacteria that cause allergies and asthmatic reactions [11].

2. World Scenario

A large number of populations in the world are struggling with different types of allergic disorders. About 50 million people in the United States are struggling with an allergy of some kind. According to the Centers for Disease Control and Prevention, USA, food allergies are reported in 4% of adults and 4–6% of children. The symptoms of food allergies are very public, particularly in babies and children [12]. About 16.4 and 7.0 million adults and children have been found to have asthma. It has been reported that about 3600 patients with asthma die every year [13].

2.1. Asia

A thorough search of the literature through PubMed using strategies such as “Food allergy and each Asian country, Food allergy and Asia” and “Food anaphylaxis and Asia” was published between 2005 and 2012. It was observed that in Asia, shellfish is supposed to be the most widely popular food allergen, due to the presence of a large quantity of seafood in this region. The symptoms differ commonly, from oral signs to a hypersensitivity reaction (anaphylaxis) for a similar individual. Moreover, house dust parasite tropomyosin might be a key sensitizer, as the data suggest. Additionally, the two most common food allergies found in Asian infants and young children are cow’s milk and egg hypersensitivity [14].

2.2. Europe

A combined study of allergy was included for infant to adult age groups. The overall estimates of a self-lifetime trend of reaction to cow’s milk are 6.0%, wheat 3.6%, egg 2.5%, peanut 1.3%, tree nuts 2.2%, shellfish 1.3%, and soy 0.4%, whereas the trend of food allergy to cow’s milk and tree nuts was a maximum of 0.6%, compared to 0.5% soy, 0.3% egg, 0.2% wheat, 0.1%, peanut, 0.2% fish, and 0.1% shellfish, respectively [15].

2.3. Australia

Unfavorably allergic diseases are the most widely recognized among the constantly developing conditions in Australia. These include drug, food, and insect reactions such as anaphylaxis, asthma, hay fever, and eczema. About 4.1 million people in Australia (19.6%) have been struggling with at least one type of allergic disorder [16]. In Australia, about 20% of the population is sensitive to allergy diseases, and this is continuously increasing. In the last few decades, the number of anaphylaxis patients has risen by 300% [17,18].
Allergy to food-prompted anaphylaxis has doubled in the last few years, and 10% of babies are affected by food allergies [19]. Moreover, 5% of adults might be oversensitive to drugs [20]. The lack of public consciousness about the impact of allergies on humans is a great concern. Overall, 18% of the population of Australia has allergic rhinitis, which reduces the quality and efficiency of human life. Because of the above facts, it may be predicted that by the end of 2050, the number of allergic patients in Australia will increase by 70% to 7.7 million [16,21].

2.4. America

The symptoms of hay fever are well known to others, such as puffy eyes, eye touchiness, runny and stuffy nose, sneezing, inflammation, and itchy nose and throat. A total of 18.0 million adults and 7.1 million people in the lower age group, especially children, struggle with hay fever allergies, and there are 13.1 million yearly doctor’s visits for allergies [22]. The total medical cost of allergic rhinitis each year is USD 11.2 billion [23]. In addition, around 4 million individuals missed or had low-efficiency workdays, and every year, around USD 700 million is lost from production because of hay fever responses [24,25].

3. Causes of Allergy

Although the exact reasons for occurring allergies are not known so far, human allergies may be due to pet dander, insect stings such as bees, certain types of foods (nuts or shellfish), medications (penicillin or aspirin), plants, and pollen. Furthermore, development, suburbanization, air contamination, climate change, pollen, and the hygiene hypothesis are also responsible for the allergic disorder in humans [2,5].

4. Effect of Allergy on Economy

The American population is affected by allergies, which affect their value of life at school and work [6,26]. Due to allergies, humans cannot pay attention to their work. Therefore, the productivity of work or their results are reduced. Each year, asthma causes around 14.4 million missed school days and costs USD 15.6 billion in medical treatment, and loss of earnings amounts to USD 5.1 billion [1].

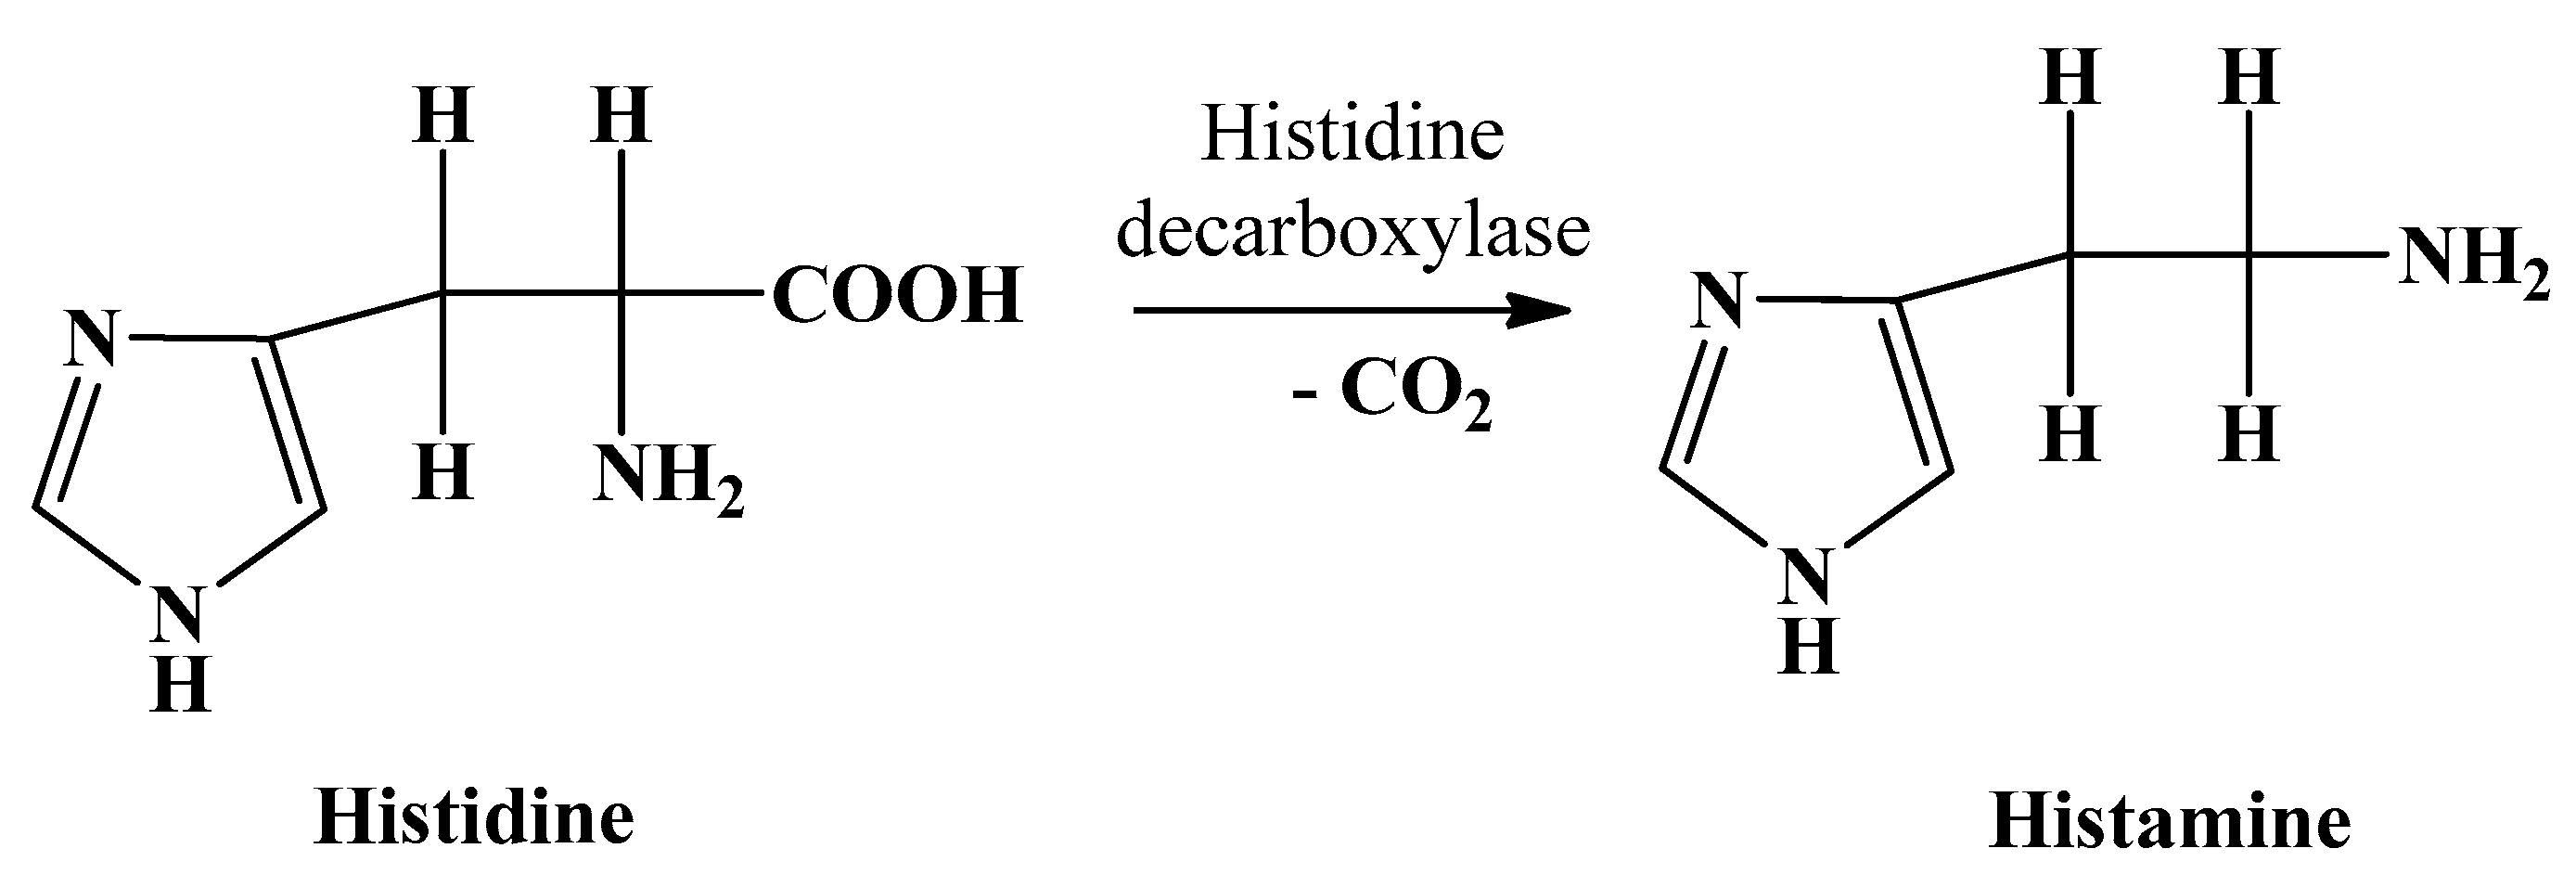
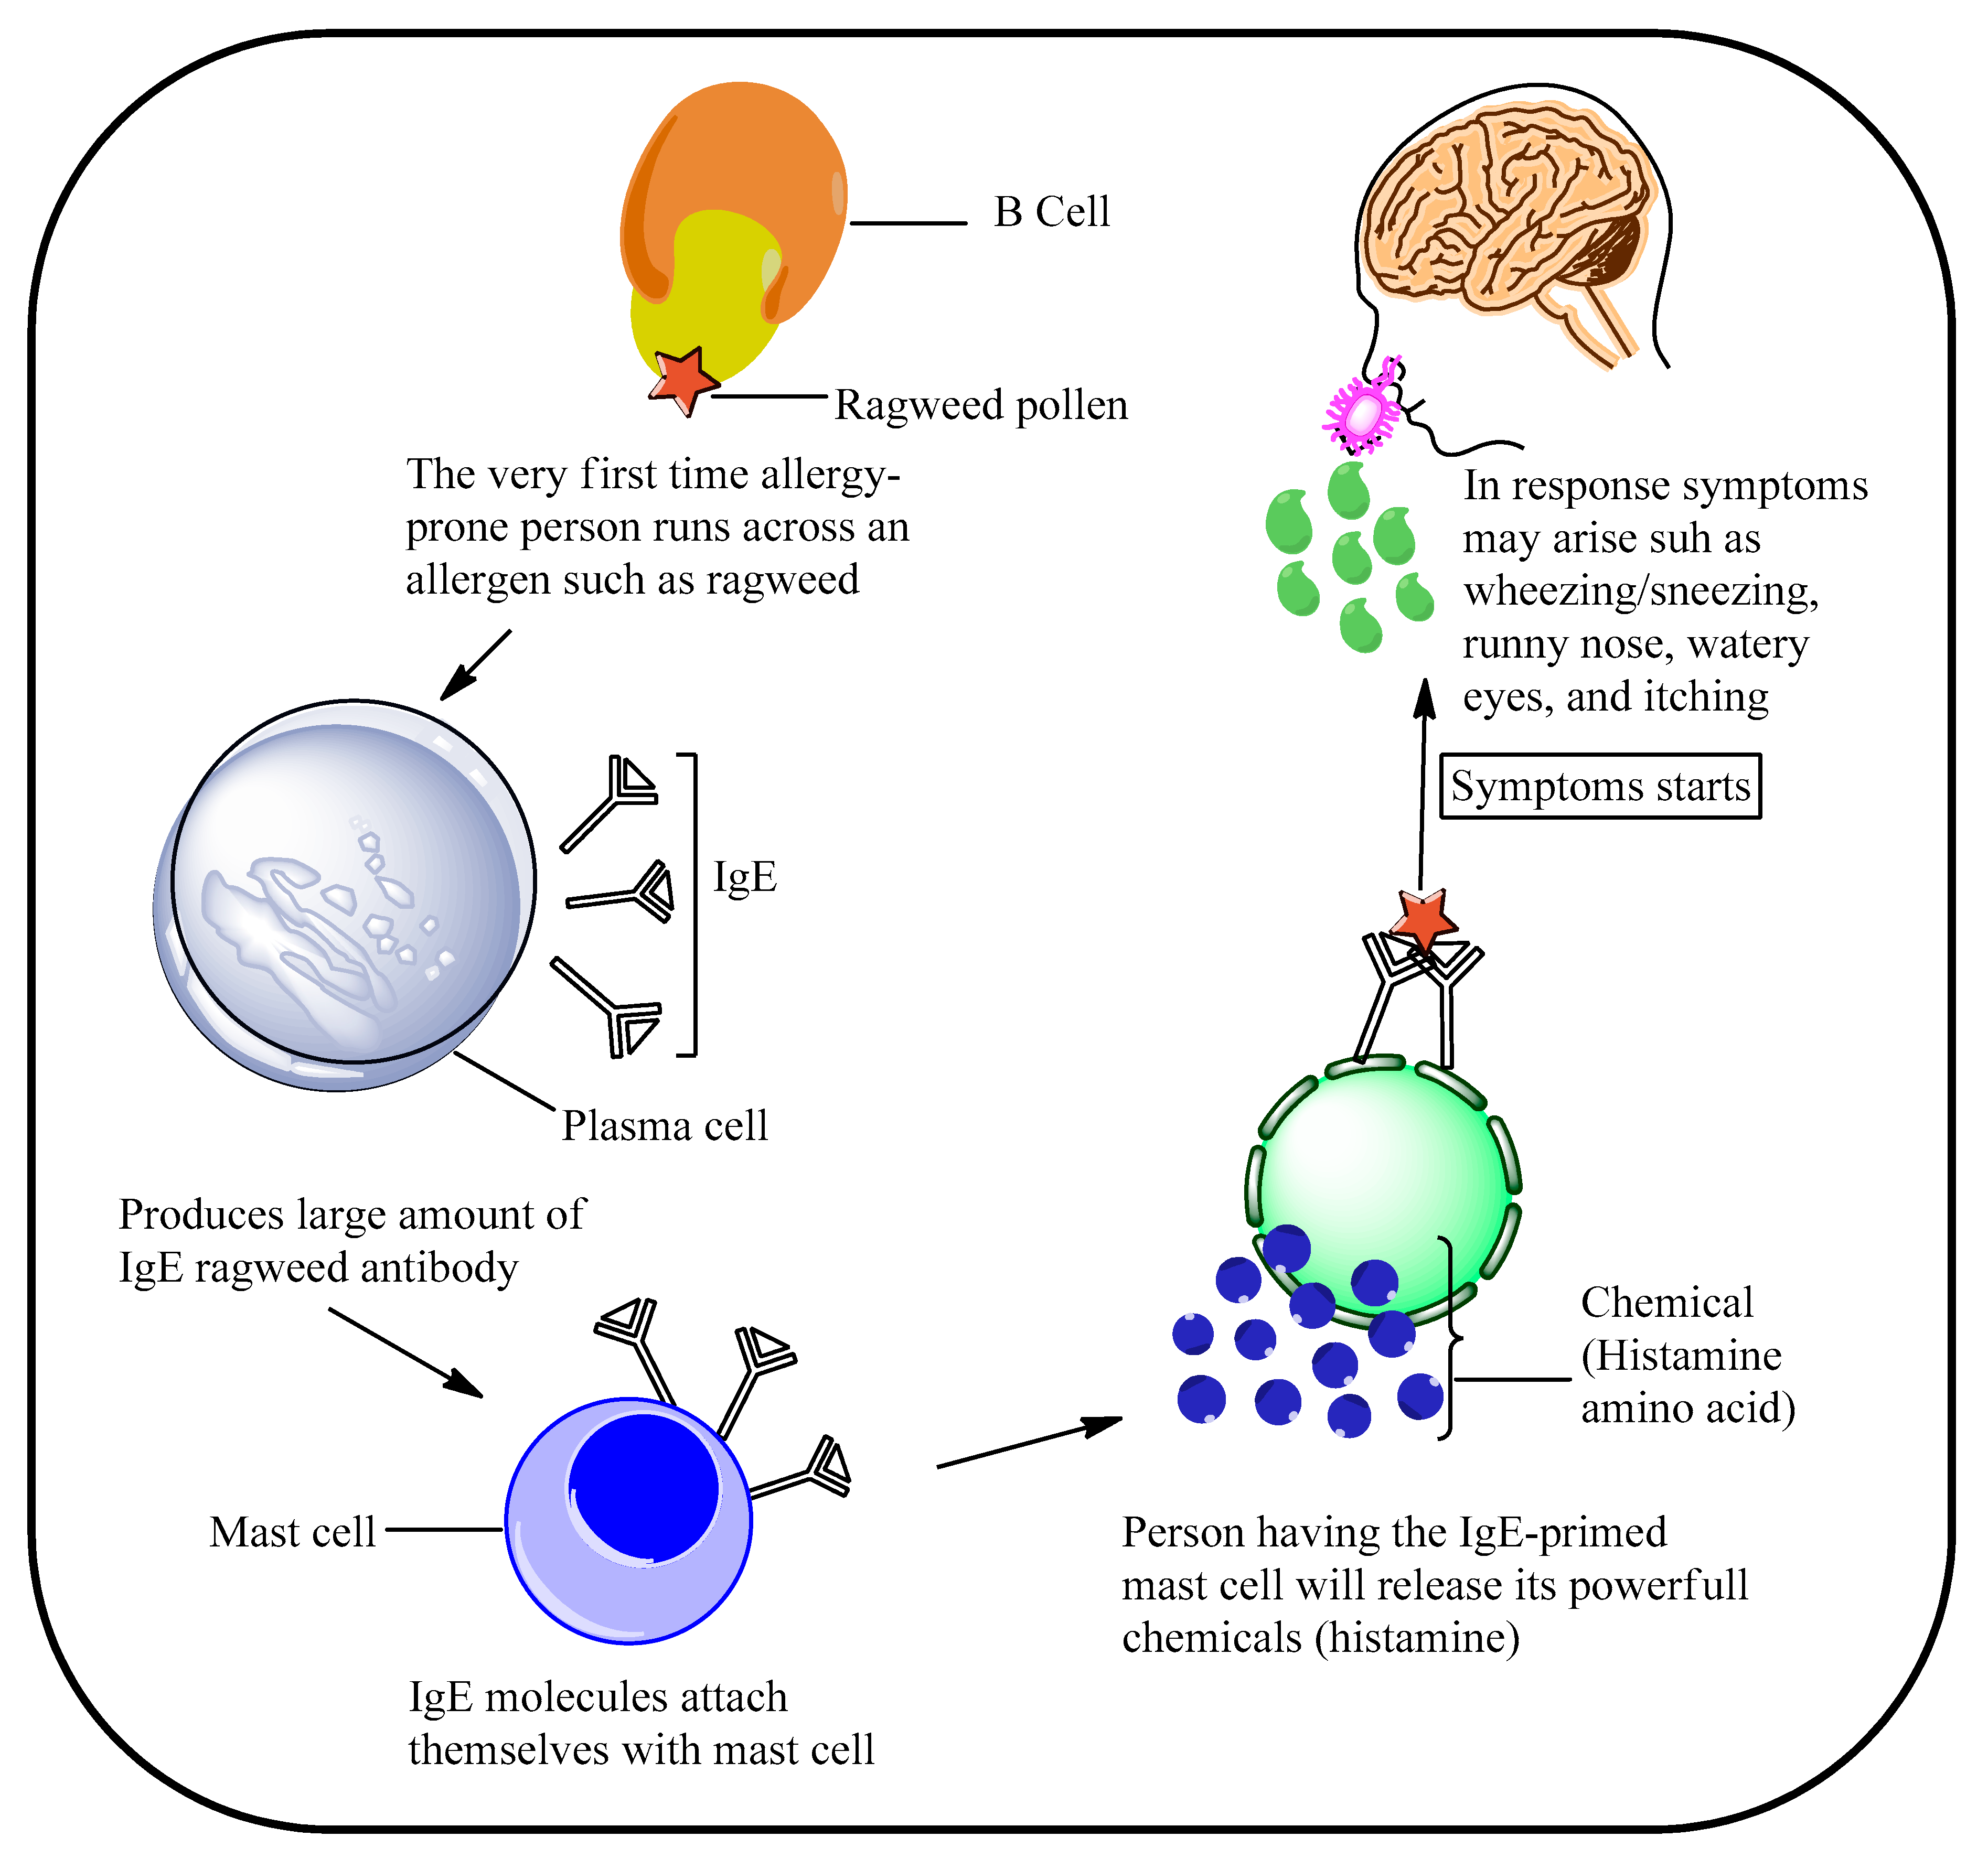
5. Mechanism of Allergy in Humans

An organism’s immune system can eliminate antigens after its exposure. It follows various mechanisms to maintain normal health. During this period, we can observe a localized inflammatory response that eliminates antigens without much trouble. Sometimes these responses get worse and provoke several deleterious effects, which may be followed by death. This unwanted immune response is known as hypersensitivity or allergy. Based on the response, hypersensitivity is divided into various forms. Broadly, there are two types of response: (i) immediate hypersensitivity and (ii) delayed hypersensitivity. For instance, asthma is a common example of hypersensitivity. In most cases, its attack is initiated by blood or airborne allergens, dust, pollen, and some types of fumes, while in some cases, asthma is associated with the weather (in cold) or hectic exercises. Mast cell degranulation, along with some mediators, constricts bronchiociliary smooth muscles and lowers windpipe inflammation, which is due to inverted or disturbed expression levels of some proteins responsible for constriction or relaxation [14,27].
Allergy begins in humans; mast cells and basophils have become the main target cells of acute hypersensitivity reactions. Histamine is found in mast cells as well as basophils, and is a significant tool in the body’s cache for struggling against infection. Histamine (Figure 1), chemically known as [2-(imidazol-4-y1) ethylamine], is obtained from the amino acid histidine after decarboxylation. It is present in all organs and tissues of the human body. Histamine plays a key role in biological actions and works like a chemical messenger to transfer information from one cell to another one.
It takes minutes to days of alerting exposure to the mast cells and basophils for them to become primed immunoglobulin E antibodies. Protein molecules are attached to a ragweed pollen particle that has been inhaled; the same symptoms occur, as shown in Figure 2. Furthermore, IgE antibodies jump to the outsides of basophils, and then mast cells are acquainted with the protein surface signs of the allergen. In addition to this, IgE antibodies react to the protein surface markers by binding, and the rest of the IgE antibodies are close to the basophils or mast cells [28,29].

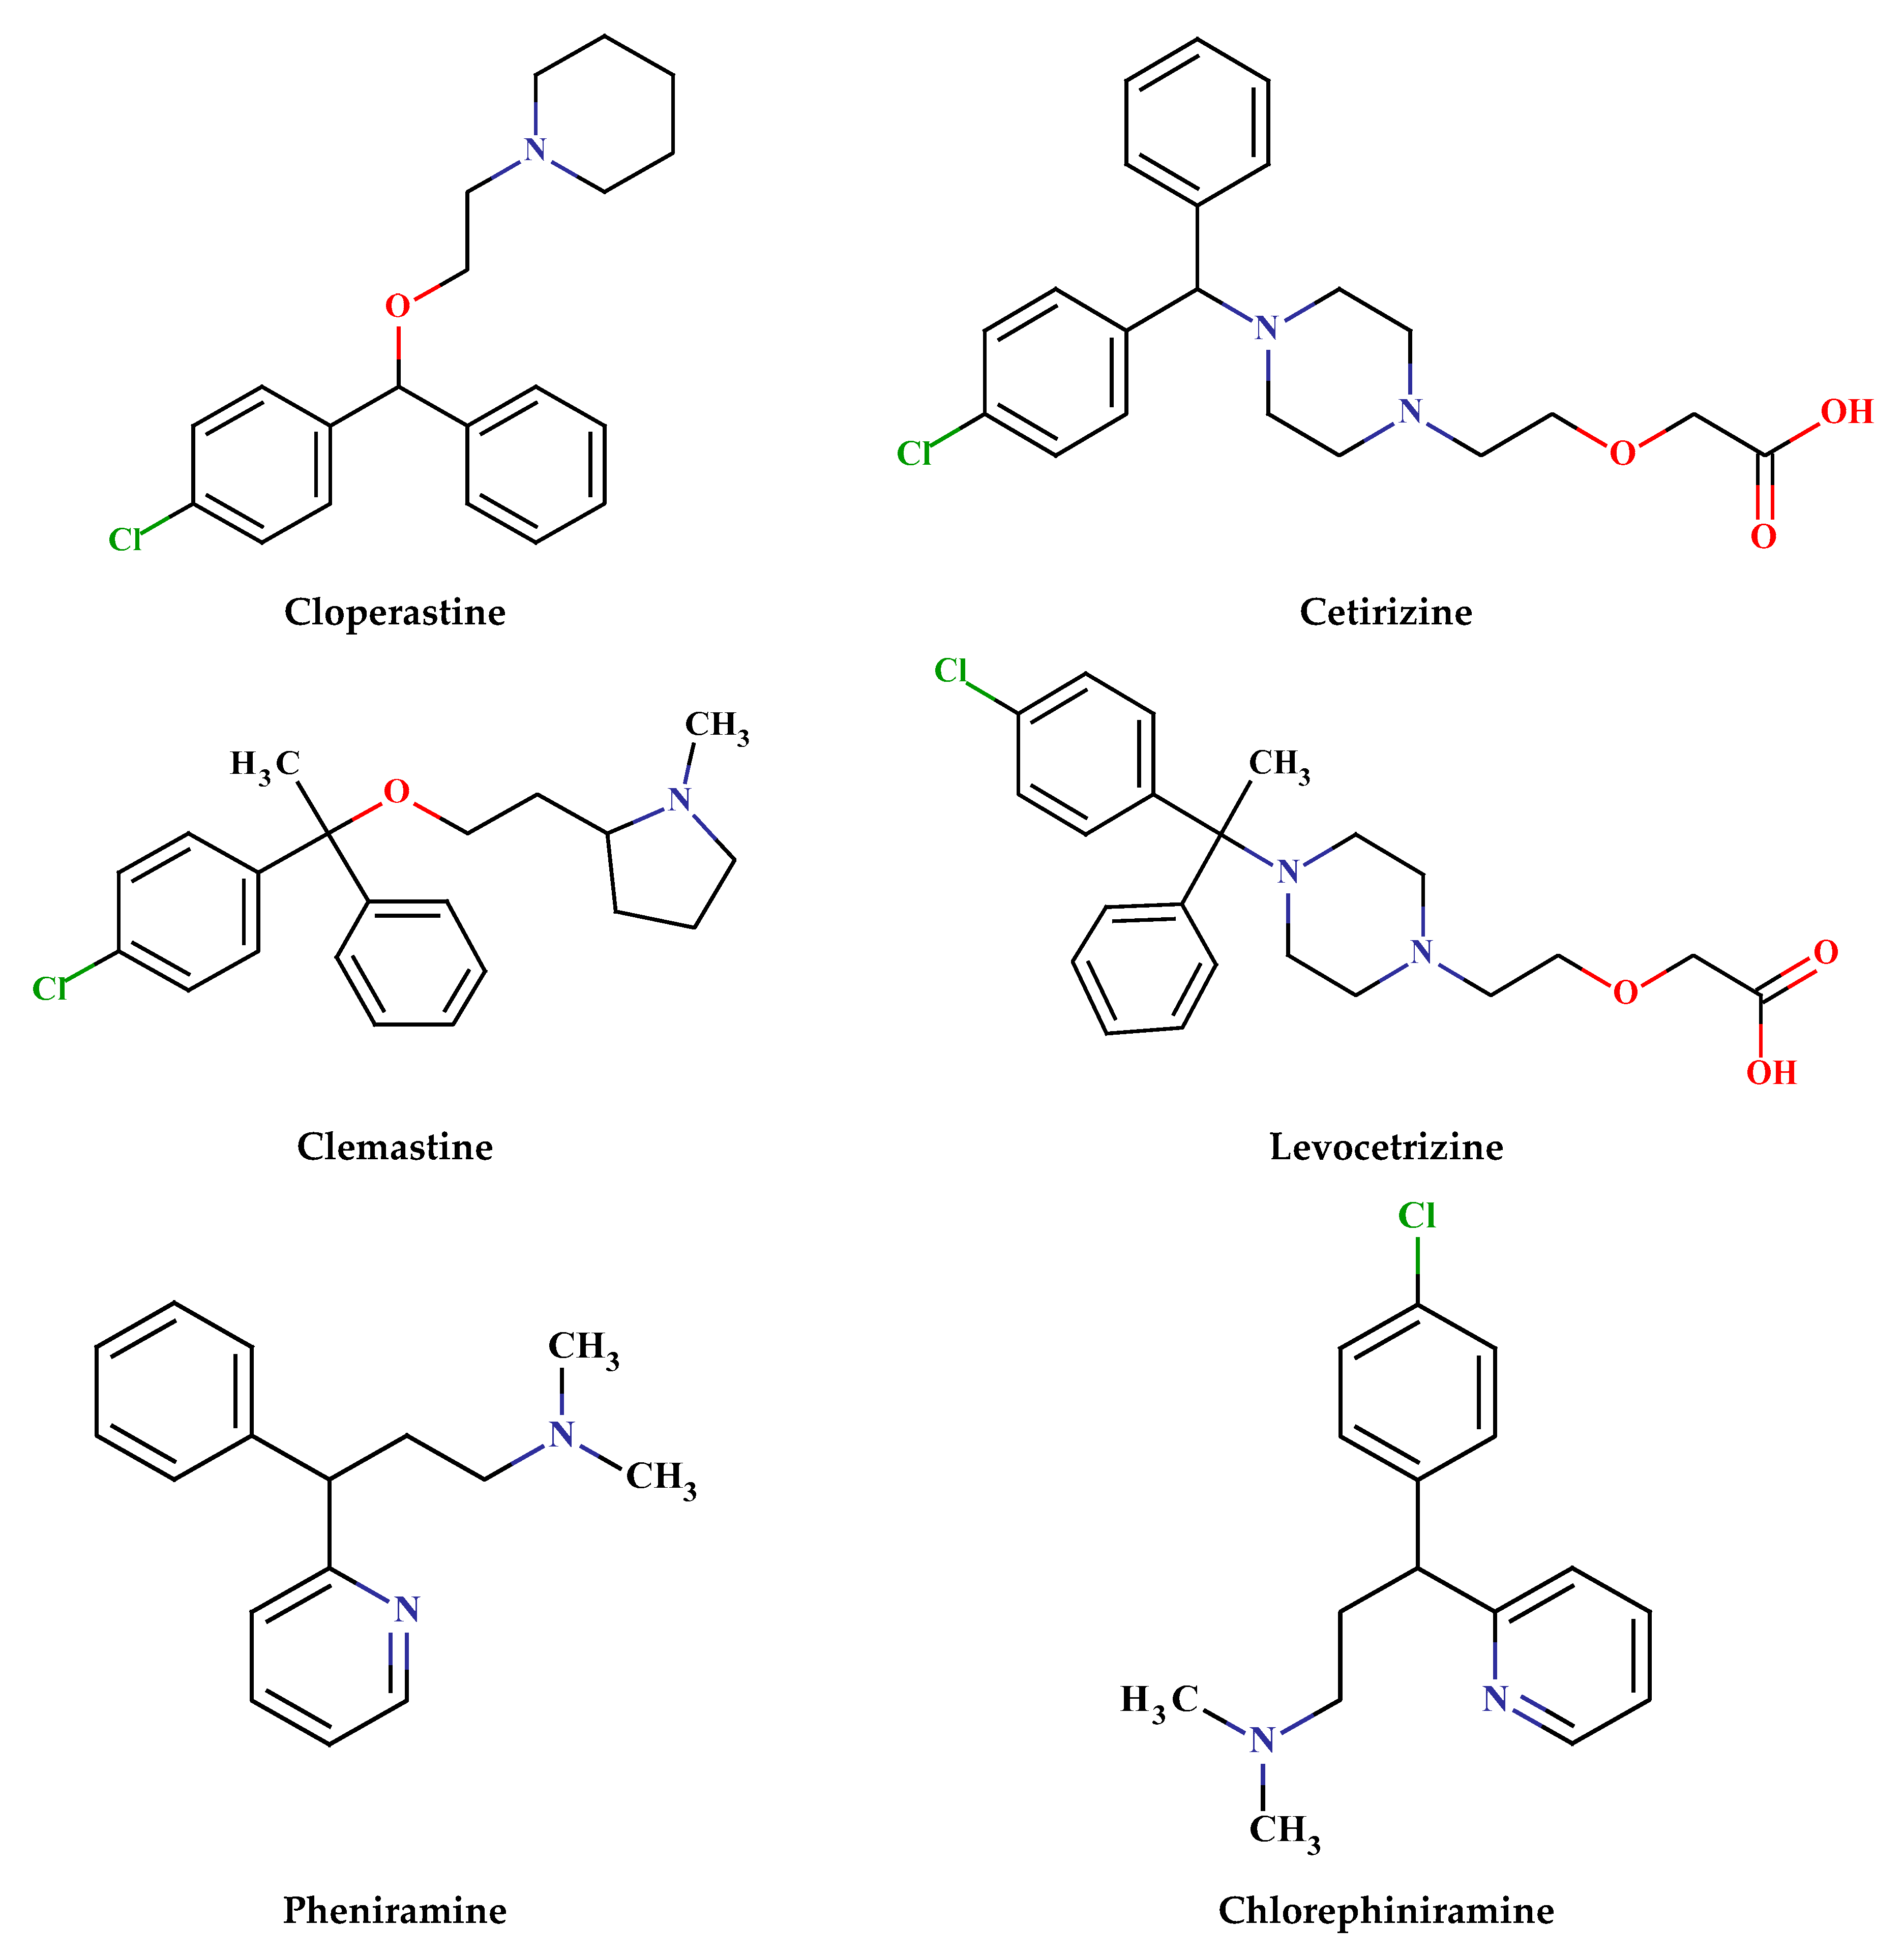
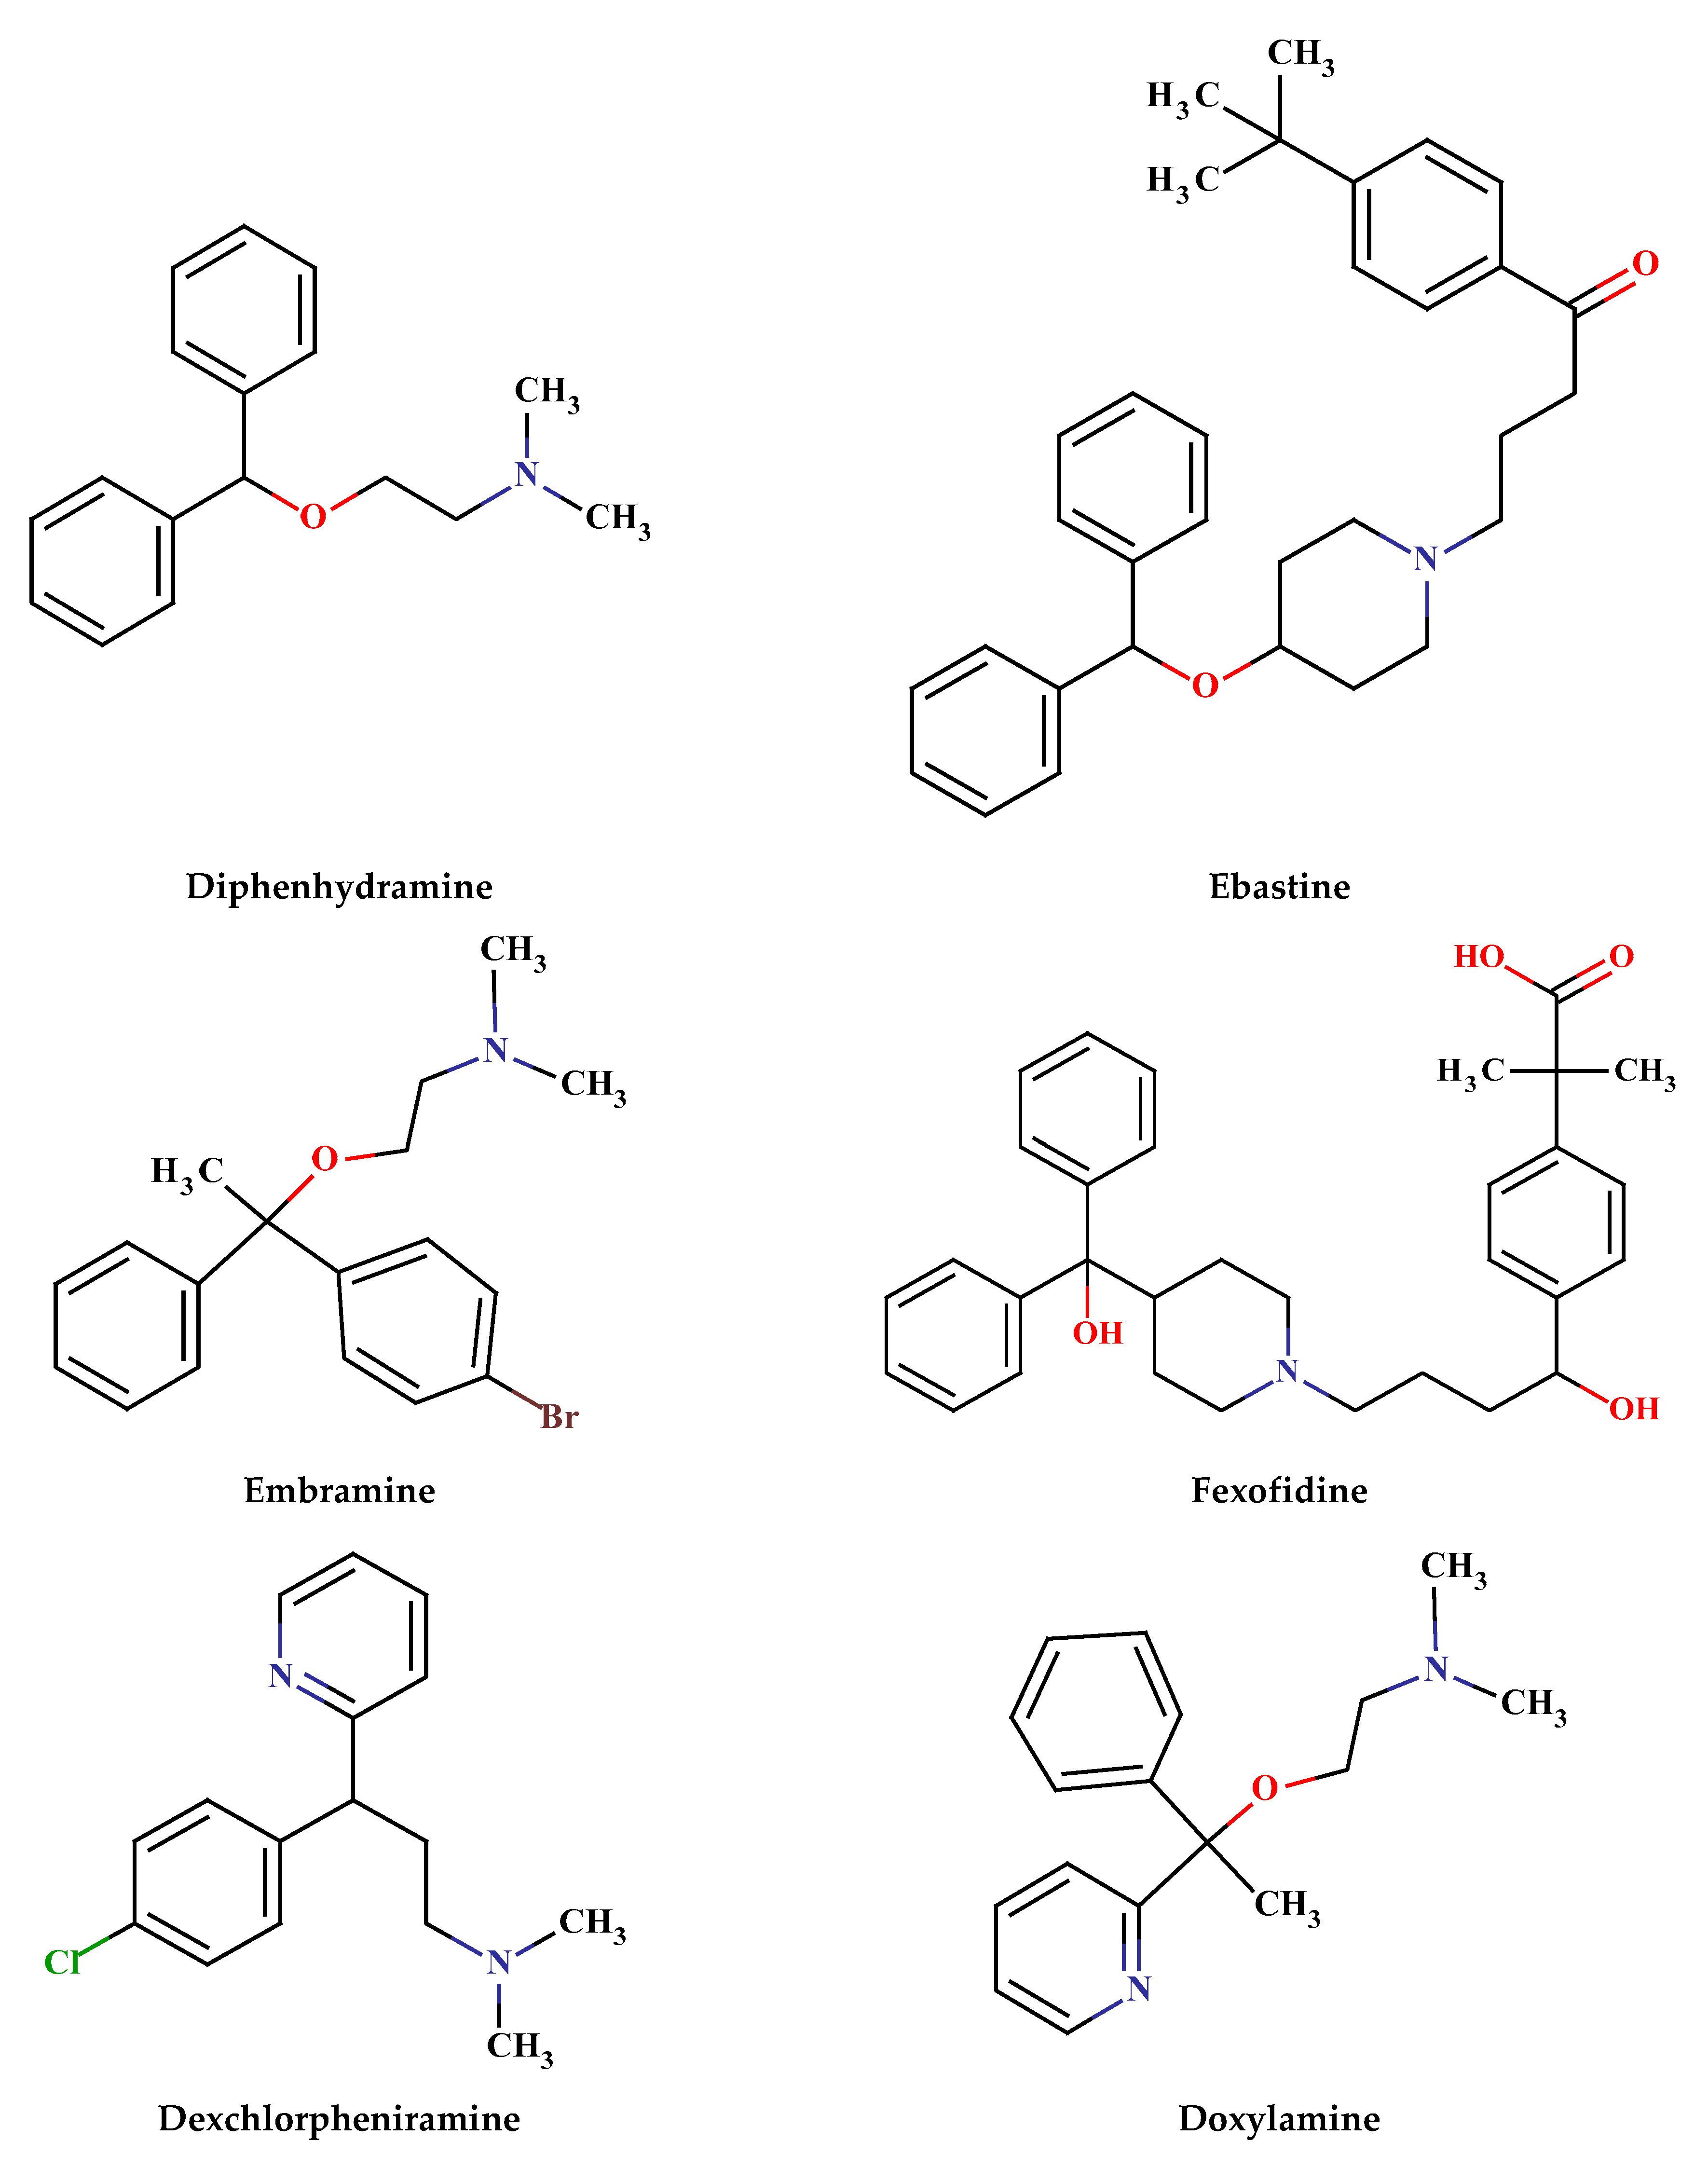
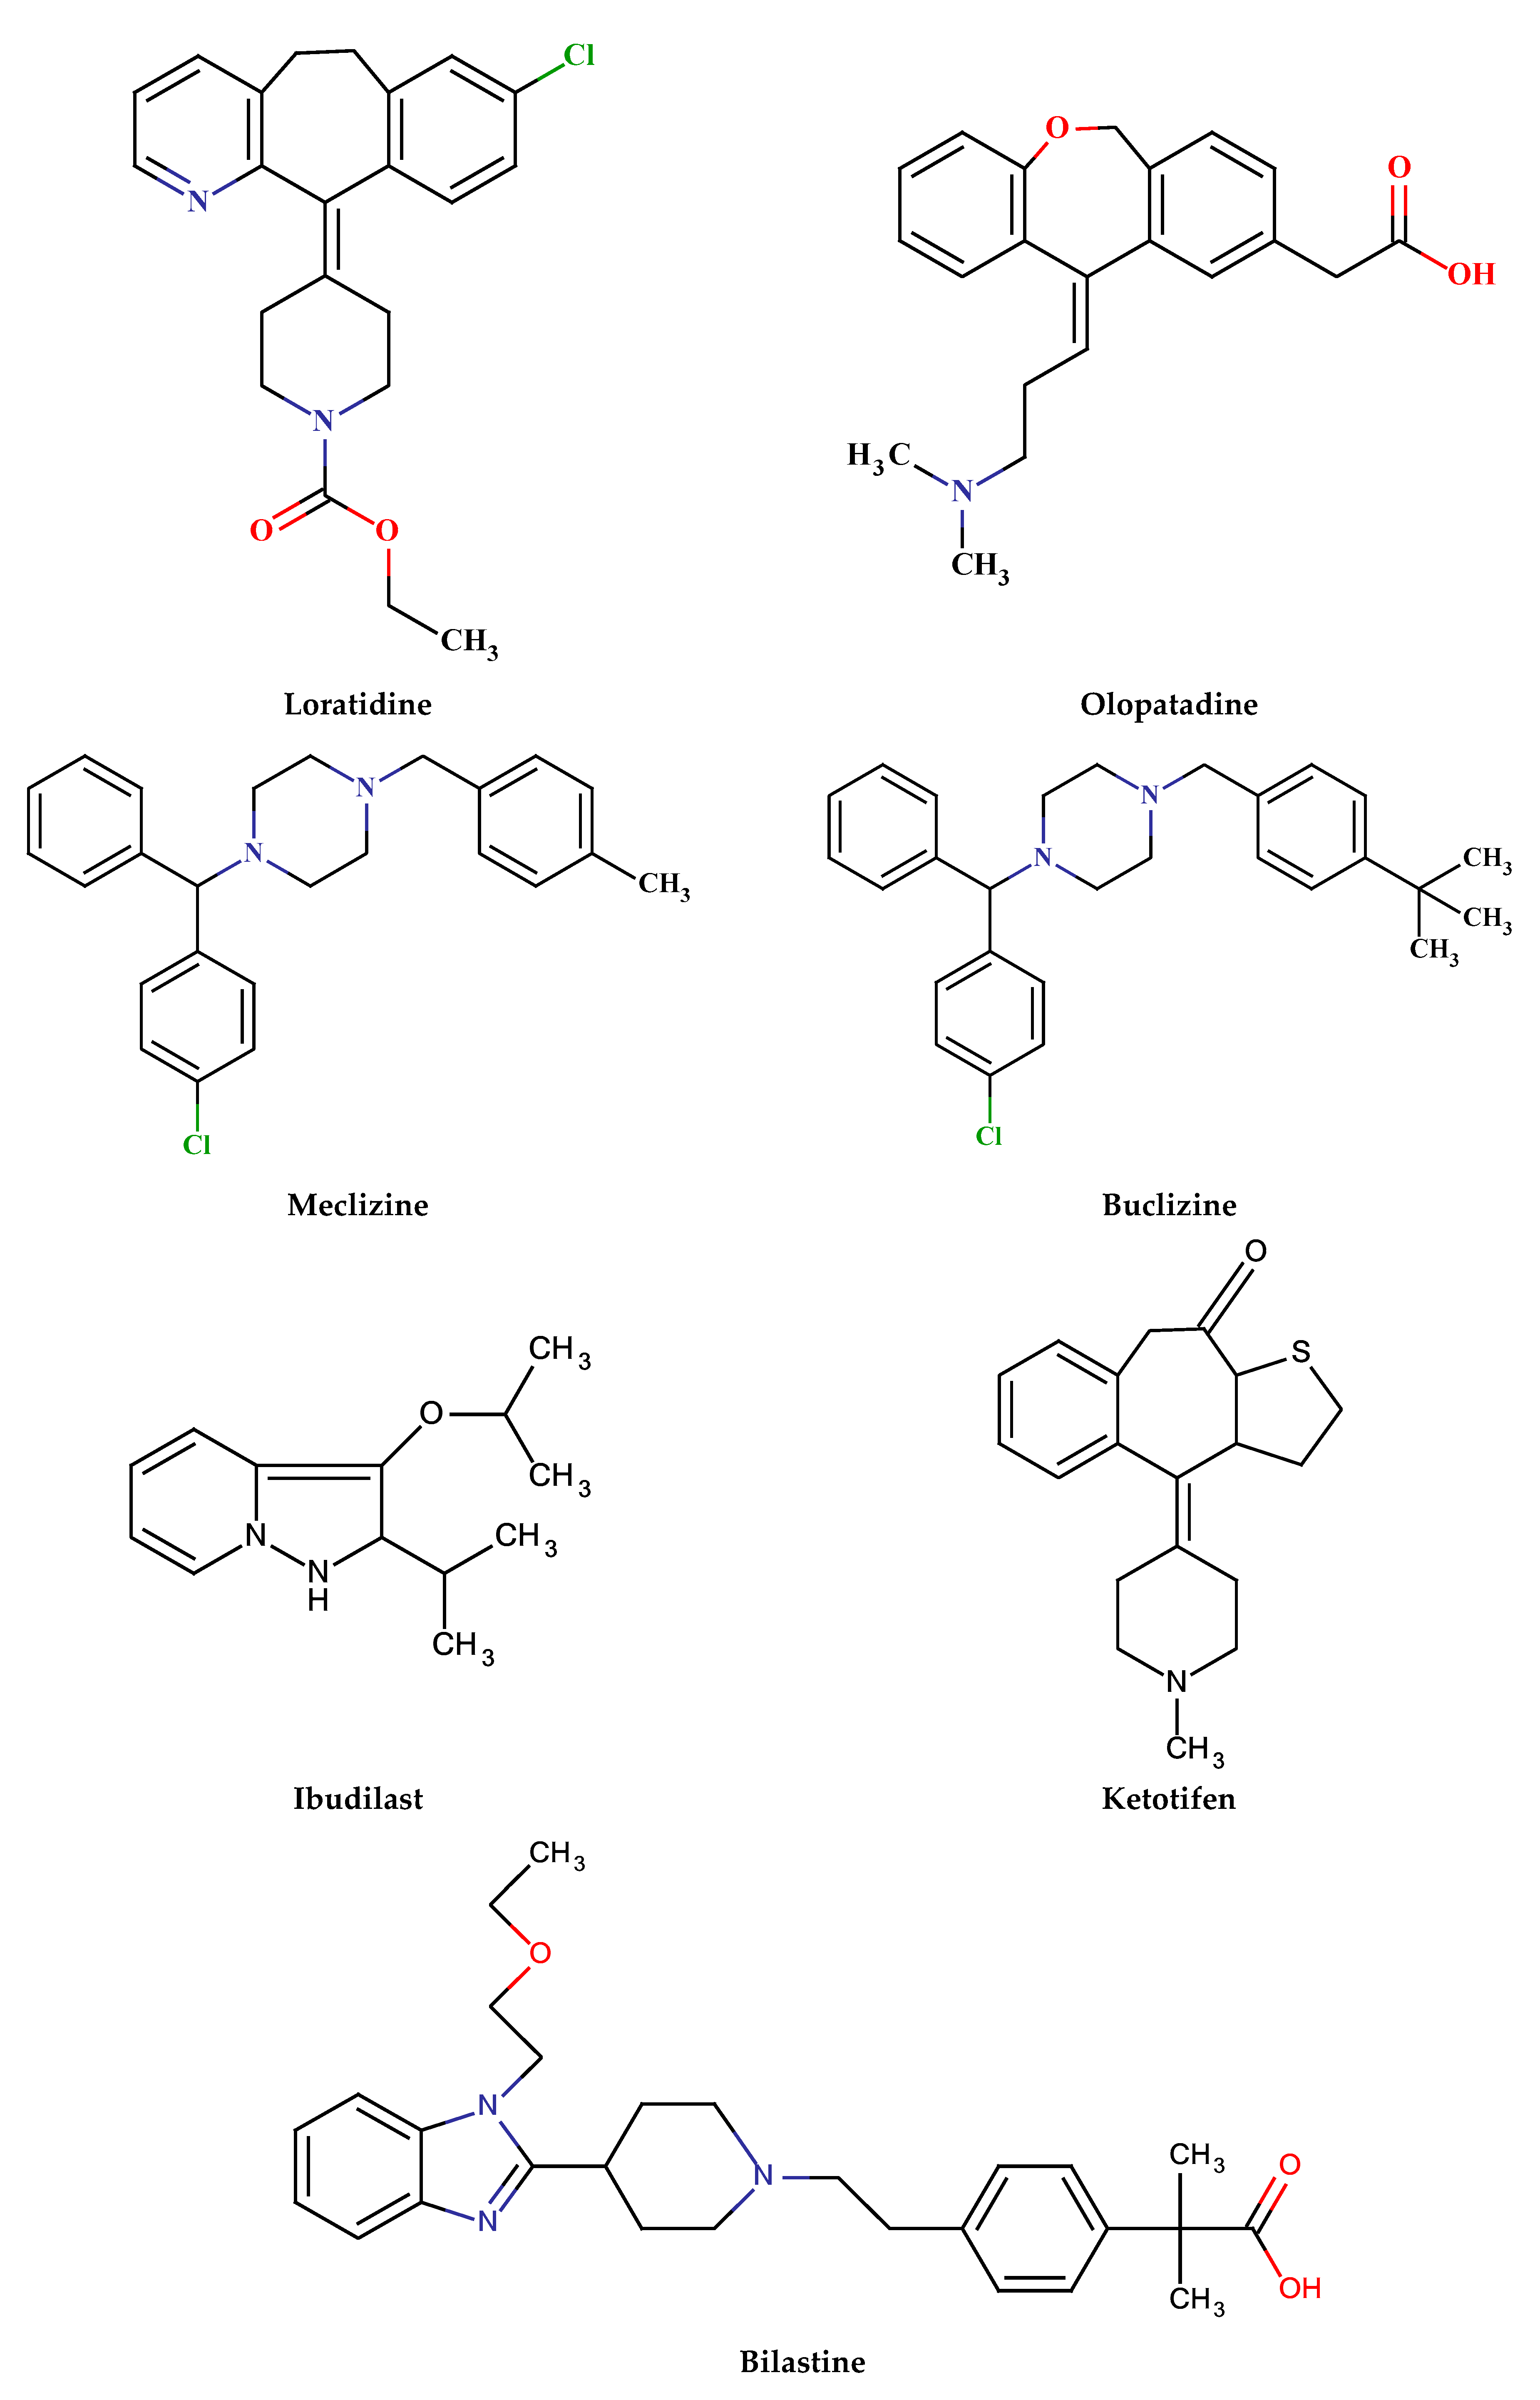
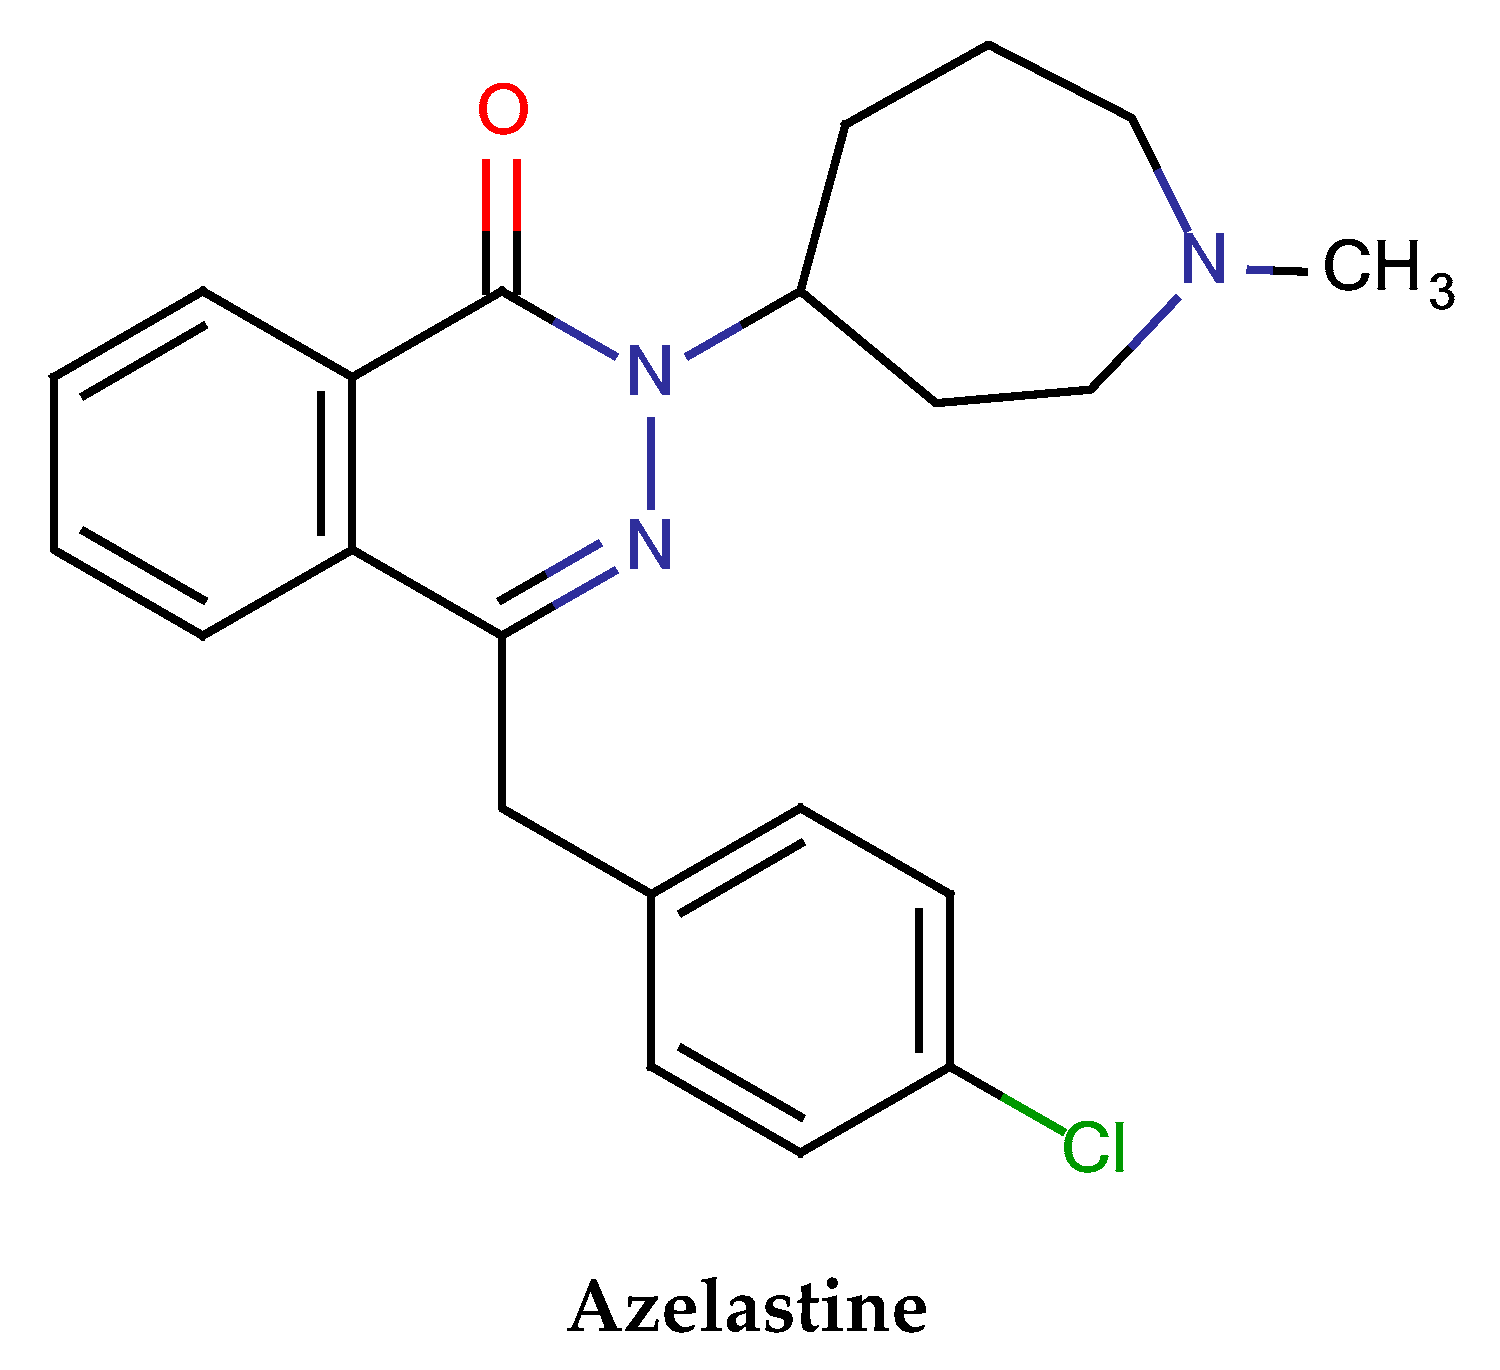
6. Classes of Antiallergic Drugs

Antiallergic drugs are available in the market with different brand names and are further divided into two classes, such as:

6.1. Simple Drugs

Loratidine, olopatadine, ketotifen, diphenhydramine, loratadine, domperidone, ebastine, ibudilast, bilastine, azelastine, etc., shown in Figure 3.

6.2. Chiral Drugs

Cetirizine, pheniramine, chlorpheniramine, clemastine, levocetirizine, fexofenadine, embramine, dexchlorpheniramine, doxylamine, meclizine, buclizine, and cloperastine, shown in Figure 3.

7. Analyses of Antiallergic Drugs by HPLC

7.1. Sample Preparation

Sample preparation is an essential and critical part of analyzing any drug product. Sample preparation for analyzing the drug product in a biological sample is mandatory, because several impurities are present along with the drug of interest [30]. The drug concentration in the sample is very low, for instance, nano- to picogram levels. For that reason, sample preparation is required before the analysis to obtain the contamination levels of the drugs [31]. To get rid of these complications, very simple, fast, and reliable sample preparation techniques are used. The basic parts of an analysis of drugs and pharmaceuticals in human plasma are drug extraction, purification, and preconcentration. Additionally, the sampling of blood, preservation, and extraction is also essential. Moreover, the solid phase extraction (SPE) method is used to extract the drug product from a wide variety of matrices such as blood plasma, urine, water samples, beverages, soil animal tissue, etc. SPE is a very fast and sensitive extraction method, with the highest concentration of drug recoveries, i.e., 90–95%. For fast and selective sample preparation-cum-purification before chromatographic analysis, SPE is used. The SPE method is very economical because of the low consumption of solvent [32,33]. Considering the above features, SPE has become the first choice of about 80% of chromatographers for sample preparation globally [34]. Among columns, disks, and cartridges, cartridges have been frequently used for extraction purposes [35].

7.2. Separation and Identification

Separation and identification of antiallergies by HPLC were divided into two parts, viz. simple and chiral. The details are discussed in the following subheadings.

7.2.1. Simple

There are various techniques available on the market for drugs and pharmaceutical analyses. Among them, the HPLC technique appears as the best choice for analysts because of its good reproducible, effective, and selective results. Moreover, the availability of different types of columns for drug analysis makes HPLC the priority [36,37]. Similarly, the separation of antihistamine drugs by HPLC is carried out, which is given herein (Table 1). For the determination of phenylephrine HCl, paracetamol, and cetirizine hydrochloride in pharmaceutical tablet dosage form, an (HPLC-DAD) method has been developed and validated by Dewani et al. [38], utilizing mobile phase (10 mM phosphate cradle: pH 3.3 and acetonitrile on Kinetex-C18 column). The calibration curves were found to be linear, and ranged from 5–15, 250–750, and 2.5–7.5 µg/mL for phenylephrine HCl, paracetamol, and cetirizine hydrochloride, with correlation coefficient >0.9996. The developed method promises potential application in the analysis of the pharmaceutical mixture of a marketed preparation tablet. Another HPLC method (accurate and specific) was described by Sher et al. [39] to determine drugs such as cetirizine HCl, chlorphenamine maleate, buclizine, domperidone, loratadine, and meclizine in dosage form and human serum, involving pyridoxine (internal standard), with mobile phase: a mixture of 0.01 M sodium salt of heptane sulphonic acid salt buffer and acetonitrile. Furthermore, the flow rate set was 1.0 mL/min with UV detection at 230 nm. A C18 column was used for this analysis. The authors have determined the separation of some antiallergic reference standard drugs by HPLC, for example, pyridoxine, chlorphenamine maleate, domperidone, cetirizine, loratadine, meclizine, and buclizine. LODs were in the range of 0.52 to 5.16 ng/mL. The key objective of their study was to optimize the sample preparation, standard preparation, pharmacokinetics, and force degradation study of these antiallergic drugs. These were extracted from the human plasma of different volunteers. The typical separation of the reported drugs was conceded in pharmaceutical formulation. Before the analysis of these antiallergics into human plasma, a blank sample was also carried out. Thereafter, a spiked drug plasma sample was injected into the HPLC and the typical chromatogram was achieved at 230 nm for pyridoxine, chlorphenamine maleate, domperidone, cetirizine, loratadine, meclizine, and buclizine.
Borges et al. [40] developed a new RP-HPLC method for the stability of cetirizine dihydrochloride, by using 0.2 M K2HPO4 (pH 7.0) and acetonitrile (65:35, v/v) mobile phase. Eclipse XDB C8 (150 × 4.6 mm, 5 μm) column was used with 1.0 mL/min flow rate and detection at 230 nm. The LOD and LOQ were 0.25 and 0.056 μg/mL, respectively. The developed stability-indicating methods can be utilized for cetirizine dihydrochloride oral lyophilized dosage form. Souri et al. [41] developed and validated an HPLC method to examine the cetirizine dihydrochloride degradation in acidic and oxidative conditions using mobile phase as a mixture of 50 mM KH2PO4-acetonitrile (60:40, v/v) on a symmetry C18 column. The developed and validated method was found to be linear and range from 1–20 μg/mL of cetirizine dihydrochloride with a correlation coefficient >0.999 and intra- and interday precision <1.5%. From the experimental data of the drug, it was concluded that the drug was unstable in 2 M HCl and 0.5% H2O2. LOQ was 1 µg/mL. LOD was 0.2 µg/mL with a recovery of 99%. Kumar et al. [42] developed and validated an explicit and accurate RP-HPLC method for the rapid determination of phenylephrine HCl, nimesulide, caffeine anhydrous, and chlorpheniramine maleate. A mixture of methanol and buffer (55:45, v/v, pH 5.5) was used as a mobile phase on the RP-Hypersil phenyl column (4.6 mm × 25 cm). A flow rate of 1.0 mL/min with detection at 214 nm was achieved. The retention times of these drugs, namely nimesulide, phenylephrine hydrochloride, caffeine anhydrous, and chlorpheniramine maleate were 7.47, 3.94, 4.55, and 17.15 min. The linearity for all the reported drugs was obtained in the range between (300–800 μg/mL) nimesulide, (15–32 μg/mL) phenylephrine hydrochloride, (16–32 μg/mL) chlorpheniramine maleate, and (30–180 μg/mL) caffeine anhydrous, respectively.
LODs were in the range of 0.45 to 9.34 µg/mL. This simple, precise, economical, rapid, and reproducible method could be employed for the determination of the aforesaid drugs in commercial uses. Sujana et al. [43] described an RP-HPLC method for the estimation of fexofenadine in bulk and tablets. The separation was carried out on a Symmetry C18 (15 cm × 4.6 mm i.d., 5 µm) column using a mixture of potassium dihydrogen phosphate buffer (pH 3.0) and methanol (30:70, v/v) as mobile phase and detected at 254 nm. LOQ and LOD values for fexofenadine were 9.92 and 3.03. The proposed method followed ICH guidelines and may be used in routine analysis of reported drugs in pharmaceutical tablet forms. Trivedi et al. [44] described a stability-indicating RP-UPLC method for simultaneous determination of ambroxol HCl, cetirizine HCl, methylparaben, and propylparaben in liquid pharmaceutical formulation. The separation was achieved on an Agilent Eclipse plus C18 (50 mm × 2.1 mm, 1.8 um) column using gradient elution with a mixture of 0.01 M phosphate buffer, 0.1% triethylamine, and acetonitrile as mobile phase, with detection at 237 nm. LLOQs were 0.12 to 0.18 µg/mL, with a recovery of more than 99% for each drug. All the drugs were well separated, with twelve known impurities/degradation products together with one unknown degradation product within 3.5 min of retention time. Sivasubramanian and Lakshmi [45] developed and validated a linear, reproducible, specific, sensitive, and rugged HPLC technique for the optimization of cetirizine, paracetamol, and pseudoephedrine on a Hypersil C18 column using isocratic mode. The flow rate was 1.0 mL/min and the mobile phase comprised of 25 mM phosphate buffer (pH 5.0)-methanol-acetonitrile (30:60:10, v/v) at 240 nm. The linearity range for paracetamol, cetirizine, and pseudoephedrine was found to be 100–600, 1–6 and 12–72 μg/mL, separately and respectively. The LOD was 0.921, 0.151, and 0.321 µg/mL and the LOQ 2.512, 0.502 and 0.836 µg/mL for paracetamol, cetirizine, and pseudoephedrine. The created strategy was straight, reproducible, explicit, delicate, and tough. Karakus et al. [46] developed and validated a specific, accurate, precise RP—HPLC method to determine the antihistaminic-decongestant pharmaceutical dosage forms containing a binary mixture of pseudoephedrine HCl with fexofenadine HCl or cetirizine dihydrochloride using a Zorbax C8 (15 cm × 4.6 mm, 5 µm) column, and detection was achieved at 218 and 222 nm, respectively. The mobile phase consisted of TEA solution 0.5%, pH 4.5-methanol and acetonitrile (50:20:30, v/v). The method was linear between the concentration range from 30–240 and 1.25–10 µg/mL, and the limits of detection for pseudoephedrine hydrochloride and cetirizine dihydrochloride were 1.75 and 0.10 µg/mL, separately. Similarly, the linearity range for pseudoephedrine HCl and fexofenadine HCl binary mixture was 10–80 and 5–40 µg/mL, and the limit of detection was 0.75 and 0.27 µg/mL, respectively. The connection coefficient was greater than 0.999, and RSD was under 1%. LOD values were 1.75 and 0.10 µg/mL for PSE and CET; LOD values were 0.75 and 0.27 µg/mL for PSE and FEX. The % recovery for PSE and CET was 97.52 to 98.40, and for PSE and FEX it was 100.98 to 98.97. The developed method can be applied to the quantitative analysis of the reported drugs. A rapid HPLC method was developed by El-Sherbiny et al. [47] for the pharmaceutical preparation of loratadine and/or its analog desloratadine using a microemulsion as the eluent. The separation was achieved using a column packed with cyanopropyl-bonded stationary phase followed by detection at 247 nm with a flow rate of 1.0 mL/min. The mobile phase: 0.1 M sodium dodecyl sulfate, 1% octanol, 10% n-propanol, and 0.3% triethylamine in 0.02 M phosphoric acid (pH 3.0). Validation of the developed method was carried out in terms of linearity, specificity, LOQ, LOD, precision, and accuracy. LOD was 0.8 and 0.2 µg/mL for loratadine and desloratadine, Similarly, LOQ was 2.3 and 0.6 µg/mL for both drugs. Fujimaki et al. [48] developed an HPLC-tandem mass spectrometry technique for the analyses of four antiallergic drugs—ketotifen, olopatadine, cetirizine, and ibudilast—in human plasma utilizing polymer column (MSpak GF). An acetonitrile-rich portable stage was utilized to elute the analytes. The observed recoveries of the ketotifen, cetirizine, olopatadine, and ibudilast spiked into plasma were 51.7–95.5%, and the detection limit was 0.5 ng/mL. Interestingly, the correlation coefficient (r) for the tested drugs was in the range of 0.9997, −0.999, 0.9997, and 0.998, with a concentration range of 1–100 ng/mL and a detection limit of 0.5 ng/mL. Songa et al. [49] described bioanalytical technique inbuilt solid phase extraction (SPE) and hydrophilic interaction liquid chromatography-tandem mass spectrometry (HILIC–MS/MS) for cetirizine determination. An SPE 96-well plate using polymer sorbent (Strata X) was utilized for the extraction of cetirizine. The mobile phase used consisted of acetonitrile-water-acidic acid trifluoro acetic acid (93:7:1:0.025, v/v), and 0.5 mL/min was the flow rate. Further, the extracted samples were separated on Betasil silica columns (50 × 3.5 mm). The method was validated over the range from 1.00–1000 ng/mL cetirizine in human plasma. The interday precision and accuracy of cetirizine exhibited <3.0% RSD and <6.0% relative error. The extraction recoveries were 85.8, 84.5, and 88.0% at 3, 40, and 800 ng/mL, respectively. A recovery of 84.1% was obtained for (IS). This HILIC-MS/MS technique may be used for cetirizine in any biological samples. Qia et al. [50] described the LC method for the analysis of desloratadine in drug substances and pharmaceutical preparations. The mobile phase consists of methanol, 0.03 mol/L heptane sulphonic acid sodium, and glacial acetic acid (70:30:4, v/v) on a Diamonsil BDS C18 column. The flow rate was 1.0 mL/min, with detection at 247 nm. The developed method was validated as per these parameters, for example, selectivity, linearity, LOD, LOQ, accuracy, precision, and solution stability. This technique can be applied for synthetic process control and desloratadine determination in drugs and pharmaceutical preparations. Liu et al. [51] established an HPLC determination of desloratadine by using Hypersil CN column (150 mm × 5 mm, 5 µm) with mobile phase: methanol-acetonitrile-phosphate buffer (35:35:30, v/v) with pH 5.5; the flow rate was 0.8 mL/min and detection was at 241 nm. The LOQ and calibration range were 5.0 ng/mL and 5.0–800.0 ng/mL, respectively. Furthermore, this method can be utilized for bioequivalence studies of desloratadine fumarate (test), and desloratadine tablets (reference preparation). Jaber et al. [52] developed and validated the HPLC method for the analysis of cetirizine dihydrochloride (CZ) and its related impurities. The mobile phase used was 0.05 M NaH2PO4-ACN-MeOH-THF (12:5:2:1, v/v) on Hypersil BDS C18 (25 cm × 4.6 mm, 5 µm) The detection was achieved at 230 nm with a flow rate of 1.0 mL/min. The limits of detection and quantitation for CZ were 0.10 and 0.34 µg/mL, respectively, and CZ-related impurities were observed in the range of 0.08–0.26 µg/mL and 0.28–0.86 µg/mL, separately. The developed method was specific, stability-indicating, accurate, and precise, and can be used for CZ and its related impurities. Kunicki [53] discussed a specific HPLC method for the analysis of loratadine in a human plasma sample. The mobile phase consists of ACN-water-0.5 M KH2PO4-H3PO4 (440:480:80:1, v/v) on the Supelcosil LC-18-DB column, and the detection was set at 200 nm. The limit of quantification was 0.5 ng/mL. The precision was good over the range from (0.5–50 ng/mL). Prathyusha et al. [54] developed and validated the RP-HPLC method to obtain the purity of Bilastine in pharmaceutical and bulk dosage forms. The mobile phase used was a mixture of formic acid and methanol (1:1 ratio) using the Gemini C18 column (150 × 4.6 mm i.d. 5 µm particle size). The detection was set at 282 nm with a flow rate of 0.8 mL/min. The LOD and LOQ were observed at 0.08931 µg/mL and 0.27063 µg/mL, respectively. The developed method can be further applied for the determination of Bilastine for any mixture of the pharmaceutical dosage form. Patel and Pasha [55] developed a simple, precise, accurate, and stability-indicating RP-HPLC method for the determination of azelastine hydrochloride (AZL) in nasal spray preparation. The chromatographic separation was achieved on the Spherisorb CN column (250 × 4.6 mm, 5-μm) using potassium dihydrogen phosphate buffer and acetonitrile (50:50, v/v) as mobile phase. The flow rate was set to 1.0 mL/min and detection was achieved at 290 nm. LOD and LOQ were 0.81 µg/mL and 2.44 µg/mL. The % recovery was observed between 99 and 102%. Alali et al. [56] developed and validated a new LC-MS method for the exact amount of ketotifen (unchanged and conjugated) in human plasma. The internal standard Pizotifen was utilized in this investigation. The chromatographic condition was accomplished using reverse phase gradient mode with the switching column technique. The precision was linear and observed between the range of 0.5 to 20.0 ng/mL in human plasma. The percentage recovery was 98.04 and 95.13% for ketotifen and pizotifen, respectively. Li et al. [57] developed analytical methods for the determination of isoniazid and cetirizine in animal and human plasma, respectively. The developed methods had good accuracy, linearity, and precision over the range of 10–2000 and 1–1000 ng/mL of isoniazid and cetirizine in plasma. Chen et al. [58] developed a specific LC-MS-MS method for the optimization of ketotifen and its significant metabolite, ketotifen N-glucuronide in human plasma. Liquid–liquid extraction and the analysis were performed on an LC-MS-MS inbuilt with an electrospray ionization (ESI) interface. The LLOQ for ketotifen was 10.0 pg/mL, the interday precision was beneath 8.2%, and accuracy was between 2.4–3.4% for all samples. Fujita et al. [59] developed a fast, sensitive, and selective method to optimize plasma concentrations of olopatadine HCl (A) and its metabolites, such as M1 (B), M2 (C), and M3 (D) by opting for HPLC with EI tandem mass spectrometry. Olopatadine and its metabolites together with the internal standard, KF11796 (E), were isolated from plasma by the SPE method.
The mass spectra of Ketotifen, cetirizine, olopatadine, and ibudilast were achieved using HPLC-MS, and HPLC-MS-MS are represented in along with its fragmentation mode. These antiallergic drugs presented protonated molecular ions [M+H]+ at m/z 310, 389, 338, and 231, separately, by using HPLC-MS in full scanning mode. In the case of ketotifen, which showed the main important product (desired) ion at m/z 96 (collision energy, −40 eV), it was most likely equivalent to [C6H8N + 2H]+. Similarly, for olopatadine, the mass spectra gave a major fragment ion at m/z 165, similar to the breaking of the dibenzoxepin ring. Moving forward for olopatadine, the product ion at m/z 247 was because of the loss of the CH3CH2NH and COOH groups. Cetirizine demonstrated a base peak that appeared at m/z 201 as a result of a piperazine side chain. Additionally, protonated ibudilast gave product ions at m/z 189 and 161, separately, because of the loss of an isopropyl group and an isobutyryl group [59]. The above drugs were pointed into human plasma. The chromatograms with distinct peaks for each drug showed little impurity. The elution of peaks of ketotifen, olopatadine, cetirizine, and ibudilast at different retention times was at 26.6, 26.9, 27.8, and 30.2 min; recoveries of these drugs from (biological) plasma samples were optimized by the current methodology without an additional internal standard (IS). The recoveries of ketotifen, olopatadine, cetirizine, and ibudilast were 51.7–95.5% from the plasma samples, and these results were found to be satisfactory. In these experiments, ibudilast 500 ng/mL plasma was taken as the IS to determine ketotifen, olopatadine, and cetirizine. Furthermore, ketotifen 50 mg/mL was used as the IS for the determination of ibudilast. The linearity for the above-cited drugs was the set range from 1–100 mg/mL, and the detection limit was fixed to 0.5 mg/mL for plasma [59].

7.2.2. Chiral

Nowadays, due to continuous development in analytical techniques, liquid chromatography has become the first choice for chiral separation. The main reason is its large number of applications, such as simple, selective, efficient, and reproducible results. The vast availability of a range of chiral stationary phases (CSPs) further boosted the good reputation of chiral HPLC methods in the area of enantiomeric separation of drugs and pharmaceuticals. Different CSPs are available on the market based on different chiral selectors, i.e., polysaccharides, cyclodextrins, antibiotics, proteins, macrocyclic glycopeptides, ligand exchangers, crown ethers, Pirkle’s types, etc.) [60,61,62]. Comparative to all the above chiral selectors, polysaccharide CSPs are showing tremendous remarkable results due to their selective, sensitive, and reproducible performances. A fast enantioselective LC-ESI-MS method for assurance of levocetirizine and pseudoephedrine in dog plasma in presence of dextrocetirizine was developed by Ryu and Yoo [63]. The chromatographic separation was performed with an Ultron ES-OVM chiral column using ammonium acetate and acetonitrile (9:1, v/v) as mobile phase. The calibration curves were observed as linear over the concentration range from 1–200 and 5–1000 mg/mL for levocetirizine and pseudoephedrine. This method can effectively opt to carry out pharmacokinetic study after oral administration of the drugs such as pseudoephedrine (12 mg/kg), cetirizine (0.5 mg/kg), and levocetirizine (0.25 mg/kg) in the dog plasma. The LLOQ for levocetirizine is 5.9–15.0% and 7.7–17.9% for pseudoephedrine. Rustichelli et al. [64] introduced a new HPLC method for stereoselective chromatographic separations of terfenadine followed by its active metabolite fexofenadine using the Chiralcel column in the normal phase. Isopropyl alcohol and n-hexane 5:95, v/v containing 0.01% diethylamine were used as the mobile phase with a 0.4 mL/min flow rate and UV detection at 225 nm. Recently, our group, Ali et al. [65], developed enantiomeric separation of drugs such as pheniramine, oxybutynin, cetirizine, and brinzolamide enantiomeric drugs on amylose-based columns. The mobile phase used consisted of n-hexane-2-propanol-DEA (85:15:0.1, v/v) and n-hexane-2-propanol-DEA (70:30:0.2, v/v) for pheniramine and cetirizine on AmyCoat (150 mm × 4.6 mm) and Chiralpak AD (250 mm × 4.6 mm id), separately and respectively. The flow rate was 0.5 mL/min, and detection was achieved at 220 and 225 nm for pheniramine and cetirizine. The retention factors for both drugs were 3.25 and 4.34, and 6.10 and 6.60, respectively. The separation and resolution factors for both drugs were 1.33 and 1.09, and 1.09 and 1.63, respectively. The LOD for pheniramine and cetirizine ranged from 1.0–2.5 ng/mL; LOQ was 5.0–10.0 ng/mL, respectively. The enantiomers -(R) and -(S) of these drugs are well resolved by using Amylose-based columns. The chiral separation of antiallergic drugs is given in (Table 2).
Gokulakrishnanm and Balamurugan [66] achieved the best separation of both enantiomers of Pseudoephedrine Sulfate (UV detection at 254 nm, with a flow rate of 2.0 mL/min) by using an enantiomeric HPLC method on a Chiralpak AD-H column. LOD and LOQ were 0.04% and 0.16%, respectively. This method can be used for the determination of enantiomeric purity of bulk drug pseudoephedrine sulfate. Ozkırımlı et al. [67] developed and validated an HPLC-DAD method for the separation of doxylamine enantiomers using Chiralpak AD-H column, and the mobile phase consisted of n-hexane-2-propanol-diethylamine (98:2:0.025, v/v). Doxylamine was extracted with dichloromethane and hexane from plasma samples 1:2, v/v, and 87% yield. Paris et al. [68] developed an achiral HPLC and two chiral HPLC methods coupled with capillary zone electrophoresis (CZE) to examine in vitro metabolism of racemic flezelastine drug. A Chiralpak AD column was used for the chiral separation, which allowed for the separation of the N-dephenethyl metabolite. Zhou et al. [69] developed a stereoselective method for the enantioseparation of six antihistamines, namely doxylamine, carbinoxamine, dioxopromethazine, cetirizine, oxomemazine, and hydroxyzine. The chiral separation of cetirizine, doxylamine, and hydroxyzine was optimized using the Chiralpak IC column. The mobile phases used for doxylamine, cetirizine, and hydroxyzine were n-Hexane-EtOH-DEA (90:10:0.1, v/v); n-Hexane-IPA-DEA (60:40:0.1, v/v); and n-Hexane-IPA-DEA (90:10:0.1, v/v), separately and respectively. The flow rate was set at 0.8 mL/min. Yanru et al. [70] determined pheniramine enantiomers in rat plasma using the enantioselective HPLC-MS-MS method. The Chiralpak AGP column and mobile phase consisted of a 10 mM ammonium acetate buffer (pH 4.5) used for this study. The detection optimized by mass spectrometry and the transitions of m/z 240.97 → 195.84 and 275.21 → 229.85 were monitored for pheniramine and chlorpheniramine, separately. The lower limit of quantification pheniramine enantiomer was 1.0 ng/mL and the concentration range was 1–400 ng/mL. Chromatographic factors such as column temperature, mobile phase additive, flow rate, retention time, and resolution effects were also studied.

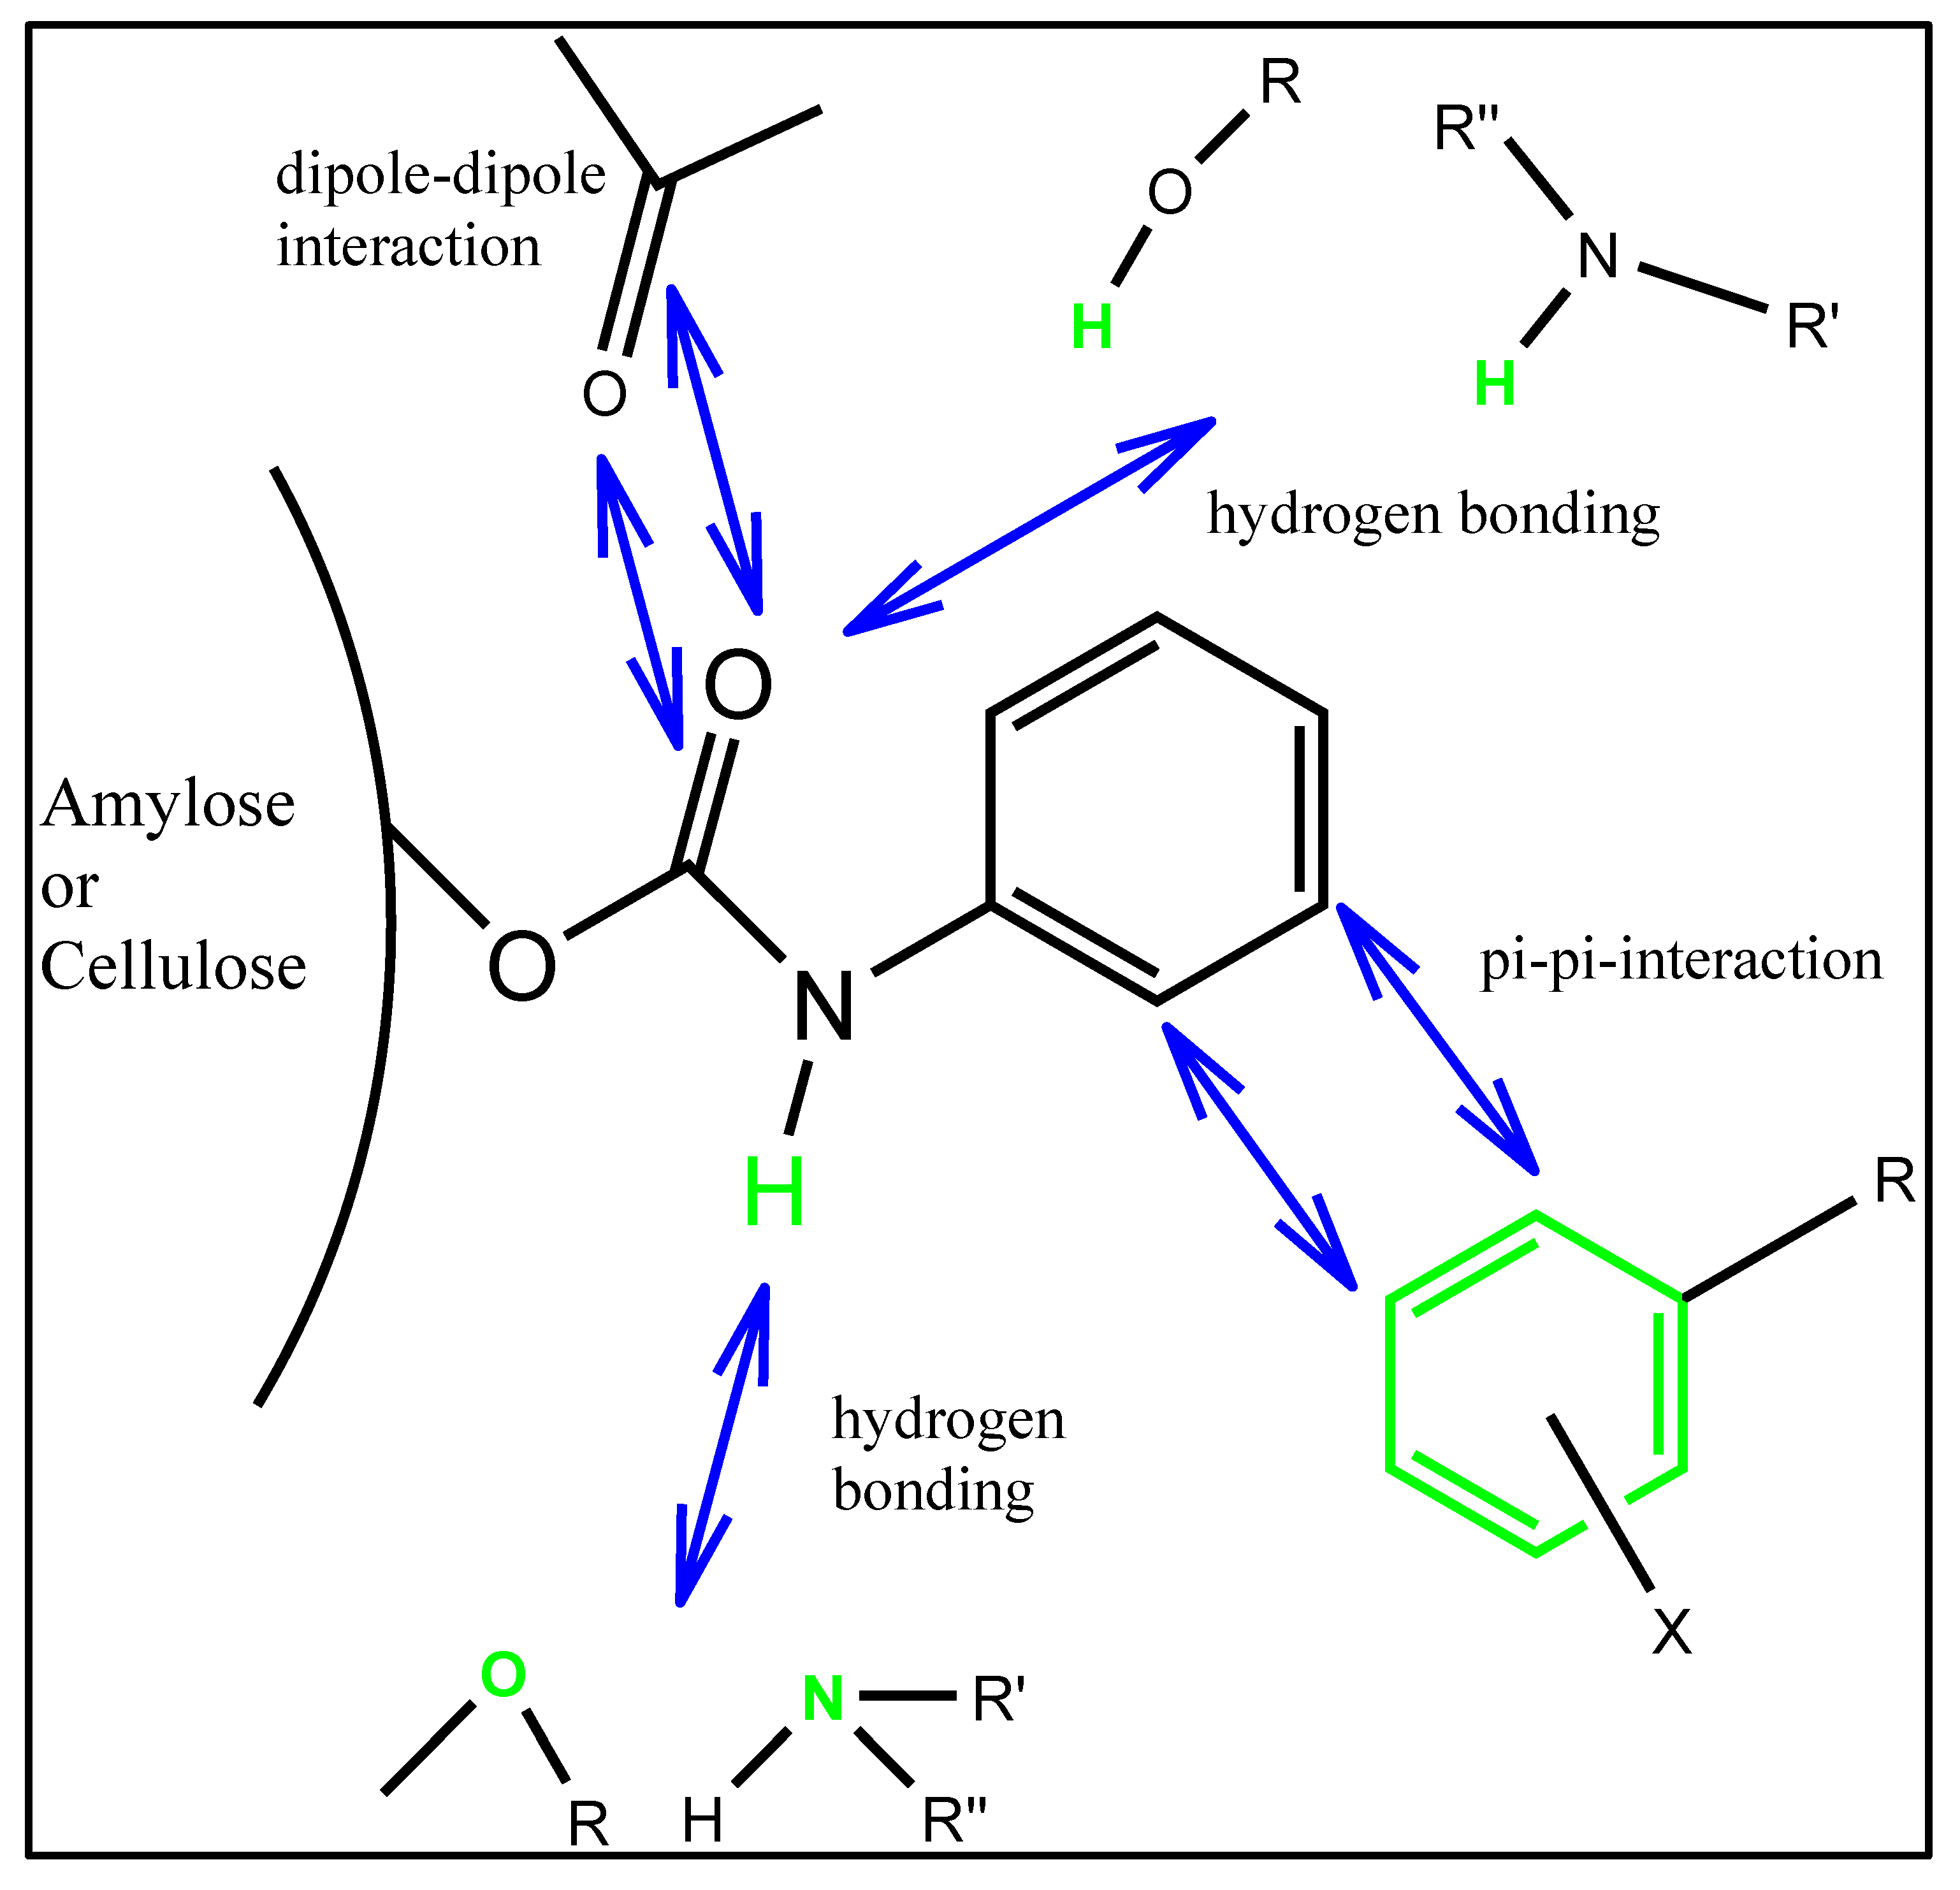
8. Chiral Recognition Mechanism

Chiral separation can be achieved using various chiral selectors such as polysaccharides, cyclodextrins, antibiotics, proteins, macrocyclic glycopeptides, crown ethers, ligand exchangers, Pirkle’s types, etc., but among them, polysaccharide-centered chiral selectors are the top choice of analysts and scientists. Chiral columns such as Chiralpak AD and AmyCoat are both composed of amylose, whose structure is more helical in comparison to cellulose, etc. [65]. The best separation using such a chiral column is achieved because of the existence of chiral grooves inside. In addition to this, the spectroscopic fitting of enantiomers of chiral drugs occurs at different retention intervals. The exact fittings of the drug enantiomers occur because of the interaction of various forces such as hydrogen bonding, π-π interactions, steric effects, van der Waal’s forces, etc. (Figure 4). It is the mobile phase that tends to carry out the drug enantiomers together. Therefore, after the struggle between mobile and stationary phases, the weak bonding enantiomer eluted first, as compared to the strongly bonding enantiomer.

9. Future Perspectives

The future of antiallergic drugs is an important factor from a human health perspective. It is crucial to study the pharmacokinetics and thermodynamics of racemic drugs. The simple and chiral profile of antiallergic drugs should be available before prescribing medication. Therefore, it is the demand of people that has compelled scientists to develop some novel chiral HPLC methods for antiallergies. At present, globally, people are excited to know the exact phenomenon of stereoselective bindings of the enantiomers, as well as its impact on humans. In light of the above facts, racemic antiallergics should be replaced by a single enantiomer that is more active than its counterpart, such as levocetirizine, which is an active molecule of racemic cetirizine. Additionally, there are several chiral molecules, as new drug entities are being monitored in phase I and IV clinical trials. Therefore, the current scenario demands the development of chiral-HPLC methodologies for antiallergies.

10. Conclusions

Some papers are available for the determination of chiral antiallergic drugs by HPLC. The separation of antiallergic drugs is well documented, but chiral separation is still a big area to focus. More research work has been required in this area for human welfare. Single-enantiomer (homochiral) drug products should be the main aim of pharmaceutical industries. A homochiral drug (single-enantiomer) is safe and should be prescribed and used. Therefore, there is a need for the development of the chiral-HPLC method for the examination of antiallergic drugs, as it tends to cause racemization in the body. Briefly, all the researchers, scientists, and academicians should focus on the above area and start working together to avail safe, effective, and economic medication to people globally.

Author Contributions

I.A.: Writing—review & editing; S.D.A.: Writing—original draft, Software; R.R.: Writing—original draft; S.A.K.: Writing—original draft, Software; R.A.: Writing—original draft, Software; A.K.J.: Writing—review & editing; H.Y.A.-E.: Writing—review & editing; M.L.: Writing—review & editing. All authors have read and agreed to the published version of the manuscript.

Funding

This research received no external funding.

Data Availability Statement

All data are given in the manuscript.

Conflicts of Interest

The authors declare no conflict of interest.

References

  1. Bielory, L. Ocular allergy overview. Immunol. Allergy Clin. N. Am. 2008, 28, 1–23. [Google Scholar] [CrossRef] [PubMed]
  2. Bielory, L.; Meltzer, E.O.; Nichols, K.K.; Melton, R.; Thomas, R.K.; Bartlett, J.D. An algorithm for the management of allergic conjunctivitis. In Allergy and Asthma Proceedings; Oceanside Publications Inc.: East Providence, Rhode Island, 2013; Volume 34, pp. 408–420. [Google Scholar]
  3. Rogers, C.A.; Wayne, P.M.; Macklin, E.A. Interaction of the onset of spring and elevated atmospheric CO2 on ragweed (Ambrosia artemisiifolia L.) pollen production. Environ. Health Perspect. 2006, 114, 865–869. [Google Scholar] [CrossRef] [PubMed] [Green Version]
  4. Burke, D. What Is an Allergic Reaction. Newsletter Healthline. 2017. Available online: http://www.healthline.com/health/allergies/allergic-reaction#Prevention7 (accessed on 20 January 2023).
  5. Liu, A.H. Hygiene theory and allergy and asthma prevention. Paediatr. Périnat. Epidemiol. 2007, 21, 2–7. [Google Scholar] [CrossRef] [PubMed]
  6. Bielory, L.; Lyons, K.; Goldberg, R. Climate change and allergic disease. Curr. Allergy Asthma Rep. 2012, 12, 485–494. [Google Scholar] [CrossRef]
  7. Blando, J.; Bielory, L.; Nguyen, V.; Diaz, R.; Jeng, H.A. Anthropogenic Climate Change and Allergic Diseases. Atmosphere 2012, 3, 200–212. [Google Scholar] [CrossRef] [Green Version]
  8. Rosario, N.; Bielory, L. Epidemiology of allergic conjunctivitis. Curr. Opin. Allergy Clin. Immunol. 2011, 11, 471–476. [Google Scholar] [CrossRef]
  9. Pitt, A.D.; Smith, A.F.; Lindsell, L. Economic and quality-of-life impact of seasonal allergic conjunctivitis in Oxford shire. Ophthalmic Epidemiol. 2004, 11, 17–33. [Google Scholar] [CrossRef]
  10. Jacobson, M.Z. Enhancement of Local Air Pollution by Urban CO2 Domes. Environ. Sci. Technol. 2010, in press. [Google Scholar] [CrossRef]
  11. Ziska, L.H.; Epstein, P.R.; Rogers, C.A. Climate change, aerobiology and public health in the Northeast United States. Mitig. Adapt. Strateg. Glob. Chang. 2008, 13, 607–613. [Google Scholar] [CrossRef]
  12. Food Allergy: American College of Allergy, Asthma & Immunology. Available online: http://acaai.org/allergies/types/food-allergies (accessed on 20 January 2023).
  13. American Lung Association. Trends in Asthma Morbidity and Mortality. 2011. Available online: http://www.lung.org/finding-cures/our-research/epidemiology-and-statistics-rpts.html (accessed on 20 January 2023).
  14. Lee, A.J.; Thalayasingam, M.; Lee, B.W. Food allergy in Asia: How does it compare? Asia Pac. Allergy 2013, 3, 3–14. [Google Scholar] [CrossRef] [Green Version]
  15. Nwaru, B.I.; Hickstein, L.; Panesar, S.S.; Roberts, G.; Muraro, A.; Sheikh, A. Prevalence of common food allergies in Europe: A systematic review and meta-analysis, on behalf of the EAACI Food Allergy and Anaphylaxis Guidelines Group. Allergy 2014, 69, 992–1007. [Google Scholar] [CrossRef]
  16. Mullins, R.J.; Clark, S.; Wiley, V.; Eyles, D.; Camargo, C.A., Jr. The Economic Impact of Allergic Disease in Australia: Not to Be Sneezed at; ASCIA/Access Economics Report; Access Economics: Sydney, Australia, 2007. [Google Scholar]
  17. Mullins, R.J.; Dear, K.; Tang, M.L. Characteristics of childhood peanut allergy in the Australian Capital Territory 1995–2007. J. Allergy Clin. Immunol. 2009, 123, 689–693. [Google Scholar] [CrossRef]
  18. Liew, W.K.; Williamson, E.; Tang, M.L. Anaphylaxis fatalities and admissions in Australia. J. Allergy Clin. Immunol. 2009, 123, 434–442. [Google Scholar] [CrossRef]
  19. Osborne, N.J.; Koplin, J.J.; Martin, P.E.; Gurrin, L.C.; Lowe, A.J.; Matheson, M.C.; Ponsonby, A.L.; Wake, M.; Tang, M.L.; Dharmage, S.C.; et al. Health Nuts Investigators. Prevalence of challenge-proven IgE-mediated food allergy using population-based sampling and predetermined challenge criteria in infants. J. Allergy Clin. Immunol. 2011, 127, 668–676. [Google Scholar] [CrossRef]
  20. Swarte, D.R. Drug allergy—Problems and strategies. J. Allergy Clin. Immunol. 1984, 74, 209–221. [Google Scholar]
  21. ASCIA Allergy in Australia A Submission for Allergic Diseases to be Recognized as a National Health Priority Area; ASCIA: Brookvale, NSW, Australia, 2014; pp. 1–15.
  22. Centers for Disease Control and Prevention. Fast Stats A to Z; CDC, National Center for Health Statistics: Hyattsville, MD, USA, 2009.
  23. Soni, A. Allergic rhinitis: Trends in use and expenditures, 2000 to 2005. In Statistical Brief #204; Agency for Healthcare Research and Quality: Rockville, MD, USA, 2008. [Google Scholar]
  24. AAFA, Allergy Facts and Figures. Asthma and Allergy Foundation of America. The Oldest Asthma and Allergy Patient Group in the World. Available online: http://www.aafa.org/display.cfm?id=9&sub=30 (accessed on 6 July 2020).
  25. Staudt, A.; Glick, P.; Mizejewski, D.; Inkley, D. Extreme Allergies and Global Warming; National Wild Life Federation: Reston, VA, USA; Asthma and Allergy Foundation of America: Landover, MD, USA, 2010. [Google Scholar]
  26. Moscato, G.; Vandenplas, O.; Wijk, R.G.V.; Malo, J.; Perfetti, L.; Quirce, S.; Walusiak, J.; Castano, R.; Pala, G.; Gautrin, D.; et al. EAACI position paper on occupational rhinitis. Respir. Res. 2009, 10, 1–20. [Google Scholar] [CrossRef] [Green Version]
  27. Galli, S.J.; Mindy, T.; Piliponsky, A.M. The development of allergic inflammation. Nature 2008, 454, 445–454. [Google Scholar] [CrossRef] [Green Version]
  28. Karasuyama, H.; Mukai, K.; Tsujimura, Y.; Obata-Ninomiya, K. Newly discovered roles for basophils: A neglected minority gains new respect. Nat. Rev. Immunol. 2009, 9, 9–13. [Google Scholar] [CrossRef]
  29. Sullivan, B.M.; Locksley, R.M. Basophils: A non redundant contributor to host immunity. Immunity 2009, 30, 12–20. [Google Scholar] [CrossRef] [Green Version]
  30. Zhang, Z.; Pawliszyn, J. Headspace Solid-Phase Microextraction. J. Anal. Chem. 1993, 65, 1843–1852. [Google Scholar] [CrossRef]
  31. Zhang, Z.; Yang, M.J.; Pawliszyn, J. Solid-phase micro-extraction. A Solvent-Free Alternative for Sample Preparation. J. Anal. Chem. 1994, 66, 844A–853A. [Google Scholar] [CrossRef]
  32. Sabik, H.; Cooper, S.; Lafrance, P.; Fournier, J. Determination of atrazine, its degradation products and metolachlor in runoff water and sediments using solid-phase extraction. Talanta 1995, 42, 717–724. [Google Scholar] [CrossRef] [PubMed]
  33. Chiron, S.; Dupas, S.; Scribe, P.; Barcelo, D. Application of on-line solid-phase extraction followed by liquid chromatogaraphy- thermospray mass spectrometry to the determination of pesticides in environmental waters. J. Chromatogr. A 1994, 665, 295–305. [Google Scholar] [CrossRef]
  34. Kealey, D.; Haines, P.J. Instant notes Analytical Chemistry. In BIOS Instant Notes in Analytical; BIOS Scientific Publishers Ltd.: Milton Park, UK, 2002. [Google Scholar]
  35. Hawthorne, S.B.; Miller, D.J.; Krieger, M.S. Coupled SFE-GC: A Rapid and Simple Technique for Extracting, Identifying, and Quantitating Organic Analytes from Solids and Sorbent Resins. J. Chromatogr. Sci. 1989, 27, 347–354. [Google Scholar] [CrossRef]
  36. Aboul-Enein, H.Y.; Ali, I. A comparison of chiral resolution of econazole, miconazole and sulconazole by HPLC using normal phase amylose CSPs. Fres. J. Anal. Chem. 2001, 370, 951–955. [Google Scholar] [CrossRef] [PubMed]
  37. Aboul-Enein, H.Y.; Ali, I.; Simons, C.; Gubitz, G. Enantiomeric resolution of the novel aromatase inhibitors by HPLC on cellulose and amylose based reversed and chiral stationary phases. Chirality 2000, 12, 727–733. [Google Scholar] [CrossRef] [PubMed]
  38. Dewani, A.P.; Shelke, P.G.; Bakal, R.L.; Jaybhaye, S.S.; Chandewar, A.V.; Patra, S. Gradient HPLC-DAD Determination of Paracetamol Phenylephrine Hydrochloride, Cetirizine in Tablet Formulation. Drug Res. 2014, 64, 251–256. [Google Scholar] [CrossRef]
  39. Sher, N.; Siddiqui, F.A.; Hasan, N.; Shafi, N.; Zubair, A.; Mirza, A.Z. Simultaneous determination of antihistamine antiallergic drugs, cetirizine, domperidone, chlorphenamine maleate, loratadine, meclizine and buclizine in pharmaceutical formulations, human serum and pharmacokinetics application. Anal. Methods 2014, 6, 2704–2714. [Google Scholar] [CrossRef]
  40. Borges, P.F.; Lozano, P.P.; Montoya, E.G.; Miñarro, M.; Ticó, J.R.; Jo, E.; Negre JM, S. Determination of stress-induced degradation products of cetirizine dihydrochloride by a stability-indicating RP-HPLC method. DARU J. Pharm. Sci. 2014, 22, 82. [Google Scholar] [CrossRef]
  41. Souri, E.; Hatami, A.; Ravari, N.S.; Alvandifar, F.; Tehrani, M.B. Validating a Stability Indicating HPLC Method for Kinetic Study of Cetirizine Degradation in Acidic and Oxidative Conditions. Iran. J. Pharm. Res. 2013, 12, 287–294. [Google Scholar]
  42. Kumar, A.; Sharma, R.; Nair, A.; Saini, G. Development and Validation of RP-HPLC Method for Simultaneous Estimation of Nimesulide, Phenylephrine Hydrochloride, Chlorpheniramine Maleate and Caffeine anhydrous in Pharmaceutical dosage form. Acta. Pol. Pharm. Drug Res. 2012, 69, 1017–1022. [Google Scholar]
  43. Sujana, K.; Sankar, D.G.; Abbulu, K.; Souri, O.B. New validated RP-HPLC method for the determination of fexofenadine in bulk and dosage form. Der Pharm. Lett. 2012, 4, 1005–1009. [Google Scholar]
  44. Trivedi, R.K.; Patel, M.C.; Jadhav, S.B. A Rapid, Stability Indicating RP-UPLC Method for Simultaneous Determination of Ambroxol Hydrochloride, Cetirizine Hydrochloride and Antimicrobial Preservatives in Liquid Pharmaceutical Formulation. Sci. Pharm. 2011, 79, 525–543. [Google Scholar] [CrossRef] [Green Version]
  45. Sivasubramanian, L.; Lakshmi, K.S. Reverse phase-high performance liquid chromatographic method for the analysis of paracetamol, cetirizine and pseudoephedrine from tablets. Der Pharm. Chem. 2009, 1, 37–46. [Google Scholar]
  46. Karakus, S.; Kucukguzel, I.; Kucukguzel, S.G. Development and validation of a rapid RP-HPLC method for the determination of cetirizine or fexofenadine with pseudoephedrine in binary pharmaceutical dosage forms. J. Pharm. Biomed. Anal. 2008, 46, 295–302. [Google Scholar] [CrossRef]
  47. El-Sherbiny, D.T.; El-Enany, N.; Belal, F.; Hansen, S.H. Simultaneous determination of loratadine and desloratadine in pharmaceutical preparations using liquid chromatography with a micro emulsion as eluent. J. Pharm. Biomed. Anal. 2007, 43, 1236–1242. [Google Scholar] [CrossRef]
  48. Fujimaki, K.; Xiao-Pen, L.; Kumazawa, T.; Sato, J.; Sato, K. Determination of some antiallergic drugs in human plasma by direct-injection high-performance liquid chromatography-tandem mass spectrometry. Forensic Toxicol. 2006, 24, 8–16. [Google Scholar] [CrossRef]
  49. Songa, Q.; Junga, H.; Tang, Y.; Li, A.C.; Addison, T.; McCort-Tipton, M.; Beato, B.; Naidong, W. Automated 96-well solid phase extraction and hydrophilic interaction liquid chromatography-tandem mass spectrometric method for the analysis of cetirizine (ZYRTEC®) in human plasma-with emphasis on method ruggedness. J. Chromatogr. B 2005, 814, 105–114. [Google Scholar] [CrossRef]
  50. Qia, M.; Wang, P.; Geng, Y. Determination of desloratadine in drug substance and pharmaceutical preparations by liquid chromatography. J. Pharm. Biomed. Anal. 2005, 38, 355–359. [Google Scholar] [CrossRef]
  51. Liu, L.; Qi, M.; Wang, P.; Li, H. High-performance liquid chromatographic method for the bioequivalence evaluation of desloratadine fumarate tablets in dogs. J. Pharm. Biomed. Anal. 2004, 34, 1013–1019. [Google Scholar] [CrossRef]
  52. Jaber, A.M.Y.; Al-Sherife, H.A.; Al-Omari, M.M.; Badwan, A.A. Determination of cetirizine dihydrochloride, related impurities and preservatives in oral solution and tablet dosage forms using HPLC. J. Pharm. Biomed. Anal. 2004, 36, 341–350. [Google Scholar] [CrossRef] [PubMed]
  53. Kunicki, P.K. Determination of loratadine in human plasma by high-performance liquid chromatographic method with ultraviolet detection. J. Chromatogr. B 2001, 755, 331–335. [Google Scholar] [CrossRef] [PubMed]
  54. Prathyusha, P.; Sundararajan, R.; Bhanu, P.; Mukthinuthalapati, M.A. A new stability indicating RP-HPLC method for determination of Bilastine in bulk and pharmaceutical formulation. Res. J. Pharm. Technol. 2020, 13, 2849. [Google Scholar] [CrossRef]
  55. Patel, S.H.I.T.A.L.; Pasha, T.Y. Stability-Indicating High-Performance Liquid Chromatography method for determination of antihistamine drug azelastine. Asian J. Pharm. Clin. Res. 2018, 11, 248–251. [Google Scholar] [CrossRef]
  56. Alali, F.Q.; Tashtoush, B.M.; Najib, N.M. Determination of ketotifen in human plasma by LC-MS. J. Pharm. Biomed. Anal. 2004, 34, 87–94. [Google Scholar] [CrossRef]
  57. Li, A.C.; Junga, H.; Shou, W.Z.; Bryant, M.S.; Jiang, X.; Naidong, W. Direct injection of solid-phase extraction eluents onto silica columns for the analysis of polar compounds isoniazid and cetirizine in plasma using hydrophilic interaction chromatography with tandem mass spectrometry. Rapid Commun. Mass Spectrom. 2004, 18, 2343–2350. [Google Scholar] [CrossRef]
  58. Chen, X.; Zhong, D.; Liu, D.; Wang, Y.; Han, Y.; Gu, J. Determination of ketotifen and its conjugated metabolite in human plasma by liquid chromatography/tandem mass spectrometry: Application to a pharmacokinetic study. Rapid Commun. Mass Spectrom. 2003, 17, 2459–2463. [Google Scholar] [CrossRef]
  59. Fujita, K.; Magara, H.; Kobayashi, H. Determination of olopatadine, a new antiallergic agent, and its metabolites in human plasma by high-performance liquid chromatography with electrospray ionization tandem mass spectrometry. J. Chromatogr. B 1999, 731, 345–352. [Google Scholar] [CrossRef]
  60. Zeid, A.A.; Alwarthan, A.; Ali, I. Advances in enantiomeric resolution on chiral monolithic phases in liquid chromatography and electrochromatography. J. Sep. Sci. 2014, 37, 1033–1057. [Google Scholar]
  61. Ali, I.; Singh, P.; Aboul-Enein, H.Y.; Sharma, B. Chiral analysis of ibuprofen residues in water and sediment. Anal. Lett. 2009, 42, 1747–1760. [Google Scholar] [CrossRef]
  62. Ali, I.; Alothman, Z.; Nagae, N.; Gaitonde, V.D.; Dutta, K.K. Recent trends in ultrafast HPLC: New generation of superficially porous silica columns. J. Sep. Sci. 2013, 35, 3235–3249. [Google Scholar] [CrossRef]
  63. Ryu, J.K.; Yoo, S.D. Simultaneous Determination of Levocetirizine and Pseudoephedrine in Dog Plasma by Liquid Chromatography-Mass Spectrometry in the Presence of Dextrocetirizine. J. Pharm. Pharmaceut. Sci. 2012, 15, 519–527. [Google Scholar] [CrossRef] [Green Version]
  64. Rustichelli, C.; Gamberini, M.C.; Ferioli, V.; Gamberini, G. Enantioselective Analyses of Antihistaminic Drugs by High-Performance Liquid Chromatography. Chromatographia 2004, 60, 99–103. [Google Scholar] [CrossRef]
  65. Ali, I.; Al-Othman, Z.A.; Al-Warthan, A.; Alam, S.D.; Farooqi, J.A. Enantiomeric Separation and Simulation Studies of Pheniramine, Oxybutynin, Cetirizine and Brinzolamide Chiral Drugs on Amylose Based Columns. Chirality 2014, 26, 136–143. [Google Scholar] [CrossRef]
  66. Gokulakrishnanm, K.; Balamurugan, K. Validated HPLC method for the determination of enantiomeric impurity of d-pseudoephedrine sulfate. Int. J. Appl. Chem. 2009, 5, 85–91. [Google Scholar]
  67. Ozkırımlı, S.; Aboul-Enein, H.Y.; Nesrin, C. Enantioselective Quantification of Doxylamine in Human Plasma by HPLC. J. Liq. Chromatogr. Relat. Technol. 2011, 34, 671–678. [Google Scholar] [CrossRef]
  68. Paris, S.; Blaschke, G.; Locher, M.; Borbe, H.O.; Engel, J. Investigation antiasthmatic/antiallergic liquid chromatography of the stereoselective in vitro metabolism of the chiral drug flezelastine by high-performance and capillary zone electrophoresis. J. Chromatogr. B 1997, 691, 463–471. [Google Scholar] [CrossRef]
  69. Zhou, J.; Luo, P.; Chen, S.; Meng, L.; Sun, C.; Du, Q.; Sun, F. Enantioseparation of Six Antihistamines with Immobilized Cellulose Chiral Stationary Phase by HPLC. J. Chromatogr. Sci. 2016, 54, 531–535. [Google Scholar] [CrossRef] [Green Version]
  70. Yanru, L.; Bolin, Z.; Mengyao, X.; Zhen, J.; Xingjie, G. Studies on the chiral separation of pheniramine and its enantioselective pharmacokinetics in rat plasma by HPLC-MS/MS. Microchem. J. 2020, 156, 104989. [Google Scholar]
Figure 1. Mechanism of action of antiallergic drugs.
Analytica 04 00007 g001
Figure 2. Pictorial presentation of the general allergic pathway (excessive immune response) in humans.
Analytica 04 00007 g002
Figure 3. Chemical structures of antiallergic drugs.
Analytica 04 00007 g003aAnalytica 04 00007 g003bAnalytica 04 00007 g003cAnalytica 04 00007 g003d
Figure 4. Chiral recognition mechanism.
Analytica 04 00007 g004
Table 1. Separation of antiallergics.
S.N.Name of DrugsMobile PhaseColumnOther ConditionsRef
1Phenylephrine hydrochloride, paracetamol, and cetirizine hydrochloride10 mM phosphate buffer (pH 3.3) and acetonitrilePhenomenex Kinetex-C181 mL/min
at 230 nm; recoveries from 101 to 102.40%
[38]
2Chlorphenamine maleate, loratadine, Cetirizine HCl, domperidone, buclizine, and meclizine Heptane sulphonic acid salt buffer in water and MeCNsymmetry C181 mL/min
at 230 nm; LOD from 0.52 ng/mL to 5.16 ng/mL
[39]
3Cetirizine dihydrochloride0.2 M K2HPO4 (pH 7) and ACN (65:35, v/v)Eclipse XDB C81 mL/min
at 230 nm; LOD and LOQ were 0.25 and 0.056 μg/mL
[40]
4Cetirizine dihydrochloride50 mM KH2PO4 and ACN (60:40, v/v)Symmetry C181 mL/min
at 230 nm; LOQ was 1 µg/mL. LOD) was 0.2 µg/mL with recovery of 99%
[41]
5Nimesulide, phenylephrine hydrochloride, caffeine anhydrous, and chlorpheniramine maleateMethanol and buffer (55:45, v/v, pH 5.5)RP-Hypersil phenyl (4.6 mm × 25 cm)1 mL/min
at 214 nm; LOD from 0.45 to 9.34 µg/mL; recovery from 99.03 to 100.30%
[42]
6FexofenadineBuffer and Methanol (30:70, v/v)Symmetry-C18
(150 × 4.6 mm), 5 μm
at 254 nm; LOD = 9.92 ng mL[43]
7Ambroxol hydrochloride, cetirizine hydrochloride, methylparaben, and propylparaben 0.01 M phosphate buffer and 0.1% triethylamine as a solvent-A and ACN as a solvent-B (mixture of both)Agilent Eclipse plus C18 (50 × 2.1 mm), 1.8 μm)at 237 nm; LOQ from 0.12 to 0.18 µg/mL); recovery of more than 99%[44]
8Pseudoephedrine,
Paracetamol, and Cetirizine
25 mM Na2HPO4 (pH 5.0)-MeOH-ACN (30:60:10, v/v)Hypersil C181 mL/min.
at 240 nm; LOD from 0.836 to 2.512
[45]
9Pseudoephedrine,
Fexofenadine, and Cetirizine
TEA solution (0.5%, pH 4.5) MeOH-ACN (50:20:30, v/v)Zorbax-C8 (150 × 4.6 mm) 5 μm 218 and 222 nm; LOD from 0.10 to 1.75 µg/mL; recovery 97.52 to 100.98%[46]
10Desloratadine HCl and
Loratadine
0.1 M SDS, 1% octanol, 10% n-propanol and 0.3% TEA in 0.02 M phosphoric acid, pH 3.0Cyano Propyl bonded stationary-phase1 mL/min
at 247 nm; LOD was 0.8 and 0.2 µg/mL; LOQ was 2.3 and 0.6 µg/mL for both drugs
[47]
11Ketotifen, olopatadine, cetirizine, and ibudilastAcetonitrile-rich mobile phasePolymer column (MSpak GF)0.2 mL/min
at 260 nm; LOD = 0.5 ng/mL; recovery 51.7–95.5%
[48]
12CetirizineACN-water-CH3COOH-TFA (93:7:1:0.025, v/v)Betasil silica (50 × 3, 5 m).0.5 mL/min; recoveries 84.5 to 88.0%[49]
13Desloratadine HClMethanol-0.03 M Heptane sulphonic acid sodium-
Glacial acetic acid (70:30:4, v/v),
Diamonsil BDS C181 mL/min
at 247 nm
[50]
14Desloratadine HClMeOH-ACN-Phosphate buffer 0.01 mol/L (35:35:30, v/v) (pH-5.5)Hypersil CN Column (150 mm × 5 mm), 5 μm0.8 mL/min
at 241 nm; LOQ5.0 ng/mL
[51]
15Cetirizine dihydrochloride0.05 M dihydrogen phosphate-ACN-MeOH-THF(12:5:2:1, v/v)Hypersil BDS C18 (4.6 × 250 mm), 5 µm1 mL/min
at 230 nm; LOD and LOQ were 0.10 and 0.34 µg/mL
[52]
16Loratadine HClACN-water-0.5 M
KH2PO4-H3PO4 (440:480: 80:1, v/v)
Supelcosil LC18-DB column1 mL/min.
at 200 nm; LOQ was 0.5 ng/mL
[53]
17BilastineFormic acid and MeOH(1:1 ratio)Gemini C18 column (150 × 4.6), 5 µm 0.8 ml/min at 282 nm; LOD and LOQ were 0.08931 µg/mL and 0.27063 µg/mL[54]
18AzelastinePotassium dihydrogen phosphate buffer and acetonitrile (50:50, v/v); Spherisorb CN column (250 × 4.6 mm, 5-μm)1.0 mL/min at 290 nm; LOD and LOQ were 0.81 µg/mL and 2.44 µg/mL
Recovery = 99 and 102%
[55]
Table 2. The chiral separation of antiallergic drugs.
S. N.Drug NameMobile PhaseColumnOther ConditionsRef
1Levocetirizine and pseudoephedrine10 mM aqueous NH4OAc and acetonitrile (9:1, v/v)Ultron ES-OVM chiral column1 mL/min;
LOQ for levocetirizine 5.9–15.0% and 7.7–17.9%
for pseudoephedrine
[61]
2Terfenadine and fexofenadineIsopropyl alcohol and n-hexane (5:95, v/v containing 0.01% diethylamine)Chiralcel
(250 mm × 4.6 mm, 5 µm)
0.4 mL/min
at 225 nm
[62]
3Pheniramine and cetirizine2-PrOH-n-Hexane-DEA (15:85:0.1, v/v), and 2-PrOH-n-hexane-DEA (30:70:0.2, v/v)AmyCoat (150 mm × 4 6 mm, 5 µm) and Chiralpak AD (250 × 4.6 mm, 5 µm)0.5 mL/min
at 220 and 225 nm; LOD ranged from 1.0–2.5 ng/mL; LOQ were 5.0–10.0 ng/mL
[63]
4Terfenadine and
active metabolite
fexofenadine
IPA and n-Hexane (5:95, v/v)
containing 0.01% DEA
Chiralcel column0.4 mL/min
at 225 nm
[64]
5pheniramine, oxybutynin, cetirizine, and brinzolamiden-hexane-2-propanol-DEA (85:15:0.1, v/v) and n-hexane-2-propanol-DEA (70:30:0.2, v/v) aAmyCoat (150 mm × 4.6 mm)
Chiralpak AD (250 mm × 4.6 mm id)
0.5 mL/min
at 220 and 225 nm
[65]
6Pseudoephedrine Sulfaten-Hexane- Isopropyl alcohol- ethanol-DEA (980:10:10:1, v/v)Chiralpak AD-H column (250 mm × 4.6 mm, 5 µm)2.0 mL/min at 254 nm; LOD and LOQ were 0.04% and 0.16%[66]
7DoxylamineMobile phase consists of n-hexane-IAP-DEA (98:2:0.025, v/v)Chiralpak AD-H column (250 mm × 4.6 mm, 5 µm)1.0 mL/min
at 262 nm
[67]
8FlezelastineMixture of n-Hexane-IPA-DEA (88:12:0.5, v/v)Chiralpak AD column (250 mm x 4.6 mm, 10 µm)1.0 mL/min
at 292 nm
[68]
9Cetirizine, doxylamine and hydroxyzinen-Hexane-ethanol-DEA (90:10:0.1, v/v); n-hexane-isopropanol-DEA (60:40:0.1, v/v); and n-hexane-isopropanol-DEA (90:10:0.1 v/v)Chiralpak IC column0.8 mL/min
at 227 and 262 nm
[69]
Disclaimer/Publisher’s Note: The statements, opinions and data contained in all publications are solely those of the individual author(s) and contributor(s) and not of MDPI and/or the editor(s). MDPI and/or the editor(s) disclaim responsibility for any injury to people or property resulting from any ideas, methods, instructions or products referred to in the content.

