
Development and Validation of a Simple HPLC-UV Assay Method for Determination of Levetiracetam Concentrations in Human Plasma


Faculty of Pharmacy and Pharmaceutical Sciences, University of Alberta, Edmonton, AB T6G 2E1, Canada
*
Author to whom correspondence should be addressed.
Analytica 2023, 4(1), 1-9; https://doi.org/10.3390/analytica4010001
Submission received: 12 November 2022
/
Revised: 19 December 2022
/
Accepted: 29 December 2022
/
Published: 4 January 2023
(This article belongs to the Collection Analytical and Applied Chemistry: the challenges and opportunities for growth in the 21st century)
Abstract
:Levetiracetam (LEV) is a broad spectrum antiseizure medication that is used in various seizure types. There is evidence that therapeutic drug monitoring (TDM) of LEV is of value in selected patient populations, therefore determination of LEV plasma concentrations is essential. Herein we developed and validated a simple, reproducible, and practical method for the quantification of LEV concentrations in human plasma samples using high performance liquid chromatography (HPLC). Plasma samples (0.3 mL) deproteinization was done using acetonitrile. HPLC chromatographic separation of plasma samples was accomplished by reversed phase C18 column. The mobile phase constituted water and acetonitrile (90:10, v/v) ran at flow rate of 1 mL/min. Signal acquisition was conducted at a wavelength of 192 nm. Calibration curves showed excellent linearity (Correlation coefficient r2 > 0.99) over a concentration range of 3–80 μg/mL. Both inter and intraday assay accuracy and precision were less than 8% (except for the lowest limit of quantification was within 20%). Elution time was 15 min. The developed method excluded the use of buffers and utilized small volumes of plasma samples with simple mobile phase composition. Therefore, our method could be practically applied to routine TDM.
1. Introduction
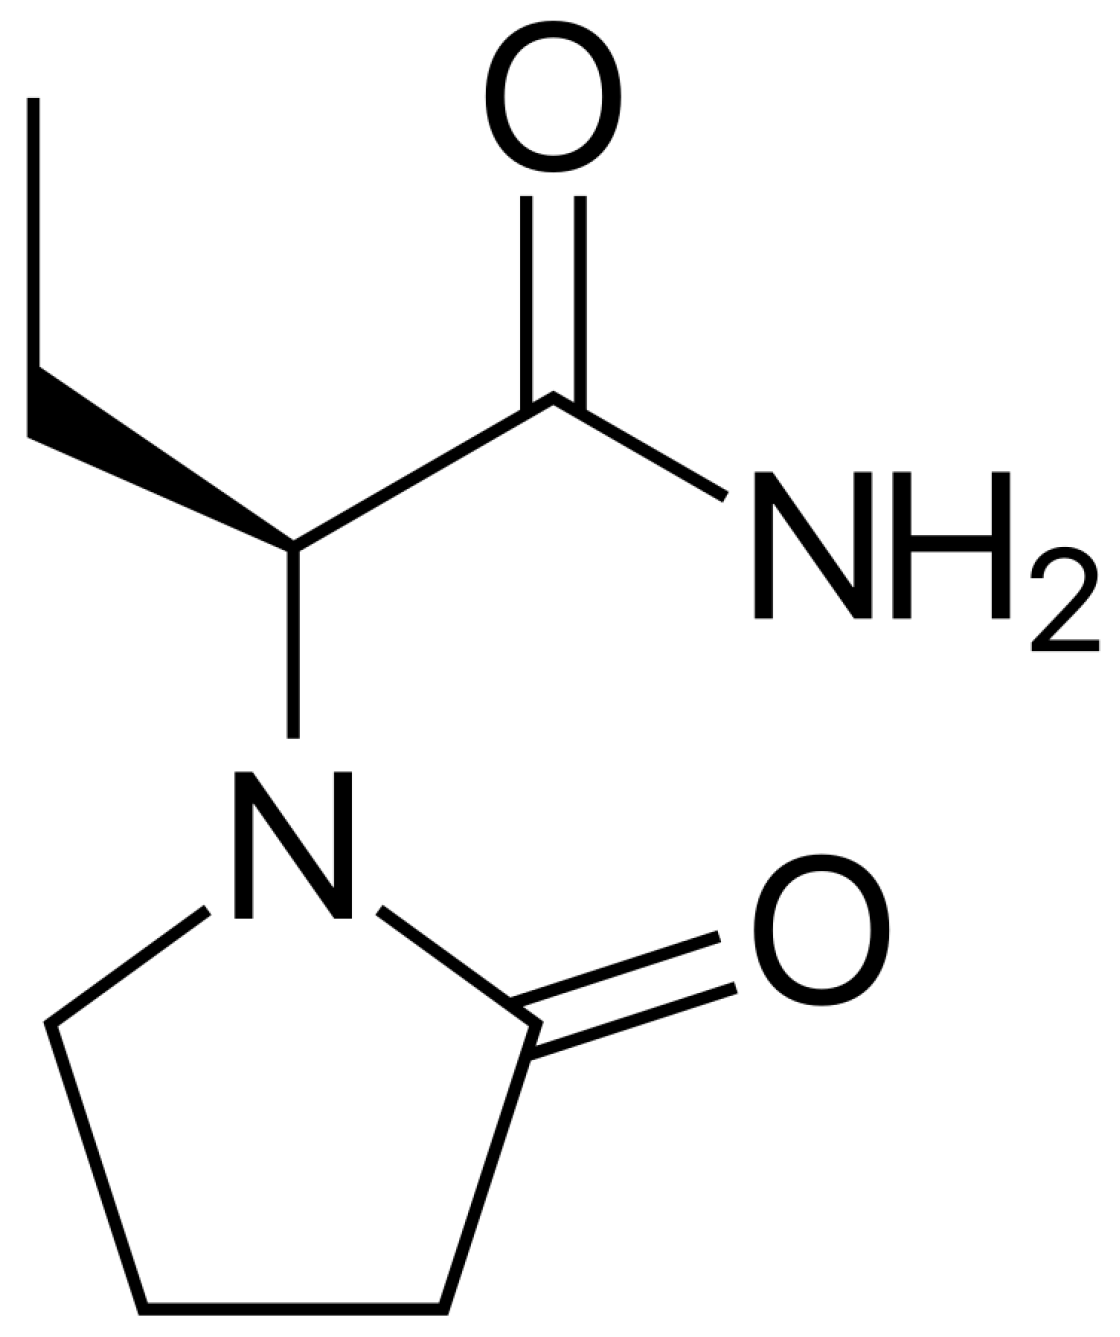
Levetiracetam (LEV), (-)-(S)-α-ethyl-2-oxo-1-pyrrolidine acetamide, is a broad spectrum antiseizure medication (ASM) that is used in various types of seizures, either as monotherapy or in combination with other ASMs (Figure 1) [1]. LEV has a more plausible adverse effect profile and less propensity for drug interactions compared to older ASMs such as phenytoin and valproic acid. As a result, LEV is now in the forefront in epilepsy management across the age spectrum. LEV exhibits a linear pharmacokinetic profile, rapidly absorbed with relatively complete absorption after oral administration, apparently low plasma protein binding (<10%), and is renally eliminated (66% as unchanged drug) and metabolized by non-hepatic enzymatic hydrolysis [2]. Additionally, there are no significant interactions between LEV and the other ASMs since LEV disposition is independent on the human liver cytochrome P450 enzymes [3]. Although LEV has predictable pharmacokinetics, LEV therapeutic drug monitoring (TDM) has been suggested in certain patient populations owing to LEV pharmacokinetic alterations, particularly in patients with renal impairment, children, older adults, pregnant women and those who are critically ill [4,5]. The suggested reference plasma concentration range for LEV has been reported to range from 12 to 46 µg/mL [4]. Accordingly, quantification of LEV plasma concentrations is crucial for TDM. Herein, we developed a reproducible, simple, and sensitive high performance liquid chromatography with ultra-violet detection (HPLC-UV) method for LEV quantification in human plasma samples, enabling this analytical method suitable for pharmacokinetic and research studies. Our method employed a single plasma protein precipitation step, utilized small plasma sample volume (0.3 mL) as compared to 0.5–1 mL sample volume in most methods [6,7,8,9,10], and used a simple water/acetonitrile mixture for mobile phase, compared to buffers in the majority of methods [6,7,8,10,11,12,13,14,15,16]. Moreover, our developed method quantifies LEV throughout a range of 3–80 μg/mL that covers the suggested reference range (12–46 μg/mL) for LEV TDM.
2. Materials and Methods
2.1. Chemicals and Reagents
Levetiracetam (purity > 98%) and caffeine (purity ≥ 99%), internal standard (IS), were obtained from Fisher Scientific Company (Ottawa, ON, Canada), HPLC-grade acetonitrile and HPLC-grade water were obtained from Sigma-Aldrich (Oakville, ON, Canada), and blank human plasma was obtained from Cedarlane Laboratories (Burlington, ON, Canada).
2.2. Instrument
The experiment was conducted using a Shimadzu HPLC system (Shimadzu, Kyoto, Japan) consisting of two solvent delivery pumps (LC-10 ADvp), SIL-HTc autosampler and system controller coupled to a UV-Vis detector (SPD-10 AV). The HPLC chromatographic separation was performed using a reverse phase Supleco Discovery® C18 column (5 μm, 250 × 4.6 mm) (Supleco Inc., Mississauga, ON, Canada) with a Discovery® C18 Supelguard™ guard column (5 μm, 20 × 4 mm) (Supleco Inc., Mississauga, ON, Canada). Clarity® software version 8.7 (DataApex, Prague, The Czech Republic) was used for acquisition of data and analysis integration.
2.3. Chromatographic Conditions
A mobile phase mixture of water and acetonitrile (90:10, v/v) and an isocratic elution with a flow rate set to 1 mL/min was used for eluting LEV and caffeine (IS). The total run time for elution was 15 min. The wavelength for detection was 192 nm. The column and the autosampler were operating at room temperature.
2.4. Preparation of Standard and Working Solutions
LEV and caffeine were dissolved in water to prepare a 1 mg/mL standard stock solutions. Working solutions of 100 μg/mL and 350 μg/mL of LEV and caffeine, respectively, were produced by further diluting the stock solutions with HPLC grade water. The stock and working solutions were freshly prepared daily.
2.5. Preparation of Calibration Concentrations and Quality Control (QC) Samples
We prepared serial dilutions of LEV concentrations in blank plasma samples to generate calibration curves. LEV concentrations ranged from 3 to 80 μg/mL. We prepared 4 QC samples for method validation: low limit of quantification sample (LLOQ), low level QC sample (LQC), middle level QC sample (MQC; within the middle range of calibration concentrations) and high level QC sample (HQC; close to the upper end of calibration concentrations).
2.6. Sample Preparation
A total of 300 μL of plasma samples were mixed with 50 μL of 350 μg/mL caffeine (IS). Plasma samples were vortexed for 1 min. Then, 3 mL of acetonitrile were added to the samples for protein precipitation followed by vortex mixing for 5 min. Samples were then centrifuged at 4000 rpm for 20 min at 4 °C. The supernatant was then transferred to clean tubes and evaporated using a SpeedVac® Vacuum Concentrator (Thermo Fisher Scientific, Waltham, MA, USA). Reconstitution of the residue was made using a 350 μL mobile phase (water: acetonitrile, 90:10, v/v) and vortex mixed for 10 s. A 40 μL of each sample was then injected into the HPLC.
2.7. Method Validation
The developed method was validated according to the guidelines on bioanalytical method validation by the European Medicines Agency (EMA, 2011) [17]. We evaluated the method’s linearity, selectivity, sensitivity, precision, accuracy, carry-over effect, dilution integrity, stability and extraction recovery.
2.7.1. Linearity
For method’s linearity assessment, calibration curves were constructed by plotting the peak area ratios (LEV/internal standard) vs. the concentrations of the calibration standards (3, 10, 20, 40, 60, and 80 μg/mL). Linear regression was utilized to determine the calibration curve parameters: the slope, intercept, and the correlation coefficient (r2).
2.7.2. Selectivity and Sensitivity
We confirmed method selectivity by the absence of any peaks at the analyte and IS retention times when we injected blank plasma samples. The LLOQ is the lowest concentration within the calibration curve that has a precision < 20%, accuracy within ±20% and its signal is at least 5 times higher than that of blank plasma.
2.7.3. Precision and Accuracy
We determined the precision and accuracy of our method by injecting five replicates of QC samples that were spiked with LEV at four different QC levels (3, 30, 50 and 70 μg/mL), conducted over three consecutive days (3 separate runs). The method’s precision was expressed as coefficient of variation (CV, %), whereas the accuracy was described as percentage error. We then determined the intra and interday precision and accuracy of the method.
2.7.4. Carry-Over
Carry-over was evaluated by injecting human blank plasma following the ULOQ. EMA guidelines acceptability criterion for carry-over was that the carry-over in the injected blank sample preceded by the ULOQ should not exceed 5% of the IS signal and 20% of LLOQ signal.
2.7.5. Dilution Integrity
To investigate method’s dilution integrity, we diluted a spiked plasma sample using blank plasma sample matrix with a 15-fold concentration. The accuracy and precision should be within ±15% for an acceptable dilution integrity.
2.7.6. Stability
We determined the stability of samples by comparing the results of freshly prepared samples (60 μg/mL, n = 5) analyzed prior and following exposure to different conditions. The stability conditions mimicked similar conditions for sample handling, storage and analysis. We assessed the stability of LEV in human plasma at room temperature (for 8 h and for 30 days), and at −80 °C for 30 days. We also assessed 3 cycles of freeze–thaw sample stability. Each cycle involved freezing for 24 h followed by thawing at room temperature and then the cycle gets repeated. Storage stability of the stock solution was also evaluated at 4 and −80 °C. A stability to reference samples ratio within 85 and 115% and a percent error within ±15% were considered acceptable. Moreover, reinjection stability was also assessed 24 h after the initial injection.
2.7.7. Recovery
The developed method’s average extraction recovery of LEV was assessed by comparing the peak areas of the 5 replicates of extracted samples at the 3 QC levels with the peak areas obtained from extracted human blank plasma (same extraction procedures) that were spiked with equivalent concentrations of LEV after extraction.
3. Results
3.1. Optimization of Chromatographic Conditions
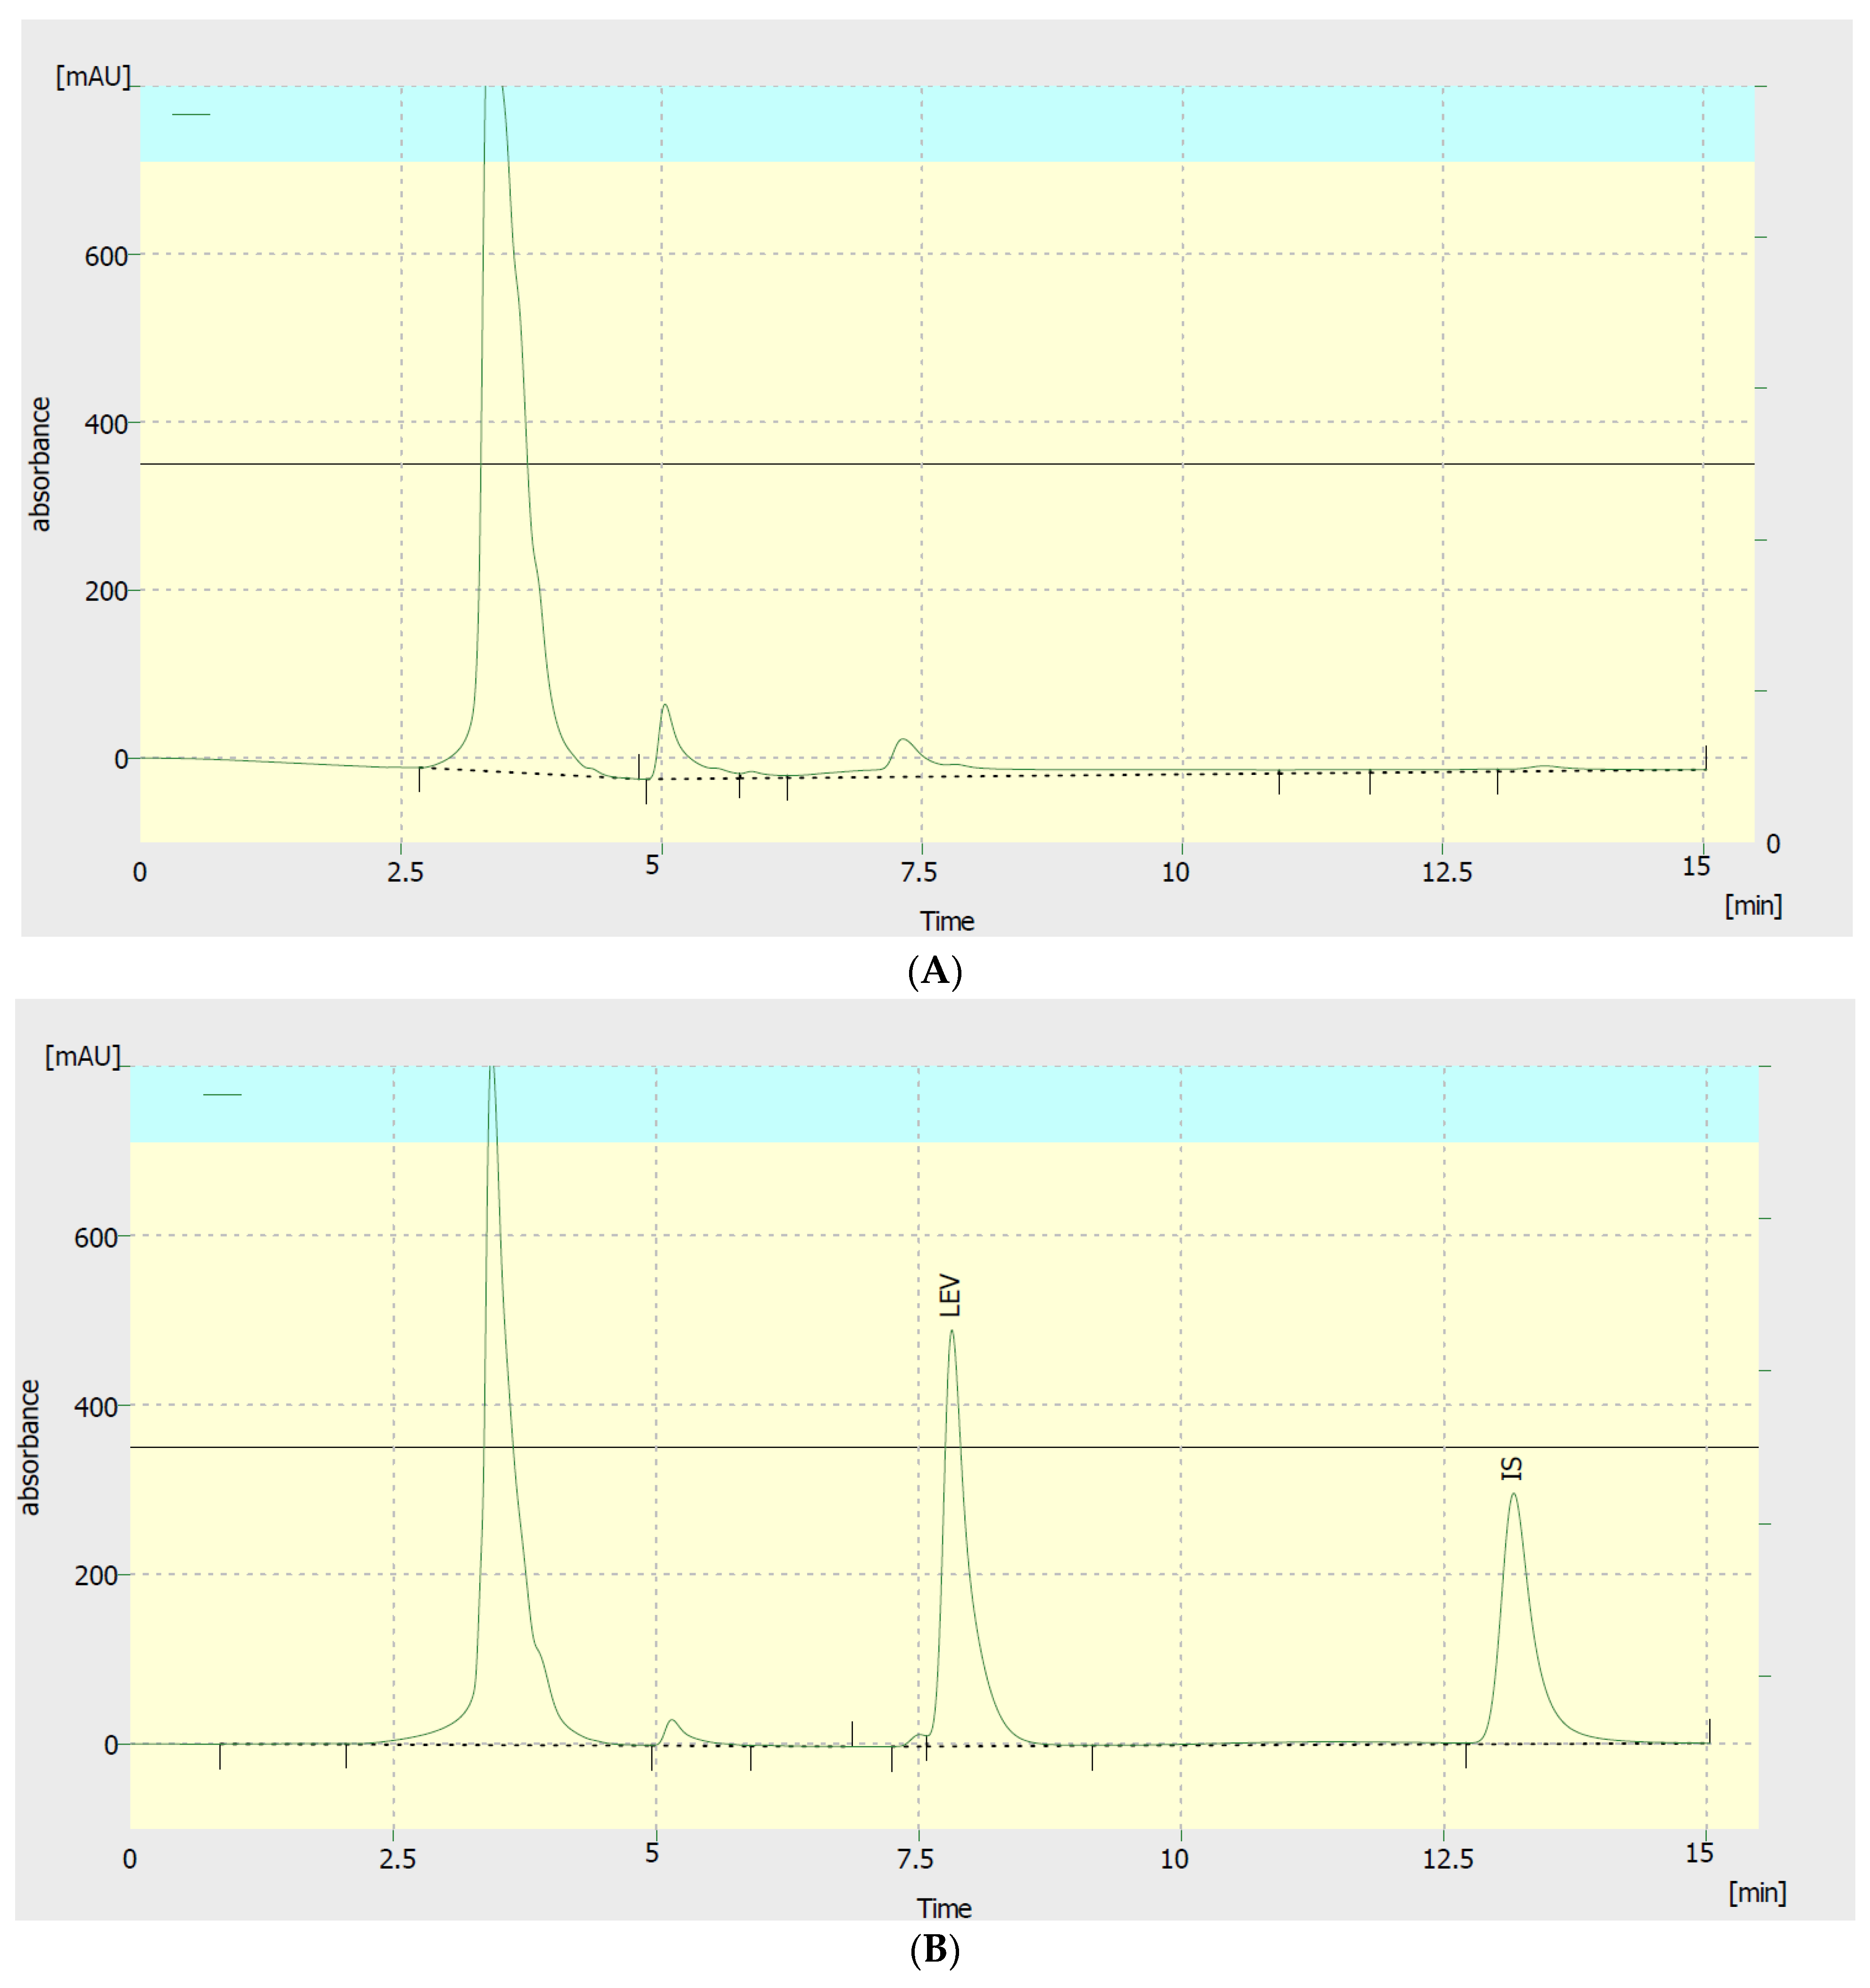
To optimize our method, we evaluated the efficiency of two extracting solvents, different solvent volumes, various detection wavelengths, and diverse mobile phase compositions. To improve the separation of LEV peak, the following mobile phase compositions were tested: 90:10, 70:30, 50:50, 40:60, 20:80, and 10:90, v/v acetonitrile:water. The mobile phase composition of 10:90 acetonitrile:water v/v showed the best separation and peak intensity. The resultant retention times for LEV and IS were 7.8 and 13.2 min, respectively (Figure 2). Nonetheless, plasma non-interfering peaks were also present in the chromatogram. However, excellent linearity calibration curves were achieved. To further enhance peak intensity, we evaluated 5 different detection wavelengths: 190, 192, 195, 200, and 205 nm. Among them, the 192 nm gave the highest peak intensity for LEV plasma samples. Regarding sample extraction, two solvents and 2 different volumes were tested, acetonitrile and methanol, either 1.5 or 3 mL. Acetonitrile 3 mL yielded superior extraction efficiency.
3.2. Method Validation
3.2.1. Linearity
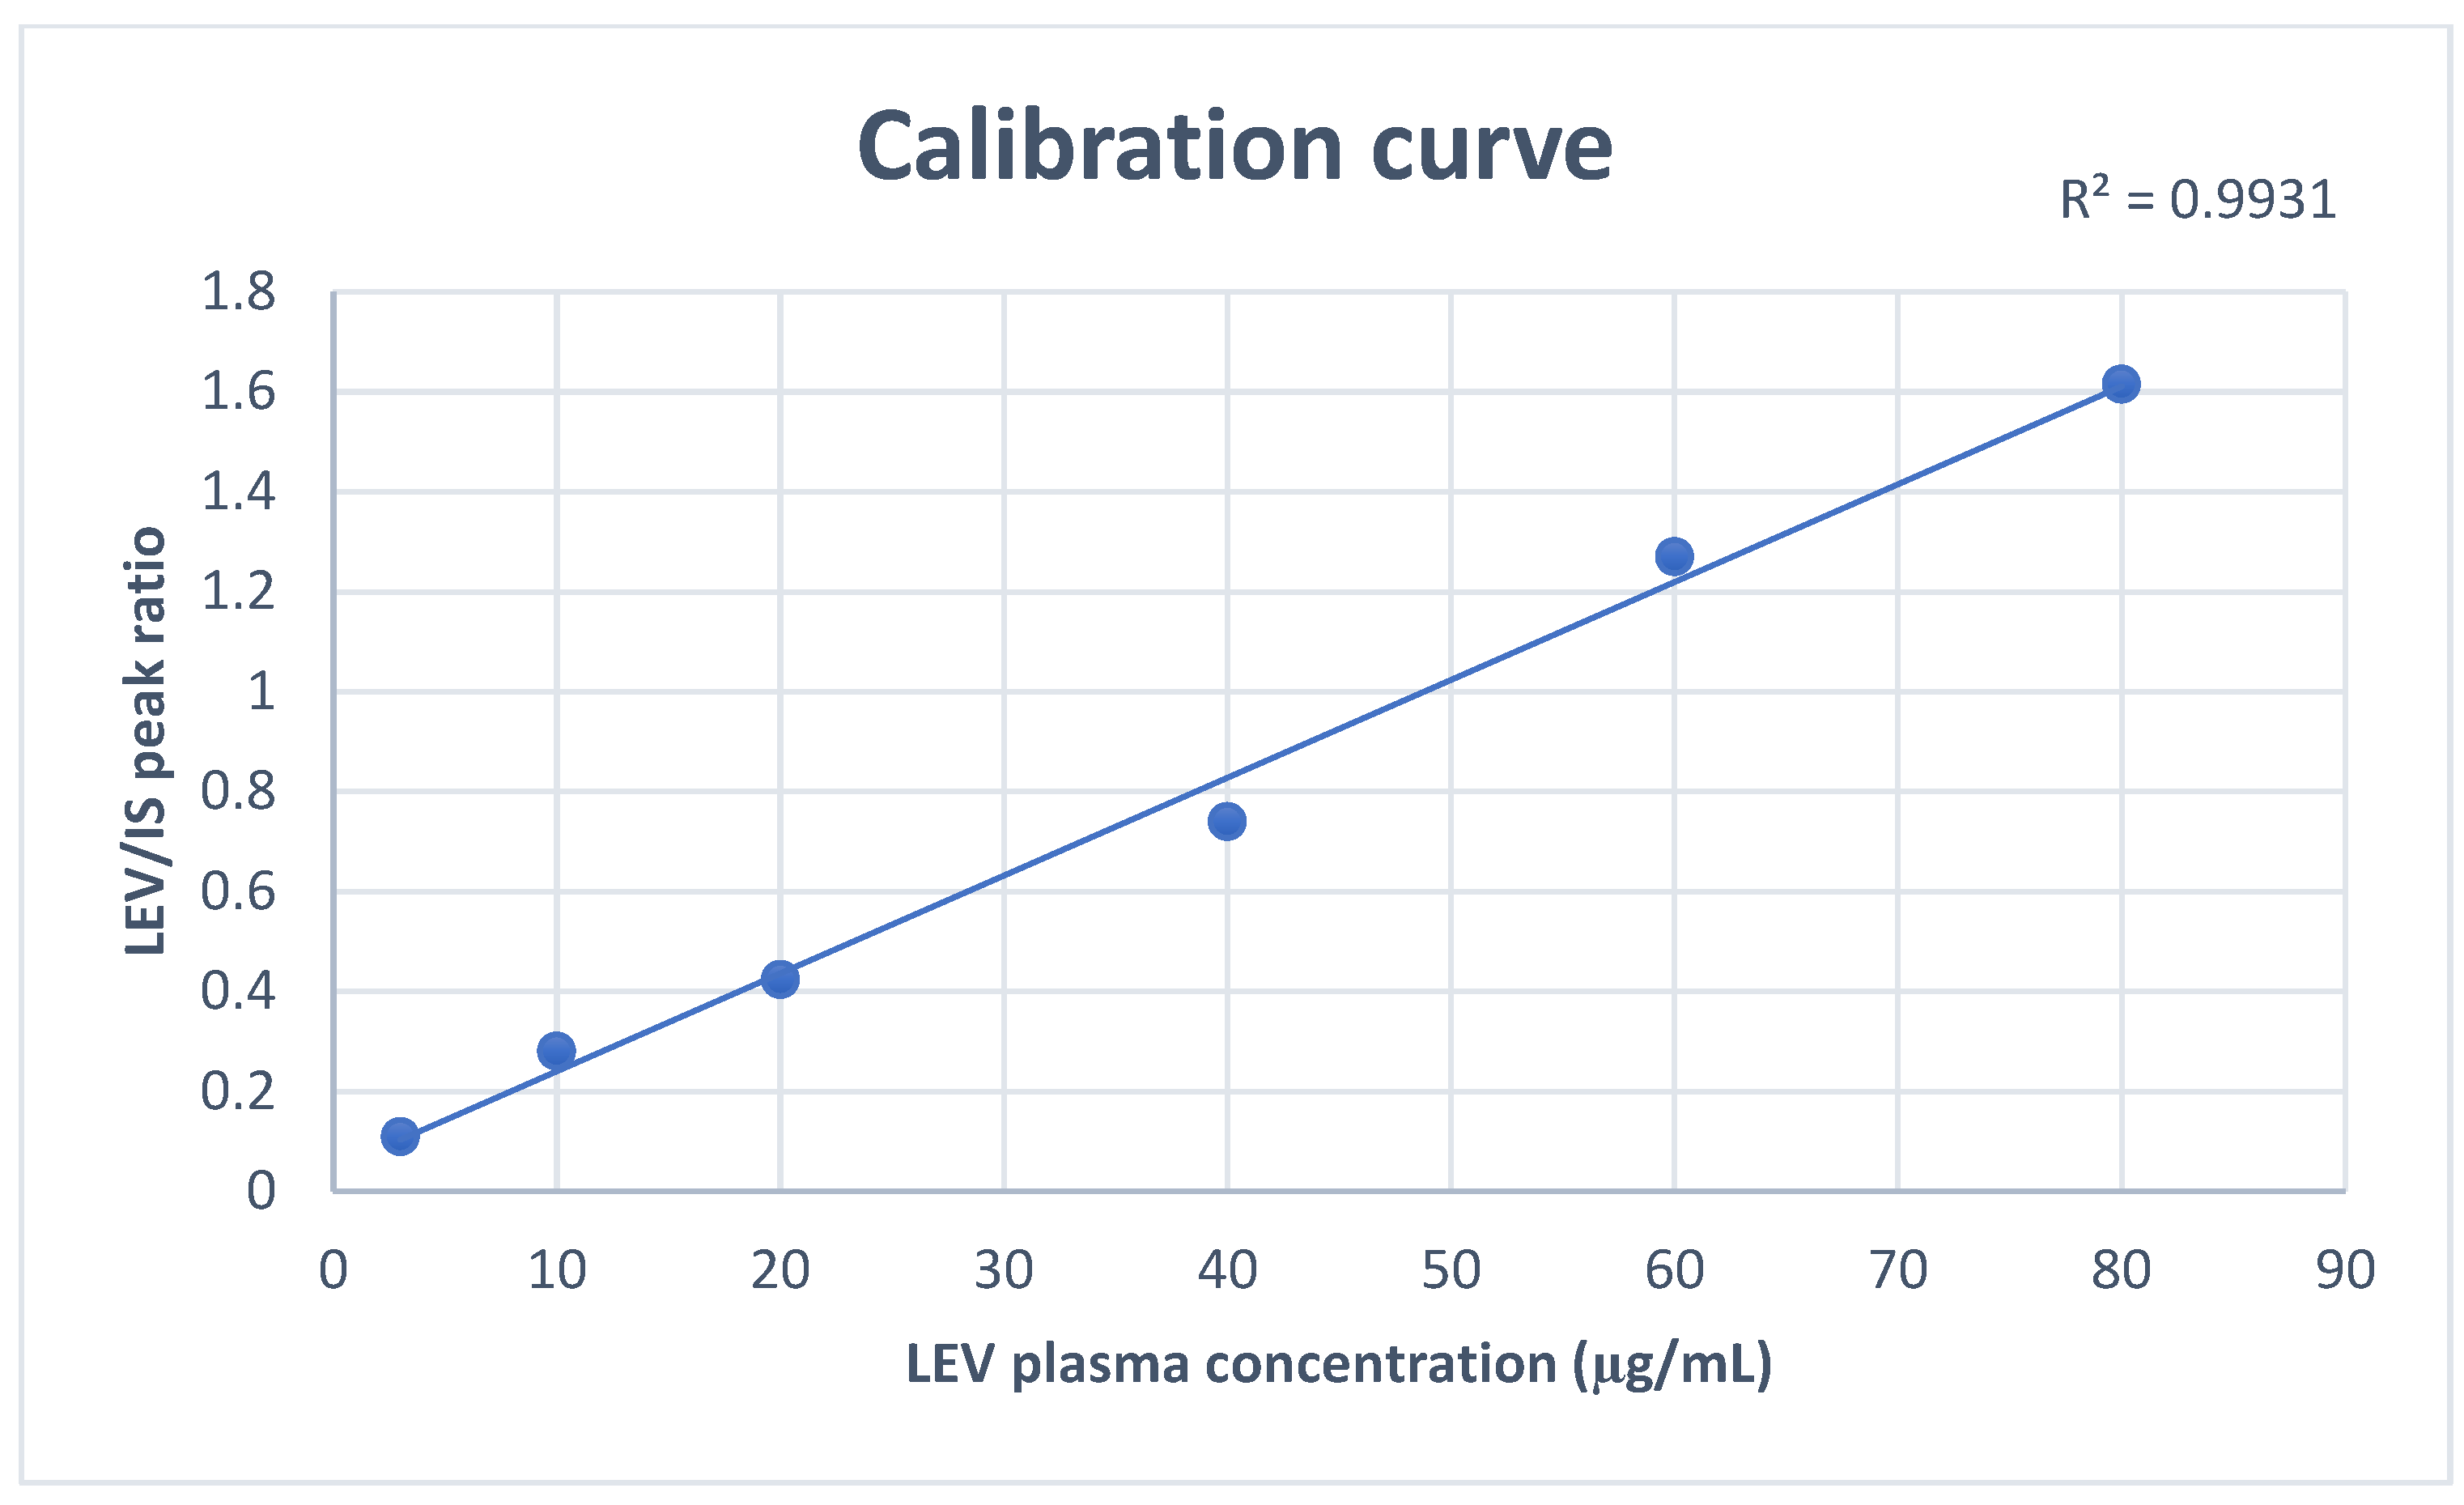
Assessment of method linearity was performed by running extracted and pure samples throughout LEV calibration concentration ranges. The ratios of peak areas of LEV/IS were linear over the calibration ranges (3–80 μg/mL) with correlation factor (r2) > 0.99 (Figure 3).
3.2.2. Selectivity and Sensitivity
As displayed in Figure 2, no interfering peaks were present for both LEV and caffeine at their retention times. The LLOQ of LEV was found to be 3 μg/mL with intra- and inter-day accuracy and precision were within ±20%.
3.2.3. Precision and Accuracy
To assess the method’s interday and intraday performance, we analyzed five replicates of QC samples that were spiked with LEV at four different QC levels. As depicted in Table 1, acceptable CV and percentage error for both intraday and interday were fulfilled. The intraday CV and percentage error were within 11.5% and ±5%, respectively. Interday CV and percentage error was within 9% and ± 5%, respectively. Interday percent error was within ±20% for the LLOQ.
3.2.4. Carryover
Concerning carryover assessment, no interfering peaks with areas > 20% of the peak areas of the LLOQ of LEV were detected in blank samples that were injected post the ULOQ sample.
3.2.5. Dilution integrity
Assessment of dilution integrity results, in terms of precision and accuracy, revealed that dilution of samples with blank human plasma had no effect on accurately determining LEV concentrations higher than the ULOQ.
3.2.6. Stability
Stability results are depicted in Table 2. LEV stock solutions were observed to be stable for at least 2 months at −80 °C, suggesting that new stock solutions can be made in 2 months interval. Moreover, room temperature stability showed that plasma LEV samples were stable at room temperature for up to 12 h with precision (CV%) and accuracy within ±15%, assuring that there was insignificant breakdown of LEV for up to 12 h. Post three freeze–thaw cycles, precision and accuracy of LEV concentrations were also ±15% from nominal concentrations. Furthermore, LEV extracted plasma samples were stable for at least 1 month at −80 °C or room temperature. Reinjection stability showed acceptable precision and accuracy (±15%) after 24 h.
3.2.7. Recovery
By analyzing the 5 replicates of three QC concentrations for LEV (30, 50, 70 μg/mL), the average extraction recovery obtained is displayed in Table 3. LEV average percentage recovery was from 76.75 ±1.63 % to 80.38 ± 6.43 with a CV of <8%.
4. Discussion
Levetiracetam, marketed since 1999 [18], is an ASM that has been shown to be effective in various types of seizures. In the current study, we presented a simple, reproducible, and selective method for quantitively measuring LEV in human plasma samples. Analysis of plasma samples can be performed over 15 min, which is comparable or faster than the previously reported methods. We chose caffeine as an internal standard because it has superior extraction recovery and no interference due to limited use in ICU patients.
Drug analysis in biological samples as human plasma requires sample pretreatment to remove interfering components and proteins before analysis. Preliminary tests to choose the appropriate deproteinizing solvent and its volume were performed. Methanol and acetonitrile were examined. Acetonitrile was chosen as the deproteinizing solvent as it obtained higher % recovery results. The volume of 3 mL results in superior extraction efficiency when compared to 1.5 mL of deproteinizing solvent. Our method requires a single protein precipitation step, and only single isocratic pump and detection channel for our tested analyte, with sufficient extraction recovery (>76%).
Moreover, an essential advantage of the developed method when compared to the majority of methods reported is the apparently smaller volume of plasma samples needed (0.3 mL as opposed to 0.5–1 mL in most methods) [6,7,8,9,10], making this chromatographic method feasible for routine monitoring of LEV in human plasma. Additionally, we utilized only a simple isocratic mixture of water and acetonitrile without any buffers (as opposed to majority of reported methods) and that have added to the simplicity of our method and with no effect on the performance of separation [6,7,8,10,11,12,13,14,15,16]. Using buffers can have many pitfalls as affecting the column efficiency with routine use, adding to the complexity and cost of the method, and is time-consuming, owing to the time needed for extensive column wash after analysis. Nonetheless, stability of our method was assessed, and LEV was found to be stable at least 1 month either in stock solution or in human plasma at room temperature, refrigerator and at −80 °C, assuring safe handling, storage and analysis of LEV using our validated method. The proposed method also showed no significant carryover effect. Additionally, the reported reference concentration range for LEV for seizure control ranges between 12–46 mg/mL, and that falls within our validated range (3–80 mg/mL). Therefore, our developed method is feasible in different research activities and also routine LEV TDM.
5. Conclusions
In this study, we presented a fully validated chromatographic HPLC-UV method for the quantification of LEV in human plasma samples. The developed method was simple, reproducible, and sensitive. It was simple as we used a single mobile phase composition with no buffers and with a single extraction step. The developed method was also suitable to quantify LEV concentration ranges that cover the suggested LEV reference range used in clinical practice. This is in addition to the small sample volume required for analysis. Collectively, the simplicity of the method cuts the cost and time of analysis, making it more practical for day-to-day TDM practice and for research purposes.
Author Contributions
Conceptualization, S.H.M.; methodology, S.H.M. and M.K.; validation, S.H.M. and M.K.; formal analysis, S.H.M. and M.K.; writing—original draft preparation, M.K.; writing—review and editing, S.H.M. and M.K.; supervision, S.H.M.; funding acquisition, S.H.M. All authors have read and agreed to the published version of the manuscript.
Funding
This research was funded by the University Hospital Foundation (UHF), Edmonton, Alberta, Canada and the Faculty of Pharmacy and Pharmaceutical Sciences, University of Alberta, Edmonton, Alberta, Canada.
Data Availability Statement
All relevant data are within the manuscript.
Acknowledgments
Fadumo Ahmed Isse and Fatma Hefny for their assistance with laboratory skills training.
Conflicts of Interest
The authors declare no conflict of interest.
References
- Patsalos, P. The pharmacokinetic characteristics of levetiracetam. Methods Find Exp. Clin. Pharmacol. 2003, 25, 123–129. [Google Scholar] [CrossRef] [PubMed]
- Patsalos, P. Pharmacokinetic profile of levetiracetam: Toward ideal characteristics. Pharmacol. Ther. 2000, 85, 77–85. [Google Scholar] [CrossRef] [PubMed]
- Radtke, R.A. Pharmacokinetics of levetiracetam. Epilepsia 2001, 42, 24–27. [Google Scholar] [CrossRef] [PubMed]
- Jarvie, D.; Mahmoud, S.H. Therapeutic drug monitoring of levetiracetam in select populations. J. Pharm. Pharm. Sci. 2018, 21, 149s–176s. [Google Scholar] [CrossRef] [PubMed] [Green Version]
- Perucca, E.; Bialer, M. The clinical pharmacokinetics of the newer antiepileptic drugs. Clin. Pharmacokinet. 1996, 31, 29–46. [Google Scholar] [CrossRef] [PubMed]
- Attallah, O.A.; Al-Ghobashy, M.A.; Ayoub, A.T.; Tuszynski, J.A.; Nebsen, M. Computer-aided design of magnetic molecularly imprinted polymer nanoparticles for solid-phase extraction and determination of levetiracetam in human plasma. RSC Adv. 2018, 8, 14280–14292. [Google Scholar] [CrossRef] [PubMed] [Green Version]
- Contin, M.; Mohamed, S.; Albani, F.; Riva, R.; Baruzzi, A. Simple and validated HPLC–UV analysis of levetiracetam in deproteinized plasma of patients with epilepsy. J. Chromatogr. B 2008, 873, 129–132. [Google Scholar] [CrossRef] [PubMed]
- Kalaria, S.N.; Dahmane, E.; Armahizer, M.; McCarthy, P.; Gopalakrishnan, M. Development and validation of a HPLC-UV assay for quantification of levetiracetam concentrations in critically ill patients undergoing continuous renal replacement therapy. Biomed. Chromatogr. 2018, 32, e4257. [Google Scholar] [CrossRef] [PubMed]
- Olah, E.; Bacsói, G.; Fekete, J.; Sharma, V. Determination of ng/mL levetiracetam using ultra-high-performance liquid chromatography–photodiode absorbance. J. Chromatogr. Sci. 2012, 50, 253–258. [Google Scholar] [CrossRef] [PubMed] [Green Version]
- Ibrahim, F.A.; El-Yazbi, A.F.; Barary, M.A.; Wagih, M.M. Sensitive inexpensive HPLC determination of four antiepileptic drugs in human plasma: Application to PK studies. Bioanalysis 2016, 8, 2219–2234. [Google Scholar] [CrossRef] [PubMed]
- Hernández-Mitre, M.P.; Medellín-Garibay, S.E.; Rodríguez-Leyva, I.; Rodríguez-Pinal, C.J.; Zarazúa, S.; Jung-Cook, H.H.; Roberts, J.A.; Romano-Moreno, S.; del Carmen Milán-Segovia, R. Population pharmacokinetics and dosing recommendations of levetiracetam in adult and elderly patients with epilepsy. J. Pharm. Sci. 2020, 109, 2070–2078. [Google Scholar] [CrossRef] [PubMed]
- Zufia, L.; Aldaz, A.; Ibanez, N.; Giraldez, J.; Viteri, C. LC method for therapeutic drug monitoring of levetiracetam: Evaluation of the assay performance and validation of its application in the routine area. Clin. Biochem. 2010, 43, 473–482. [Google Scholar] [CrossRef] [PubMed]
- Antonilli, L.; Brusadin, V.; Filipponi, F.; Guglielmi, R.; Nencini, P. Development and validation of an analytical method based on high performance thin layer chromatography for the simultaneous determination of lamotrigine, zonisamide and levetiracetam in human plasma. J. Pharm. Biomed. Anal. 2011, 56, 763–770. [Google Scholar] [CrossRef] [PubMed]
- Pucci, V.; Bugamelli, F.; Mandrioli, R.; Ferranti, A.; Kenndler, E.; Raggi, M.A. High-performance liquid chromatographic determination of Levetiracetam in human plasma: Comparison of different sample clean-up procedures. Biomed. Chromatogr. 2004, 18, 37–44. [Google Scholar] [CrossRef] [PubMed]
- Engelbrecht, L.; Grobler, C.; Rheeders, M. A simple and cost-effective HPLC-UV method for the detection of levetiracetam in plasma/serum of patients with epilepsy. Biomed. Chromatogr. 2017, 31, e3969. [Google Scholar] [CrossRef] [PubMed]
- Lancelin, F.; Franchon, E.; Kraoul, L.; Garciau, I.; Brovedani, S.; Tabaouti, K.; Landré, E.; Chassoux, F.; Paubel, P.; Piketty, M.-L. Therapeutic drug monitoring of levetiracetam by high-performance liquid chromatography with photodiode array ultraviolet detection: Preliminary observations on correlation between plasma concentration and clinical response in patients with refractory epilepsy. Ther. Drug Monit. 2007, 29, 576–583. [Google Scholar]
- Guideline on Bioanalytical Method Validation. Available online: https://www.ema.europa.eu/en/documents/scientific-guideline/guideline-bioanalytical-method-validation_en.pdf (accessed on 10 October 2022).
- Harden, C. Safety profile of levetiracetam. Epilepsia 2001, 42, 36–39. [Google Scholar] [CrossRef]
Figure 1.
Levetiracetam chemical structure.

Figure 2.
(A) A blank plasma chromatogram; (B) a chromatogram showing a sample of human plasma spiked with 80 µg/mL levetiracetam (LEV) and caffeine as internal standard (IS). LEV and IS retention times were 7.8 and 13.2 min, respectively.
Figure 2.
(A) A blank plasma chromatogram; (B) a chromatogram showing a sample of human plasma spiked with 80 µg/mL levetiracetam (LEV) and caffeine as internal standard (IS). LEV and IS retention times were 7.8 and 13.2 min, respectively.

Figure 3.
A representative calibration curve of Levetiracetam throughout the range 3–80 μg/mL.


Table 1.
Method inter- and intra-day precision (%CV) and accuracy (% error) for Levetiracetam.
| QC Concentration (μg/mL) | Observed Concentration (μg/mL) Mean ± SD | Precision, CV (%) | Accuracy, Error (%) | |
|---|---|---|---|---|
| Intraday | 3 | 3.14 ± 0.36 | 11.35 | −4.74 |
| 30 | 29.02 ± 0.84 | 2.88 | 3.28 | |
| 50 | 47.76 ± 3.2 | 6.72 | 4.48 | |
| 70 | 69.82 ± 2.67 | 3.82 | 0.25 | |
| Interday | 3 | 3.47 ± 0.3 | 8.77 | −15.78 |
| 30 | 31.28 ± 2.3 | 7.38 | −4.27 | |
| 50 | 48.69 ± 1.99 | 4.08 | 2.62 | |
| 70 | 67.92 ± 1.66 | 2.45 | 2.96 |
Intraday (n = 5 per concentration); Interday (n = 15 per measured concentration over 3 days); CV, coefficient of variation, QC, quality control.
Table 2.
Levetiracetam stability testing.
| Stability Test | Concentration (μg/mL) | Mean Calculated Concentrations (μg/mL) ± SD | CV (%) | % Error |
|---|---|---|---|---|
| Stock solution stability at −80 °C (1 month) | 60 | 60.06 ± 6.53 | 10.87 | −0.11 |
| Stock solution stability at −80 °C (2 month) | 60 | 63.63 ± 0.24 | 0.38 | −6.06 |
| Stock solution stability at 4 °C (1 month) | 60 | 63.63 ± 2.61 | 4.1 | −6.03 |
| Long term stability at room temperature (1 month) | 60 | 60.92 ± 2.81 | 3.95 | −1.5 |
| Long term stability at −80 °C (1 month) | 60 | 66.75 ± 1.35 | 2.02 | −11.26 |
| Free-thaw stability | 60 | 64.87 ± 1.16 | 1.79 | −8.12 |
| Bench-top stability (12 h) | 60 | 66.51 ± 0.79 | 1.19 | −10.85 |
| Reinjection stability | 60 | 52.02 ± 0.64 | 1.49 | 13.28 |
n = 5 per concentration; CV, coefficient of variation; IS, internal standard.
Table 3.
Mean percent recovery for Levetiracetam and Caffeine (IS).
| Drug | Concentration (μg/mL) | Recovery, Mean ± SD (%) | CV (%) |
|---|---|---|---|
| Levetiracetam | 30 | 80.38 ± 6.43 | 8.0 |
| 50 | 77.36 ± 1.60 | 2.06 | |
| 70 | 76.75 ± 1.64 | 2.13 | |
| Caffeine (IS) | 50 | 83.39 ± 1.8 | 2.17 |
n = 5 per concentration; CV, coefficient of variation; IS, internal standard.
Disclaimer/Publisher’s Note: The statements, opinions and data contained in all publications are solely those of the individual author(s) and contributor(s) and not of MDPI and/or the editor(s). MDPI and/or the editor(s) disclaim responsibility for any injury to people or property resulting from any ideas, methods, instructions or products referred to in the content. |
© 2023 by the authors. Licensee MDPI, Basel, Switzerland. This article is an open access article distributed under the terms and conditions of the Creative Commons Attribution (CC BY) license (https://creativecommons.org/licenses/by/4.0/).
Share and Cite
MDPI and ACS Style
Kharouba, M.; Mahmoud, S.H. Development and Validation of a Simple HPLC-UV Assay Method for Determination of Levetiracetam Concentrations in Human Plasma. Analytica 2023, 4, 1-9. https://doi.org/10.3390/analytica4010001
AMA Style
Kharouba M, Mahmoud SH. Development and Validation of a Simple HPLC-UV Assay Method for Determination of Levetiracetam Concentrations in Human Plasma. Analytica. 2023; 4(1):1-9. https://doi.org/10.3390/analytica4010001
Chicago/Turabian StyleKharouba, Maged, and Sherif Hanafy Mahmoud. 2023. "Development and Validation of a Simple HPLC-UV Assay Method for Determination of Levetiracetam Concentrations in Human Plasma" Analytica 4, no. 1: 1-9. https://doi.org/10.3390/analytica4010001