
A Decade of Pancreas Transplantation—A Registry Report

Department of Medicine/Nephrology, SUNY Downstate Medical Center, 450 Clarkson Ave., Brooklyn, NY 11203, USA
Uro 2023, 3(2), 132-150; https://doi.org/10.3390/uro3020015
Submission received: 3 April 2023
/
Revised: 15 May 2023
/
Accepted: 22 May 2023
/
Published: 25 May 2023
(This article belongs to the Special Issue Current Concepts in Transplantation)
Abstract
:Since the first pancreas transplant in 1966, over 67,000 pancreas transplants have been performed worldwide and the number is growing. While the number of transplants in the US has changed only slightly over the past decade, many countries outside the US have shown strong growth in transplant numbers. The worldwide growth in numbers is due to the increasing number of patients with type 2 diabetes mellitus receiving a pancreas transplant. Only during the COVID-19 pandemic in 2020 and 2021 did transplant numbers decline, but they started to recover in 2022. The decline was especially noted for solitary transplants. This development over time was due to excellent patient and graft survival after simultaneous pancreas and kidney transplant (SPK). Patient survival at three years was >90% in SPK as well as in solitary transplants. At 3 years post-transplant, SPK pancreas graft survival was over 86% and SPK kidney graft survival over 90%. In pancreas transplants alone (PTA) and in pancreas after kidney transplants, the 3-year graft function reached 75%. The main reasons for advancement in outcome were reductions in technical failures and immunological graft losses. These improvements were due to better patient and donor selection, standardization of surgical techniques, and superior immunosuppressive protocols.
Keywords:
International Pancreas Transplant Registry (IPTR); registry analysis; world development; pancreas transplantation; simultaneous pancreas/kidney transplant (SPK); pancreas after kidney transplant (PAK); pancreas transplant alone (PTA); outcome; patient survival; graft survival; technical failure; immunologic graft loss1. Introduction
Diabetes mellitus (DM) is a worldwide pandemic disease of the modern era. New studies show that overall, 30.3 million people in the US may have the disease which represents 9.4% of the population. Type 1 DM accounts for 5–10% of these cases [1] and it is on the rise. DM is the seventh leading cause of death in the US, and it is one of the main reasons for cardiovascular disease, stroke, amputation, and end-stage renal disease. Rates of diabetic complications have improved since the publication of the DCCT study and with new technologies for insulin delivery, but in many cases, these measures only extend the time until diabetic complications manifest. Newer studies have shown that intensified control cannot prevent the onset of complications, and will only postpone the onset [2]. Furthermore, the early onset of type 2 DM is critical and leads to longer duration of disease, earlier insulin dependency, and more patients with diabetic secondary complications [3].
Treatment options have not changed greatly since the introduction of injectable insulin, despite increasing prevalence, morbidities, and the associated financial burden on society. For patients who cannot be successfully treated with conservative insulin therapy and who have developed brittle DM, one possible treatment option is pancreas transplantation. For those patients, pancreas transplantation still offers the best method to gain long-term insulin-independence and euglycemia [4]. When the transplant is performed early enough, before the onset of severe secondary diabetic complications, these can even be reversed or ameliorated. The pancreas can be transplanted either alone (PTA), after a previous kidney transplant (PAK), or simultaneously with a kidney graft (SPK). A SPK transplant is recommended by the American Diabetes Association as an acceptable treatment method for diabetic patients with imminent or established end-stage renal disease [5].
The number of pancreas transplants decreased during the COVID-19 pandemic between 2020 and 2021 but is again slowly increasing. While the number of transplants in the US is consolidating, an increase in the number of pancreas transplants outside the US has been reported. This analysis focuses on transplants performed between 2012 and 2021 and describes their worldwide development, characteristics, risk factors, and outcomes.
2. Methods
The number of pancreas transplants performed worldwide for the last decade is stated as reported to the International Pancreas Transplant Registry. A comparison of 5-year intervals for transplants performed between 1 January 2012 and 31 December 2016 and 1 January 2017 and 31 December 2021, respectively, describes possible changes over time.
In the US, reporting is mandatory and the IPTR receives the information through data exchange from UNOS. This information is complete. Outside the US, information is sent by the respective country’s official donor/transplant organizations together with additional basic information. The information about the number of transplants is therefore reliable. Since for most countries the follow-up reporting is not as stringent as in the USA, the information was incomplete. For this reason, the current focus is on US cases for characteristics and outcomes. All US patients with type 1 and type 2 DM who received a primary pancreas and/or pancreas and kidney transplant with a follow-up time of at least 8 months post-transplant were included in this study. Multiple organ transplants with simultaneous liver or intestinal grafts were excluded from the analyses because the reason for transplant was probably not DM.
Pancreas graft function was defined as complete insulin-independence. Partial function or dying with a functioning graft was counted as failure when not suggested otherwise. Kidney graft failure was defined as return to dialysis or dying with a functioning graft.
Risk factors for immunological failure were estimated for technically successful transplant. Technical failures were primarily defined as early graft thrombosis during the first 2 weeks post-transplant, or graft removal due to bleeding, anastomotic leak, pancreatitis, or infections during the first 3 months post-transplant.
The impact on center volume was measured by defining low, medium, and high-volume centers. This was achieved by counting the total number of pancreas transplants per center for the period of interest and defining the tertiles of these counts.
A wide range of different induction regimens were reported. For analyses, induction therapy was defined as the use of depleting (e.g., rabbit anti-thymocyte globulin, alemtuzumab, ATGAM) and/or non-depleting (daclizumab, basiliximab) antibodies.
For maintenance therapy, different drugs and their combinations were recorded. The analyses focused on the most frequently used combination of tacrolimus in combination with mycophenolate mofetil (MMF) with or without initial use of steroids. Protocols based on sirolimus in combination with other drugs represented another group of maintenance therapy. All the other possible combinations of mono, duo, or CsA-based therapies, which represented a very small percentage, were combined as ‘Other’.
The Kaplan–Meier method was used to compute patient and graft survival. p-values for pairwise comparisons between groups were corrected according to Sidak. Cox proportional and non-proportional hazard models were applied to compute adjusted patient and graft survival rates and to assess the independent influence of risk factors. Time-dependent covariates were added for specific estimation of patient and graft survival. All statistical analyses were performed using SAS 9.4 (SAS Institute, Cary, NC, USA).
3. Results
3.1. Worldwide Development
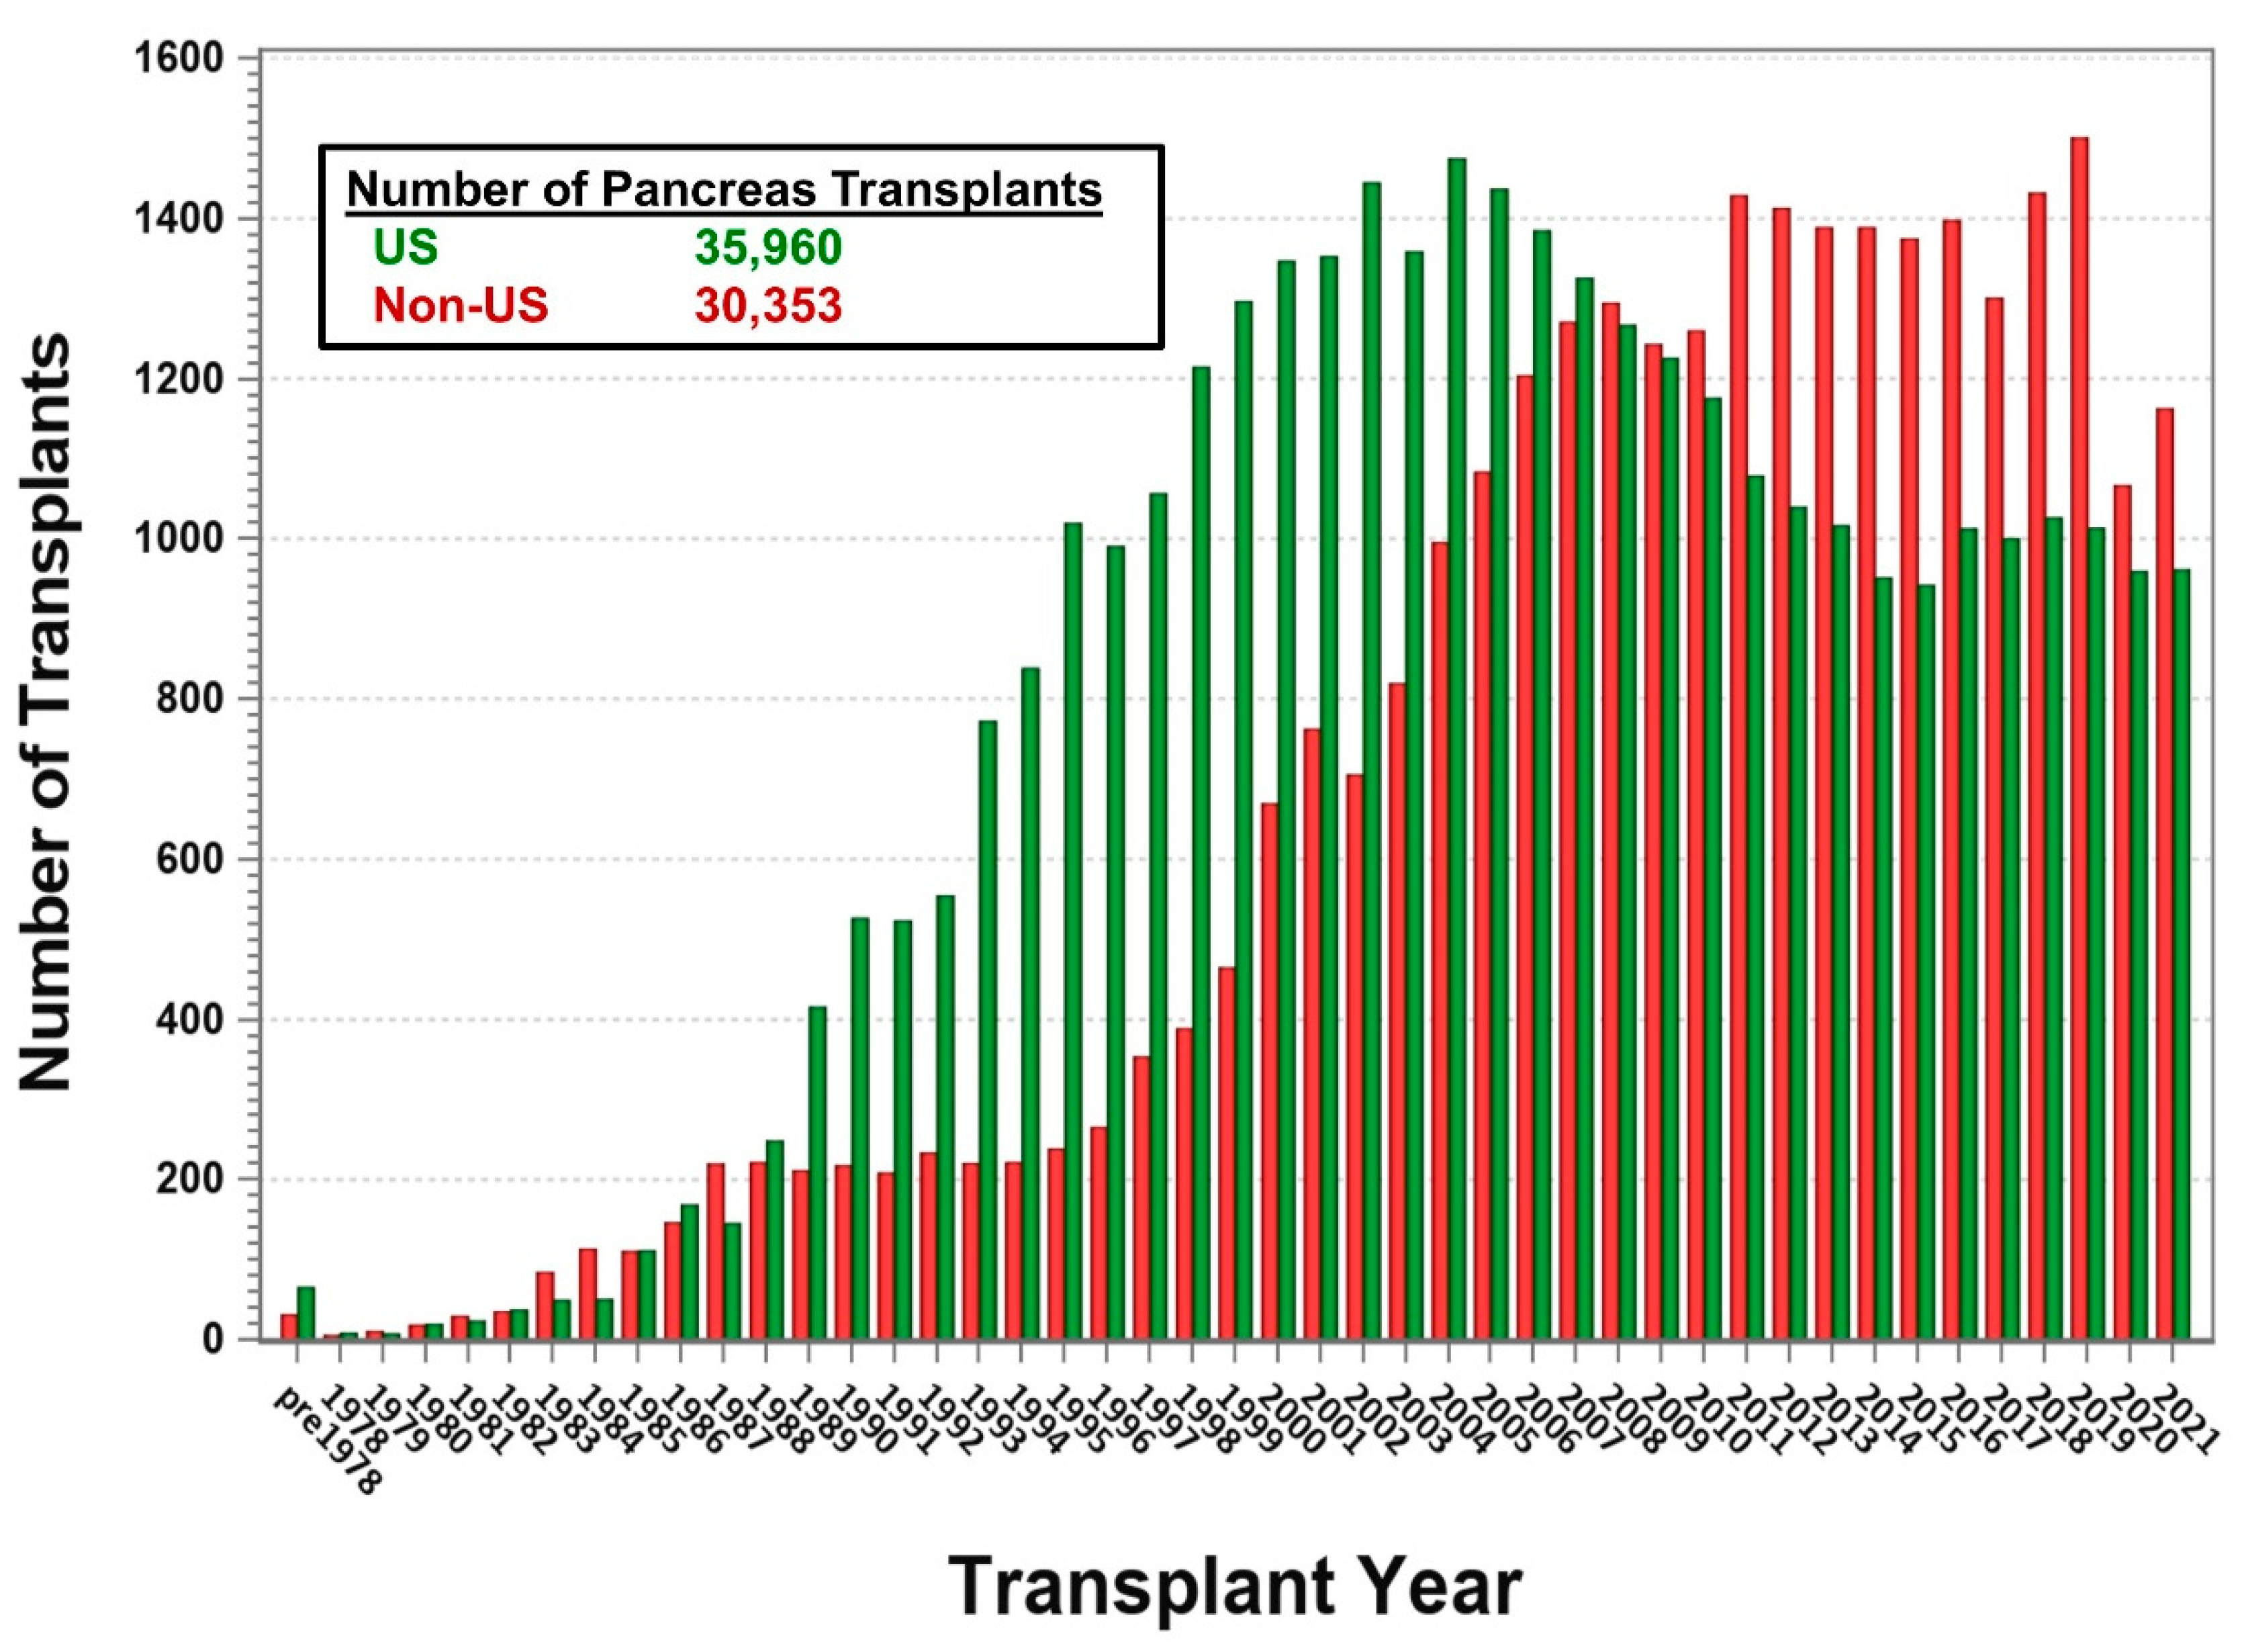
Figure 1 shows the development of pancreas transplantation since the first pancreas transplant performed at the University of Minnesota by Drs. Kelly and Lillehei on 17 December 1966 [6]. Outside the USA, the first pancreas transplant was performed at Guy’s Hospital in London in combination with a kidney transplant [7]. Since then, more than 66,000 pancreas transplants have been reported to the IPTR. While initially most transplants were performed in the USA, the numbers outside the USA started to increase later. In 2008, the number of pancreas transplants reported from outside the USA was higher than in the USA. US numbers declined after 2004 and seemed to recover only slowly after 2015, while non-US numbers continued to increase until 2020. Due to the COVID-19 pandemic, US as well as non-US numbers dropped. Table 1 shows the development over the past decade by continent for the respective 5-year intervals. While the numbers in North America consolidated and even showed a small increase for the later 5 years, numbers in East Asia, the Middle East, Oceania, and South America showed strong growth. Figure 2, Figure 3, Figure 4 and Figure 5 show the development in different selected countries by continent. The overall reported numbers of transplants in Europe declined significantly, by over 20%. Figure 2 shows the decline of transplant numbers in Germany and the UK, which mainly contributed to the overall decline. In other European countries no changes were noted over time.
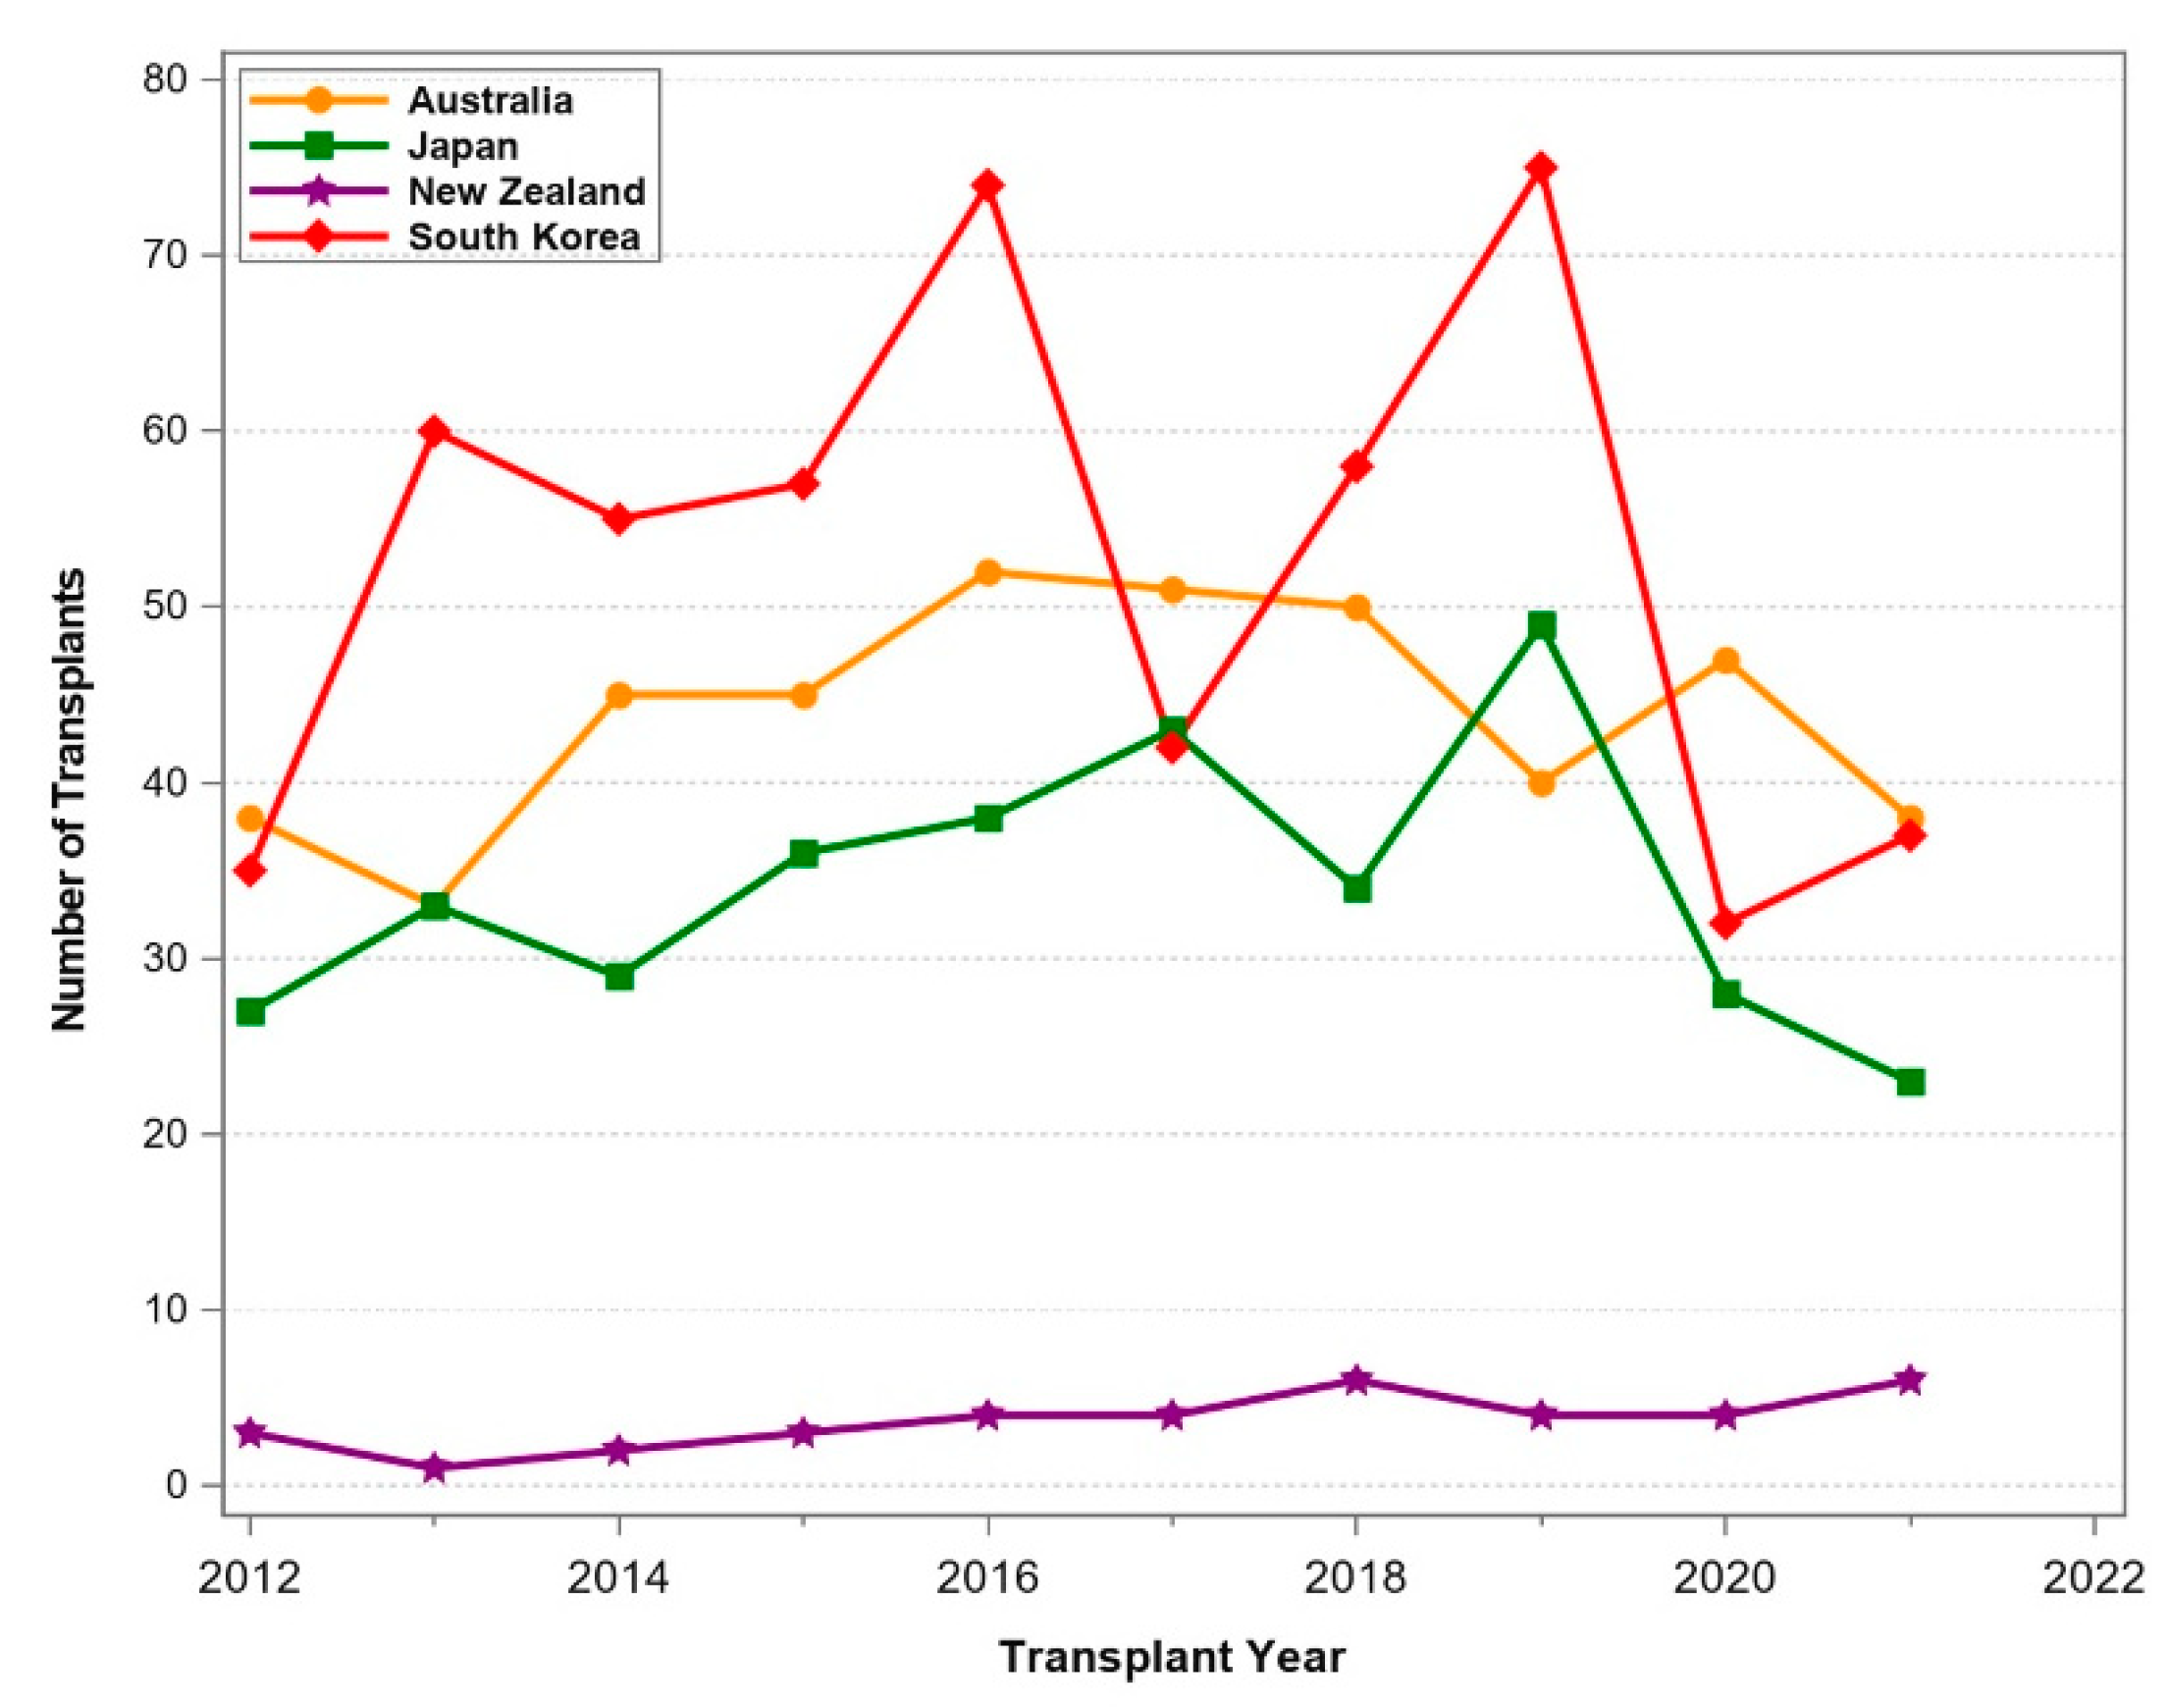
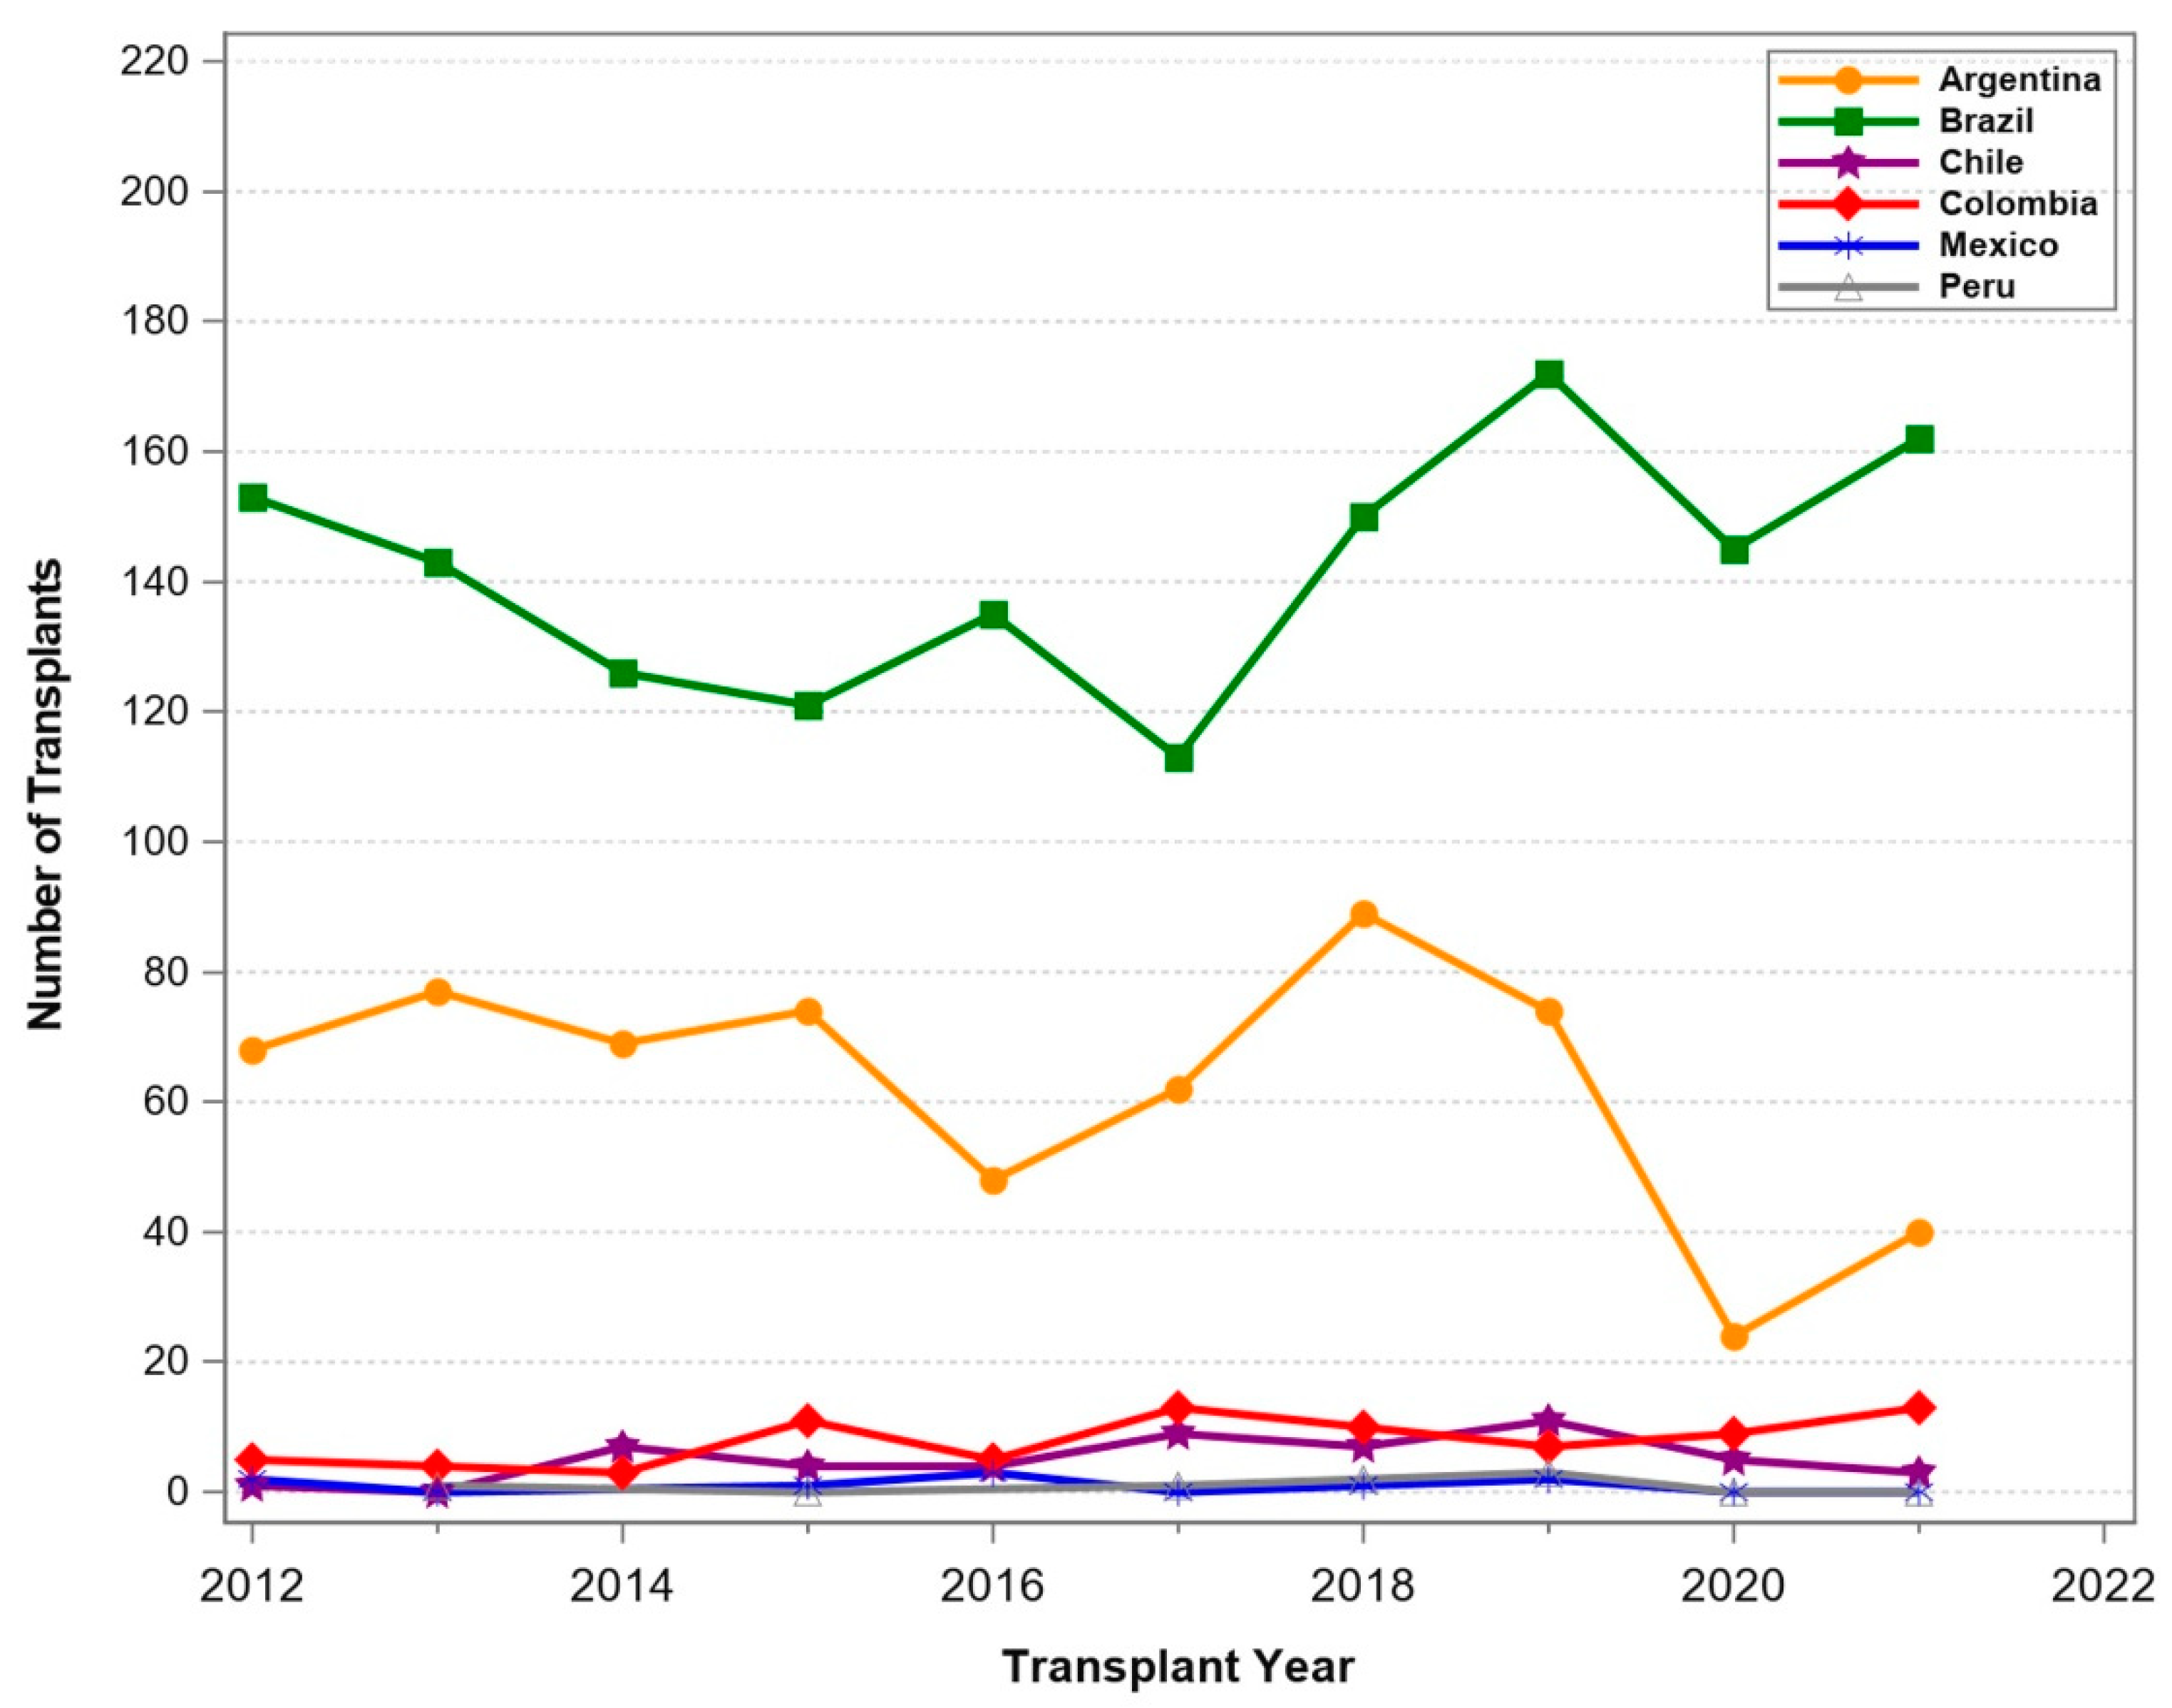
In Oceania and South America, transplant programs were thriving (Figure 3 and Figure 4) and a constant increase in transplant numbers was noted. In New Zealand, the number of transplants was limited, with a stable number of procedures. In South America, Brazil and Argentina reported increasing transplant activities until the start of COVID-19. Smaller countries such as Chile, Columbia, Ecuador, and Peru performed only few pancreas transplants over the period. The Middle East (Figure 5) also reported thriving transplant activities. Iran and Saudi Arabia reported increasing numbers of transplants, while the numbers in Turkey declined significantly. In Israel, the numbers remained stable over time.
To assess the real impact of pancreas transplant programs by country, population size must be considered. Figure 6 shows the relative numbers of pancreas transplants according to population size for 2021. In relation to its population, clearly the most transplants were performed in Finland, with over 5.6 PMP pancreas transplants. This was followed by the Czech Republic with 3.6 PMP transplants, the USA with 2.8 PMP transplants, Australia (1.6 PMP transplants), and New Zealand (1.3 PMP transplants). Of note, Asian countries including India and China were also starting pancreas transplant programs with increasing numbers.
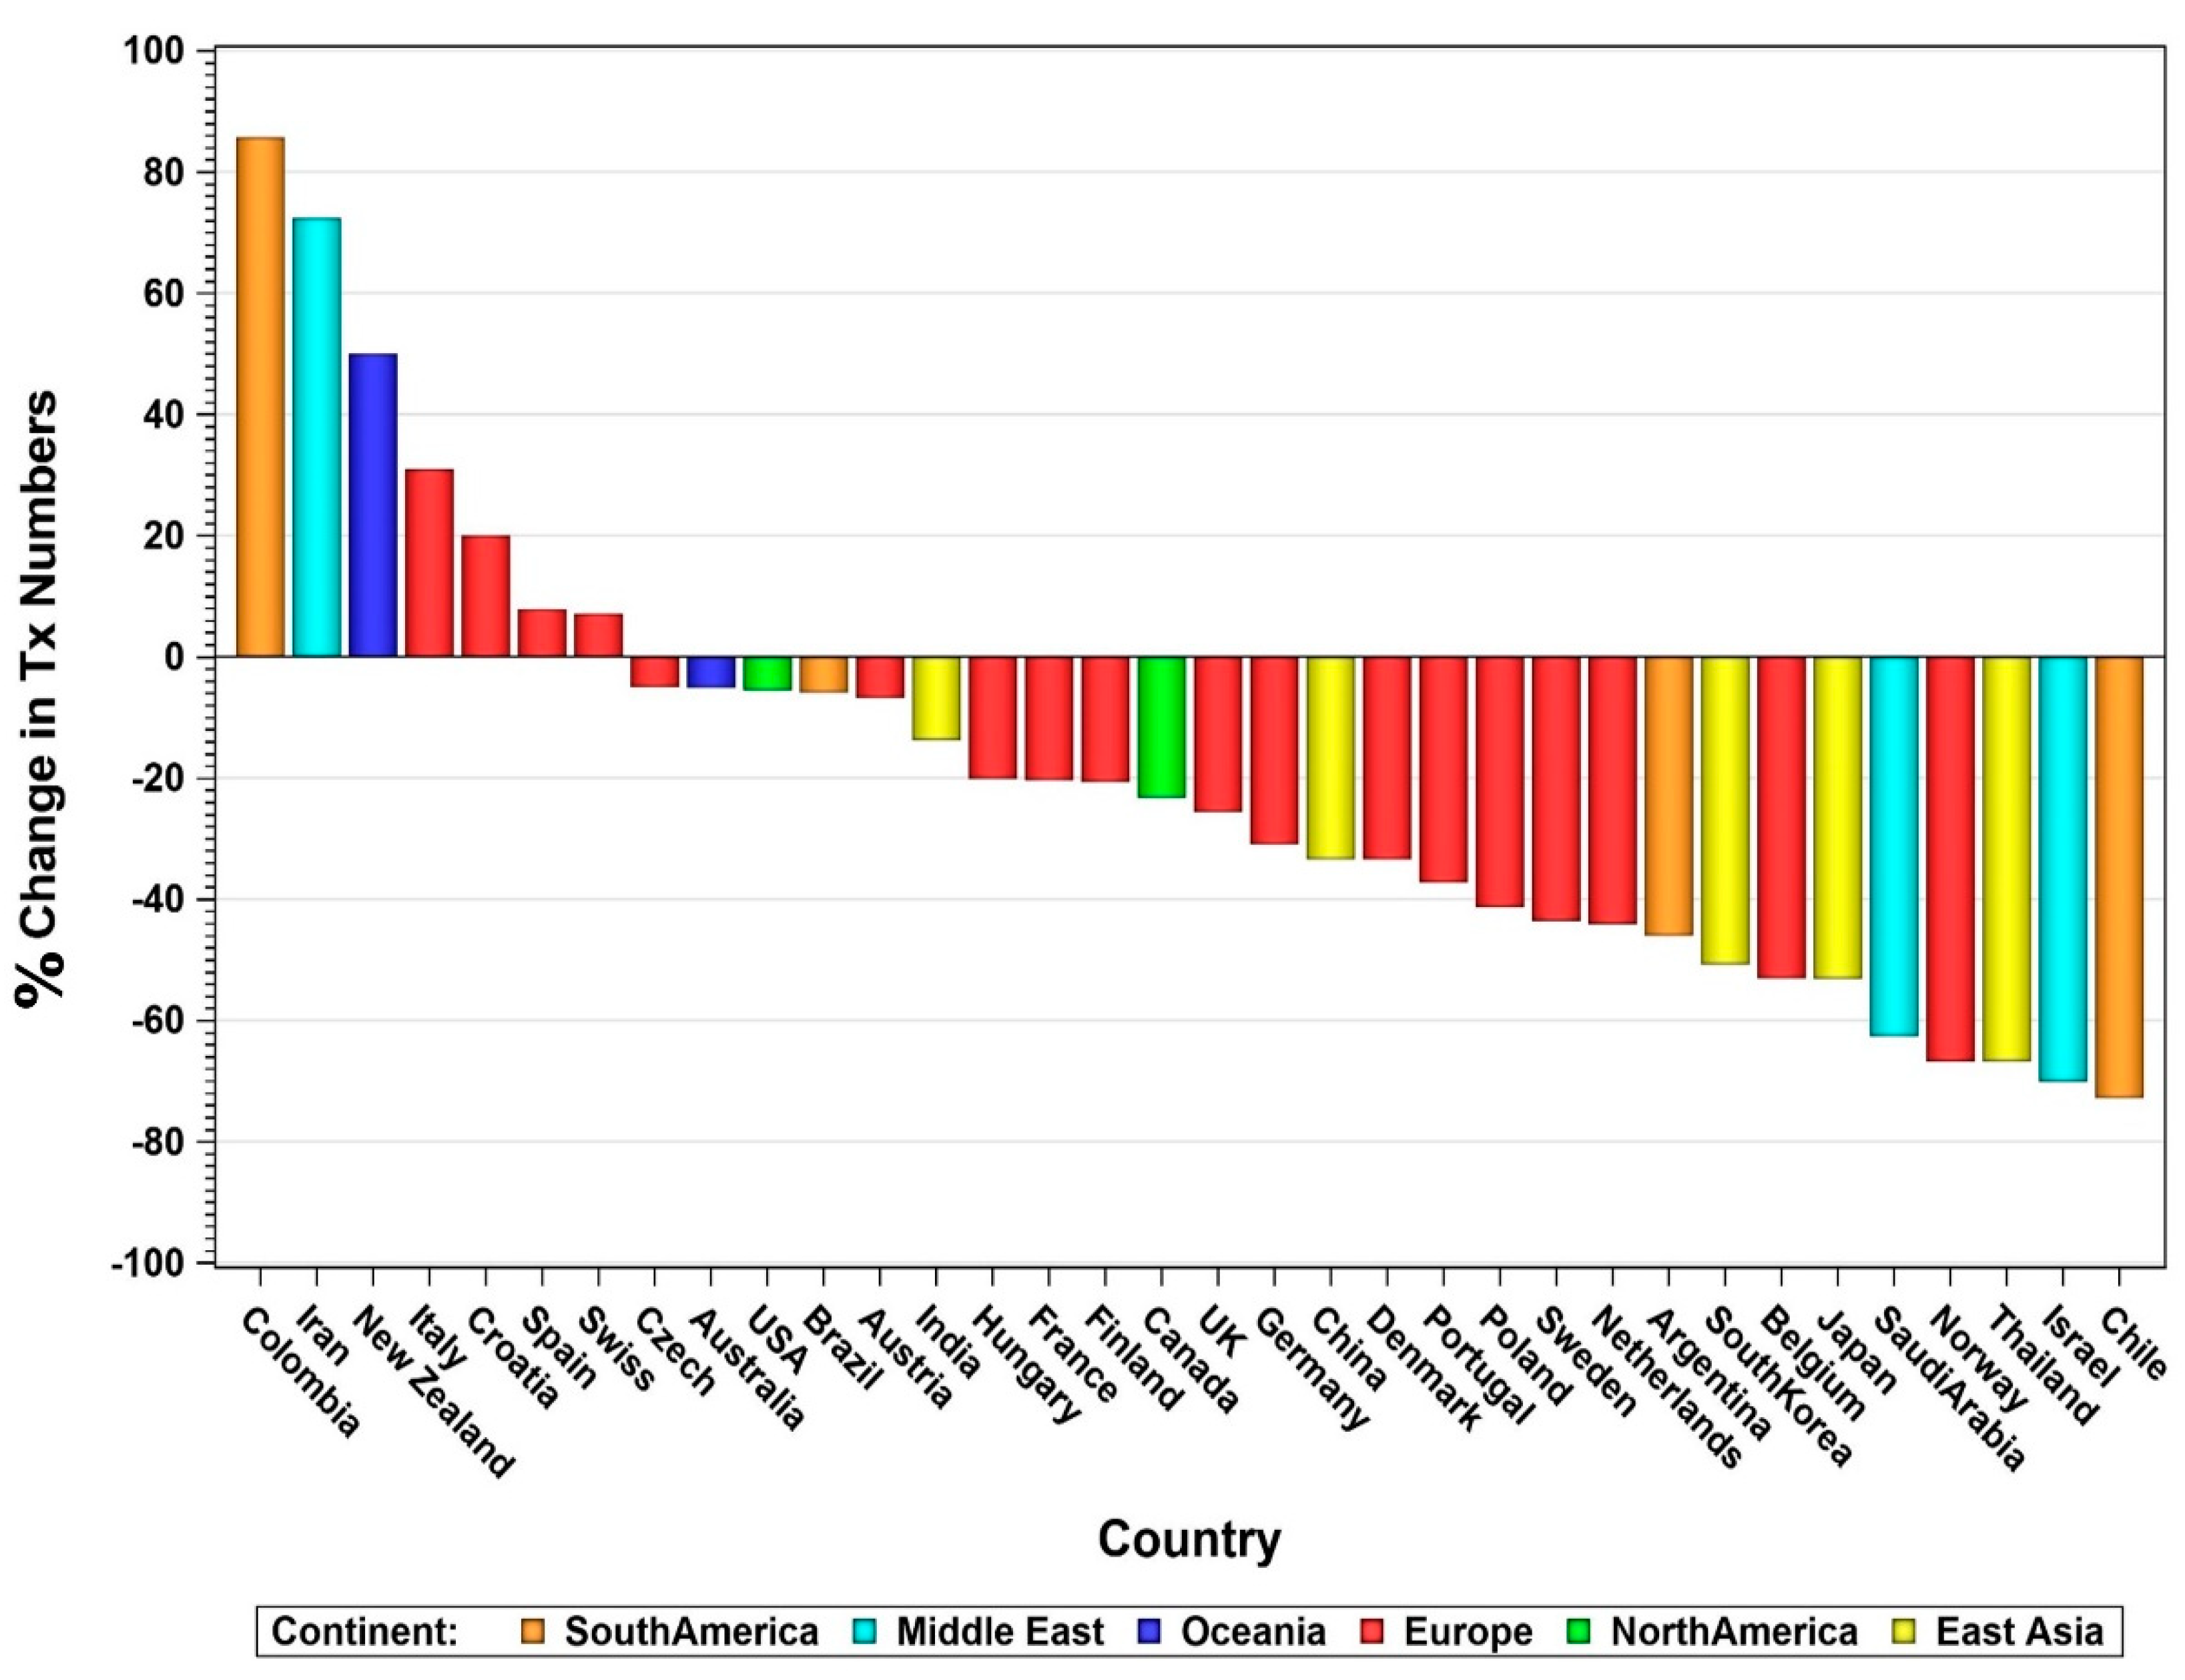
The impact of COVID-19 on the worldwide numbers of pancreas transplants is shown in Figure 7, showing the relative change of numbers between 2019 as pre- and 2021 as post-COVID-19 outbreak. Some smaller countries, especially those with low transplant numbers, showed a relative increase in their transplant activity, but for most countries a decrease was noted. The decrease in countries such as the USA, Australia, and Brazil accounted for a decline of around 5%.
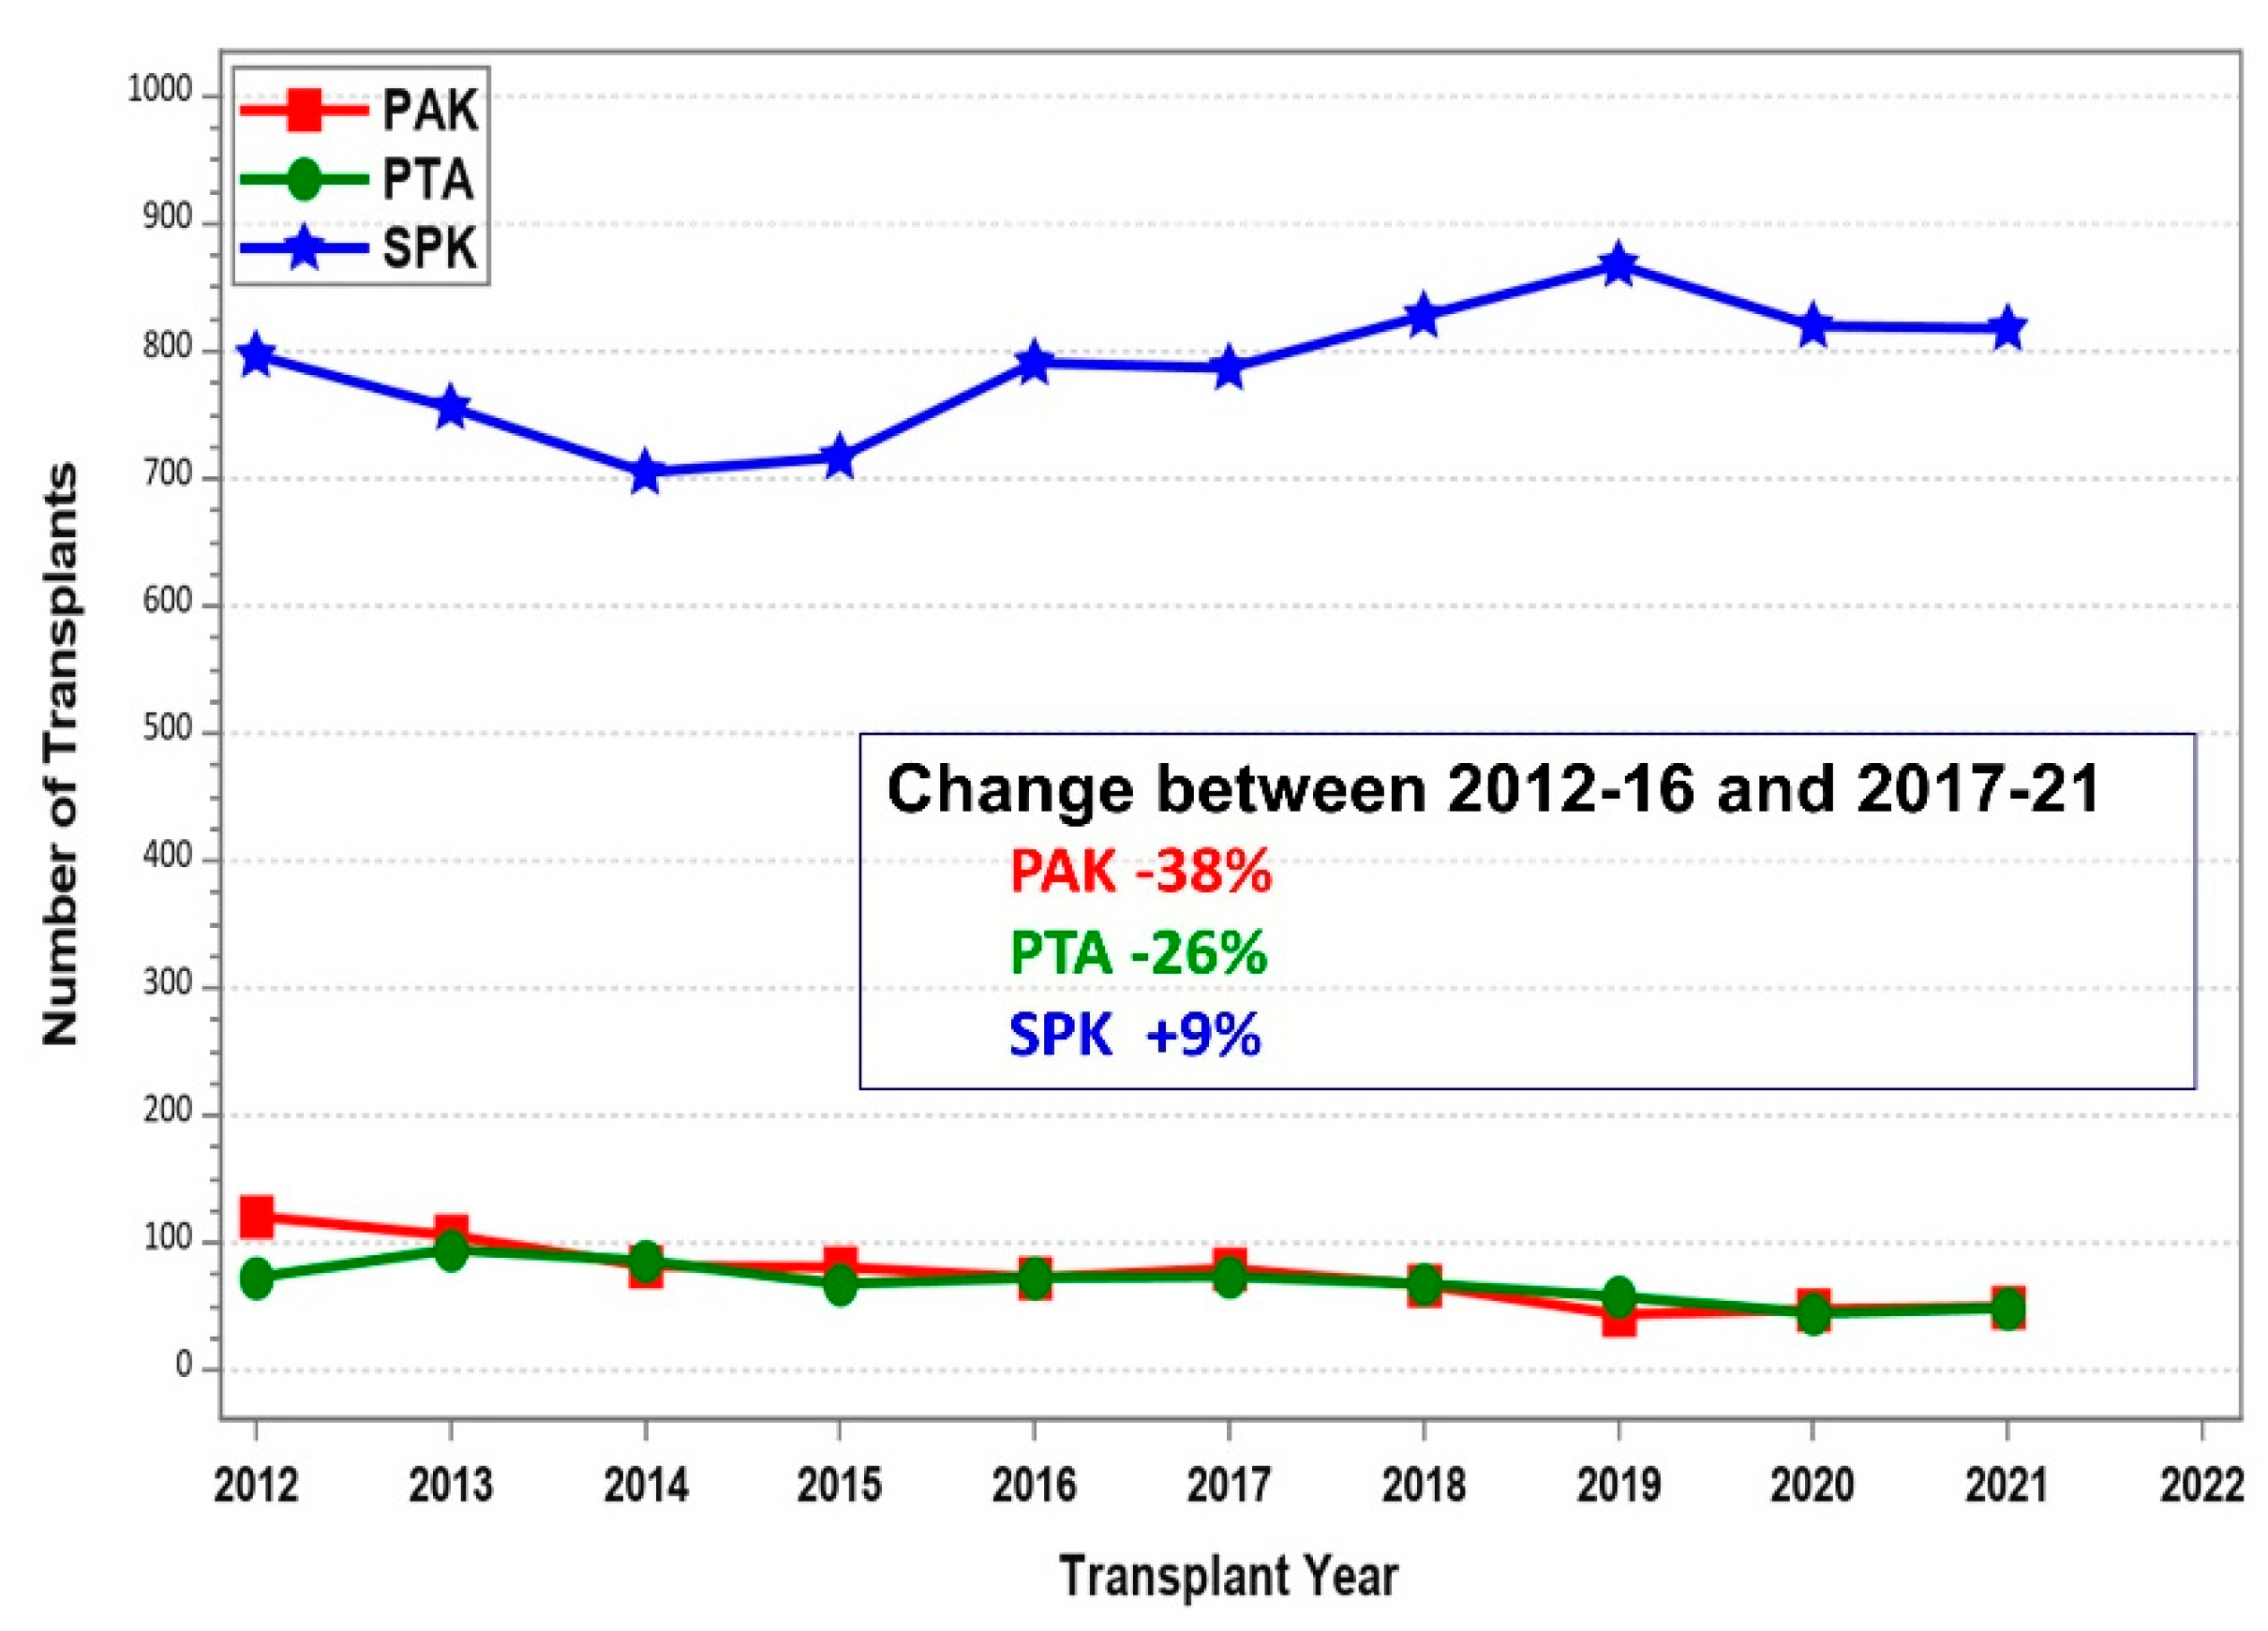
The overall decrease in transplant numbers over time was especially impacted by the decline in solitary pancreas transplants. Many countries stopped performing solitary pancreas transplants altogether, and most pancreas transplants were completed in combination with a kidney graft. This development was detected in non-US countries as well as in the USA. As an example, Figure 8 shows the stark decline for US PAK and PTA of over 25%, while the number of SPK slightly increased over time.
3.2. Pancreas Transplants in the US
A total of 9929 pancreata were transplanted between 1 January 2012 and 31 December 2021. Most pancreas transplants were performed in diabetic patients (93.9%). In 601 cases the pancreas transplant was carried out in combination with liver and/or intestine for technical reasons. Those cases were excluded from further analysis.
Of the remaining transplants in diabetic patients, the majority were primary pancreas transplants (95.6%). The rate of re-transplant was by far the highest in PAK (30.7%). PTA re-transplants were performed in 11.2%, SPK re-transplants only in 1.3% of cases. Nineteen third and one fourth rePAK transplants, five third and one fourth rePTA, and two third and two fourth reSPK were performed during this time. Most pancreas transplants were from deceased donors and only a single living-donor simultaneous pancreas/kidney SPK was performed during this time. In an additional six cases a deceased-donor pancreas was simultaneously transplanted with a kidney from a living donor.
3.3. Recipient Characteristics
The number of SPK increased significantly from 2012-16 to 2017-21 (Table 2), while during the same time the number of solitary transplants decreased. The decrease was worse for PAK. The number of recipients with type 2 diabetics patients increased for SPK and PAK but not for PTA. The age of SPK recipients increased with the increase of patients with type 2 DM. Significantly more Black and Hispanic patients received transplants, and the BMI of the recipients increased over time. The number of patients with cPRA% over 20% also increased significantly between the two periods. The waiting time for SPK declined significantly. All those trends were not seen for solitary transplants. Still no change was noted in the gender distribution. More male recipients received SPK or PAK while more females receive PTA.
3.4. Donor Characteristics
With a lower number of pancreas transplants, the age of deceased pancreas donors declined significantly for SPK donors. Now, more than 75% of donors are under the age of 30 years (Table 3). In SPK transplants, slightly older donors were accepted for transplantation compared to donors for solitary transplants, because of the simultaneous kidney graft. Preferential male donors were used because those were most likely to be trauma victims and probably of younger age. In 2017-21, trauma was the reported cause of death in 69% of all male and 42% of all female pancreas donors. This led to a significant interaction between donor cause of death and donor gender (p < 0.0001).
The use of DCD (donation after cardiac death) donors did not change over time. They were only rarely used for pancreas transplantation—more frequently in SPK compared to solitary transplants. The distribution of donor BMI remained stable over time. Most donors reported normal or slightly increased weight. Only in SPK, more obese donors were accepted.
The attention to HLA matching did not change over time and most donors were not well matched with the recipient.
In all three transplant categories, a change to shorter cold preservation times was observed. The trend was significant for SPK and PTA but not for PAK. In 2016-21 more than 63% of all transplants had a cold preservation time of under 12 h.
3.5. Transplant Characteristics
In all three transplant categories, a significant trend was noted toward most pancreas transplants being performed at high-volume centers (Table 4). PTA transplants were preferentially performed at high-volume transplant centers.
A significant trend was noted away from bladder drainage of the pancreatic duct (Table 4). Enteric drainage was the most frequently used technique in all three categories. The use of bladder drainage of the pancreas was reported in less than 3% of cases in 2017-21. Duct injection was utilized only in a few special cases. Portal drainage in enteric drained transplants declined in SPK and PTA but remained stable in PAK.
A significant trend toward the use of non-depleting induction therapy was seen in SPK. In 85% of SPK transplants, recipients received induction therapy with depleting antibodies. Most received anti-thymocyte globulin; in contrast, the use of alemtuzumab declined. Over time, more and more recipients received an immunosuppressive maintenance protocol based on tacrolimus mostly in combination with mycophenolic acid. The use of protocols based on sirolimus declined over time in all three transplant categories. Single-drug maintenance protocols were reported in only a small number of transplants, but the numbers were increasing. The use of steroids for maintenance in SPK did not change over time and was reported in 70% of patients. Its use increased significantly over time in solitary pancreas transplants. The use of steroid-free protocols was more frequently observed in high-volume transplant centers.
3.6. Transplant Outcomes
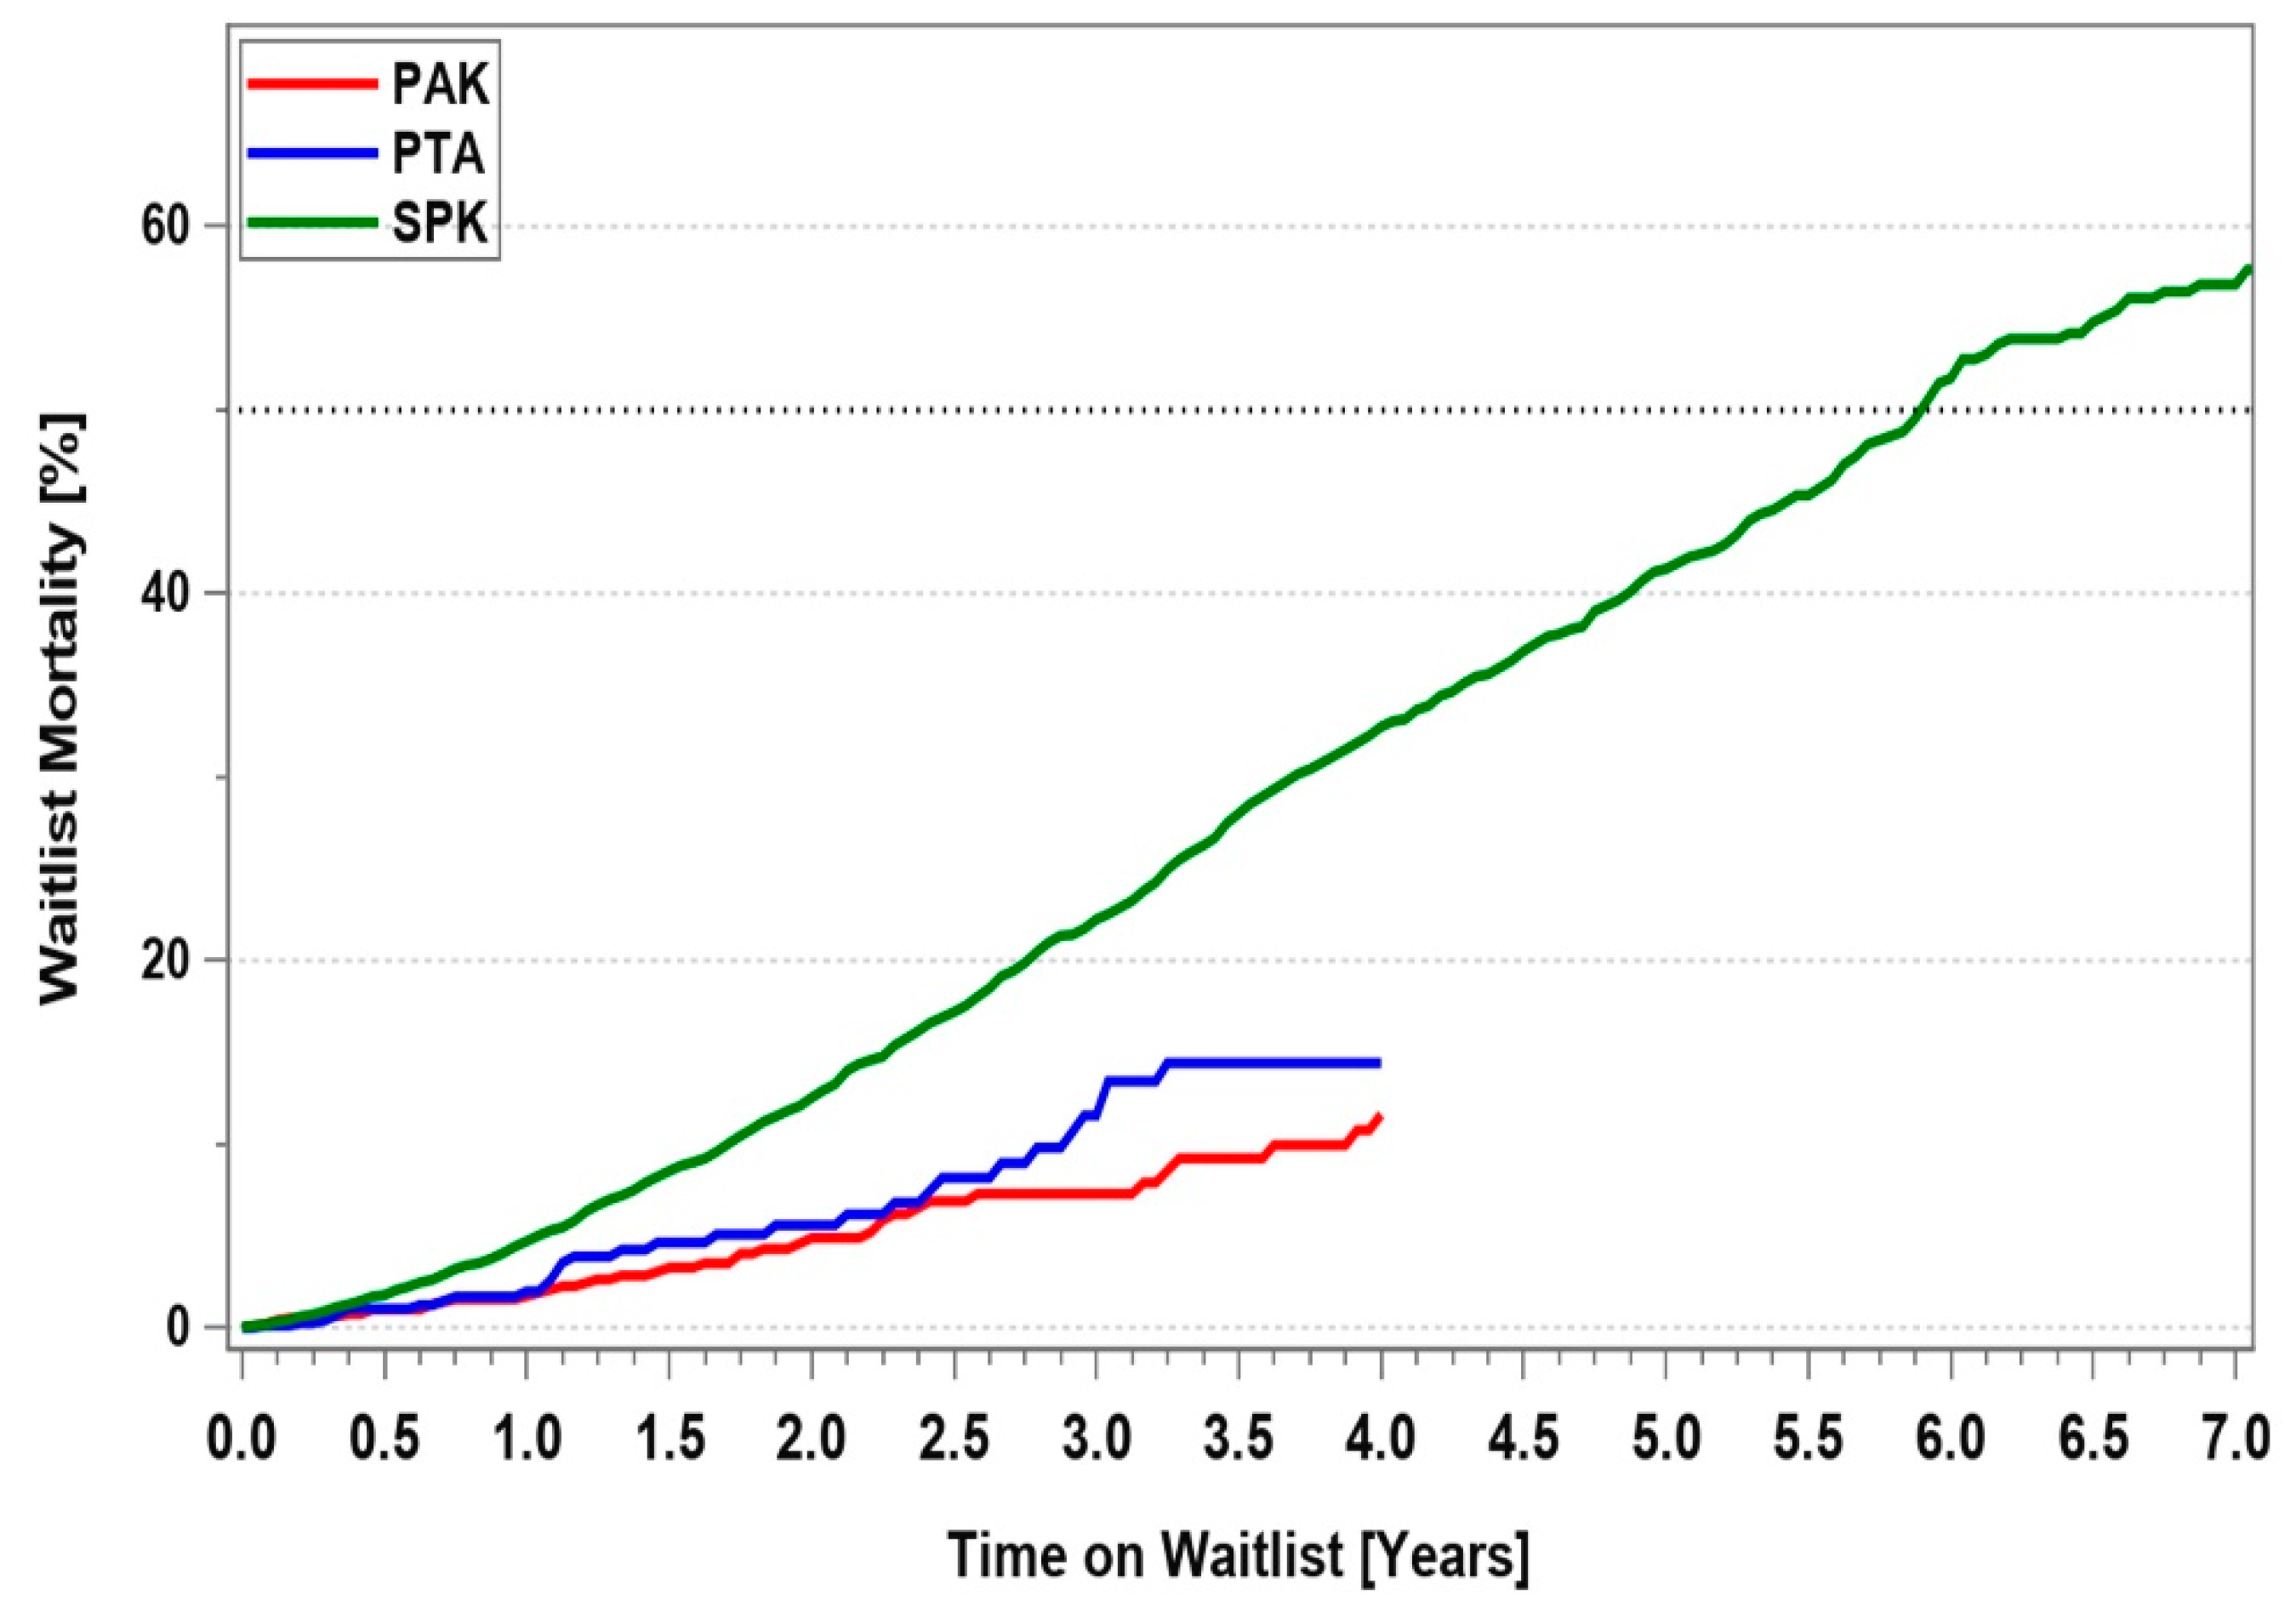
To assess the impact of pancreas transplantation it is important to analyze patient survival on the transplant waitlist. The survival of diabetic patients on the waitlist was dependent on their uremic status. Figure 9 shows the survival of patients listed between 1 January 2010 and 31 December 2021. The best overall patient survival could be found for non-uremic patients waiting for a solitary pancreas transplant, with a three-year patient death rate of 8.8%. In contrast, the patient survival for patients who were waiting for a SPK was significantly worse. The 3- (5-)year death rate was 22.2% (41.3%). The change in kidney allocation (KAS) in 2014 had a significant impact on waiting time for SPK. Patient survival at 3 years on the waitlist improved from 74.4% to 81.1%.
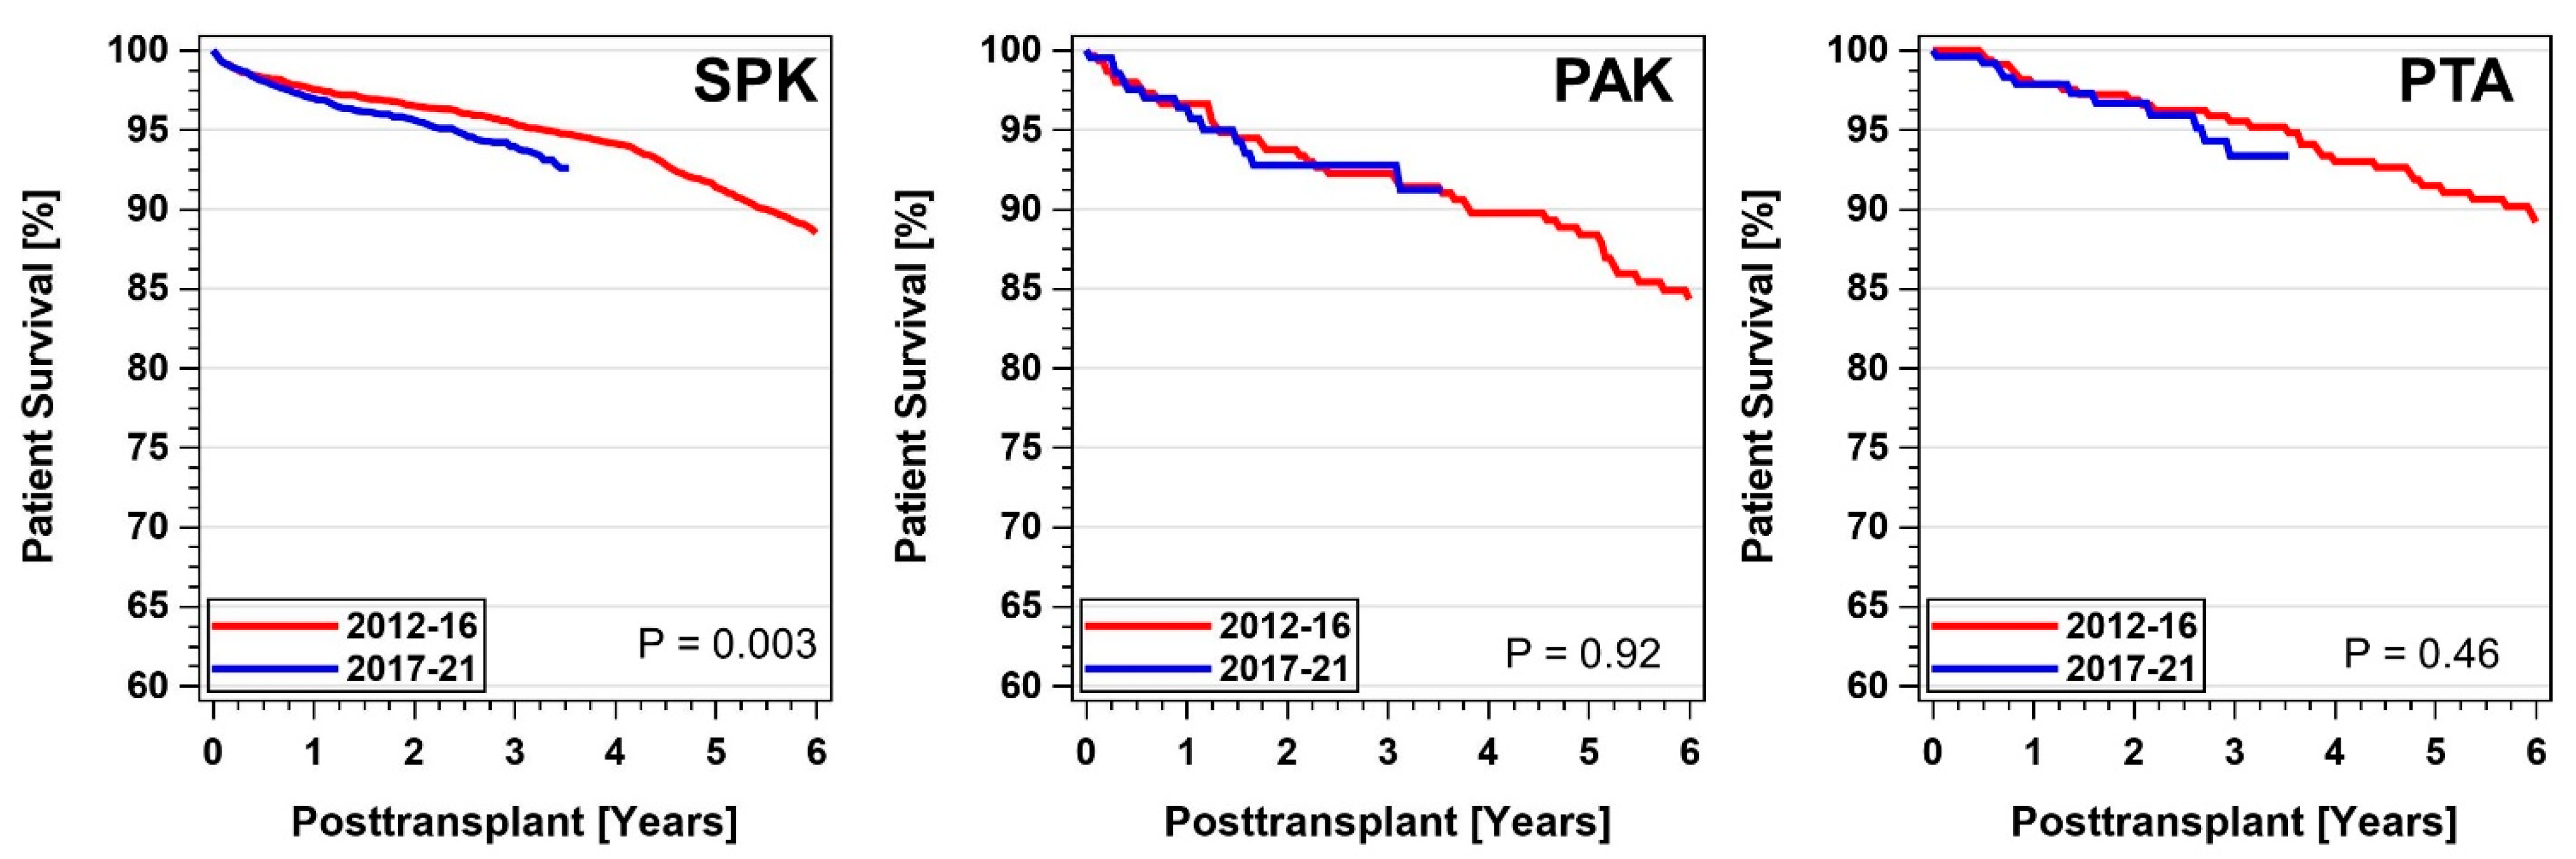
Between 2011-16 and 2017-21, patient survival after a pancreas transplant was excellent and did not differ between the three categories. Figure 10 shows the development in all three categories over time. Of note is the significant decrease in patient survival in SPK recipients; 1- (3-)year patient survival changed from 97.5% (95.4%) to 97.0% (94.0%) (p = 0.003). No changes in patient survival were observed in solitary pancreas transplant recipients. For transplants performed between 2012-16, 1- (3-)year patient survival was 97.9% (97.9%), and 95.5% (93.3%) for 2017-21 PTA. In comparison, 2012-16 1- (3-)year PAK patient survival was 96.6% (92.2%), which did not change for 2017-21 PAK. The cause of death was dependent on the time post-transplant. Overall, the number of deaths was low and no statistical differences between the two periods were detected. During the first 3 months post-transplant, the main reasons for death in SPK were infections (30%) and cardio-cerebrovascular events (23%). In the period 3 to 12 months after transplantation, infections and cardio-cerebrovascular events remained the main reasons followed by many ‘unknown’ or ‘other’ causes (50%). A year after transplant the cause of death of SPK patients was ‘unknown’ in 48%, infection in 17%, cardio-cerebrovascular events in 14%, and new malignancies in 6%. Of note, in the analyzed period, in 84 patient deaths the cause was COVID-19. Those deaths happened in 93% of SPK recipients.
For the first 3 years post-transplant, due to the low mortality, no significant risk factors for patient death in PTA could be detected. For PAK, only a failed kidney graft (hazard ratio = 16.5) but not a failed pancreas graft carried a significant risk of death. All other risk factors proved to be nonsignificant.
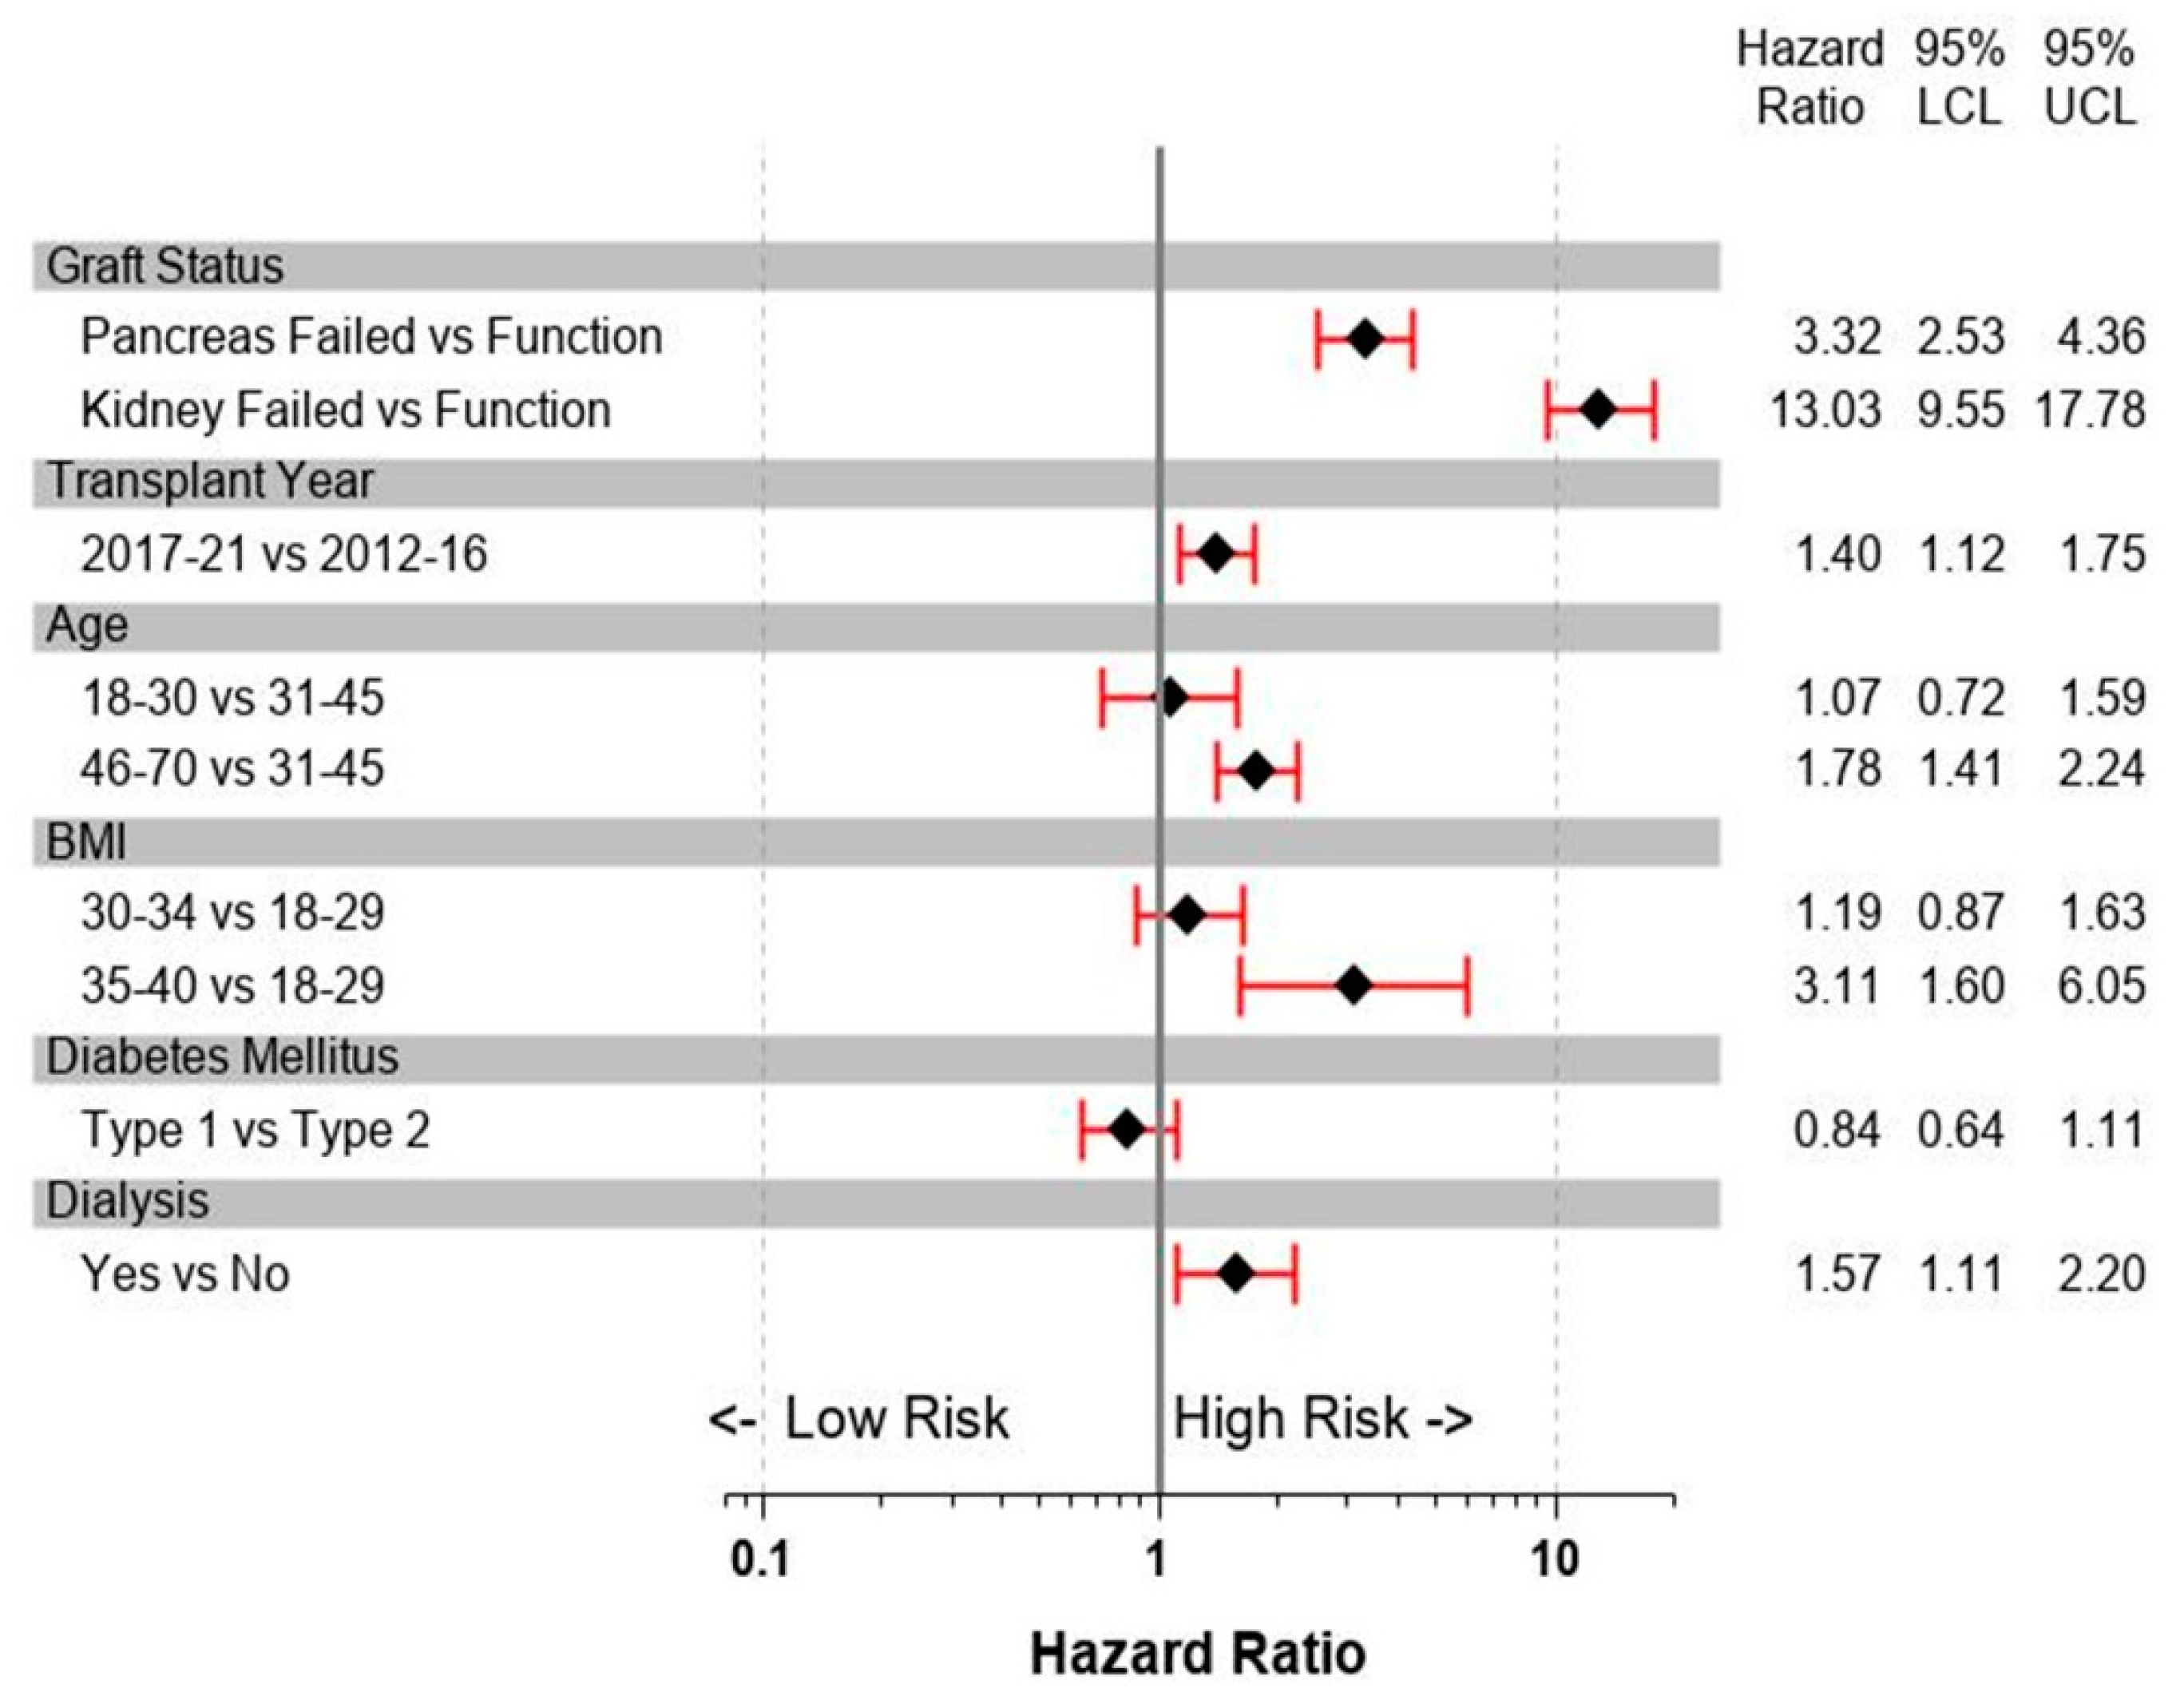
Figure 11 shows the relative risk factors (RR) for death in SPK recipients. The highest risk of dying was associated with a failed kidney graft or a failed pancreas graft. The risk of dying increased significantly with increasing age and especially with increasing BMI. Being on dialysis pre-transplant was an additional risk factor. Diabetes type had no significant impact on patient survival. Since obesity was a significant risk indicator, and patients with type 2 DM are more likely to be overweight, there may be an association between the two factors. All the other risk factors including gender, race, and center volume had no impact on SPK patient survival during the analyzed period.
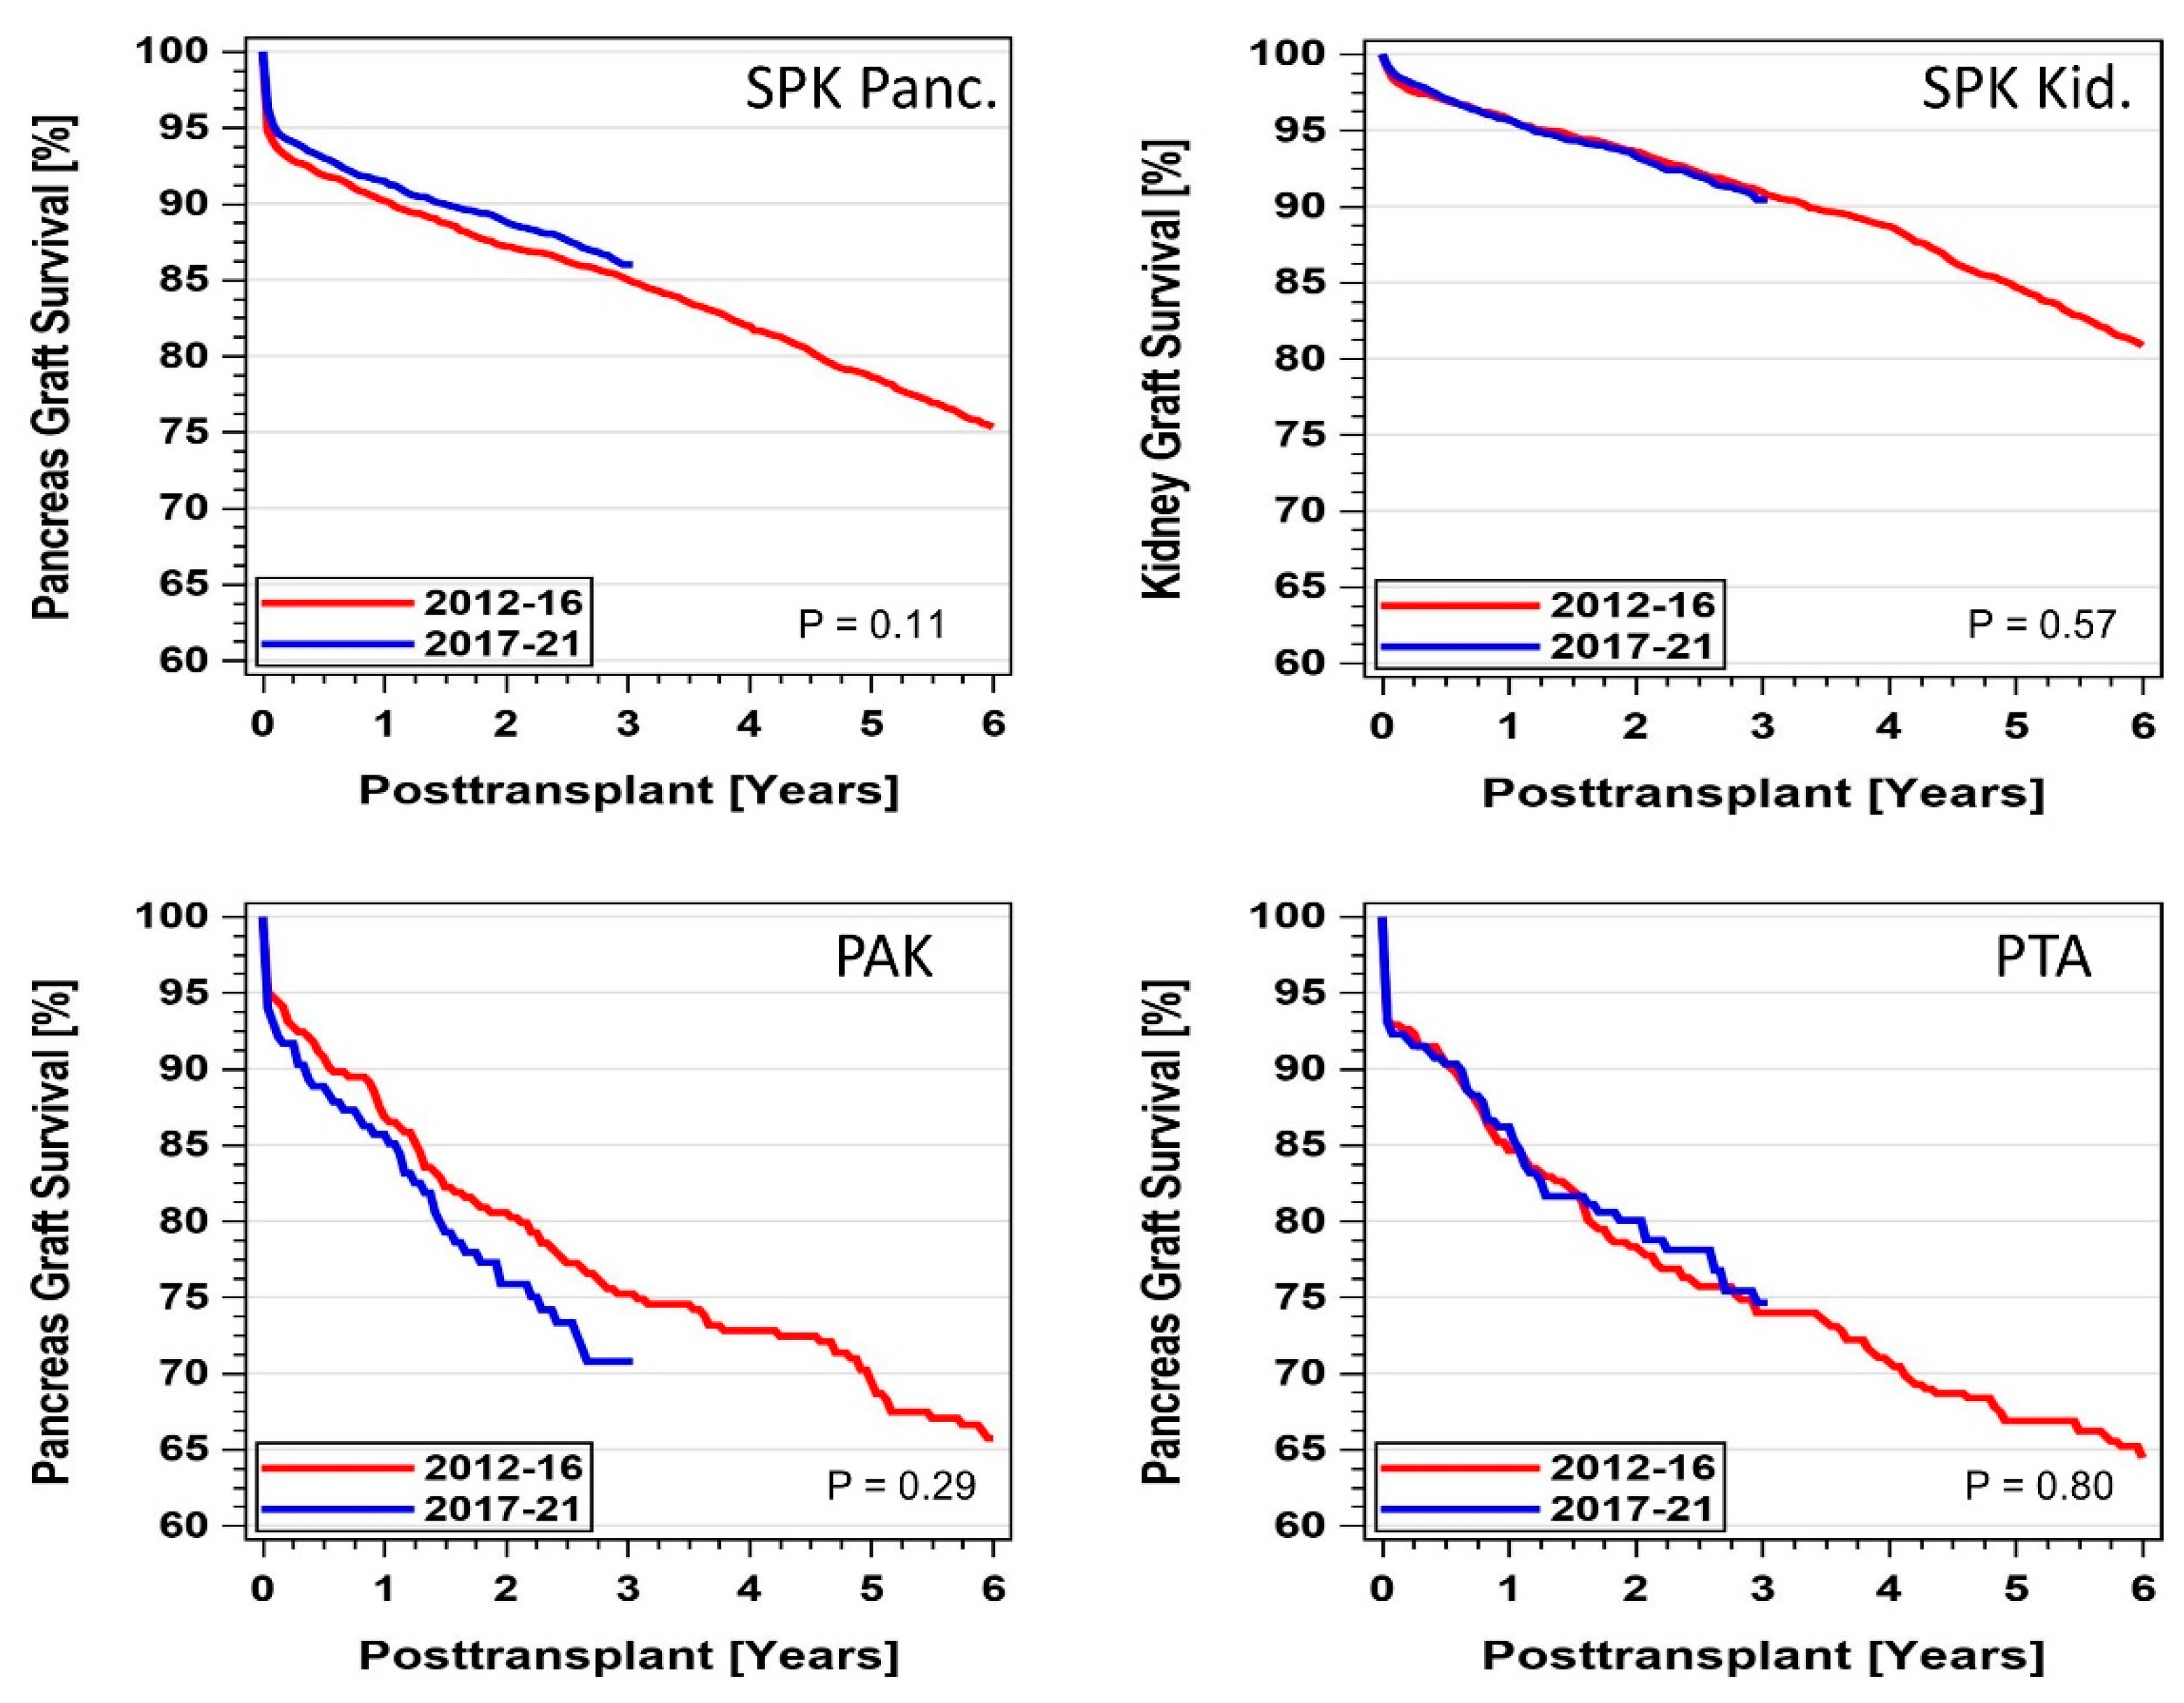
Pancreas and combined pancreas/kidney graft survival did not change significantly over the decade (Figure 12). In 2017-21, 1- (3-)year graft survival of SPK pancreas graft reached 90.5% (86.0%), along with SPK kidney 95.7% (90.5%), PAK pancreas 85.7% (70.8%), and PTA 86.2% (74.7%). The difference between SPK and the solitary pancreas transplants was statistically significant (p < 0.0001) for both periods. When ‘dying with a functioning graft’ was not counted as graft failure, the 1- (3-)year graft survival rates increased to 93.9% (91.0%) for SPK pancreas and 98.2% (95.1%) for SPK kidney transplants performed during 2017-21. A significant increase was found in comparison to 2012-16 SPK transplants (p = 0.0007). For PAK, 1- (3-)year survival for ‘death with a functioning graft’ did not change significantly during the two periods and reached 88.6% (76.1%); for PTA, 1- (3-)year graft survival reached 87.3% (77.8%). For SPK and PTA transplant recipients who reached the first year post-transplant with a functioning pancreas graft, no changes were noted in outcome between the two periods. SPK 3-year graft survival reached 94% and PTA 86.6%.
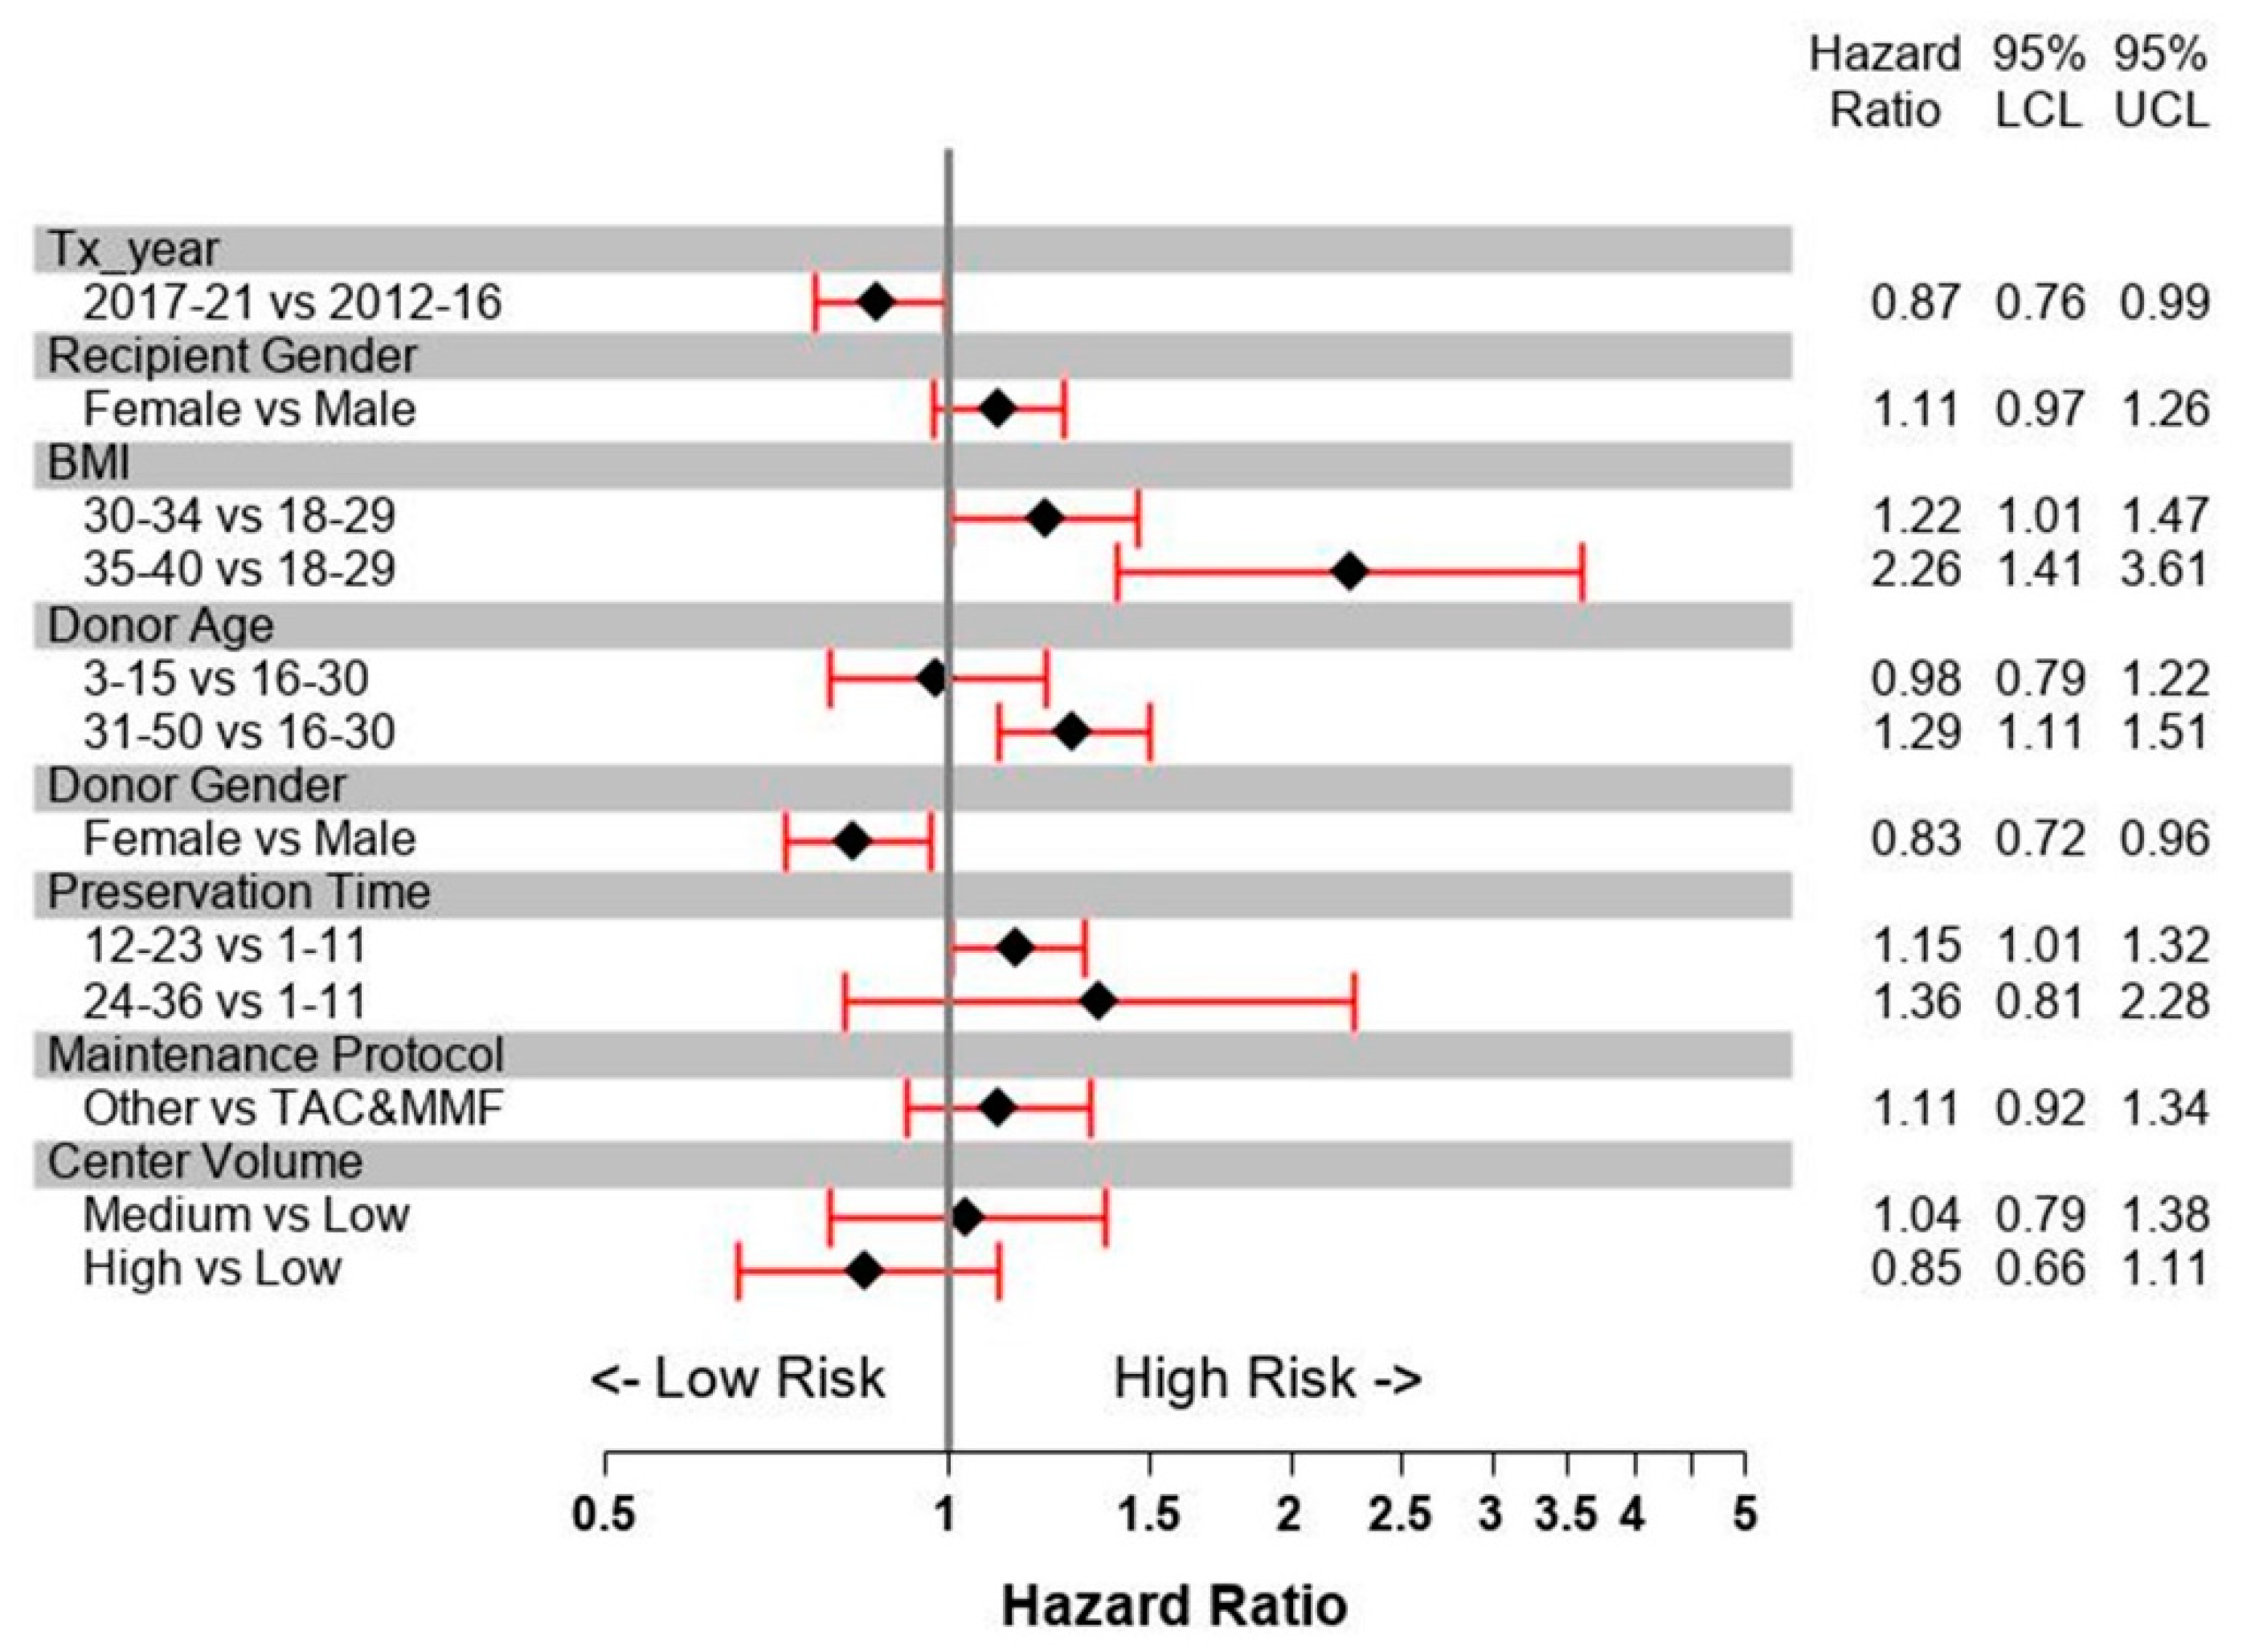
For the first 3 years post-transplant, the most influential recipient factors for SPK pancreas graft failure were gender and BMI (Figure 13). A recipient BMI over 35 kg/m2 more than doubled the risk for graft failure. Donor risk factors were age over 30 years and male donor gender. Preservation time over 12 h also increased the risk of graft failure. Maintenance protocols which were not based on the combination of tacrolimus with mycophenolate mofetil (MMF) showed a higher but nonsignificant increase in risk. With an increase in center volume, the risk of pancreas failure decreased. The multivariable model showed a significant decrease in the risk of pancreas graft failure for 2017-21 compared to 2012-16. Recipient age, diabetes type, race, pre-transplant cPRA, being on dialysis, HLA mismatch, and drainage technique did not impact outcome.
The most important risk factors for SPK kidney graft failure were similar to those of the simultaneous pancreas procedure—low transplant center volume, being on dialysis, and being under the age of 30 at the time of transplant. Recipient gender and BMI but also Black and Hispanic race showed increased risk of kidney graft failure, as well as older donor age and gender. Increased preservation time only slightly increased the risk of kidney graft failure, while increased center volume decreased it. Rarely used immunosuppressive regimens with only one drug or CsA-based regimens also carried an increased risk of kidney failure. Enteric drainage of the pancreas did not impact the outcome of simultaneous kidney grafts.
The factors with the highest impact on PAK pancreas graft failure were a young pancreas donor and short preservation time. A previous kidney graft from a young donor showed a decreased risk of pancreas graft failure. No improvement over time was noted. Pancreas transplantation during the first 2 months post kidney transplant carried a slightly increased risk of graft failure. Center volume, induction therapy, HLA mismatch, preservation time, immunosuppressive protocols, and BMI were not associated with increased risk of graft failure. No factor achieved significance.
The most influential risk factors for PTA graft failure were recipient age under 30 years (RR: 1.68, 1.03–2.75), and a maintenance protocol not using tacrolimus in combination with MMF (RR = 1.30, 1.03–1.67). Enteric drained pancreata had a significantly lower risk compared to bladder drained pancreata (RR = 0.44, 0.25–0.77). The risk of pancreas graft loss decreased with increasing transplant center volume. An increase in GFR at time of transplant significantly decreased the risk of pancreas graft loss (p = 0.05).
In all three transplant categories, early technical failures presented the most serious problem during the first 90 days post-transplant (Table 5). In SPK, the technical failure rate was significantly lowered by 1.4% between 2012-16 and 2017-21 (p = 0.003). The decline was due to the much lower rate of graft thromboses as well as a lower rate of early infections. The rates of graft pancreatitis, anastomotic leaks, and bleeding did not change over time. The failure rate of solitary transplants did not change over time and ranged between 4.9% and 6.9% (p = 0.74) (Table 5). Pancreas graft thromboses continued to present a problem and the numbers remained high. The high PTA graft thrombosis rate might have been due to misdiagnosed rejection episodes. All other complications were only rarely reported. In addition, the use of portal drainage did not impact the technical failure rates in SPK (p = 0.91), but resulted in lower rates in PTA and PAK. None of the comparisons reached statistical significance.
Immunological graft loss in technically successful pancreas transplants is shown in Figure 14. At 3 years post-transplant, the immunological graft loss in SPK pancreata improved significantly between 2012-16 and 2017-21, from 4.3% to 3.0% (p = 0.007). This was only slightly higher than the reported immunological loss in the combined kidney graft, which did not change during the observed time. In contrast, immunological graft loss rates were significantly higher in solitary transplants (p < 0.0001). No reduction in the loss rates was detected over time, and at 3 years post-transplant the PAK loss rate was 11.9% and 14.4% for PTA.
The risk factors for immunological loss during the first 3 years post-transplant were younger age, Black race, and treatment for acute rejection episodes during the first year post-transplant, in all 3 transplant categories. The use of induction therapy and a maintenance protocol of tacrolimus in combination with MMF provided a lower relative risk of immunological graft loss, especially for PTA. The use of induction therapy reduced the risk of graft loss by 23% in PTA (RR = 0.77, 0.26–1.63). Tacrolimus in combination with MMF reduced the risk of graft loss by 50% (RR = 0.49 (0.22–1.01). The impact of immunosuppression on immunological graft loss in SPK and PAK did not achieve significance, because most transplants received induction therapy in combination with tacrolimus and MMF. None of the remaining factors reached significance.
4. Discussion
Worldwide, the number of patients with type 1 as well as type 2 diabetes is rapidly increasing. This presents a multitude of serious challenges for developed as well as developing countries. Even with improvements in new technologies, a successful pancreas transplant will remain for some patients the best option for an insulin-free life. East Asian and Middle Eastern countries as well as Oceania have seen constant growth in transplant activity. This was especially noted for those countries where type 2 DM is an increasing public health problem.
The outcomes of pancreas transplantation have significantly improved since the first transplants for patients with brittle diabetes and/or end-stage renal disease [8]. It proves to be at present the best short- and long-term treatment to achieve insulin-independence, good metabolic control, and an improvement in quality of life for the patient [9]. In addition, it may be able to avoid, ameliorate, or even reverse secondary diabetic complications [10,11,12,13,14,15,16,17,18,19]. Considerable work has been carried out to improve and standardize the procedures [20]. Regardless of this progress, the overall numbers in the USA declined significantly before 2015 and only in 2016 for the first time was an increase noted, especially in SPK.
Of concern is the drop in PAK during the analyzed period. This approach offers the diabetic patient the opportunity to receive first a living or deceased kidney to correct uremia as soon as possible. Later, a solitary pancreas transplant can be performed when a good pancreas graft is available [17,18,19]. The outcomes of PAK have not reached the results for SPK, and with the decline in numbers and centers no real improvement was noted during the past decade. PAK can be a life-preserving procedure because it avoids long-term dialysis and mortality on the waitlist. It provides the opportunity to find a good pancreas graft after the kidney transplant, to correct the underlying diabetes and provide excellent metabolic control [21]. A kidney transplant alone corrects only the secondary diabetic complication but not the reason for the underlying problem. A recurrence of diabetic nephropathy can be detected some years post-transplant, but other diabetic complications may progress. Nevertheless, many centers have ceased to perform PAK.
The numbers of PTA remained relatively stable during the analyzed time. PTA offers the only effective treatment option for patients with severe brittle diabetes but still with good native kidney function [22]. Especially, patient survival was the highest compared to the other transplant categories, and it offered the best rate of one-year patient survival among all whole organ transplants. It is known that early correction of metabolic control with transplantation can be lifesaving. The mortality risk for patients with hypoglycemia waiting for a pancreas cannot be neglected [23]. Therefore, a solitary transplant should be considered early before the patient develops end-stage renal disease. There is still a reluctance to consider pancreas transplantation without the development of more severe diabetic secondary complications, because many physicians believe that exogenous insulin administration outweighs the surgical risk and the risk of long-term immunosuppression. Since solitary pancreas transplants are not considered to be a life-saving procedure, many centers did not perform this procedure during COVID-19, which additionally led to further decline in numbers between 2020 and 2021.
Most pancreas transplants were performed simultaneously with a kidney graft, and in these cases outcomes improved significantly. This procedure not offers excellent metabolic control not only for patients with type 1 diabetes mellitus but also recently for a growing number of patients with type 2 diabetes mellitus [24,25]. Therefore, the overall characteristics of recipients are shifting. Recipients’ age and BMI have increased and the racial distribution changed, ultimately leading to an increase in risk factors [8].
A worldwide standardization of pancreas transplantation can be noted. Most transplants were performed with enteric drainage, and the number of cases with vascular drainage through the portal vein declined. Most recipients received induction therapy with depleting antibodies and a maintenance protocol of tacrolimus in combination with MMF. The initial promising use of sirolimus-based protocols declined significantly and later were only infrequently used.
Careful recipient and donor selection, improved surgical techniques, and refined immunosuppressive protocols have provided excellent outcomes for patient and graft survival. These facts about the recent achievements in pancreas transplantation should be extended to physicians in general so that they feel better equipped to refer suitable patients for transplantation and are able to manage, counsel, and support them.
Wider distribution of this information may help to reduce the reluctance of physicians to refer labile diabetic patients for pancreas transplantation. Many recall the initial results and still consider it an extreme measure to control diabetes.
Funding
This research received no external funding.
Institutional Review Board Statement
SUNY Downstate: IRB exempt was given for the analysis of deidentified information (#1841093-1).
Informed Consent Statement
Not required for this kind of secondary data analysis.
Data Availability Statement
Data can be requested from the author.
Conflicts of Interest
The author declares no conflict of interest.
Abbreviations
| BMI | Body mass index |
| DM | Diabetes Mellitus |
| OPTN | Organ Procurement and Transplantation Network |
| PAK | Pancreas after kidney |
| PMP | Per million population |
| PTA | Pancreas transplant alone |
| RR | Relative risk |
| SPK | Simultaneous pancreas–kidney transplant |
| UK | United Kingdom |
| UNOS | United Network for Organ Sharing |
| US | United States |
References
- Saeedi, P.; Petersohn, I.; Salpea, P.; Malanda, B.; Karuranga, S.; Unwin, N.; Colagiuri, S.; Guariguata, L.; Motala, A.A.; Ogurtsova, K.; et al. Global and regional diabetes prevalence estimates for 2019 and projections for 2030 and 2045: Results from the International Diabetes Federation Diabetes Atlas. Diabetes Res. Clin. Pr. 2019, 157, 107843. [Google Scholar] [CrossRef]
- Diabetes Control and Complications Trial (DCCT)/Epidemiology of Diabetes Interventions and Complications (EDIC) Study Research Group. Intensive Diabetes Treatment and Cardiovascular Outcomes in Type 1 Diabetes: The DCCT/EDIC Study 30-Year Follow-up. Diabetes Care 2016, 39, 686–693. [Google Scholar] [CrossRef] [PubMed]
- Xie, J.; Wang, M.; Long, Z.; Ning, H.; Li, J.; Cao, Y.; Liao, Y.; Liu, G.; Wang, F.; Pan, A. Global burden of type 2 diabetes in adolescents and young adults, 1990–2019: Systematic analysis of the Global Burden of Disease Study 2019. BMJ 2022, 379, e072385. [Google Scholar] [CrossRef]
- Fridell, J.A.; Stratta, R.J. Modern indications for referral for kidney and pancreas transplantation. Curr. Opin. Nephrol. Hypertens. 2023, 32, 4–12. [Google Scholar] [CrossRef] [PubMed]
- American Diabetes Association Professional Practice Committee. 6. Glycemic Targets: Standards of Medical Care in Diabetes-2022. Diabetes Care 2022, 45, S83–S96. [Google Scholar] [CrossRef] [PubMed]
- Kelly, W.D.; Lillehei, R.C.; Merkel, F.K.; Idezuki, Y.; Goetz, F.C. Allotransplantation of the pancreas and duodenum along with the kidney in diabetic nephropathy. Surgery 1967, 61, 827–837. [Google Scholar] [CrossRef]
- Sutherland, D.E. Pancreas and islet transplantation: II. Clinical trials. Diabetologia 1981, 20, 435–450. [Google Scholar] [CrossRef]
- Gruessner, A.C.; Gruessner, R.W.G. The 2022 International Pancreas Transplant Registry Report—A Review. Transplant. Proc. 2022, 54, 1918–1943. [Google Scholar] [CrossRef]
- McCune, K.; Owen-Simon, N.; Dube, G.; Sandoval, P.; Ratner, L. The best insulin delivery is a human pancreas. Clin. Transplant. 2023. [Google Scholar] [CrossRef]
- Fioretto, P.; Barzon, I.; Mauer, M. Is diabetic nephropathy reversible? Diabetes Res. Clin. Pract. 2014, 104, 323–328. [Google Scholar] [CrossRef]
- Dunn, T.B. Life after pancreas transplantation: Reversal of diabetic lesions. Curr. Opin. Organ Transplant. 2014, 19, 73–79. [Google Scholar] [CrossRef] [PubMed]
- La Rocca, E.; Fiorina, P.; Di Carlo, V.; Astorri, E.; Rossetti, C.; Lucignani, G.; Fazio, F.; Giudici, D.; Cristallo, M.; Bianchi, G.; et al. Cardiovascular outcomes after kidney-pancreas and kidney-alone transplantation. Kidney Int. 2001, 60, 1964–1971. [Google Scholar] [CrossRef] [PubMed]
- Fiorina, P.; La Rocca, E.; Venturini, M.; Minicucci, F.; Fermo, I.; Paroni, R.; D’angelo, A.; Sblendido, M.; Di Carlo, V.; Cristallo, M.; et al. Effects of kidney-pancreas transplantation on atherosclerotic risk factors and endothelial function in patients with uremia and type 1 diabetes. Diabetes 2001, 50, 496–501. [Google Scholar] [CrossRef]
- Luan, F.L.; Miles, C.; Cibrik, D.M.; Ojo, A.O. Impact of simultaneous pancreas and kidney transplantation on cardiovascular risk factors in patients with type 1 diabetes mellitus. Transplantation 2007, 84, 541–544. [Google Scholar] [CrossRef] [PubMed]
- Havrdova, T.; Boucek, P.; Saudek, F.; Voska, L.; Lodererova, A.; Üçeyler, N.; Vondrova, H.; Skibova, J.; Lipar, K.; Sommer, C. Severe epidermal nerve fiber loss in diabetic neuropathy is not reversed by long-term normoglycemia after simultaneous pancreas and kidney transplantation. Am. J. Transplant. 2016, 16, 2196–2201. [Google Scholar] [CrossRef]
- Tona, F.; Silvestre, C.; Rigato, M.; Famoso, G.; Marchini, F.; Bonfante, L.; Neri, F.; Furian, L.; Crepaldi, C.; Iliceto, S.; et al. Coronary Microvascular Dysfunction Predicts Long-Term Outcome in Simultaneous Pancreas-Kidney Transplantation. Transplant. Proc. 2016, 48, 344–348. [Google Scholar] [CrossRef]
- Fridell, J.A.; Powelson, J.A. Pancreas after kidney transplantation: Why is the most logical option the least popular? Curr. Opin. Organ Transplant. 2015, 20, 108–114. [Google Scholar] [CrossRef]
- Fridell, J.A.; Niederhaus, S.; Urban, R.; Fox, A.; Odorico, J. Yes, we do need to demonstrate the survival advantage of pancreas after kidney transplantation. Am. J. Transplant. 2019, 19, 1243–1244. [Google Scholar] [CrossRef]
- Fridell, J.A.; Niederhaus, S.; Curry, M.; Urban, R.; Fox, A.; Odorico, J. The survival advantage of pancreas after kidney transplant. Am. J. Transplant. 2019, 19, 823–830. [Google Scholar] [CrossRef]
- Boggi, U.; Vistoli, F.; Andres, A.; Arbogast, H.P.; Badet, L.; Baronti, W.; Bartlett, S.T.; Benedetti, E.; Branchereau, J.; Burke, G.W.; et al. First World Consensus Conference on pancreas transplantation: Part II—Recommendations. Am. J. Transplant. 2021, 21, 17–59. [Google Scholar] [CrossRef] [PubMed]
- Kleinclauss, F.; Fauda, M.; Sutherland, D.E.; Kleinclauss, C.; Gruessner, R.W.; Matas, A.J.; Kasiske, B.L.; Humar, A.; Kandaswamy, R.; Kaul, S.; et al. Pancreas after living donor kidney transplants in diabetic patients: Impact on long-term kidney graft function. Clin. Transplant. 2009, 23, 437–446. [Google Scholar] [CrossRef] [PubMed]
- Stratta, R.J.; Fridell, J.A. Pancreas Transplantation Alone: Radical or Rationale? Transplantation 2021, 106, 24–25. [Google Scholar] [CrossRef] [PubMed]
- Gruessner, R.W.; Sutherland, D.E.; Gruessner, A.C. Mortality assessment for pancreas transplants. Am. J. Transplant. 2004, 4, 2018–2026. [Google Scholar] [CrossRef] [PubMed]
- Fridell, J.A.; Stratta, R.J. What Does Pancreas Transplantation for Type 2 Diabetes Even Mean? Don’t Hype the Type! Transplantation 2022, 106, 1912–1913. [Google Scholar] [CrossRef]
- Sharda, B.; Jay, C.L.; Gurung, K.; Harriman, D.; Gurram, V.; Farney, A.C.; Orlando, G.; Rogers, J.; Garner, M.; Stratta, R.J. Improved surgical outcomes following simultaneous pancreas-kidney transplantation in the contemporary era. Clin. Transplant. 2022, 36, e14792. [Google Scholar] [CrossRef]
Figure 1.
Number of pancreas transplants reported to the International Pancreas Transplant Registry (IPTR) between 17 December 1966 and 31 December 2021.
Figure 1.
Number of pancreas transplants reported to the International Pancreas Transplant Registry (IPTR) between 17 December 1966 and 31 December 2021.

Figure 2.
Number of pancreas transplants between 1 January 2012 and 31 December 2021 for selected European countries.
Figure 2.
Number of pancreas transplants between 1 January 2012 and 31 December 2021 for selected European countries.

Figure 3.
Number of pancreas transplants between 1 January 2012 and 31 December 2021 for selected Oceanian countries.
Figure 3.
Number of pancreas transplants between 1 January 2012 and 31 December 2021 for selected Oceanian countries.

Figure 4.
Number of pancreas transplants between 1 January 2012 and 31 December 2021 for selected South American countries.
Figure 4.
Number of pancreas transplants between 1 January 2012 and 31 December 2021 for selected South American countries.

Figure 5.
Number of pancreas transplants between 1 January 2012 and 31 December 2021 for selected Middle Eastern countries.
Figure 5.
Number of pancreas transplants between 1 January 2012 and 31 December 2021 for selected Middle Eastern countries.

Figure 6.
Number of pancreas transplants by country related to population size (transplants per million population) in 2021.
Figure 6.
Number of pancreas transplants by country related to population size (transplants per million population) in 2021.

Figure 7.
Percentage change of transplant numbers between 2019 and 2021 by country.

Figure 8.
Number of US deceased donor pancreas transplants between 1 January 2012 and 31 December by transplant category (PAK—pancreas after kidney transplants, PTA—pancreas transplants alone, SPK—simultaneous pancreas kidney transplants).
Figure 8.
Number of US deceased donor pancreas transplants between 1 January 2012 and 31 December by transplant category (PAK—pancreas after kidney transplants, PTA—pancreas transplants alone, SPK—simultaneous pancreas kidney transplants).

Figure 9.
US waitlist mortality by intended transplant type for patients listed between 1 January 2011 and 31 December 2021 (PAK—pancreas after kidney transplants, PTA—pancreas transplants alone, SPK—simultaneous pancreas kidney transplants).
Figure 9.
US waitlist mortality by intended transplant type for patients listed between 1 January 2011 and 31 December 2021 (PAK—pancreas after kidney transplants, PTA—pancreas transplants alone, SPK—simultaneous pancreas kidney transplants).

Figure 10.
Patient survival by category after primary deceased donor pancreas transplants performed between 1 January 2012 and 31 December 2021 (PAK—pancreas after kidney transplants, PTA—pancreas transplants alone, SPK—simultaneous pancreas kidney transplants).
Figure 10.
Patient survival by category after primary deceased donor pancreas transplants performed between 1 January 2012 and 31 December 2021 (PAK—pancreas after kidney transplants, PTA—pancreas transplants alone, SPK—simultaneous pancreas kidney transplants).

Figure 11.
Risk factors for patient survival for primary deceased donor SPK (simultaneous pancreas kidney transplants) performed between 1 January 2012 and 31 December 2021.
Figure 11.
Risk factors for patient survival for primary deceased donor SPK (simultaneous pancreas kidney transplants) performed between 1 January 2012 and 31 December 2021.

Figure 12.
Pancreas and pancreas kidney graft survival by category for primary deceased donor transplants performed between 1 January 2012 and 31 December 2021 (PAK—pancreas after kidney transplants, PTA—pancreas transplants alone, SPK—simultaneous pancreas kidney transplants).
Figure 12.
Pancreas and pancreas kidney graft survival by category for primary deceased donor transplants performed between 1 January 2012 and 31 December 2021 (PAK—pancreas after kidney transplants, PTA—pancreas transplants alone, SPK—simultaneous pancreas kidney transplants).

Figure 13.
Risk factors for pancreas graft survival for primary deceased donor SPK (simultaneous pancreas kidney transplants) performed between 1 January 2012 and 31 December 2021.
Figure 13.
Risk factors for pancreas graft survival for primary deceased donor SPK (simultaneous pancreas kidney transplants) performed between 1 January 2012 and 31 December 2021.

Figure 14.
Immunological pancreas graft loss by category for technically successful primary deceased donor pancreas transplant (PAK—pancreas after kidney transplants, PTA—pancreas transplants alone, SPK—simultaneous pancreas kidney transplants) performed between 1 January 2012 and 31 December 2021.
Figure 14.
Immunological pancreas graft loss by category for technically successful primary deceased donor pancreas transplant (PAK—pancreas after kidney transplants, PTA—pancreas transplants alone, SPK—simultaneous pancreas kidney transplants) performed between 1 January 2012 and 31 December 2021.


Table 1.
Worldwide development in the number of pancreas transplants performed between 1 January 2012 and 31 December 2021.
Table 1.
Worldwide development in the number of pancreas transplants performed between 1 January 2012 and 31 December 2021.
| # of Txs 2012–2016 | # of Txs 2017–2021 | % Change | |
|---|---|---|---|
| North America (Anglo-America) (Canada, USA,) | 4996 | 5018 | +0.4% |
| South America (Argentina, Brazil, Chile, Colombia, Cuba, Ecuador, Mexico, Peru, Uruguay) | 1083 | 1123 | +3.6% |
| Europe (Austria, Belgium, Belarus, Croatia, Czech Republic, Finland, France, Germany, Greece, Hungary, Ireland, Italy, Latvia, Lithuania, Netherlands, Norway, Poland, Portugal, Romania, Russia, Slovenia, Spain, Switzerland, UK) | 4429 | 3460 | −21.9% |
| Oceania (Australia, New Zealand) | 226 | 251 | +10.0% |
| Middle East (Iran, Israel, Kuwait, Lebanon, Saudi Arabia, Turkey) | 201 | 245 | +18.0% |
| East Asia (Japan, South Korea, Thailand, India, China) | 677 | 1080 | +37.4% |
Table 2.
Transplant recipient characteristics at transplant for primary deceased donor pancreas transplants performed between 1 January 2012 and 31 December 2021.
Table 2.
Transplant recipient characteristics at transplant for primary deceased donor pancreas transplants performed between 1 January 2012 and 31 December 2021.
| Transplant Type | SPK | PAK | PTA | ||||||
|---|---|---|---|---|---|---|---|---|---|
| Transplant Year | 2012-16 | 2017-21 | p | 2012-16 | 2017-21 | p | 2012-16 | 2017-21 | p |
| Primary Tx (%) | 3706 (48) | 4080 (52) | <0.0001 | 304 (58) | 217(42) | 0.0001 | 352 (58) | 260 (42) | 0.0002 |
| Diabetes Type | <0.0001 | 0.009 | 0.14 | ||||||
| Type 1 | 3273 (89) | 3148 (77) | 262 (93) | 184 (85) | 334 (95) | 238 (92) | |||
| Type 2 | 417 (11) | 916 (23) | 20 (7) | 27 (12) | 3 (1) | 7 (3) | |||
| Other/Unknown | 16 (0) | 16 (0) | 2 (0) | 6 (3) | 15 (4) | 15 (5) | |||
| Recipient Age (Years) | <0.0001 | 0.19 | 0.09 | ||||||
| <18 | 0 (0) | 3 (0) | 0 (0) | 0 (0) | 0 (0) | 2 (1) | |||
| 18–29 | 294 (8) | 248 (6) | 19 (6) | 9 (4) | 36 (10) | 35 (13) | |||
| 30–44 | 1996 (54) | 2131(52) | 143 (47) | 118 (54) | 143 (41) | 102 (39) | |||
| 45–59 | 1354 (36) | 1535 (38) | 133 (44) | 80 (37) | 157 (45) | 101 (39) | |||
| ≥60 | 62 (2) | 163 (4) | 9 (3) | 10 (5) | 16 (4) | 20 (8) | |||
| Gender | 0.61 | 0.07 | 0.98 | ||||||
| Male | 2309 (62) | 2519 (62) | 188 (62) | 117 (54) | 137 (39) | 101 (42) | |||
| Race | <0.0001 | 0.14 | 0.61 | ||||||
| White | 2191 (59) | 1975 (48) | 227 (76) | 144 (66) | 318 (90) | 230 (88) | |||
| Black | 850 (23) | 1216 (30) | 33 (11) | 36 (17) | 17 (5) | 14 (5) | |||
| Hispanic | 520 (14) | 677 (17) | 36 (12) | 34 (17) | 16 (5) | 12 (5) | |||
| Asian | 94 (3) | 156 (4) | 2 (0) | 2 (0) | 1 (0) | 2 (1) | |||
| Multi/Other | 51 (1) | 56 (1) | 6 (1) | 1 (0) | 0 (0) | 2 (1) | |||
| Body Mass Index | <0.0001 | 0.5 | 0.27 | ||||||
| <18.5 (underweight) | 625 (2) | 55 (1) | 8 (3) | 2 (1) | 5 (1) | 3 (1) | |||
| 18.5–24.9 (normal) | 1802 (48) | 1709 (42) | 128 (42) | 96 (44) | 139 (40) | 93 (36) | |||
| 25–29.9 (overweight) | 1426 (38) | 1723 (42) | 115 (38) | 85 (39) | 148 (42) | 103 (40) | |||
| >30 (obese) | 416 (12) | 593 (15) | 53 (17) | 34 (16) | 60 (17) | 61(23) | |||
| Recent cPRA% | <0.0001 | 0.17 | 0.92 | ||||||
| 0- < 20 | 3122 (84) | 3288 (81) | 239 (79) | 174 (80) | 271 (77) | 198 (76) | |||
| 20- < 60 | 375 (10) | 489 (12) | 39 (13) | 18 (8) | 41 (12) | 33 (13) | |||
| 60 | 209 (6) | 303 (7) | 26 (8) | 25 (11) | 40 (11) | 29 (11) | |||
| Blood Group | 0.21 | 0.82 | 0.16 | ||||||
| A | 1326 (36) | 1410 (35) | 130 (43) | 93 (43) | 140 (40) | 113 (43) | |||
| B | 449 (12) | 505 (12) | 38 (12) | 23 (10) | 40 (11) | 40 (15) | |||
| AB | 158 (4) | 145 (4) | 11 (4) | 6 (3) | 11 (3) | 4 (2) | |||
| O | 1773 (48) | 2020 (49) | 125 (41) | 95 (44) | 161 (46) | 103 (40) | |||
| Time to Tx (days) | <0.0001 | 0.99 | 0.89 | ||||||
| 0 < 30 | 377 (10) | 698 (17) | 25 (8) | 17 (8) | 62 (18) | 41 (16) | |||
| 30 < 180 | 1213 (33) | 1499 (37) | 55 (18) | 39 (18) | 139 (39) | 108 (41) | |||
| 180 < 360 | 778 (21) | 734 (18) | 63 (21) | 46 (21) | 77 (22) | 54 (21) | |||
| ≥360 | 1338 (36) | 1149 (28) | 161 (53) | 115 (53) | 74 (21) | 57 (22) | |||
| On Dialysis at Tx | 3109 (84%) | 3438 (84%) | 0.81 | - | - | - | - | ||
Table 3.
Pancreas donor characteristics for primary deceased donor pancreas transplants performed between 1 January 2012 and 31 December 2021.
Table 3.
Pancreas donor characteristics for primary deceased donor pancreas transplants performed between 1 January 2012 and 31 December 2021.
| Transplant Type | SPK | PAK | PTA | ||||||
|---|---|---|---|---|---|---|---|---|---|
| Transplant Year | 2012-16 | 2017-21 | p | 2012-16 | 2017-21 | p | 2012-16 | 2017-21 | p |
| Primary Tx (%) | 3706 (48) | 4080 (52) | <0.0001 | 304 (58) | 217(42) | 0.0001 | 352 (58) | 260 (42) | 0.0002 |
| Donor Age (Years) | 0.0001 | 0.88 | 0.15 | ||||||
| 3–15 | 395 (11) | 440 (11) | 45 (15) | 28 (13) | 53 (15) | 32 (12) | |||
| 16–30 | 2535 (68) | 2744 (67) | 211 (69) | 153 (70) | 240 (68) | 168 (65) | |||
| 31–50 | 747 (20) | 891 (22) | 48 (16) | 36 (17) | 56 (16) | 59 (23) | |||
| ≥51 | 21 (1) | 5 (0) | 0 (0) | 0 (0) | 3 (1) | 1 (0) | |||
| Donor Gender | 2581 (70) | 224 (74) | 0.99 | 0.24 | |||||
| Male | 2870 (70) | 0.8 | 160 (74) | 228 (65) | 180 (69) | ||||
| Donor Race | 0.05 | 0.56 | 0.22 | ||||||
| White | 2279 (62) | 2436 (60) | 179 (59) | 140 (65) | 232 (66) | 150 (58) | |||
| Black | 746 (20) | 809 (20) | 58 (19) | 43 (20) | 65 (18) | 59 (23) | |||
| Hispanic | 555 (15) | 697 (17) | 57 (19) | 30 (14) | 46 (13) | 45 (17) | |||
| Asian | 83 (2) | 81 (2) | 7 (2) | 3 (1) | 6 (2) | 2 (1) | |||
| Other/MultRace | 43 (1) | 57 (1) | 3 (1) | 1 (0) | 3 (1) | 4 (1) | |||
| Donor Cause of Death | 0.007 | 0.2 | |||||||
| Trauma | 2924 (80) | 3309 (83) | 236 (79) | 182 (85) | 261 (77) | 196 (76) | 0.39 | ||
| CCV | 719 (20) | 682 (17) | 62 (21) | 33 (15) | 71 (21) | 59 (23) | |||
| CNS Tumor | 9 (0) | 15 (0) | 1 (0) | 0 (0) | 7 (2 | 2 (1) | |||
| DCD Donor | 94 (2) | 132 (3) | 0.07 | 1 (0) | 1 (0) | - | 10 (3) | 7 (3) | 0.91 |
| Donor Body Mass Index | 0.38 | 0.09 | 0.25 | ||||||
| <18.5 (underweight) | 251 (7) | 288 (7) | 16 (5) | 24 (11) | 33 (9) | 20 (8) | |||
| 18.5-24.9(normal) | 2128 (57) | 2310(57) | 184 (61) | 118 (54) | 217 (62) | 146 (56) | |||
| 25-29.9 (overweight) | 1080 (29) | 1241 (30) | 90 (30) | 66 (31) | 93 (26) | 83 (32) | |||
| >30 (obese) | 244 (7) | 240 (6) | 14 (4) | 9 (4) | 9 (3) | 11 (4) | |||
| HLA A, B, DR Mismatch | 0.69 | 0.4 | 0.47 | ||||||
| 0 | 18 (0) | 15 (0) | 0 (0) | 1 (0) | 3 (1) | 2 (1) | |||
| 1 | 16 (0) | 21 (0) | 5 (2) | 2 (1) | 4 (1) | 1 (0) | |||
| 2 | 105 (3) | 121 (3) | 16 (5) | 7 (3) | 28 (8) | 18 (7) | |||
| 3 | 438 (12) | 452 (11) | 43 (14) | 25 (12) | 59 (17) | 33 (13) | |||
| 4 | 995 (27) | 1050 (26) | 73 (24) | 53 (24) | 88 (25) | 59 (23) | |||
| 5 | 1307 (35) | 1486 (36) | 114 (38) | 78 (36) | 103 (29) | 84 (32) | |||
| 6 | 827 (22) | 935 (23) | 53 (17) | 51 (24) | 67 (19) | 63 (24) | |||
| PreservationTime (h) | <0.0001 | 0.42 | 0.02 | ||||||
| 0 < 12 | 2375 (66) | 2817 (70) | 177 (61) | 139 (64) | 180 (53) | 162 (63) | |||
| 12–23 | 1130 (32) | 1174 (29) | 115 (39) | 75 (35) | 159 (46) | 95 (37) | |||
| >24 | 62 (2) | 26 (1) | 1 (0) | 2 (1) | 3 (1) | 0 (0) | |||
Table 4.
Transplant characteristics for primary deceased donor pancreas transplants performed between 1 January 2012 and 31 December 2021.
Table 4.
Transplant characteristics for primary deceased donor pancreas transplants performed between 1 January 2012 and 31 December 2021.
| Transplant Typer | SPK | PAK | PTA | ||||||
|---|---|---|---|---|---|---|---|---|---|
| Transplant Year | 2012-16 | 2017-21 | P | 2012-16 | 2017-21 | p | 2012-16 | 2017-21 | p |
| Primary Tx (%) | 3706 (48) | 4080 (52) | <0.0001 | 304 (58) | 217(42) | 0.0001 | 352 (58) | 260 (42) | 0.0002 |
| TxCenter Volume | 0.004 | 0.93 | 0.09 | ||||||
| Low | 188 (5) | 279 (7) | 34 (11) | 22 (10) | 14 (4) | 7 (3) | |||
| Medium | 881 (24) | 976 (24) | 75 (25) | 55 (25) | 46 (13) | 21 (8) | |||
| Large | 2637 (71) | 2825 (69) | 195 (64) | 140 (65) | 292 (89) | 232 (89) | |||
| Duct Management | <0.0001 | 0.04 | 0.0006 | ||||||
| Enteric drainage | 3417 (93) | 3821 (97) | 282 (93) | 209 (98) | 317 (91) | 247 (97) | |||
| Bladder drainage | 268 (7) | 127 (3) | 20 (7) | 4 (2) | 31 (9) | 6 (2) | |||
| Duct Injection | 6 (0) | 10 (0) | 2 (0) | 1 (0) | 0 (0) | 3 (1) | |||
| Venous Mgmt (EDTxs) | <0.0001 | 0.89 | 0.07 | ||||||
| Systemic drainage | 2735 (80) | 3362 (88) | 259 (93) | 194 (93) | 282 (89) | 230 (94) | |||
| Portal drainge | 671 (20) | 451 (12) | 21 (7) | 15 (7) | 34 (11) | 16 (6) | |||
| Induction Therapy | <0.0001 | 0.81 | 0.07 | ||||||
| None | 367 (10) | 307 (8) | 23 (8) | 12 (6) | 22 (6) | 15 (6) | |||
| Non-depleting AB | 247 (7) | 144 (4) | 11 (4) | 8 (4) | 17 (5) | 7 (3) | |||
| Depleting AB | 2941 (80) | 3416 (85) | 263 (88) | 192 (90) | 290 (86) | 236 (91) | |||
| Both | 107 (3) | 169 (4) | 2 (0) | 1 (0) | 9 (3) | 1 (0) | |||
| Steroid Maintenance | 0.19 | 0.007 | 0.0009 | ||||||
| No | 1100 (30) | 1158 (29) | 111 (37) | 55 (26) | 151 (45) | 81 (31) | |||
| Yes | 2562 (70) | 2878 (71) | 188 (63) | 158 (74) | 187 (55) | 178 (69) | |||
| Maintenance Protocol | <0.0001 | <0.0001 | <0.0001 | ||||||
| Tac&MMF | 3361 (92) | 3195 (81) | 273 (92) | 168 (82) | 276 (84) | 214 (87) | |||
| Srl Based | 135 (4) | 16 (0) | 13 (4) | 1 (0) | 41 (13) | 5 (2) | |||
| Tac | 50 (1) | 436 (11) | 4 (1) | 21 (10) | 4 (1) | 19 (8) | |||
| MMF | 33 (1) | 272 (7) | 4 (1) | 17 (8) | 7 (2) | 8 (3) | |||
| CsA&MMF | 69 (2) | 16 (0) | 4 (1) | 0 (0) | 2 (0) | 0 (0) | |||
Table 5.
Technical failures in enteric and bladder-drained pancreas transplants performed between 1 January 2012 and 31 December 2021.
Table 5.
Technical failures in enteric and bladder-drained pancreas transplants performed between 1 January 2012 and 31 December 2021.
| Transplant Type | SPK | PAK | PTA | ||||||
|---|---|---|---|---|---|---|---|---|---|
| Transplant Year | 2012-16 | 2017-21 | p | 2012-16 | 2017-21 | p | 2012-16 | 2017-21 | p |
| Overall Early Technical Failure Rate (%) | 5.4 | 4.0 | 0.003 | 4.9 | 5.5 | 0.76 | 6.5 | 6.9 | 0.84 |
| Graft Thrombosis (%) | 4.2 | 2.6 | 4.0 | 4.2 | 5.7 | 6.2 | |||
| Infection (%) | 0.6 | 0.3 | 0.7 | 0.5 | 0.3 | 0.4 | |||
| Pancreatitis (%) | 0.2 | 0.2 | 0.0 | 0.5 | 0.0 | 0.0 | |||
| Anastomotic Leak (%) | 0.4 | 0.4 | 0.3 | 0.0 | 0.3 | 0.0 | |||
| Bleeding (%) | 0.1 | 0.4 | 0.0 | 0.5 | 0.3 | 0.0 | |||
Disclaimer/Publisher’s Note: The statements, opinions and data contained in all publications are solely those of the individual author(s) and contributor(s) and not of MDPI and/or the editor(s). MDPI and/or the editor(s) disclaim responsibility for any injury to people or property resulting from any ideas, methods, instructions or products referred to in the content. |
© 2023 by the author. Licensee MDPI, Basel, Switzerland. This article is an open access article distributed under the terms and conditions of the Creative Commons Attribution (CC BY) license (https://creativecommons.org/licenses/by/4.0/).
Share and Cite
MDPI and ACS Style
Gruessner, A.C. A Decade of Pancreas Transplantation—A Registry Report. Uro 2023, 3, 132-150. https://doi.org/10.3390/uro3020015
AMA Style
Gruessner AC. A Decade of Pancreas Transplantation—A Registry Report. Uro. 2023; 3(2):132-150. https://doi.org/10.3390/uro3020015
Chicago/Turabian StyleGruessner, Angelika C. 2023. "A Decade of Pancreas Transplantation—A Registry Report" Uro 3, no. 2: 132-150. https://doi.org/10.3390/uro3020015