Article

On Design Challenges of Portable Nuclear Magnetic Resonance System

by
Mohsen Hosseinzadehtaher
1,*,
Silvanus D’silva
1,
Matthew Baker
1,
Ritesh Kumar
2,
Nathan T. Hein
2,
Mohammad B. Shadmand
1,
S.V. Krishna Jagadish
3 and
Behzad Ghanbarian
4
1
Department of Electrical and Computer Engineering, College of Engineering, University of Illinois Chicago, Chicago, IL 60607, USA
2
Department of Agronomy, Kansas State University, Manhattan, KS 66506, USA
3
Department of Plant and Soil Science, Texas Tech University, Lubbock, TX 79409, USA
4
Porous Media Research Lab, Department of Geology, Kansas State University, Manhattan, KS 66506, USA
*
Author to whom correspondence should be addressed.
J. Nucl. Eng. 2023, 4(2), 323-337; https://doi.org/10.3390/jne4020025
Submission received: 1 December 2022 / Revised: 20 March 2023 / Accepted: 12 April 2023 / Published: 18 April 2023

Abstract

:
This article studies the optimal design approach for a portable nuclear magnetic resonance (NMR) system for use in non-destructive flow measurement applications. The mechanical and electromagnetic design procedures were carried out using the Ansys Maxwell finite-element analysis (FEA) software tool. The proposed procedure considered homogeneity and strength constraints while ensuring the desired functionality of the intended device for a given application. A modified particle swarm optimization (MPSO) algorithm was proposed as a reference design framework for optimization stages. The optimally designed NMR tool was prototyped, and its functionality was validated via several case studies. To assess the functionality of the prototyped device, Larmor frequency for hydrogen atom was captured and compared with theoretical results. Furthermore, the functionality and accuracy of the prototyped NMR tool is compared to the off-the-shelf NMR tool. Results demonstrated the feasibility and accuracy of the prototyped NMR tool constrained by factors, such as being lightweight and compact.

1. Introduction

In the past few years, designing a portable device to take advantage of emerging nuclear magnetic resonance (NMR) technology has attracted the attention of many researchers [1,2,3,4,5]. However, achieving this goal requires finding optimal solutions while maintaining restrictions, such as weight, signal-to-noise ratio (SNR), magnetic field strength, and homogeneity [6,7,8,9]. Based on the main impetus of the NMR technology, which is a nondestructive advanced imaging technique, having a strong and homogenous static magnetic field can improve the detectability of the atom’s reaction in the sample under study. As realizing the accurate Larmor frequency is of interest in many research disciplines, it should be mentioned that there is a direct relation between the Larmor frequency and the static magnetic field strength. Thus, by strengthening the magnetic field in the region of the test (RoT), SNR shows a considerable increase, which results in a more accurate analysis.
Halbach arrays underline some outstanding features that designate them as a potential candidate to be used in optimal NMR design [10,11,12,13]. The high amount of magnetic field per mass, appropriate homogeneity, and easy handling are some well-known characteristics of these magnetic arrays. However, using Halbach arrays for constructing the NMR has some challenges as well [10,12]. For example, multi-direction pulling magnetic forces can be strong enough such that an intended openable structure might just not be feasible in practice. Furthermore, it should be noted that extreme amounts of pulling forces might gradually misalign the NMR mechanical structure and degrade the homogeneity of the magnetic field in the RoT. Therefore, it is necessary to provide an applicable design to reduce the pulling forces among the magnets [14,15,16].
Additionally, inherent inaccuracies in the manufacturing process of magnetic segments are other limitations for the NMR design process and have several undesirable impacts on the homogeneity of the magnetic fields when investigated by a finite element analysis (FEA) method. In some of the literature, FEA is employed to compare new designs for magnetic devices with conventional approaches to show the advantages of the new designed approaches [17]. For optimizing the pulling force, the methodology that has been mentioned in [18] is used to minimize this force that predominantly depends on the mechanical structure of the Halbach arrays. The highest level of homogeneity can be attained for relatively long magnetic arrays. However, in practice, having a long test device is not feasible given the application limits. Additionally, as mentioned before, inaccuracies in the production procedure highly impact the homogeneity of these magnetic arrays. To overcome this problem, magnetic arrangement for the discrete Halbach layout approach is employed in numerous design processes [19]. Hence, a consistent and homogenous field of desired field strength can be achieved from a structure of restricted length made by placing small permanent magnets in optimized positions. Such optimized placement can be determined by employing an optimization algorithm that mainly depends on analytical calculations. Various studies have been presented in the literature focusing on the use of low-field NMR on microscopic flow measurement [20,21,22], process and reaction monitoring [23,24], and remote NMR detection [25]. Furthermore, advanced studies using time-of-flight magnetic resonance for fluid flow and dispersion measurement have been proposed in [26,27]. This technique has further been applied for flow measurements in microfluidic chips in [28,29]. Other potential applications are in sap flow measurement in plant stem is discussed in [30,31]. The detailed discussion on sap flow measurement in plant stem is discussed in the literature [15,16] and lies beyond the scope of this article.
This paper studies the optimal design of the NMR tool via analytical methods, the FEA technique-based Ansys Maxwell software tool, followed by validation via experimental tests. An extensive FEA-based magnetic field strength and homogeneity evaluation for different NMR tool geometries is studied, which is not very well addressed in the literature. In each stage of the design process, simulation outcomes are assessed based on the pre-defined problem goals. Later, the approved design is prototyped, and theoretical and FEA simulation results are validated experimentally. The pre-defined constraints of the optimal designed portable NMR tool are for the flow measurement as a potential application. Thus, the main contributions of this paper include: (a) a detailed analytical study of portable NMR tool shedding light on the impact of the NMR tool geometry on magnetic field strength and homogeneity, (b) a modified particle swarm optimization (MPSO) algorithm as a reference design framework for the optimization stage of the portable NMR tool, and (c) an experimental validation of prototyped NMR tool performance.
The rest of this article is organized as follows: Section 2 discusses the electromagnetic backbone theories and fundamentals of optimization algorithm with an emphasis on the methodology that has been deployed in this framework. Later, in Section 3, finite element analysis is carried out regarding different geometries and design parameters, and the results are compared with each other to choose the optimal design among all potential candidate designs. Section 4 covers the prototyping procedures for the approved design for the considered application. In this section, all methodologies and processes as well as mechanical and electrical challenges are presented. Next, the functionality of the prototyped NMR tool is evaluated via several cases studies. Several experimental tests for Larmor frequency findings are carried out. Finally, Section 5 concludes all the remarks that have been proposed in this article.

2. Background Theory and Optimization Algorithm

In this section, electromagnetic equations are presented that clarify the main idea of the design strategy. As mentioned above, the multi-direction magnetic pulling force can be significantly large. Hence, an optimal design angle should be determined in which the pulling force is minimal. Based on the fundamentals of Maxwell’s pulling force (F), there is a direct relation between the remanence (Rem) and the electromagnetic force, which is given by
R e m 2 F μ 0 A
F R e m 2 i f A = C o n s t . A 2 i f R e m = C o n s t .
where μ 0 is free space permeability, and A is the side length of each magnetic segment in (1). As seen in (2), the electromagnetic force is directly proportional to the square of A or Rem. If two dipoles have different magnetic moments, then the attractive force on the first dipole, which exists in an external magnetic field, is simplified and given by
F ( ξ ) = 3 2 2 d 2 μ 0 m 1 m 2 π 2 1 1.5 cos 2 ( ξ ) ξ + ψ = π 2
where d is the direct distance between the magnetic segment, and mi is the moment for the ith magnetic cube. It should be noted that ψ is the angle between the magnetic moments of the segments. To minimize the force F, the value of ψ needs to be determined. Through mathematical analysis, the optimum ξ in (3) converges to 0.6154 radians. According to the problem objective and the application goal, the designed NMR tool should have features, such as lightweight, small size, and strong and homogeneous magnetic field. Though the application of NMR in nondestructive analysis has been studied in areas, such as plant growth monitoring [16] and food quality control [32], its application in flow measurement studies still has a huge potential yet to be explored. The authors of [15] have performed some initial groundwork in this direction where they deploy the nondestructive imaging feature of NMR for sap flow measurement in plants. However, this is just a preliminary work and does not consider the optimal designing of the portable NMR with due consideration on weight, size, magnetic field strength, and other practical constraints. In this manuscript, we are considering different geometries and provide their magnetic field strength and homogeneity as a reference design. The authors of [33] have proposed some initial work in this direction by proposing a method for increasing the homogeneity of the magnetic field in the portable NMR. In accordance, this article aims to shed light on the practical implementation aspects of the portable NMR concept. Consequently, a modified particle swarm optimization (MPSO) algorithm was employed in this work to find an optimal solution based on the pre-defined objectives. At this point, the magnetic segments’ shapes, the dimension of the RoT, and the height of the NMR are considered as the design parameters in the optimization. Based on the PSO fundamental, positions and velocity of each particle were initialized for every dimension. For each of these particles, the FEA determined the magnetic fields in the RoT. In this step, a proper objective function and practical criterion should be defined. The objective function considers all designed variables, and the criteria define the stopping point of the iteration process. If the criteria are not satisfied in the nth iteration, the velocity and positions of each particle need to be updated, and the process is repeated. Considering homogeneity and strength of the magnetic field as the primary objectives in this study, the objective function was built by three terms, which are given by
g ( ρ , θ , z ) = a 1 + c 1 h 1 ( ρ , θ , z ) + d 2 s 2 ( ρ , θ , z ) h 1 = v 1 ( ρ , θ , z ) h 1 ( ρ , θ , z ) , s 2 = B 1 ( ρ , θ , z ) v ( ρ , θ , z )
where a1 is the optimum openable angle, h1 is the homogeneity function, and s2 is the strength function for each magnetic segment. These functions were formed in a cylindrical coordinates system, where ρ is the radial distance, θ is angular coordinate, and z is the height from the reference point. In (4), v is the final volume of the magnetic segments, h is the field’s homogeneity in the RoT, and B is the maximum magnetic strength. To determine the coefficients in the objective function, one can define the constant values that satisfy the criterion c1 + d2 = 1. It should be noted that these coefficients act as the objective function’s weight factors and can be valued based on the importance of each term in the problem objective. Typically, a trade-off analysis for defining these constants can be carried out. Finally, the function g was optimized based on the defined criteria. However, in this methodology, the calculation burden is lessened when the optimum openable angle is found by (3) in the former step.

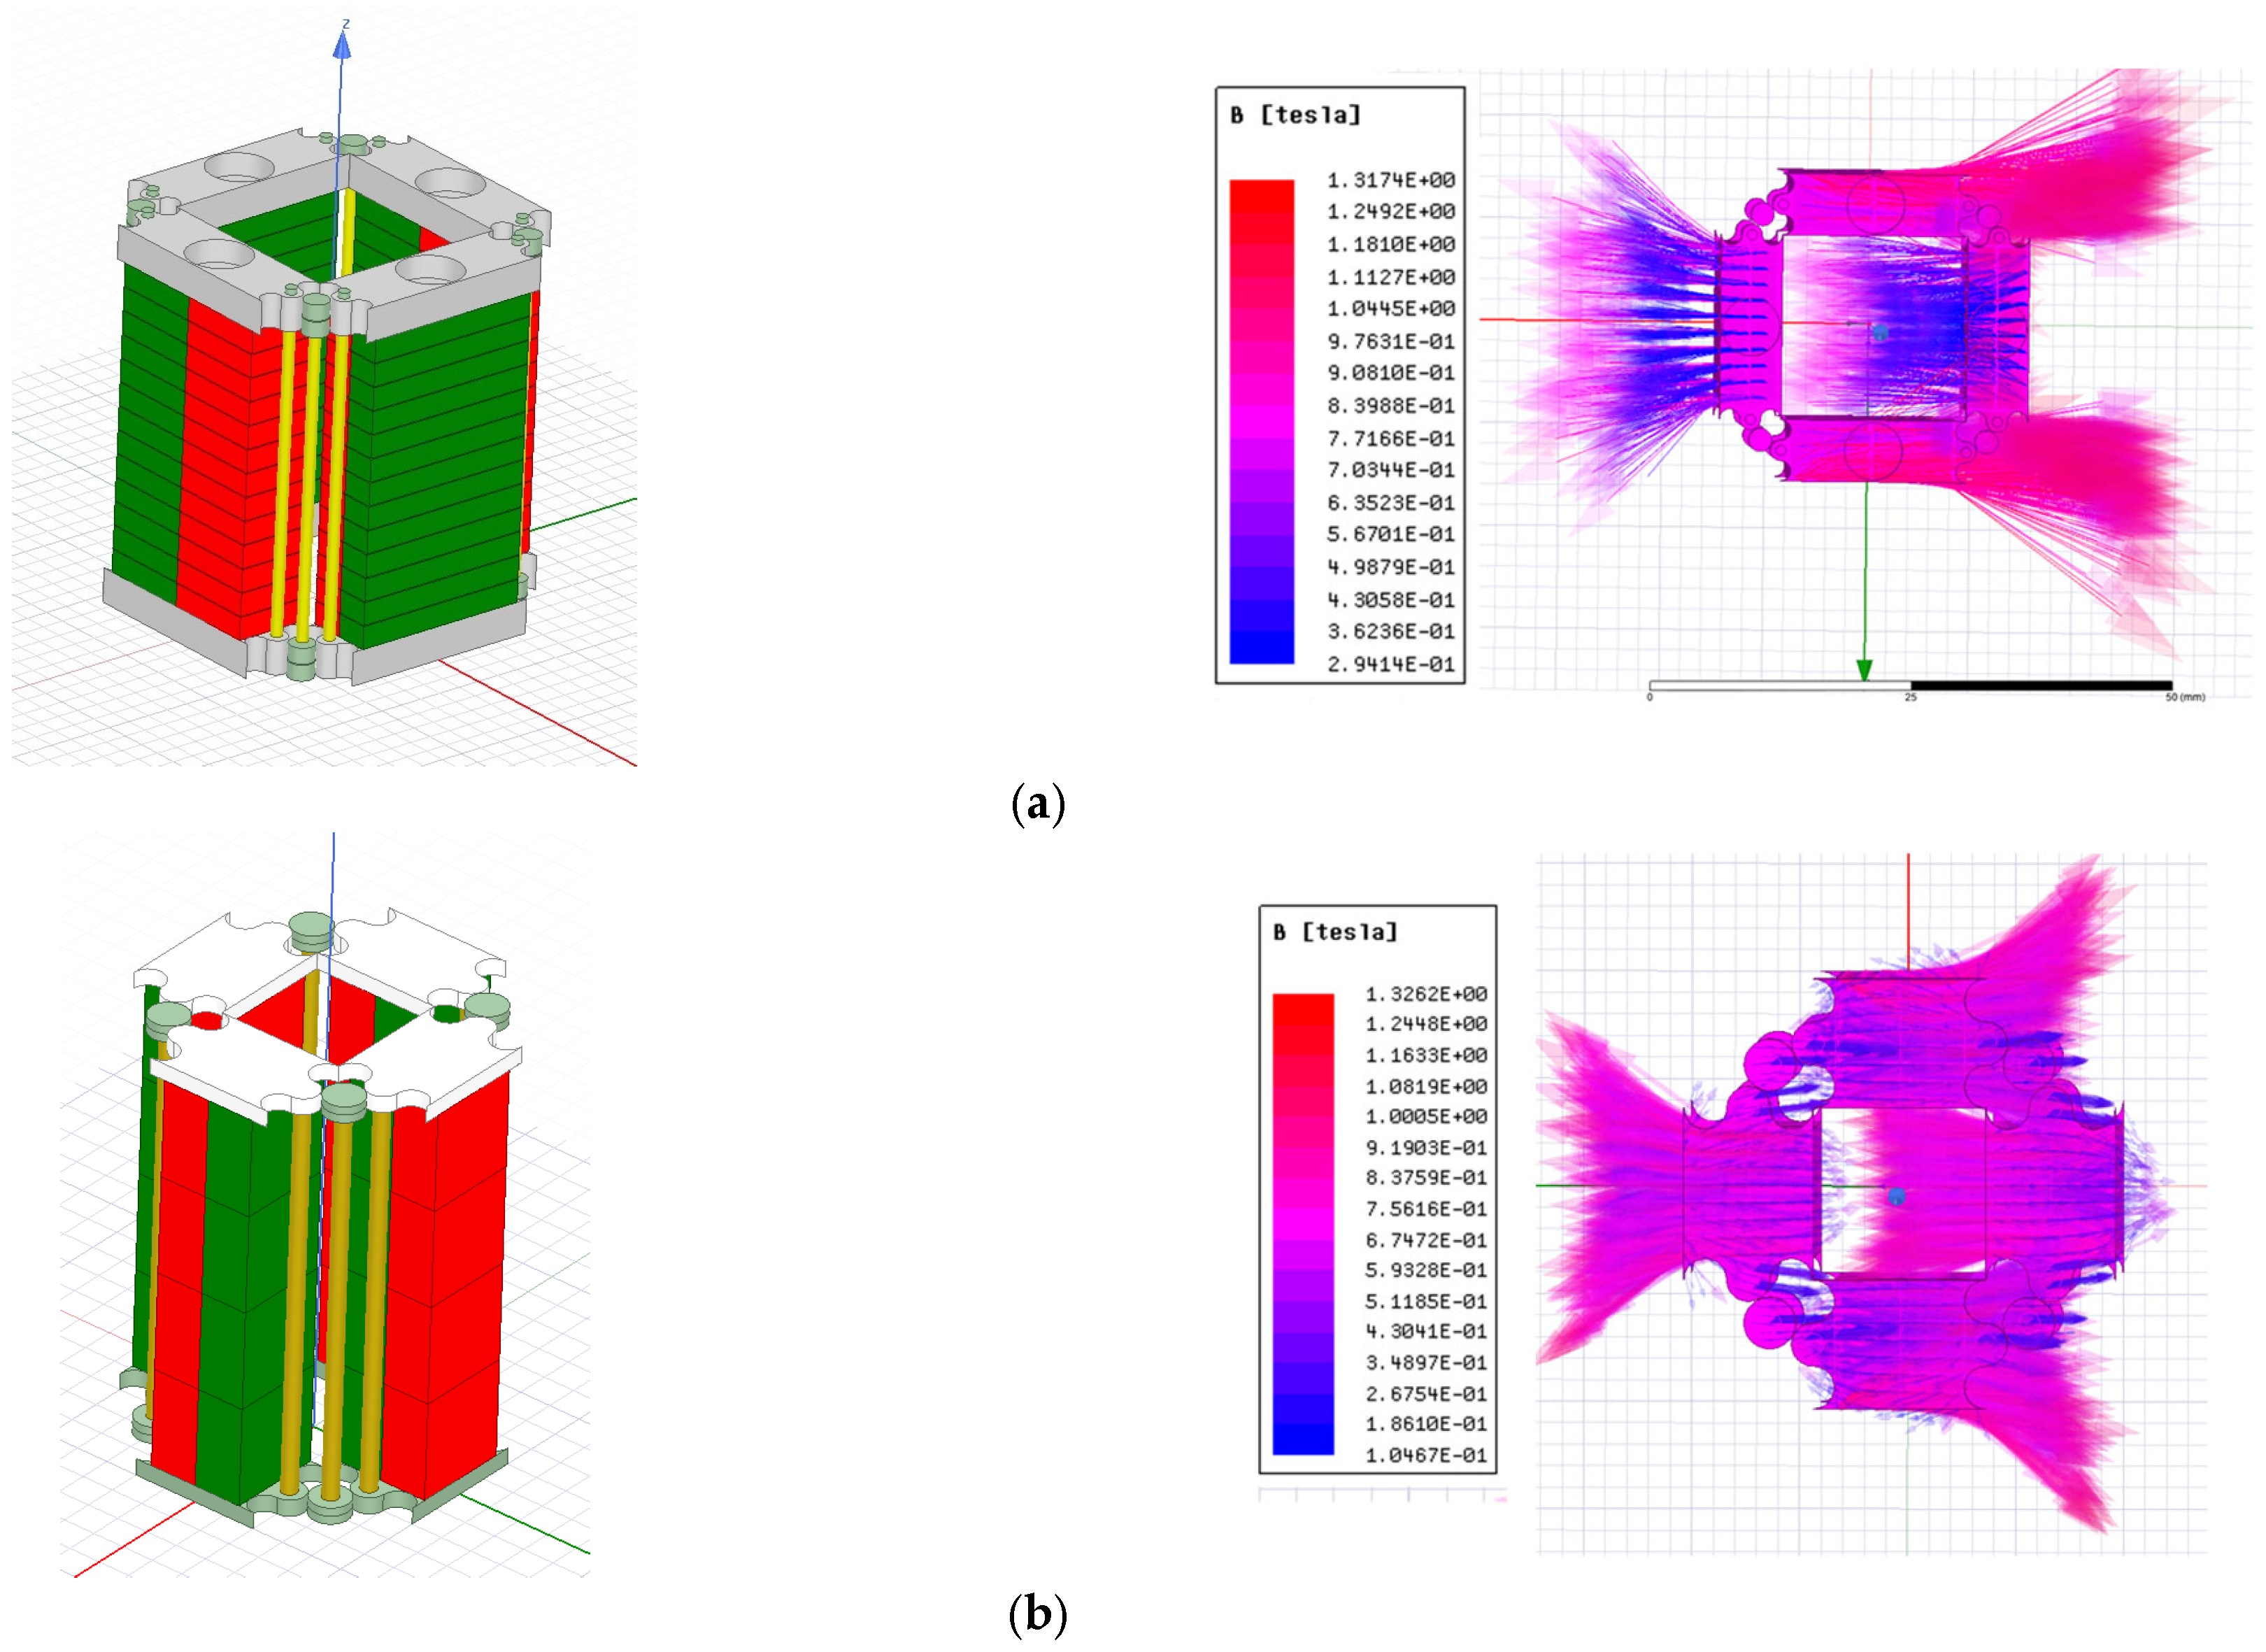
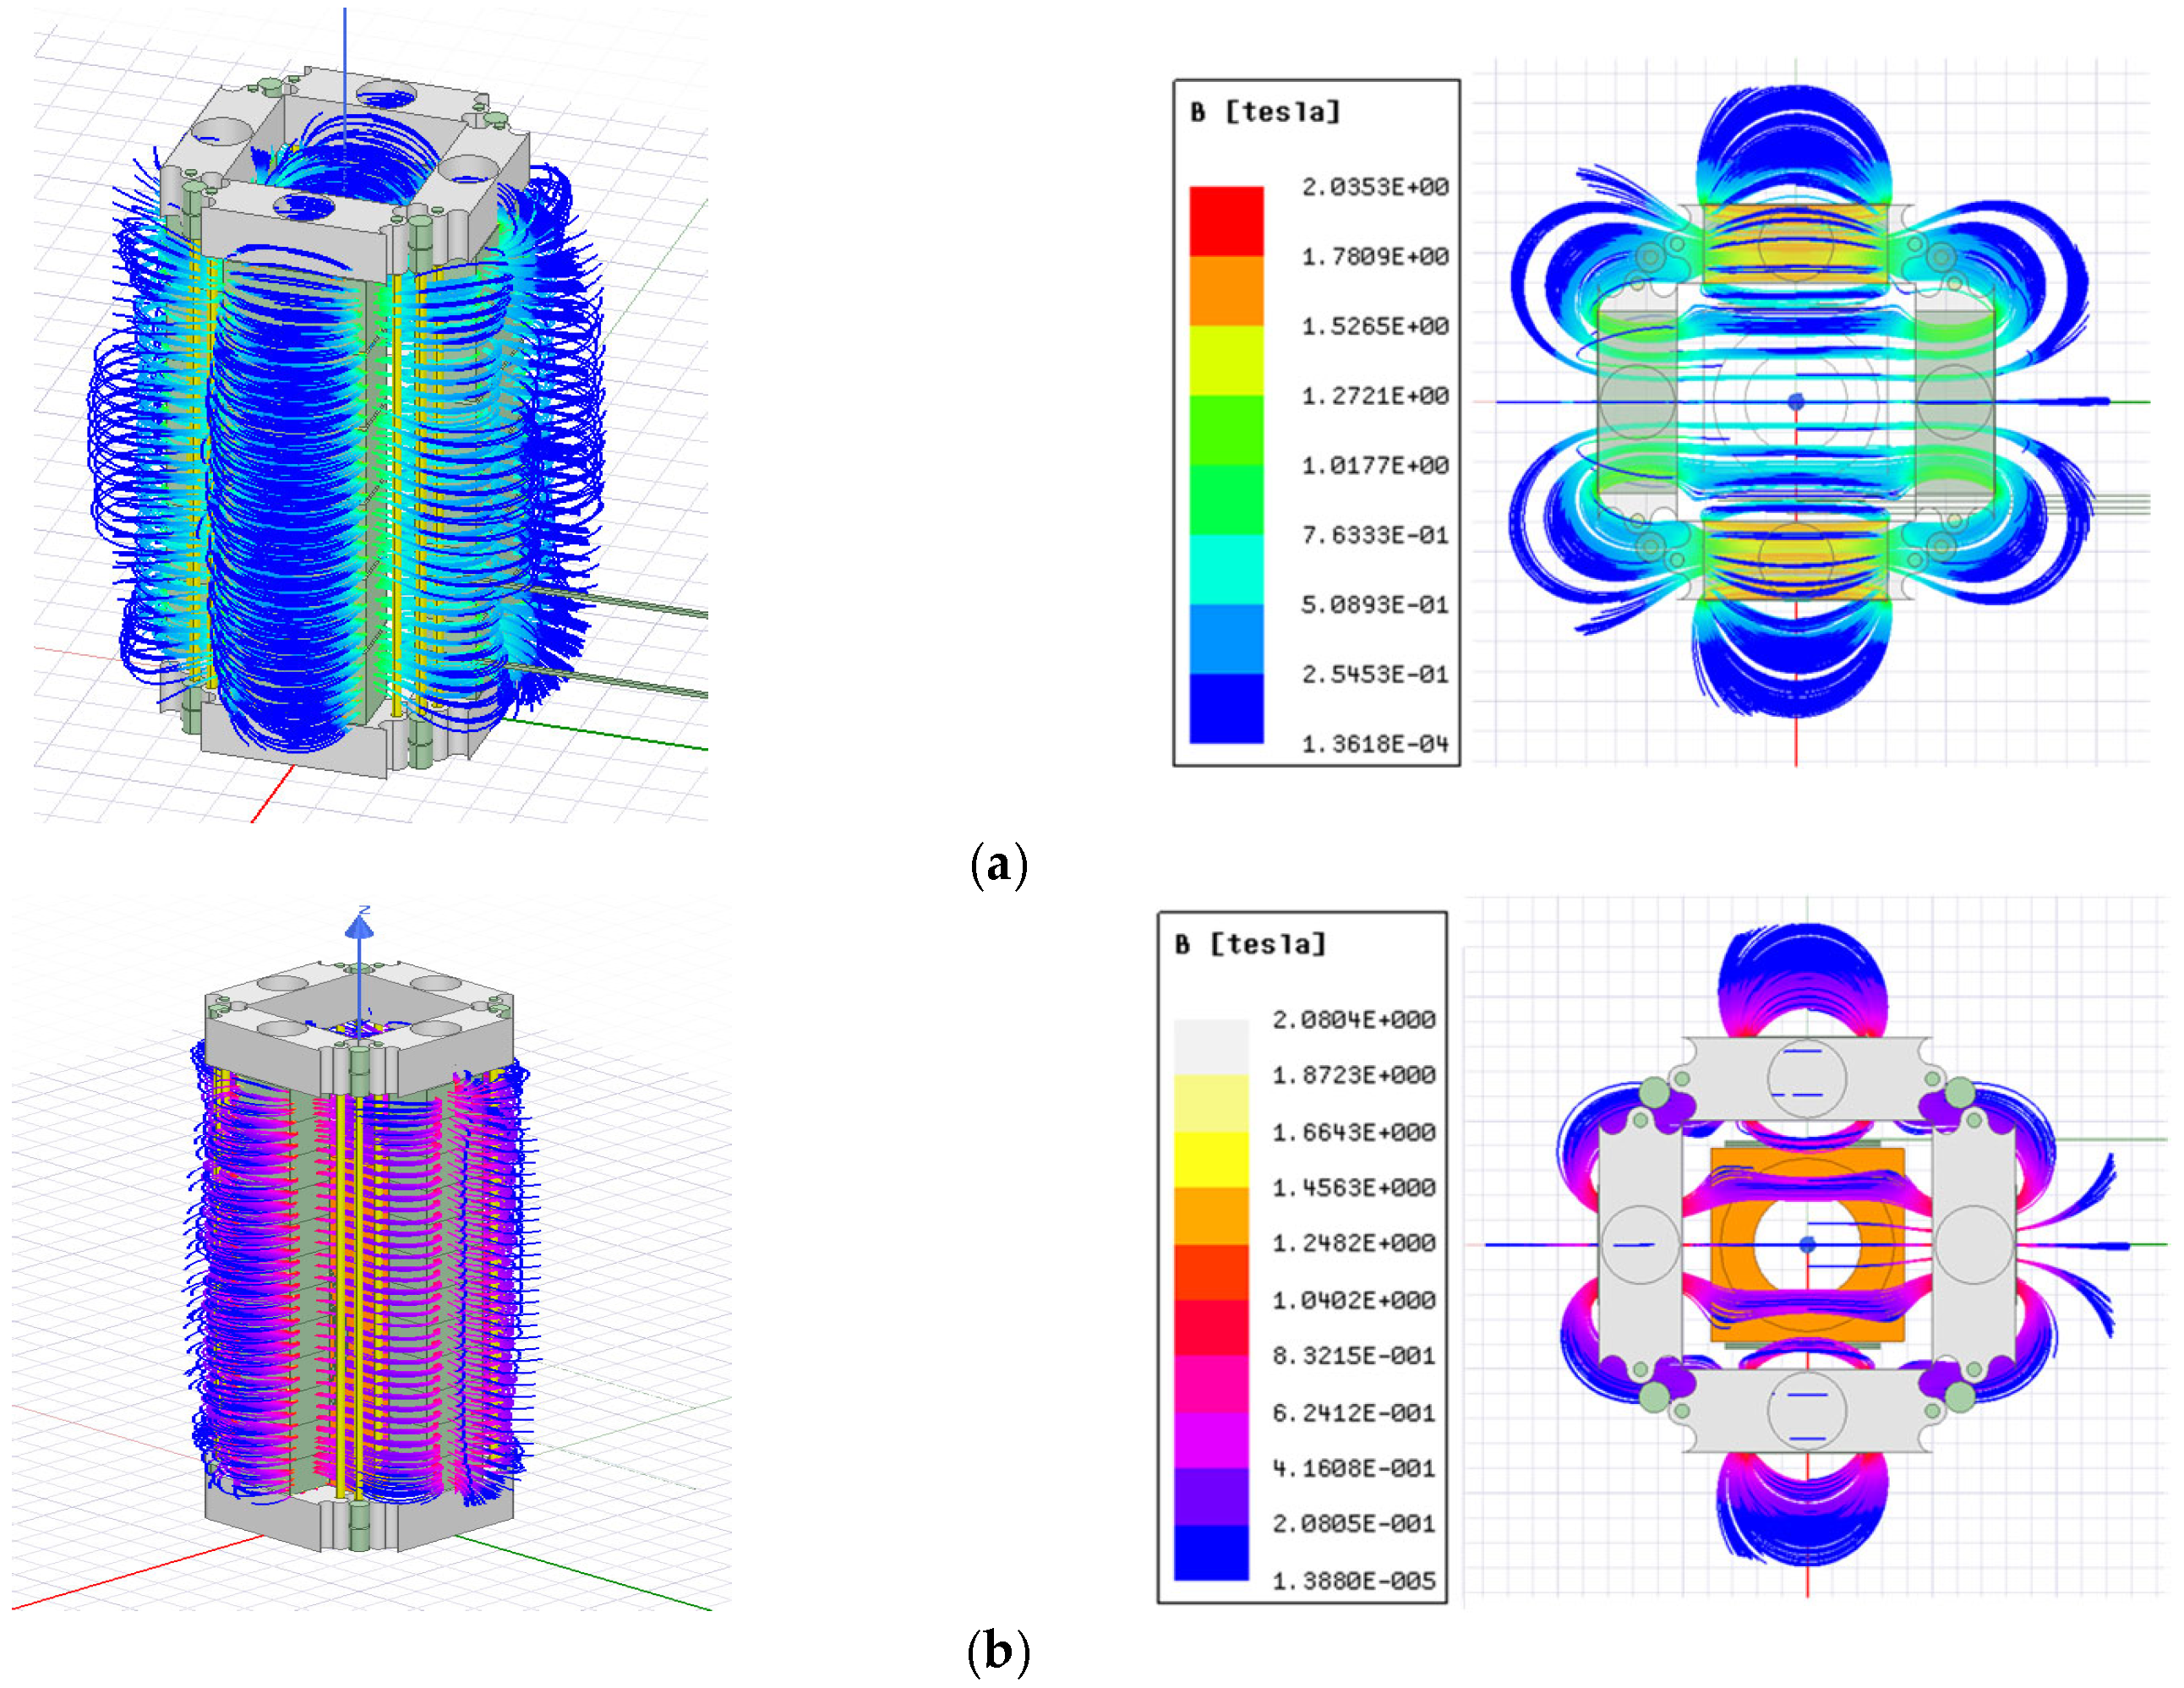
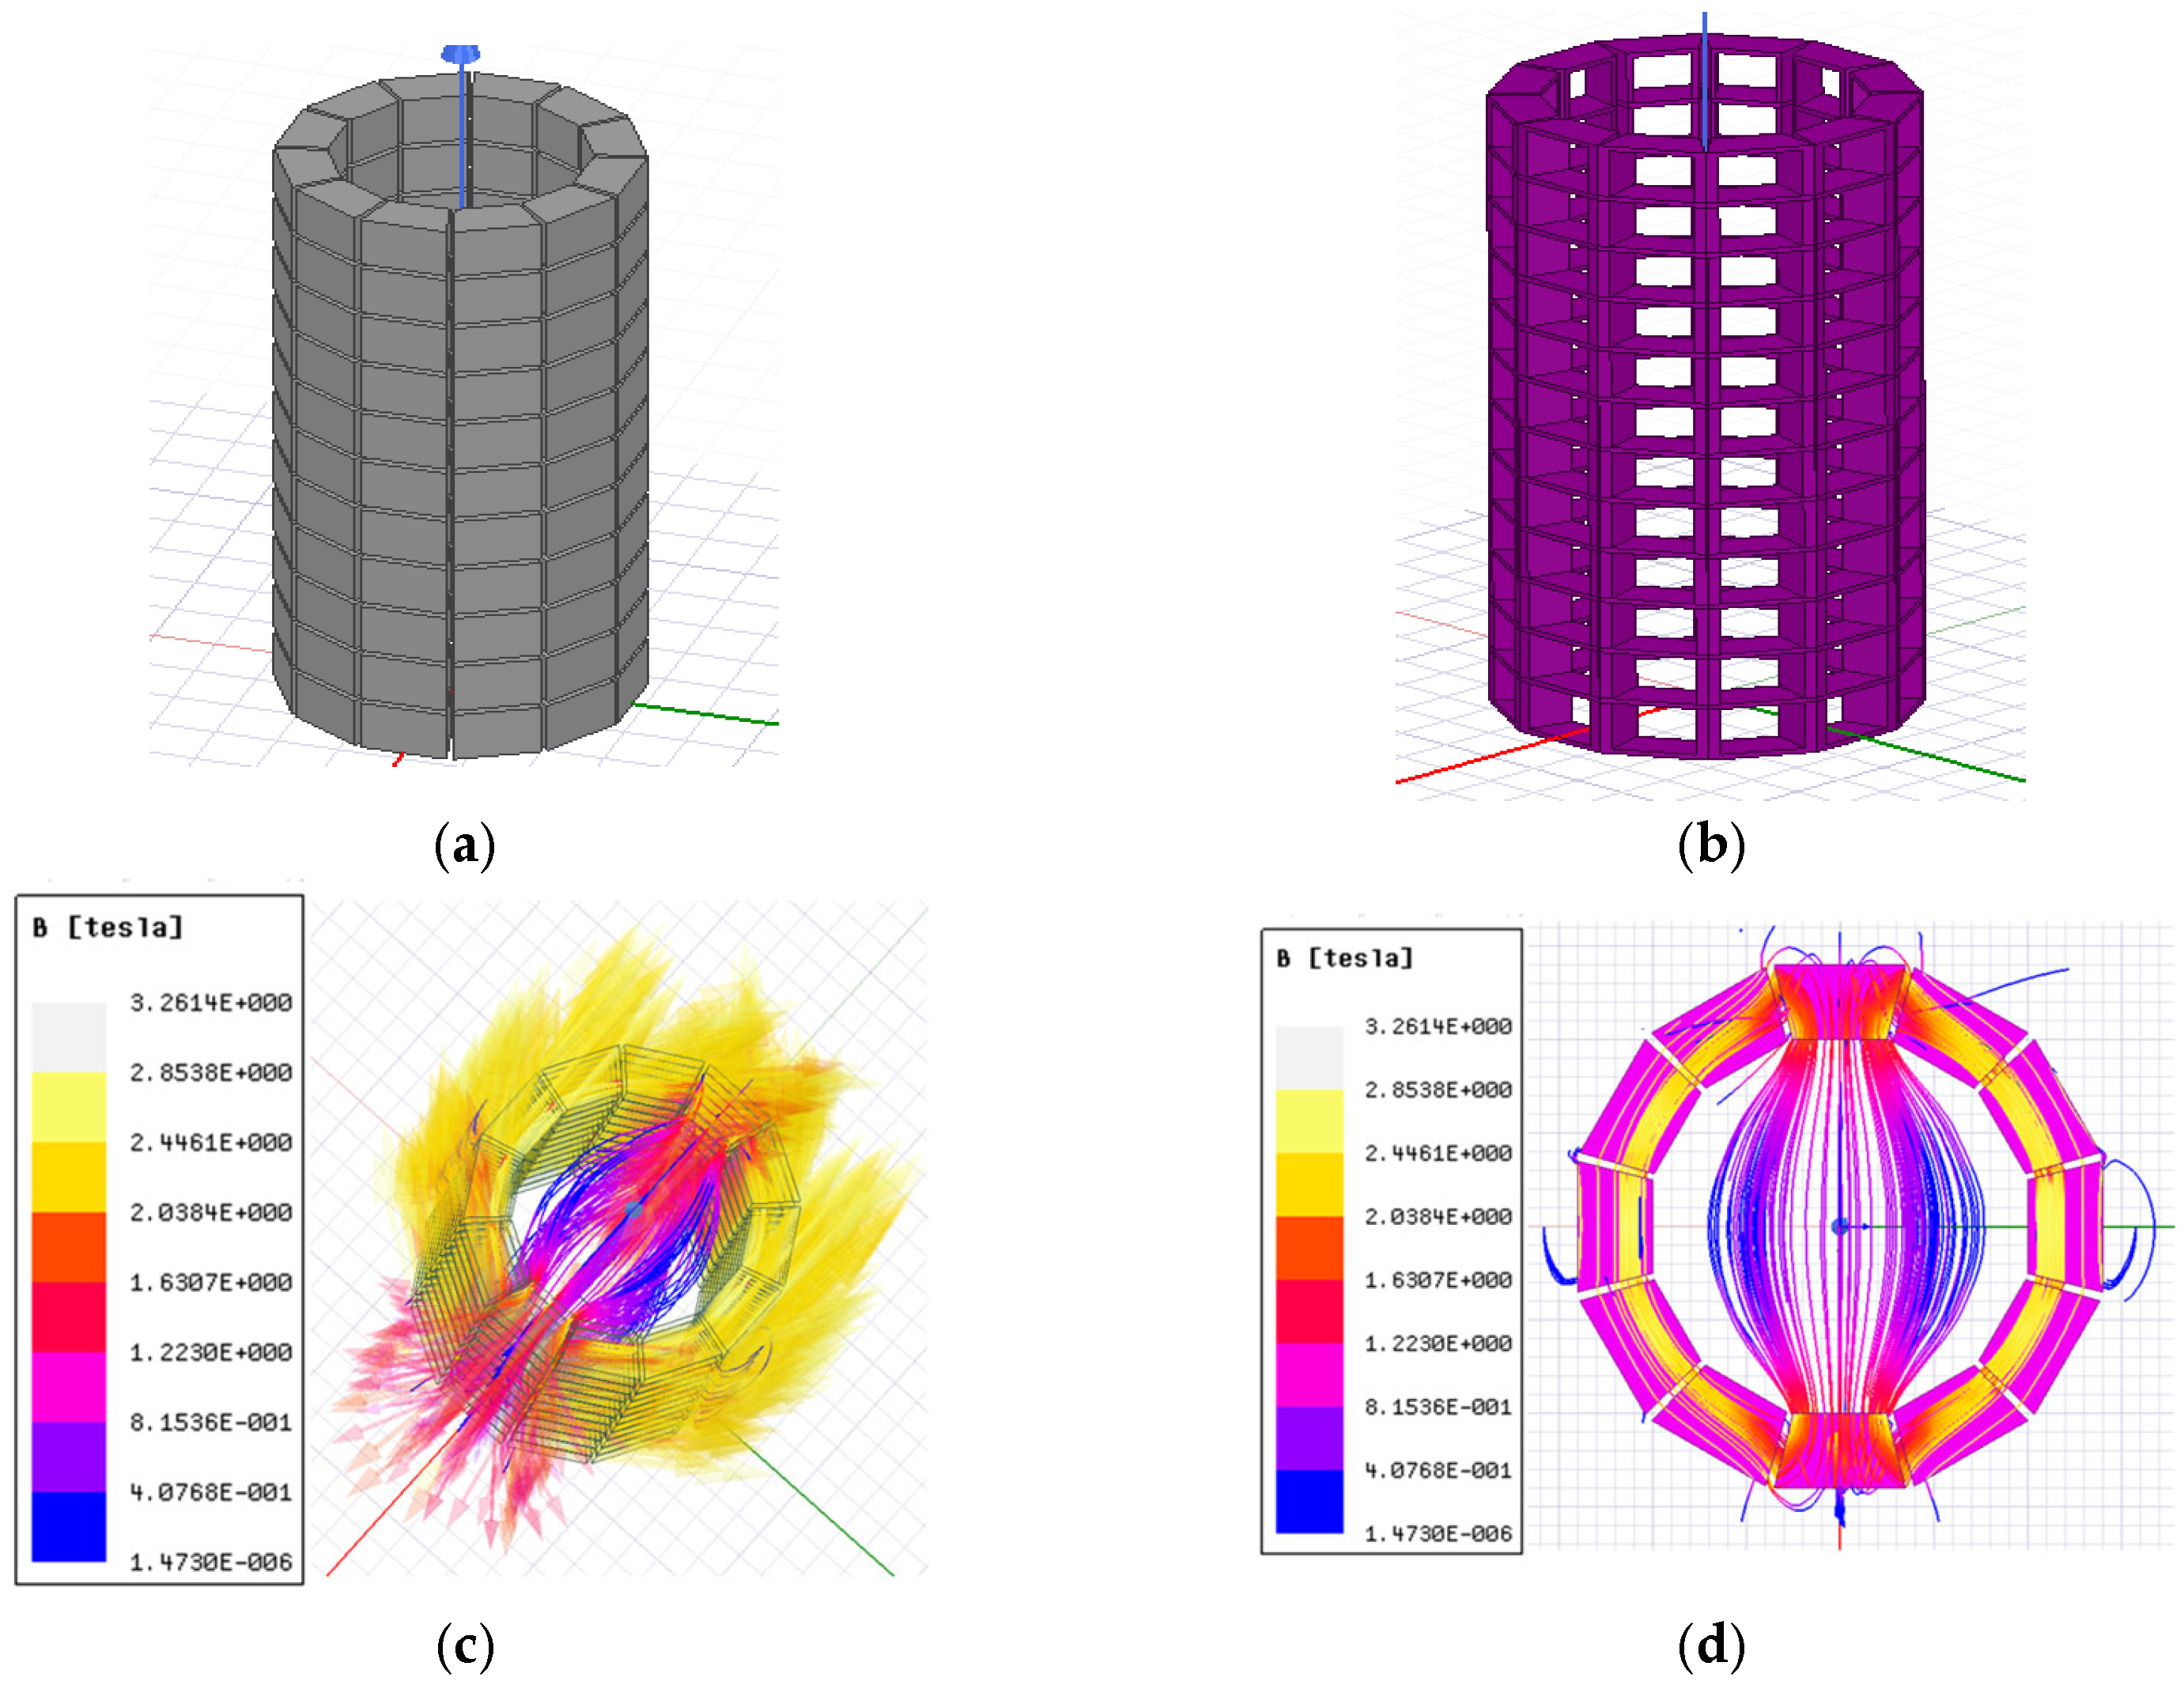
3. Finite Element Analysis and Simulation Results

The goal of this section is to evaluate the homogeneity and strength of the field based on the shape and number of magnetic segments. Figure 1 shows the magnetic vectors for rectangular and square NMR for evaluating the homogeneity of the magnetic fields in the proposed structures. As evident, in the case where rectangular magnetic segments are utilized, the magnetic field lines are more homogeneous and consistent. For evaluating the effect of the number of magnetic segments in a fixed-size structure, four simulations were performed. Here, the height of the structure and the distances between adjacent magnet arrays were fixed, while the number of magnetic segments per array were varied. As shown in Figure 2, by increasing the number of magnetic segments per array, the homogeneity level increases as well. However, it is also worth mentioning that by increasing the number of magnetic segments, the strength of the NMR structure decreases, and the possibility of breaking down also increases. This is due to the strong pulling forces among the adjacent magnet arrays, and the issue becomes even more critical when the NMR structure is desired to be compact. Considering this, the mechanical tolerance of the design can be enhanced by decreasing the number of magnetic segments per array at the cost of decreased homogeneity in the RoT.
The next design featured a rectangular structure, and two designs of different sizes were considered. The streamlines clarify the idea of Halbach arrays in the NMR application. Figure 3 shows the 3D designs and the Ansys Maxwell software output after simulating the whole system, respectively. Figure 3a has a height of 14.84 cm with a diameter of 2.83 cm, whereas Figure 3b has a height of 15.3 cm and a diameter of 5.6 cm. As can be seen, decreasing the air gap improves the homogeneity level of the magnetic field. However, this can be a restriction in a real prototype from two viewpoints: First, the pulling magnetic force increases extremely, and second, there will not be sufficient space for running laboratory tests when a holder around a tube is required to measure flow.
To have a more detailed study on the homogeneity and strength of the magnetic field, a trapezoidal magnetic segment was also evaluated. In this geometrical case, each magnetic segment had the trapezoidal format. The whole system was shaped by 12 magnetic segments, which were repeated in 11 rows. This structure is shown in Figure 4a. The high homogenous magnetic field had a value around 1 Tesla, which is high enough and can significantly improve the accuracy of the measurement. A mold is designed to hold each magnetic segment in an independent space. This mold is shown in Figure 4b. The perspective and top view of the Ansys Maxwell software output after simulating the whole structure are illustrated in Figure 4c,d, respectively. However, the challenges associated with the fabrication of such a structure as well as the ability to open and close the structure made the design drawbacks.

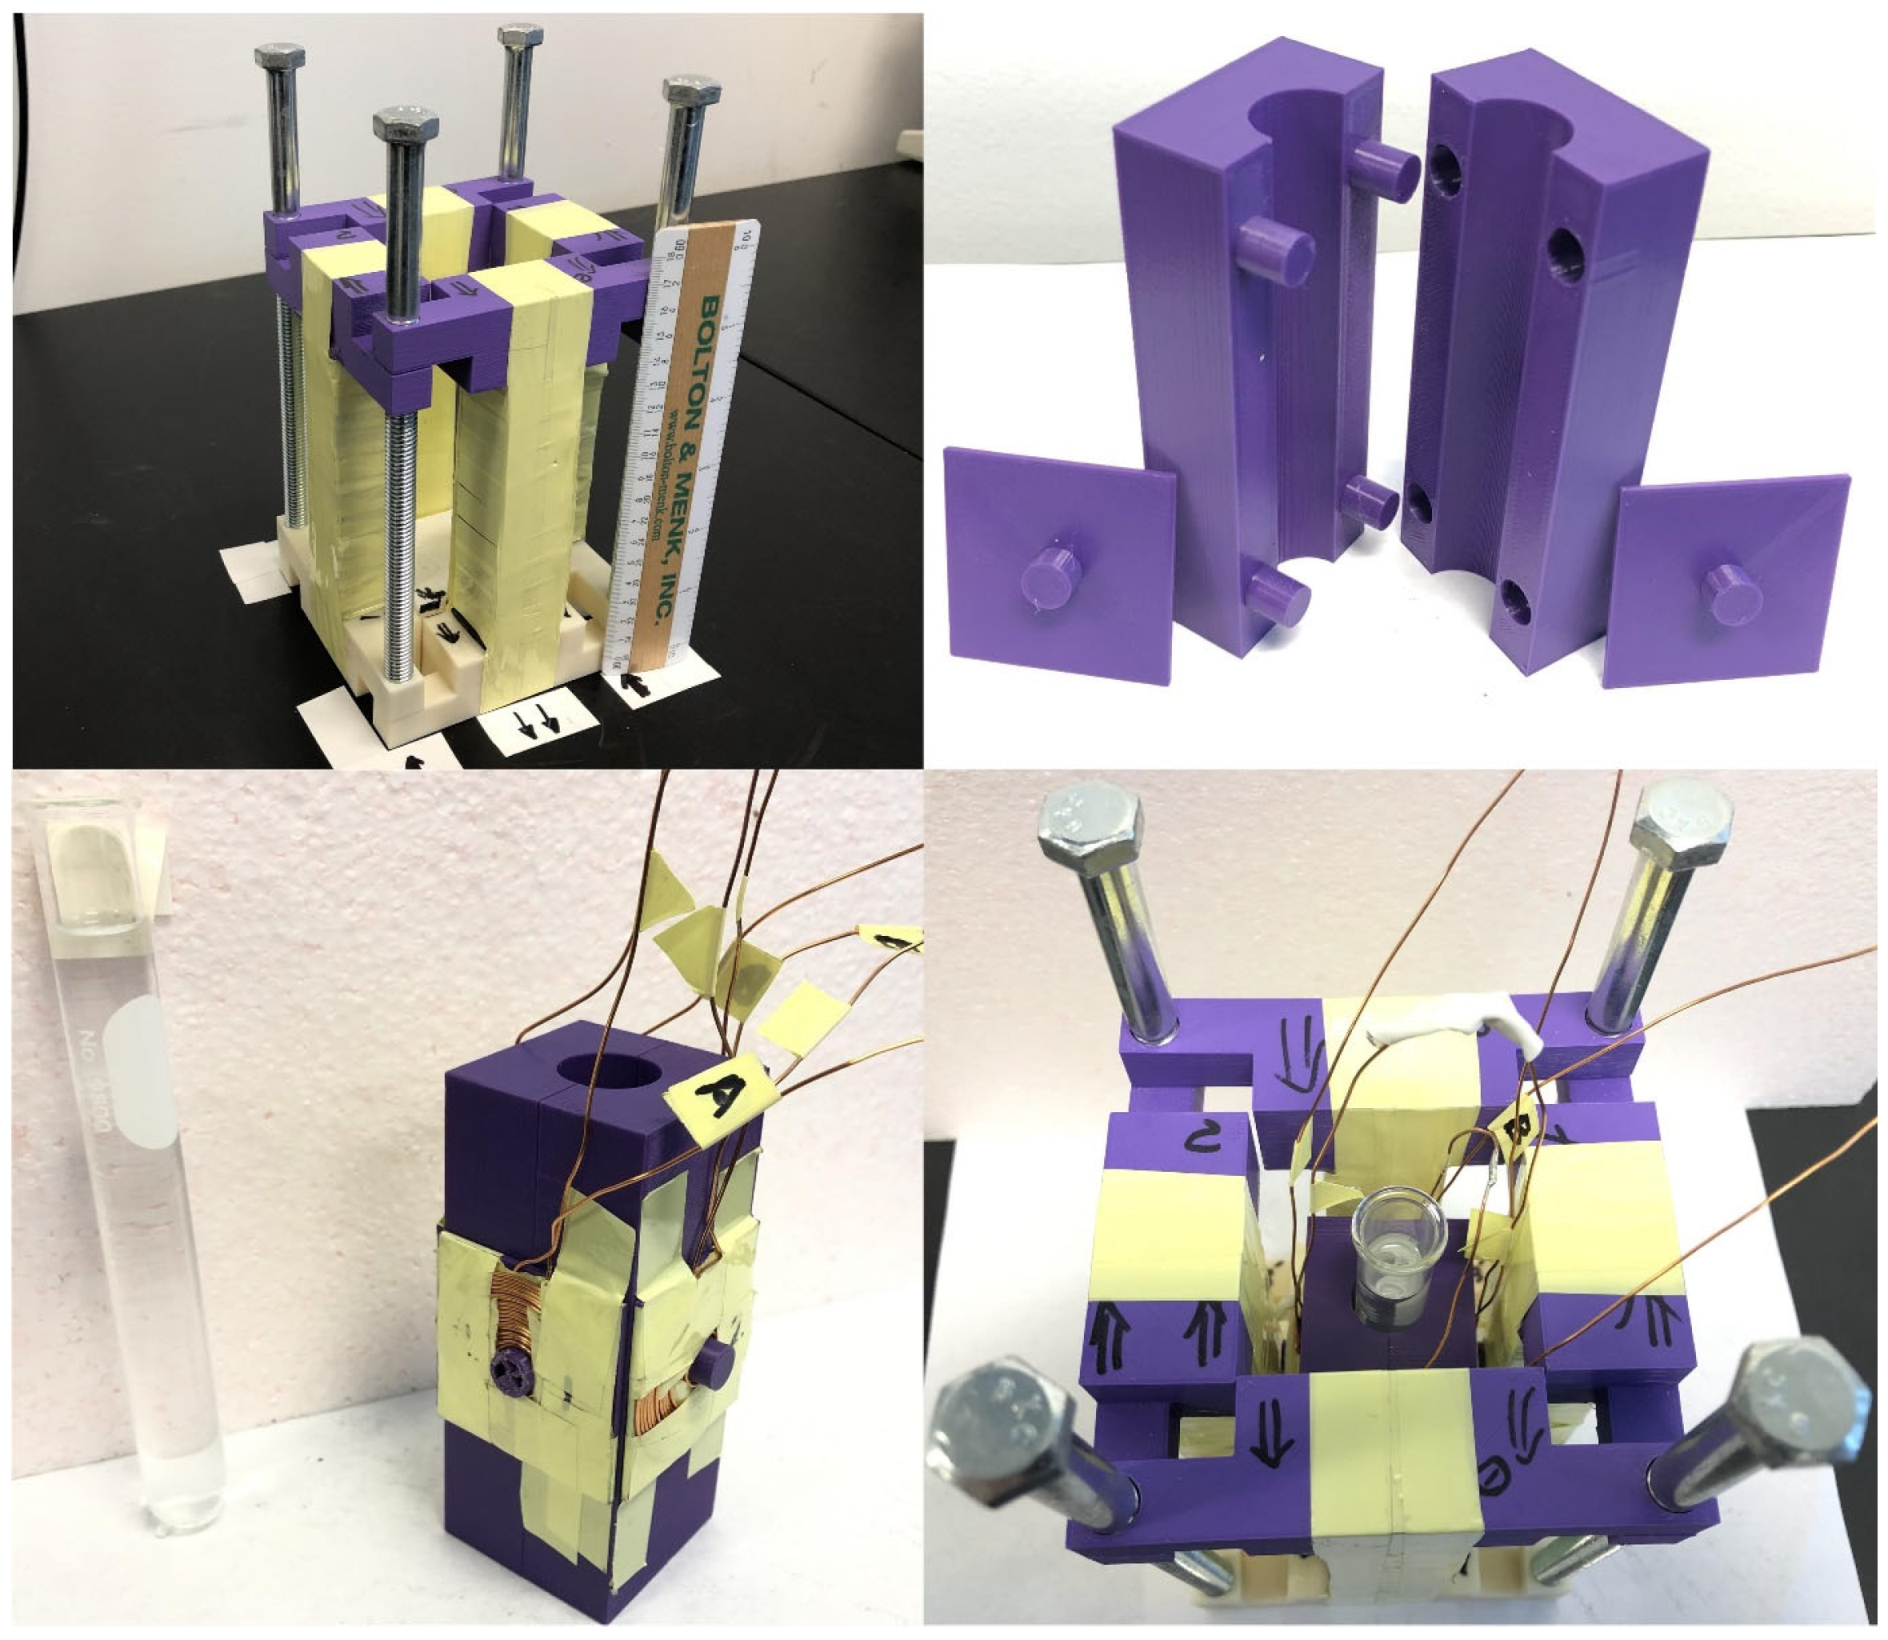
4. Prototyping and Experimental Results of a Candidate Optimized NMR Structure

The prototype of a portable magnetic structure for NMR is based on the output of the optimal design obtained via the MPSO optimization executed and tested in the Ansys Maxwell software. Among all the designs, the square shape NMR tool was the optimal option for prototyping, as shown in Figure 5. This structure is 15.24 cm in height with an internal diameter of 5.08 cm. Four arrays of permanent magnet segments were used in this design. In each array, four permanent magnet segments were used. The details and characteristics of these magnet segments is provided in Table 1 based on the FEA simulation of Figure 1.
To minimize the weight of the portable NMR structure, the top and bottom bases for the magnet arrays were fabricated using a polylactide (PLA) material. Another important part of this portable NMR device is the holder assembly (upper right image in Figure 5) that houses the tube or plant stem in a flow measurement setup. The placement and alignment of this holder assembly in the NMR structure highly impact the sensitivity of the obtained results and hence are one of the most challenging aspects of the NMR tool. Thus, it was designed in a way that it can easily be opened/closed with minimum lateral movement. In addition, the simplicity of this design decreases the risk of misalignment that might occur during repeated opening and closing of the holder assembly. Additionally, it was investigated during experimental testing that to achieve best results the holder assembly (with the tube or plant stem) should be placed in the RoT of the NMR structure that has the strongest and most homogenous magnetic field.
Furthermore, based on the fundamentals of NMR and as discussed in [15], the transmitter and receiver fields should be perpendicular to each other. Moreover, the transmitter coil magnetic field should be perpendicular to the static magnetic field built by permanent magnet arrays in the portable NMR magnetic structure. As discussed with details later, the reflection of test material atoms should be captured by the receiver coil. To achieve these goals, circular surface transmitter and receiver coils were wound on two plates that were attached to the sides of a tube holder, as shown in the lower left image in Figure 5. Consequently, in this prototype, two transmitter coils are installed on the opposite sides of the holder assembly. From an electrical point of view, the two coils are paralleled to improve the magnetic field strength and homogeneity. Similarly, the two receiver coils are placed on the remaining two opposite sides of the holder assembly, thereby forming a perpendicular alignment with the transmitter coils. The transmitter and receiver coils were installed on the respective sides of the holder assembly and fixed by special insulating tape. A side view of the holder assembly with the coils mounted on it and the glass tube are shown in the lower left image in Figure 5. As mentioned previously, to achieve the best results, the holder assembly with the glass tube should be aligned and placed where the strongest and most homogenous magnetic field exists. Based on our design and simulation results, this location is in the exact center of the RoT and at the geometric center (at equal distances from the four walls of the NMR magnetic structure).
The electrical measuring circuit connected to the terminals of receiver coil is comprised of a capacitive matching circuit followed by a radio frequency low-noise amplifier (RF-LNA), as illustrated by the wiring schematic diagram of the portable NMR tool in Figure 6. The matching circuit’s capacitors were tuned during the experimental tests to maximize the SNR of the received signal. Furthermore, the RF-LNA was used to boost the signal strength further to better observe the oscilloscope/spectrum analyzer for functionality testing and validation.
As per the NMR principle [15], analyzing the response of hydrogen atoms yields more information about their resonant frequency. Consequently, the test sample placed in the holder assembly is triggered (excited) by a burst of radio frequency pulses. These periodic bursts of excitation pulses are fed to the excitation coil by the signal generator. The reaction of hydrogen atoms to these excitation pulses are captured as the reflected signals by the receiver coil. These reflected signals are then filtered by the capacitive matching circuit and the RF-LNA. Output of the RF-LNA is then analyzed in the frequency domain using a spectrum analyzer. This frequency domain analysis of the received signal yields the Larmor frequency at which the resonance occurs. To find the Larmor frequency, the test material was triggered by a radio frequency signal in the megahertz frequency range. It is worth noting that the Larmor frequency has a dependency on the material and the strength of the static magnetic field. The experimental test was initiated by applying different radio frequency signals and monitoring the RF-LNA’s output in the frequency domain to capture the Larmor frequency.

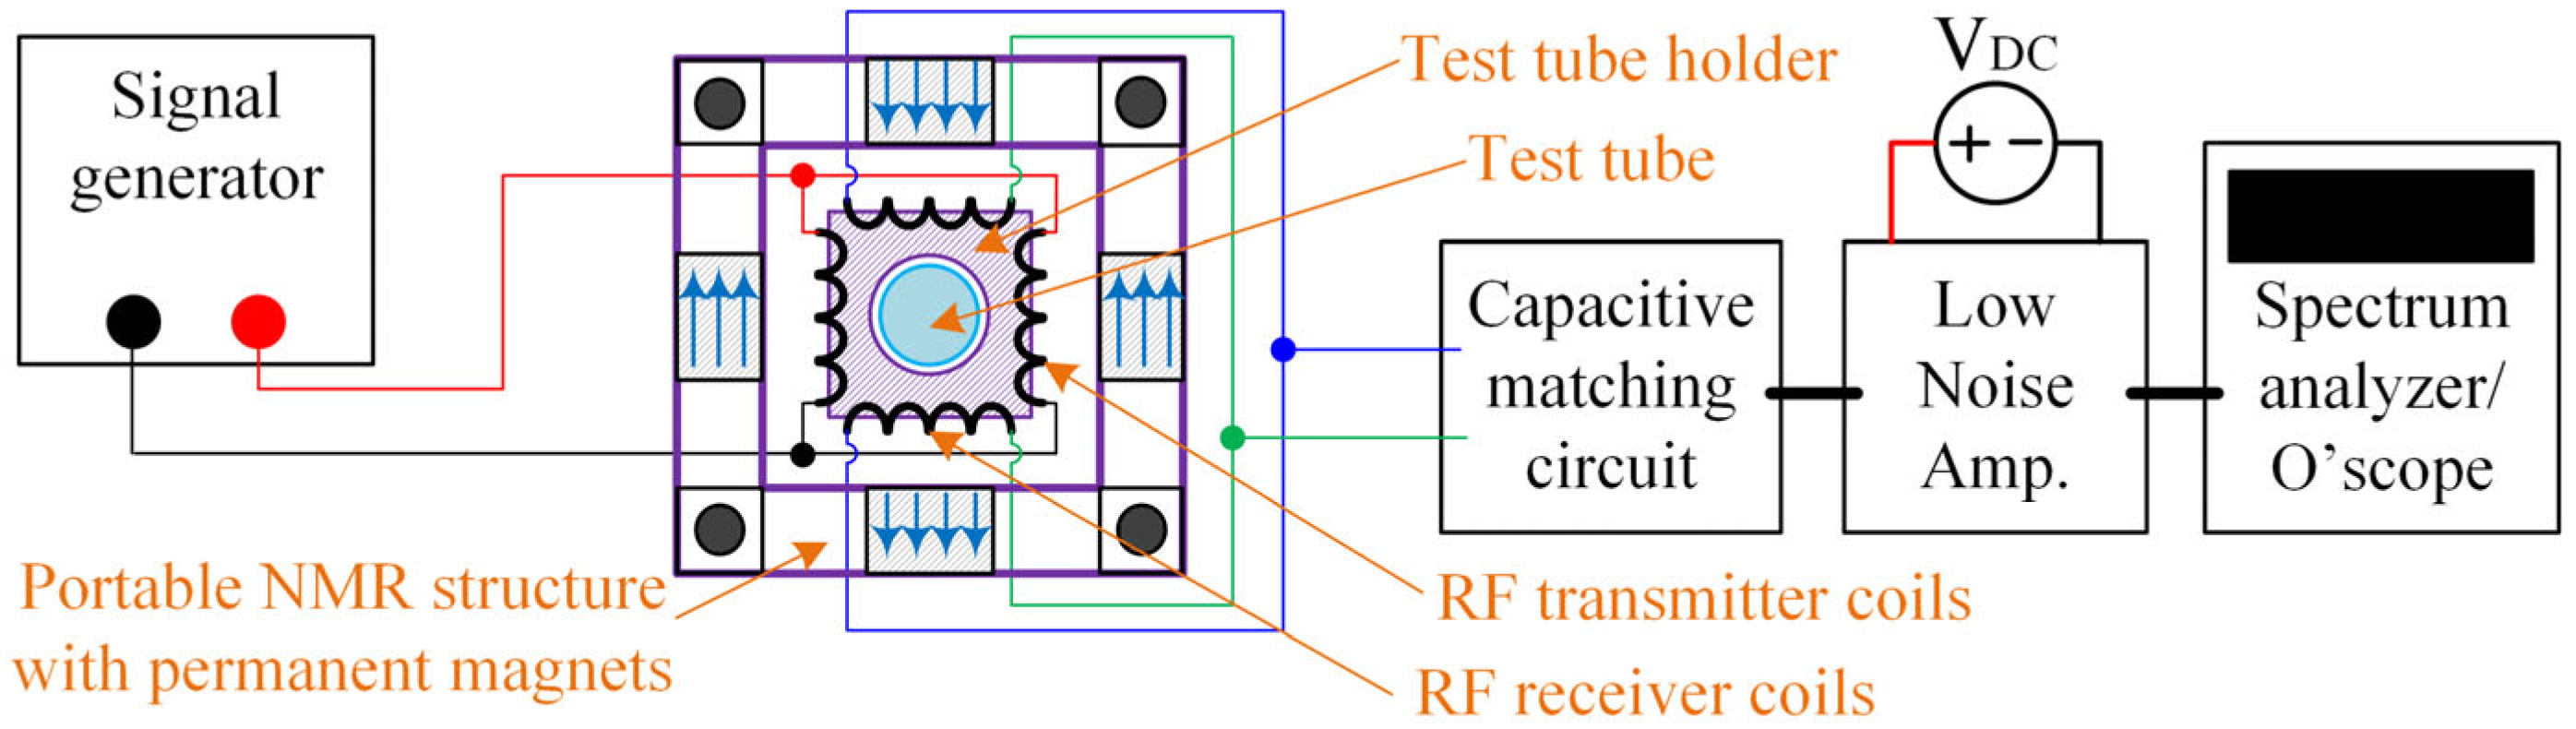
4.1. Experimental Validation: Challenges and Noise Mitigation Approach in a Portable NMR Setup

This section provides a summary of the obtained results for each stage of the testing performed on the prototype to validate its functionality and expected simulation results. Before starting the test, it was essential to investigate the exciter radio frequency signal characteristics. A pulsed NMR method was used in this work. A modulated radio frequency signal comprised of two components is transmitted to the test material via the transmitter coils mounted on the holder assembly. One component of the exciter signal is a higher frequency sinusoidal waveform with a frequency approximately equal to the Larmor frequency of hydrogen atoms. The second component of the transmitted signal that envelops this sinusoid is a square pulse waveform of a relatively lower frequency. In our case, the test was initiated by using an 8 MHz sinusoid enveloped within a 25 kHz, 25% duty cycle square wave. This specific waveform was used to take advantage of the Fourier transform of the signal. Without the square envelope, the periodic burst of pulses could not be attained. Additionally, the introduction of a pulse spreads out the carrier signal across a larger frequency spectrum, thereby ensuring more widespread excitation of molecules. These resulted in a stronger excitation signal applied to the transmitter coil and, thus, provided a clearer image on the analyzer without the need for longer sample periods. The frequency of the radio frequency sinusoidal signal was changed for each test to find the Larmor frequency. Based on the practically measured magnetic field strength of about 0.3055 T and the level of homogeneity, we expected to obtain the Larmor frequency to be around 13 MHz. However, in practice, this value may be different from the simulation value. Based on the FEA simulation results and optimization of the selected geometrical shape in Figure 1, the magnetic field strength of 0.527 T was expected. Several factors that lead to the mismatches in the magnetic field strengths include inaccuracies in the magnetic segment’s fabrication, human error in the manufacturing of the prototype, interferences from ambient laboratory environment, etc. Furthermore, the variation in the homogeneity of the magnetic field strength was found to be about ±10% within the RoT. The same magnetic structure of Figure 1, if manufactured in a highly precise industrial setting, would yield much a lower mismatch of the magnetic field strength and homogeneity as compared with the simulation results.
For covering all frequency ranges, the test was started from the frequency of 8 MHz. This indicates that the hydrogen atoms were excited by an 8 MHz radio frequency signal. After that, the reaction of the atoms was captured. It is important to note that every captured output does not correspond to the reaction of the atoms. Upon analysis on the spectrum analyzer, there was no indication that a resonant occurred in the system. In other words, the SNR of the received signal was not considerable. The frequency of the radio frequency sinusoidal exciter signal was gradually increased, and the results were analyzed at each instance. When the sinusoidal signal frequency was increased to around 12.7 MHz, the highest peak in the received signal on the spectrum analyzer was observed. Figure 7 shows this reaction of the test material when excited by around a 12.7 MHz radio frequency signal. This is the frequency where resonance happens. In other words, the Larmor frequency has the value of 12.77 MHz. Additionally, the free induction decay is shown in Figure 8. The experimental Larmor frequency value of 12.77 MHz is pretty close to the expected value of 13 MHz. We, therefore, concluded that the experiment was compatible with the fundamental theory of the Larmor frequency, and these results showed the accurate functionality of the prototyped NMR with an optimized parameter based on the FEA simulation outcomes.
The portable NMR experimental setup is designed to replicate a proper setup for the flow measurement study in a tube or plant stem. A proper testbed should consider all the ambient conditions that could impact the performance of the NMR tool. Logically, the functionality of the designed tool should be evaluated in the laboratory via some scenarios under conditions similar to in situ. If the designed tool under the specific test could achieve promising outcomes, the prototyped NMR functionality would provide reasonable results in the real-life application. However, some parameter re-tuning was needed to achieve stable functionality. Additionally, some mechanical fixtures needed to support the entire structure in the field were designed. It should be remarked that the surrounding test area can have a high impact on the high-frequency transmitter and receiver coils. Hence, the test was conducted under conditions with the lowest external interfering factors. The water sample in the glass tube was excited by a chain of pulsating magnetic fields generated by the radio frequency excitation pulses. This generated magnetic field was perpendicular to the static magnetic flux. The hydrogen atom’s reaction as reflected waves (reflected signal) was captured by the receiver coils, which were then fed to the spectrum analyzer. These reflected waves corresponding to the reaction of the hydrogen atom are used in determining the Larmor frequency. To improve the SNR of the captured waveform, the matching circuit and RF-LNA were used as an interface between the receiver coils and the spectrum analyzer. The RF-LNA was powered by a DC power supply as shown in Figure 6.
To describe the testing procedure, it is essential to provide a brief illustration of the electrical circuit of the testing process and the associated equipment. There were two high-frequency coils responsible for transmitting the RF signal, and two high-frequency coils responsible for receiving the hydrogen atom’s reaction. The coils were located between the waveform generator and the matching circuit. To enhance the SNR of the received signal, a matching circuit that consisted of two variable capacitors was employed, which were adjusted through empirical observation. Finally, the RF-LNA was interfaced between the receiver and the spectrum analyzer to enhance the captured dynamic during the period that the RF excitation signal, which was not applied. Considerable noises were observed, so troubleshooting was conducted, which involved replacing the RF-LNA to resolve this issue. Moreover, due to the nature of any prototyped testing tool, the input and output wires and other nonideal submodules of the test setup increased the share of the noise in the obtained results. However, the spatial orientation of the wires was readjusted so that they are perpendicular to each other. This orientation may alleviate the inherent mutual magnetic interference to a great extent. Finally, an adequate filter was applied in the spectrum analyzer to increase the received signal’s SNR to an acceptable range. The plausible sources of the large coupled noise in the measured signal might be as follows: (1) the low accuracy of the amplifier; (2) the loose wires in the transmitter and receiver coils; (3) the matching circuit’s capacitance, which was not tuned optimally; (4) the constant magnetic field’s homogeneity, which decreased over time; (5) the internal forces between the permanent magnets, which affected the magnetic field consistency; or (6) the coaxial cables, which were not used to measure the receiver coil signal. A summary of the final obtained results after re-tuning all parameters are shown in Figure 7 and Figure 8, which validates the functionality of the optimally prototyped portable NMR tool operating in a realistic ambient condition.

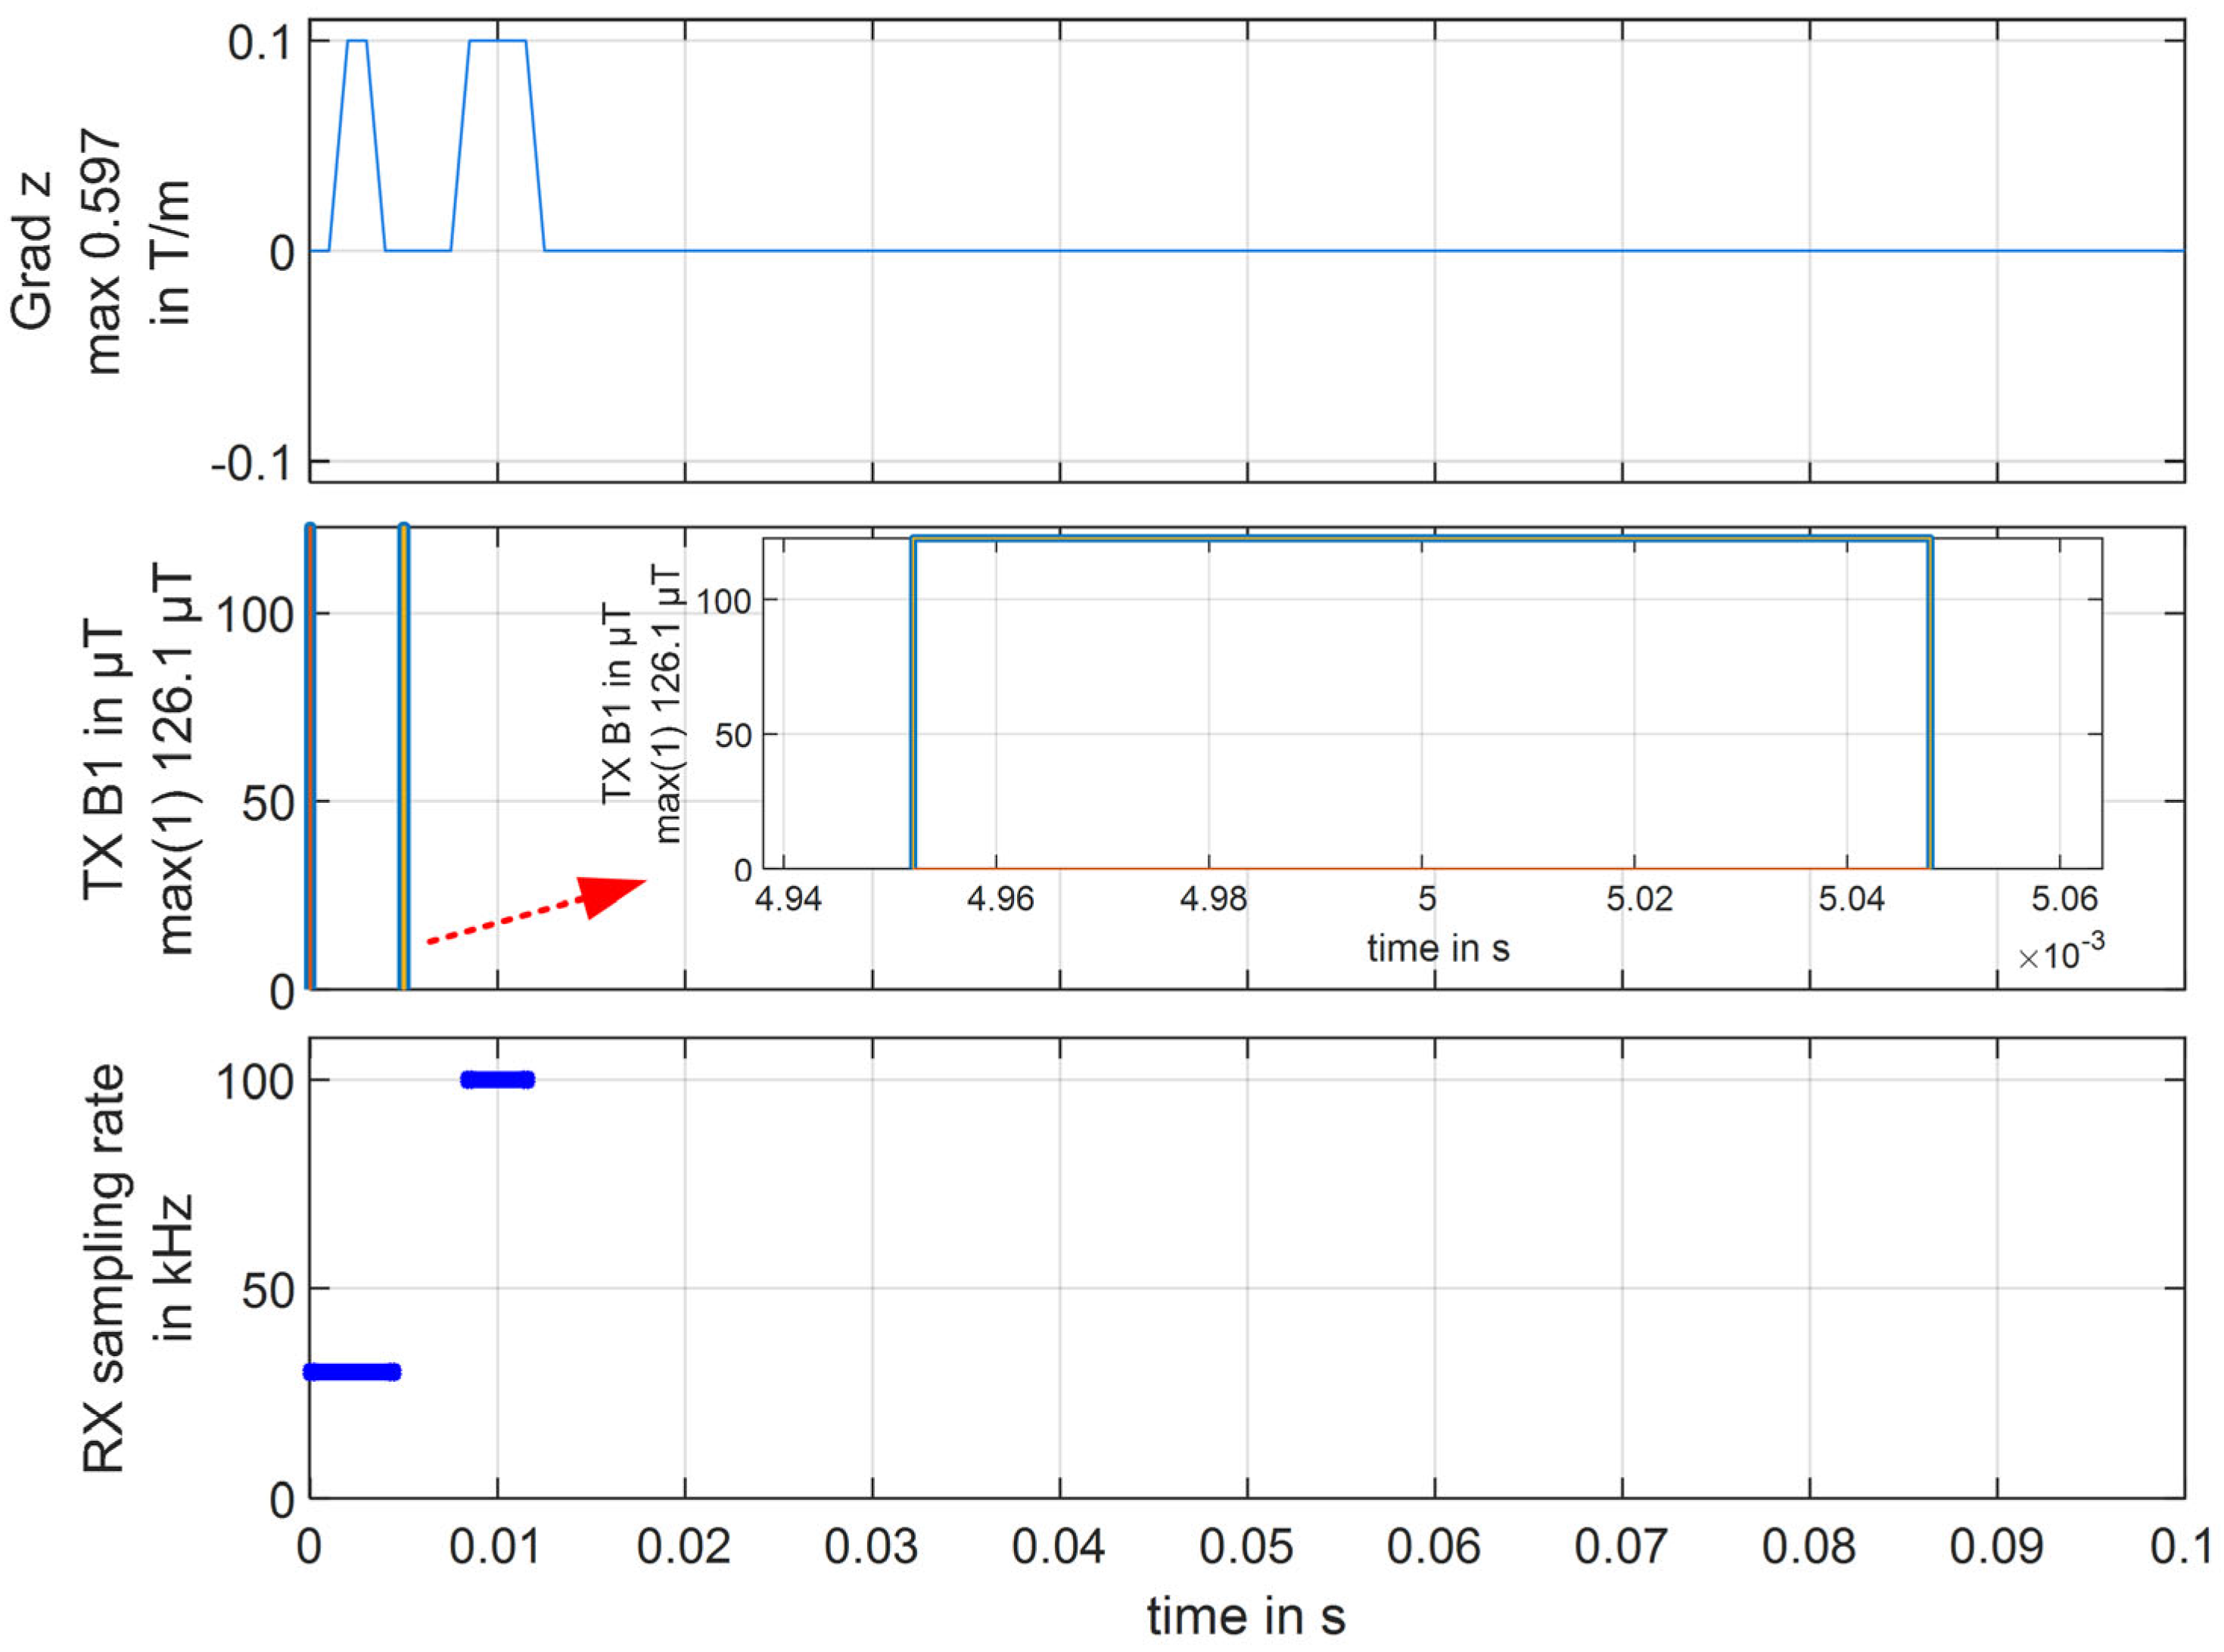
4.2. Off-the-Shelf Lightweight NMR and Magnetic Resonance Imaging Spectrometer versus Optimally Designed Portable NMR Tool

In the previous subsections, an extensive evaluation of a different geometrical shape of a portable NMR tool and optimization of the magnetic field strength and homogeneity are provided. This section presents the Larmor frequency measurement from an off-the-shelf lightweight NMR and magnetic resonance imaging spectrometer setup (Pure Devices-Alegre Science). The outcome is compared to the captured results from the prototyped portable NMR tool. It is envisioned that due to the given features of the optimally designed portable NMR tool, as discussed in Section 2 and Section 3, the tool enables flow measurement for a wide range of applications, unlike existing lightweight NMR tools. Thus, this section investigates the functionality and accuracy of the prototyped NMR tool when compared to the off-the-shelf NMR tool. It worth mentioning that the proposed NMR tool in this paper offers additional features, which make it suitable for a wide range of applications.
Experimental tests, such as the Larmor frequency findings, were carried out using an off-the-shelf NMR setup to validate the outcomes from the optimally prototyped NMR tool. This validation was conducted using a Pure Devices Magspec/drive-L combination magnetic resonance imaging spectrometer. A 10 mm hole was built in the center of this cubic-shaped stationary magnetic system so that the test material could be placed within a glass tube in the region of the test, which was surrounded by magnetic segments. The output and the test results were captured through MATLAB figures for further analysis. Experiments on stationary water samples were conducted by several tests and analyses. As a general approach, the excitation system mechanism and its applied signals, which are featured on the samples under study, are explained, and then the captured results are illustrated. The input and output signals, which include all the applied excitation marks and practical results of the sample’s reactions in the study, are captured.

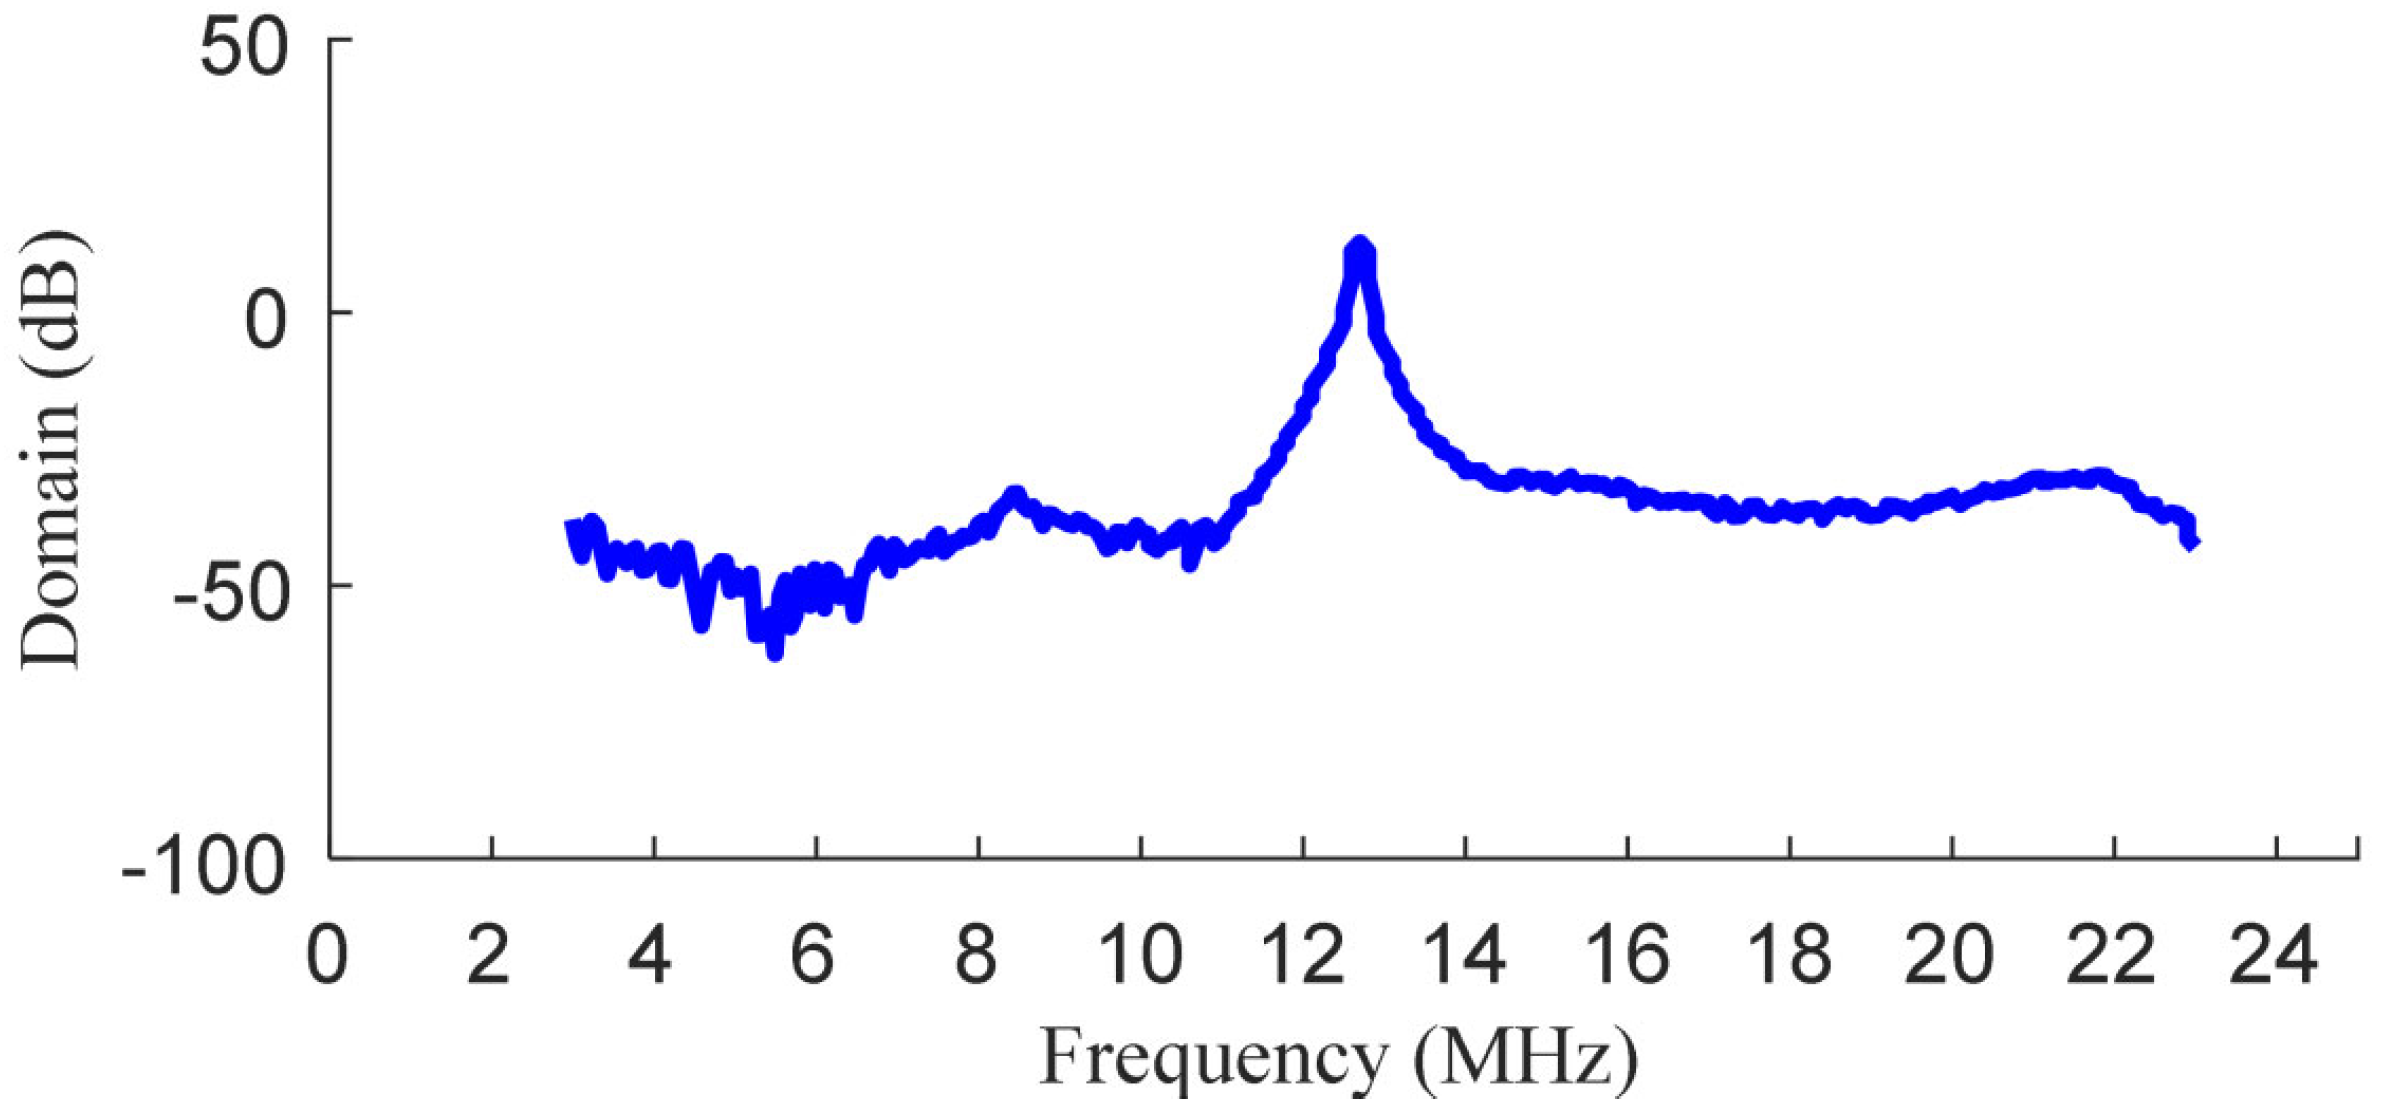
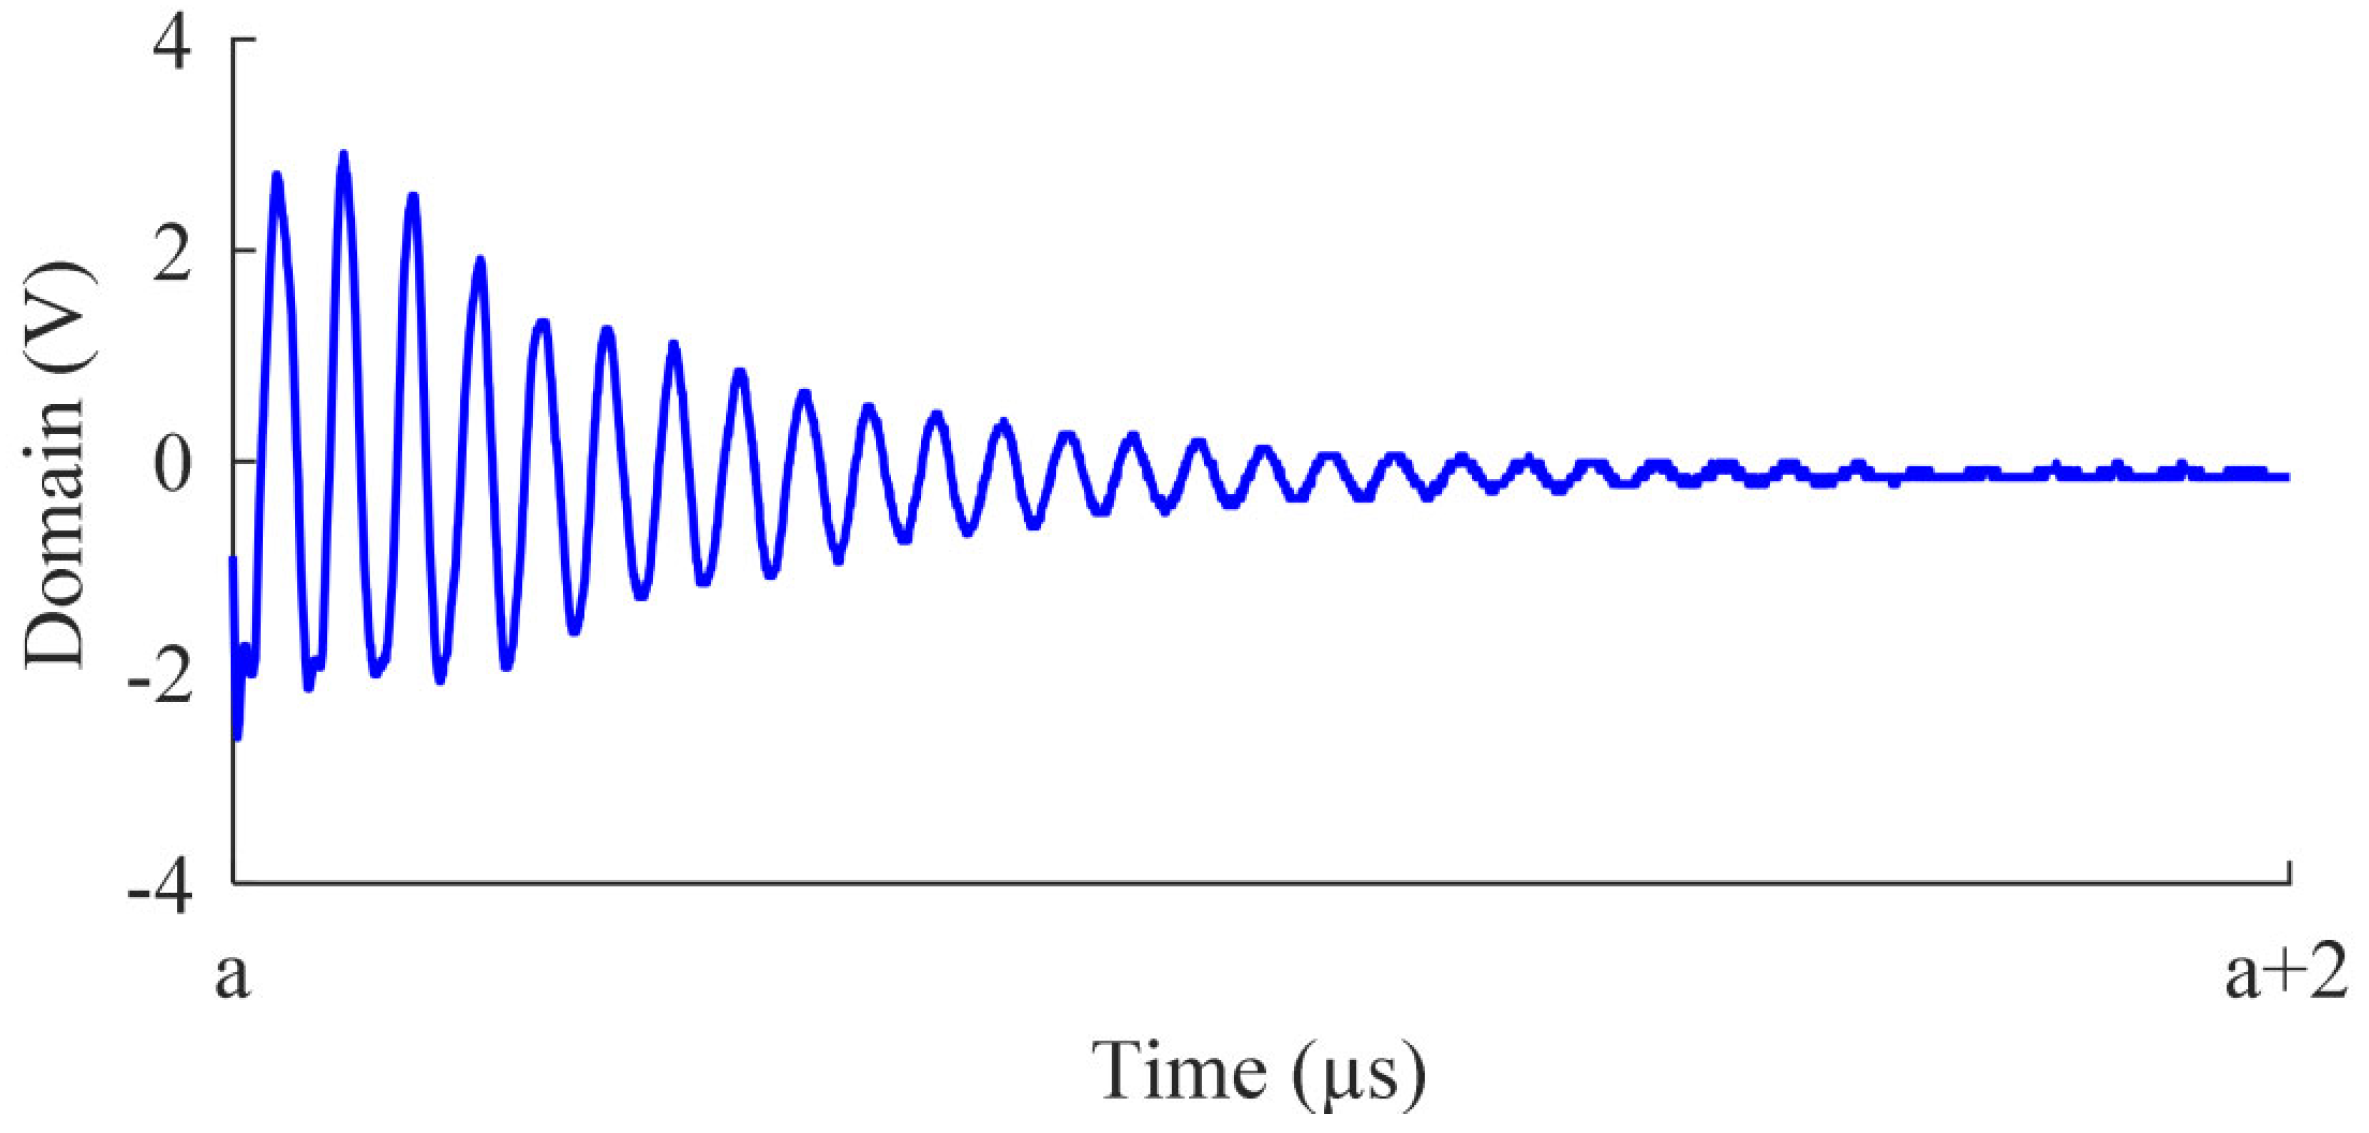
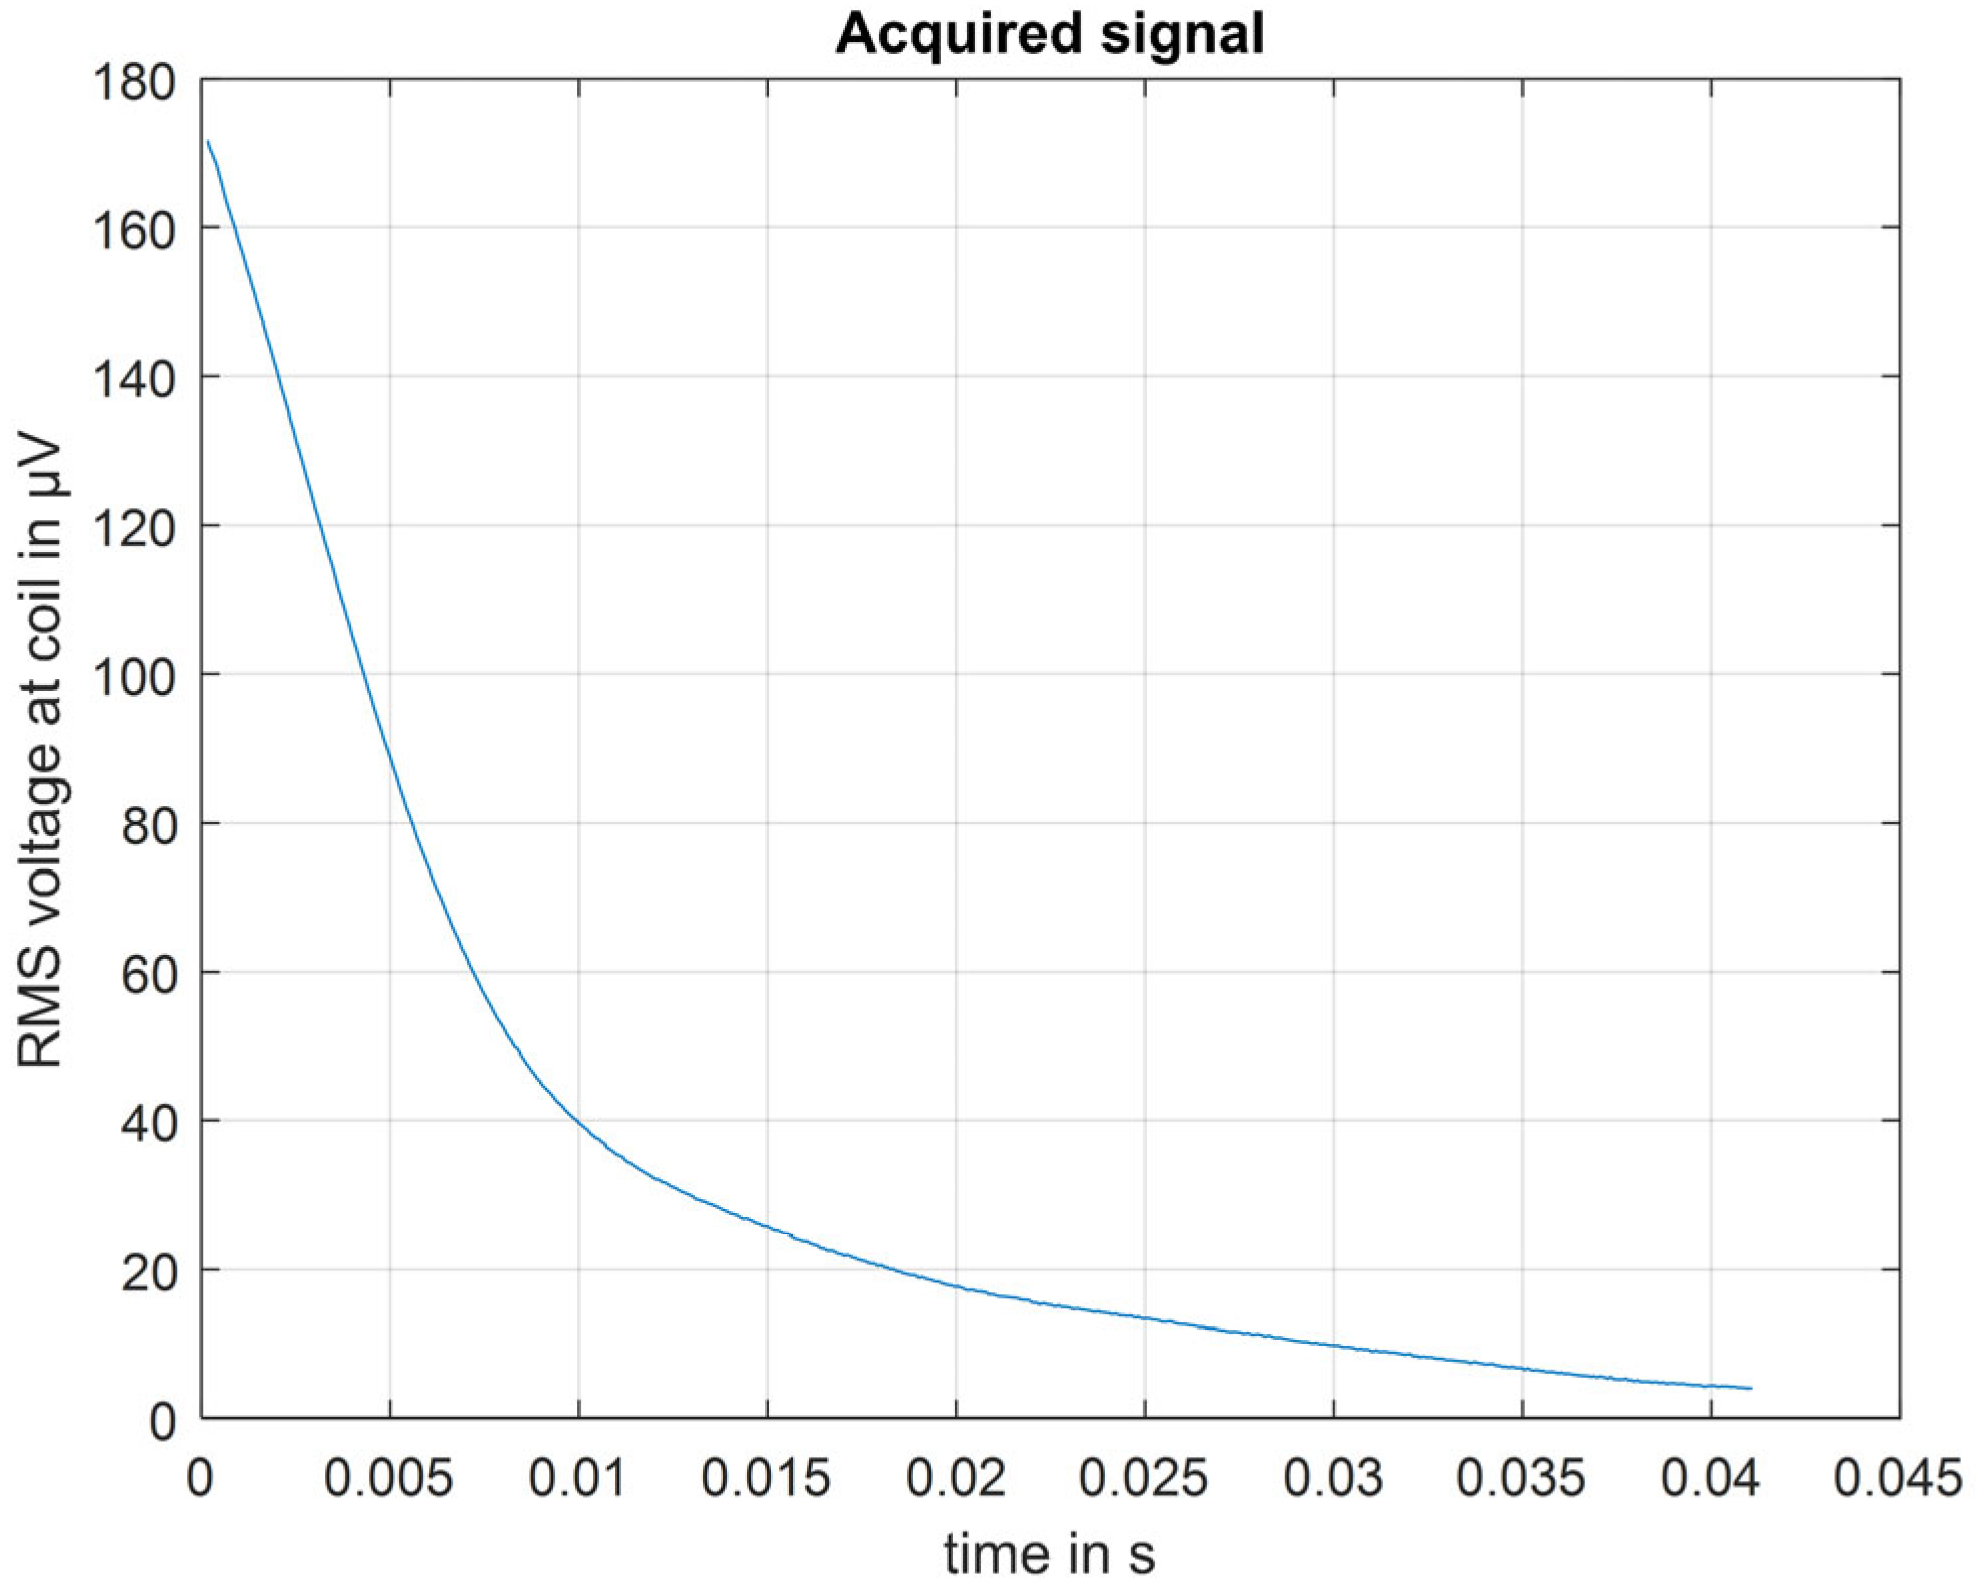
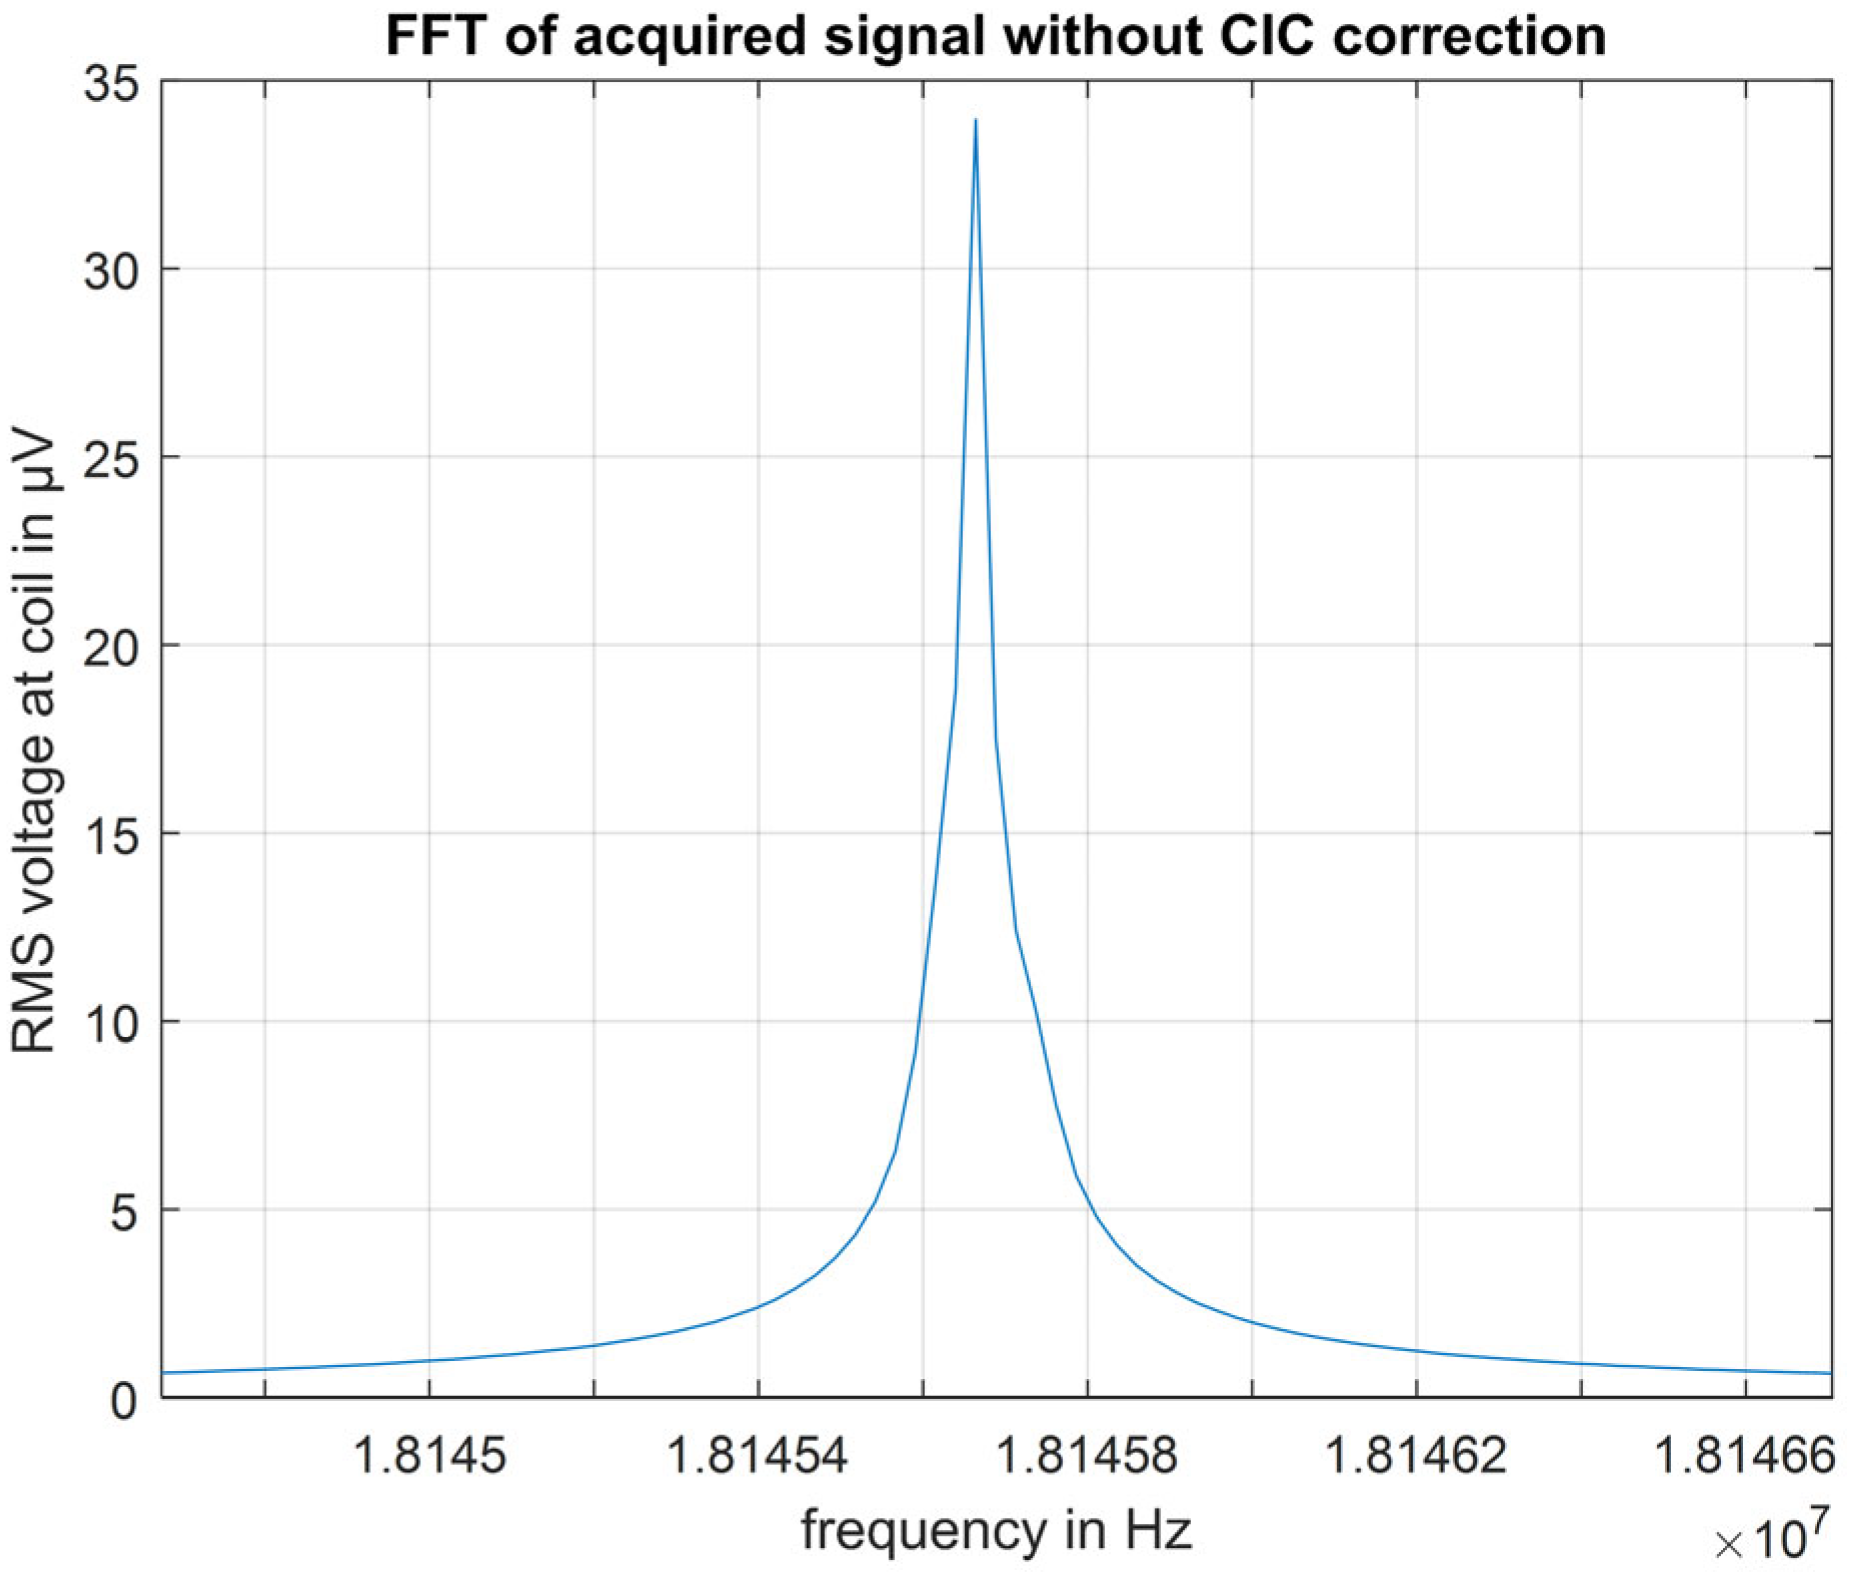
4.3. Free Induction Decay and Larmor Frequency

In this test we determine and capture the free induction decay (FID) curve for stationary water. However, some parameters needed to be adjusted before running any tests, such as the Larmor frequency, radio frequency at 90-degree pulse duration, shim values, an optimum span around the Larmor frequency, the number of measurements for both transmitter and acquisition trains, and the number of samples in each measurement. Figure 9 shows how a simple spin echo was created with gradients. As a side note, fast Fourier transformation (FFT) was applied to the encoded spin-echo signal, which shows a profile of the sample. Here, the echo time was 10 ms, and the repetition time was set equal to 100 ms. Regarding the acquisition parameters, it started after 0.1 ms and applied the 90-degree signal.
To provide an FID for the sample under study, we needed to apply an excitation pulse and then acquire the impacted signal based on the abovementioned points. Figure 10 shows the acquired signal for peaks of the FID curve when tap water was used as a test sample. Due to capturing the atom’s reactions in terms of the induced voltage in the receiver coil, this figure illustrates the decay of the RMS voltage at the coil after removing the excitation signal from the system. Note that this value started from ~180 µV and decreased to 0 µV after 0.045 s. Due to the occurrence of resonance when the atoms were excited by an RF signal at a specific frequency, the FID curve was presented in the frequency domain after applying the FFT over it. Figure 11 shows the Larmor frequency for this test. The value of the Larmor frequency depends on the magnitude of the constant magnetic field and the material, which is being tested. Based on our magnetic device features, we found the Larmor frequency was around 18.145 MHz. Considering the differences in constant magnetic field values, the obtained results from this off-the-shelf lightweight NMR tool with magnetic resonance imaging spectrometer are validating what was observed for the Larmor frequency from the optimally prototyped portable NMR tool. However, the limitation of the off-the-shelf setup is its mechanical structure and weight, which may not be feasible for applications, such as sap flow measurements in a plant’s stem. The optimally prototyped tool provides this feature while ensuring accurate measurements. It worth mentioning that the prototyped magnetic structure of Figure 1, if manufactured in a highly precise industrial setting, would yield a much lower mismatch of the magnetic field strength and homogeneity as compared with the simulation results, which results in more accurate measurements.

5. Conclusions

An optimal design framework for prototyping a portable nuclear magnetic resonance system was presented in this article. Extensive FEA of different geometries of the NMR were studied to evaluate their magnetic field strength and homogeneity. Modified particle swarm optimization techniques were proposed as a framework for the optimal design of the NMR tool. By using the Ansys Maxwell software tool, several potential designs were assessed. The confirmed design option was prototyped in the research laboratory after assessing the required homogeneity and strength regarding the constant magnetic field and contemplating the optimal outcomes of the optimization algorithm. Prototyping procedures were stated, and all electrical and mechanical restrictions were considered. To evaluate the functionality of the prototyped device, the Larmor frequency of hydrogen atoms in a glass tube was defined as the test objective. Additionally, the performance of the prototyped NMR tool was evaluated by carrying out some practical use cases. Finally, the accuracy and performance of the optimally designed and prototyped portable NMR tool is compared with an off-the-shelf NMR tool and an advanced magnetic resonance imaging spectrometer. The results demonstrate the accuracy of the optimized NMR tool with additional features, which enables a wide range of applications, which is the main limitation of commercially available tools given their mechanical and weight constraints. All experimental results were supported by theoretical principles and the experimental evaluation for the NMR tool.

Author Contributions

First author, M.H., contributed to conceptualization, methodology, investigation, data collection, formal analysis, validation, and writing-original draft preparation of the manuscript. Co-authors S.D. and M.B. contributed to experimental validation and data gathering as detailed in Section 4. Co-Authors R.K. and N.T.H. contributed to experimental validation. Co-Authors M.B.S., B.G. and S.V.K.J. contributed to conceptualization, supervision, project administration, funding acquisition, and writing-review and editing of the manuscript. All authors have read and agreed to the published version of the manuscript.

Funding

This research was supported by the U.S. National Science Foundation (NSF) through the Plant Genome Research Program (PGRP). The authors acknowledge the NSF for financial support through grant number 1936376. The APC was funded by the University of Illinois Chicago.

Data Availability Statement

Data will be provided upon request to the corresponding author.

Conflicts of Interest

The authors declare no conflict of interest. The funders had no role in the design of the study; in the collection, analyses, or interpretation of data; in the writing of the manuscript; or in the decision to publish the results.

References

  1. Hong, S.; Sun, N. Portable CMOS NMR System With 50-kHz IF, 10-μs Dead Time, and Frequency Tracking. IEEE Trans. Circuits Syst. I Regul. Pap. 2021, 68, 4576–4588. [Google Scholar] [CrossRef]
  2. Christodoulou, A.G.; Kellman, P.; Liang, Z.P. Accelerating Cardiovascular Magnetic Resonance Imaging: Signal Processing Meets Nuclear Spins [Life Sciences]. IEEE Signal Process Mag. 2014, 31, 138–143. [Google Scholar] [CrossRef]
  3. Riederer, S.J. Current technical development of magnetic resonance imaging. IEEE Eng. Med. Biol. Mag. 2000, 19, 34–41. [Google Scholar] [CrossRef] [PubMed]
  4. Crooks, L.E. An Introduction to Magnetic Resonance Imaging. IEEE Eng. Med. Biol. Mag. 1985, 4, 8–15. [Google Scholar] [CrossRef] [PubMed]
  5. Gomes, B.F.; Lobo, C.M.S.; Colnago, L.A. Monitoring Electrochemical Reactions in Situ with Low Field NMR: A Mini-Review. Appl. Sci. 2019, 9, 498. [Google Scholar] [CrossRef]
  6. Chen, J.; Xu, C. Design and Analysis of the Novel Test Tube Magnet as a Device for Portable Nuclear Magnetic Resonance. IEEE Trans. Magn. 2007, 43, 3555–3557. [Google Scholar] [CrossRef]
  7. Haacke, E.M.; Zhi-Pei, L. Challenges of imaging structure and function with MRI. IEEE Eng. Med. Biol. Mag. 2000, 19, 55–62. [Google Scholar] [CrossRef]
  8. Eroglu, S.; Friedman, G.; Magin, R.L. Estimate of losses and signal-to-noise ratio in planar inductive micro-coil detectors used for NMR. IEEE Trans. Magn. 2001, 37, 2787–2789. [Google Scholar] [CrossRef]
  9. Kowalski, M.E.; Jin, J.M. A numerical study of the field dependence of signal-to-noise ratio in high-field MRI. In Proceedings of the IEEE Antennas and Propagation Society International Symposium. 2001 Digest. Held in Conjunction with: USNC/URSI National Radio Science Meeting (Cat. No.01CH37229), Boston, MA, USA, 8–13 July 2001; Volume 361, pp. 366–369. [Google Scholar]
  10. Halbach, K. Design of permanent multipole magnets with oriented rare earth cobalt material. Nucl. Instrum. Methods 1980, 169, 1–10. [Google Scholar] [CrossRef]
  11. Sonawane, S.T.; Meribout, M. Halbach array design targeting nuclear magnetic resonance. In Proceedings of the 2016 5th International Conference on Electronic Devices, Systems and Applications (ICEDSA), Ras Al Khaimah, United Arab Emirates, 6–8 December 2016; pp. 1–4. [Google Scholar]
  12. Meribout, M.; Sonowan, S. Optimal Halbach Magnet Array Design for Portable NMR Targeting Multiphase Flow Metering Applications. IEEE Trans. Magn. 2019, 55, 4001207. [Google Scholar] [CrossRef]
  13. Purchase, A.R.; Vidarsson, L.; Wachowicz, K.; Liszkowski, P.; Sun, H.; Sarty, G.E.; Sharp, J.C.; Tomanek, B. A Short and Light, Sparse Dipolar Halbach Magnet for MRI. IEEE Access 2021, 9, 95294–95303. [Google Scholar] [CrossRef]
  14. Li, D.; Wang, H.; Ren, Y.; Wang, D. Electromagnetic Design and Mechanical Behavior Analysis of an 850 MHz All REBCO Nuclear Magnetic Resonance Magnet. IEEE Trans. Appl. Supercond. 2021, 31, 4600609. [Google Scholar] [CrossRef]
  15. Windt, C.W.; Soltner, H.; Van Dusschoten, D.; Blümler, P. A portable Halbach magnet that can be opened and closed without force: The NMR-CUFF. J. Magn. Reson. 2011, 208, 27–33. [Google Scholar] [CrossRef] [PubMed]
  16. Meixner, M.; Kochs, J.; Foerst, P.; Windt, C.W. An integrated magnetic resonance plant imager for mobile use in greenhouse and field. J. Magn. Reson. 2021, 323, 106879. [Google Scholar] [CrossRef]
  17. Gohari, A.; Hekmati, A.; Mosallanejadand, A.; Torkaman, H.; Afjei, E. Design and Comparative Finite Element And Thermal Analysis of 1-Phase Cylindrical Transformer for Low-Power Applications. In Proceedings of the 2021 12th Power Electronics, Drive Systems, and Technologies Conference (PEDSTC), Tabriz, Iran, 2–4 February 2021; pp. 1–5. [Google Scholar]
  18. Boyer, T.H. The force on a magnetic dipole. Am. J. Phys. 1988, 56, 688–692. [Google Scholar] [CrossRef]
  19. Soltner, H.; Blümler, P. Dipolar Halbach magnet stacks made from identically shaped permanent magnets for magnetic resonance. Concepts Magn. Reson. Part A 2010, 36A, 211–222. [Google Scholar] [CrossRef]
  20. Bajaj, V.S.; Paulsen, J.; Harel, E.; Pines, A. Zooming in on microscopic flow by remotely detected MRI. Science 2010, 330, 1078–1081. [Google Scholar] [CrossRef]
  21. Halpern-Manners, N.W.; Kennedy, D.J.; Trease, D.R.; Teisseyre, T.Z.; Malecek, N.S.; Pines, A.; Bajaj, V.S. Gradient-free microfluidic flow labeling using thin magnetic films and remotely detected MRI. J Magn Reson 2014, 249, 135–140. [Google Scholar] [CrossRef]
  22. Song, Y.-Q.; Scheven, U.M. An NMR technique for rapid measurement of flow. J. Magn. Reson. 2005, 172, 31–35. [Google Scholar] [CrossRef]
  23. Dalitz, F.; Cudaj, M.; Maiwald, M.; Guthausen, G. Process and reaction monitoring by low-field NMR spectroscopy. Prog. Nucl. Magn. Reson. Spectrosc. 2012, 60, 52–70. [Google Scholar] [CrossRef]
  24. Gomez, M.V.; de la Hoz, A. NMR reaction monitoring in flow synthesis. Beilstein J. Org. Chem. 2017, 13, 285–300. [Google Scholar] [CrossRef] [PubMed]
  25. Hilty, C.; McDonnell, E.E.; Granwehr, J.; Pierce, K.L.; Han, S.-I.; Pines, A. Microfluidic gas-flow profiling using remote-detection NMR. Proc. Natl. Acad. Sci. USA 2005, 102, 14960–14963. [Google Scholar] [CrossRef] [PubMed]
  26. Granwehr, J.; Harel, E.; Han, S.; Garcia, S.; Pines, A.; Sen, P.N.; Song, Y.Q. Time-of-flight flow imaging using NMR remote detection. Phys. Rev. Lett. 2005, 95, 075503. [Google Scholar] [CrossRef] [PubMed]
  27. Harel, E.; Granwehr, J.; Seeley, J.A.; Pines, A. Multiphase imaging of gas flow in a nanoporous material using remote-detection NMR. Nat. Mater. 2006, 5, 321–327. [Google Scholar] [CrossRef] [PubMed]
  28. Harel, E.; Hilty, C.; Koen, K.; McDonnell, E.E.; Pines, A. Time-of-Flight Flow Imaging of Two-Component Flow inside a Microfluidic Chip. Phys. Rev. Lett. 2007, 98, 017601. [Google Scholar] [CrossRef] [PubMed]
  29. Harel, E.; Pines, A. Spectrally resolved flow imaging of fluids inside a microfluidic chip with ultrahigh time resolution. J. Magn. Reson. 2008, 193, 199–206. [Google Scholar] [CrossRef]
  30. Kumar, R.; Hosseinzadehtaher, M.; Hein, N.; Shadmand, M.; Jagadish, S.; Ghanbarian, B. Challenges and advances in measuring sap flow in agriculture and agroforestry: A review with focus on nuclear magnetic resonance. Front. Plant Sci. 2022, 13, 1036078. [Google Scholar] [CrossRef]
  31. Windt, C.W.; Nabel, M.; Kochs, J.; Jahnke, S.; Schurr, U. A Mobile NMR Sensor and Relaxometric Method to Non-destructively Monitor Water and Dry Matter Content in Plants. Front. Plant Sci. 2021, 12, 1–17. [Google Scholar] [CrossRef]
  32. Colnago, L.A.; Wiesman, Z.; Pages, G.; Musse, M.; Monaretto, T.; Windt, C.W.; Rondeau-Mouro, C. Low field, time domain NMR in the agriculture and agrifood sectors: An overview of applications in plants, foods and biofuels. J. Magn. Reson. 2021, 323, 106899. [Google Scholar] [CrossRef]
  33. Poulichet, P.; Fakri, A.; Delabie, C.; Phuc, H.D.; Cong, T.T.; Fakri-Bouchet, L. Simulation and optimisation of homogeneous permanent magnet for portable NMR applications. Int. J. Smart Sens. Intell. Syst. 2014, 7, 1–6. [Google Scholar] [CrossRef]
Figure 1. Initial design of the NMR tool and simulation output; (a) 3D design of rectangular NMR; (b) 3D design of square NMR.
Jne 04 00025 g001
Figure 2. Evaluating the effect of the number of magnetic segments on the magnetic field homogeneity: (a) one magnetic segment NMR structure; (b) four magnetic segments NMR structure; (c) eight magnetic segments NMR structure; (d) sixteen magnetic segments NMR structure.
Jne 04 00025 g002
Figure 3. Evaluating the rectangular shape of NMR magnetic field homogenity and strength for different lengths: (a) NMR magnetic field with the height of 14.84 cm and the diameter of 2.83 cm; (b) NMR magnetic field with the height of 15.3 cm and the diameter of 5.6 cm.
Jne 04 00025 g003
Figure 4. Evaluating trapezoidal magnets for NMR: (a) 3D design for a trapezoidal format of NMR; (b) design mold for magnetic segments; (c) perspective view of magnetic field in streamline format; (d) top view of the structure in (c).
Jne 04 00025 g004
Figure 5. In order from left-to-right and top-to-bottom: prototype of portable NMR magnetic structure (upper left), the stem holder assembly (upper right), the glass tube and holder with mounted transmitter and receiver coils (lower left), and top view of NMR mechanical structure with holder equipped with exciter and receiver coils (lower right). A glass tube filled with water placed in the holder assembly.
Jne 04 00025 g005
Figure 6. High-level schematic diagram of portable NMR tool connection for functionality testing and validation.
Jne 04 00025 g006
Figure 7. Output reaction in frequency domain when the system was excited by a 12.7 MHz radio frequency signal. Resonant was observed in this test.
Jne 04 00025 g007
Figure 8. Output reaction in time domain when the system was excited by a 12.7 MHz radio frequency signal. Free induction decay is obvious.
Jne 04 00025 g008
Figure 9. Simple spin echo with gradient.
Jne 04 00025 g009
Figure 10. Peaks of free induction decay curve for hydrogen atom. The signal was acquired after removing exciting signal.
Jne 04 00025 g010
Figure 11. Fast Fourier transformer of acquired signal when resonance occurs; the dominant frequency is known as Larmor frequency.
Jne 04 00025 g011
Table 1. Characteristics of magnetic segments used in forming the four permanent magnets of the NMR structure.
ParameterValue
Magnet materialNeodymium
Dimensions1″ (Length) × 1″(Width) × 1″(Height)
Pull rating81.86 lbs
Weight0.267 lbs
Remenance (Rem)13.22 kGauss
Disclaimer/Publisher’s Note: The statements, opinions and data contained in all publications are solely those of the individual author(s) and contributor(s) and not of MDPI and/or the editor(s). MDPI and/or the editor(s) disclaim responsibility for any injury to people or property resulting from any ideas, methods, instructions or products referred to in the content.

