Article

Ex Situ LIBS Analysis of WEST Divertor Wall Tiles after C3 Campaign

1
Institute of Physics, University of Tartu, 50411 Tartu, Estonia
2
CEA, IRFM, F-13108 Saint-Paul-Lez-Durance, France
3
VTT Technical Research Centre of Finland Ltd., P.O. Box 1000, FI-02044 Espoo, Finland
4
Department of Physics, University of Helsinki, P.O. Box 64, FI-00014 Helsinki, Finland
5
National Institute for Laser, Plasma and Radiation Physics, Euratom-MedC Association, 409 Atomistilor, 077125 Bucharest, Romania
*
Author to whom correspondence should be addressed.
See http://west.cea.fr/WESTteam.
See the author list at https://iopscience.iop.org/article/10.1088/1741-4326/aa796e.
J. Nucl. Eng. 2023, 4(1), 96-110; https://doi.org/10.3390/jne4010007
Submission received: 27 October 2022 / Revised: 27 December 2022 / Accepted: 28 December 2022 / Published: 5 January 2023

Abstract

:
Fuel retention monitoring in tokamak walls requires the development of remote composition analysis methods such as laser-induced breakdown spectroscopy (LIBS). The present study investigates the feasibility of the LIBS method to analyse the composition and fuel retention in three samples from WEST divertor erosion marker tiles after the experimental campaign C3. The investigated samples originated from tile regions outside of strong erosion and deposition regions, where the variation of thin deposit layers is relatively small and facilitates cross-comparison between different analysis methods. The depth profiles of main constituents W, Mo and C were consistent with depth profiles determined by other composition analysis methods, such as glow-discharge optical emission spectroscopy (GDOES) and secondary ion mass spectrometry (SIMS). The average LIBS depth resolution determined from depth profiles was 100 nm/shot. The averaging of the spectra collected from multiple spots of a same sample allowed us to improve the signal-to-noise ratio, investigate the presence of fuel D and trace impurities such as O and B. In the investigated tile regions with negligible erosion and deposition, these impurities were clearly detectable during the first laser shot, while the signal decreased to noise level after a few subsequent laser shots at the same spot. LIBS investigation of samples originating from the deposition regions of tiles may further clarify LIBS’ ability to investigate trace impurities.

1. Introduction

Fuel retention in the first walls and divertor of fusion reactors is a serious safety issue in the exploitation of fusion energy because of the radioactivity of tritium [1,2]. The monitoring of fuel retention requires the development of remote composition analysis methods such as laser induced breakdown spectroscopy (LIBS) [3,4]. The LIBS technique uses short laser pulses to ablate a small amount of material which forms plasma, and emits light whose spectrum is characteristic of the elements originating from the investigated material [4]. Application of consequent laser pulses at the same spot allows extracting elemental depth profiles. In general, LIBS can determine the depth profiles in the form of changes in the intensity of elemental lines as a function of laser shots, because the actual depth ablated by each laser shot is not known with good accuracy. With the known thickness of the investigated layers, the average ablation rate can be determined.
LIBS has been successfully applied for ex situ and in situ first wall composition analysis of various tokamaks e.g., JET, ASDEX Upgrade, TEXTOR, EAST, KSTAR, Compass and FTU [5,6,7,8,9,10,11,12,13,14,15,16,17,18,19,20]. It was demonstrated that the method is able to determine the depth distribution of the main constituents of the plasma facing components (PFC) and sometimes also the trace elements [14,17,18]. Furthermore, the experiments have shown the usability of LIBS for the measurement of spatial and depth distribution of fuel (D) in the PFCs. The quantitative LIBS measurements of fuel retention in metallic first wall components originating from tokamaks have remained unsuccessful. This is most likely due to the experimental conditions used which were not optimized for quantitative measurements [19].
The cited LIBS studies have investigated surface layers of different tokamaks with very different composition and properties: beryllium deposits on tungsten (W) and a molybdenum (Mo) layered structure on carbon (C) from JET, a W marker layer on C from ASDEX, graphite from TEXTOR, graphite deposits on specific W layers on copper from KSTAR, SS316 or Inconel 625 screws from COMPASS, graphite from Aditya, Mo from FTU and Mo, W or C from EAST. However, the use of the LIBS results obtained with one type of materials in the analysis of other type of materials is not straightforward, due to matrix effects. For example, LIBS measurements of compact and porous W layers exposed to Magnum-PSI deuterium plasma have shown very different D signal strength even when the layers had similar D retention according to NRA [21]. Therefore, it is necessary to build a comprehensive knowledge base for different materials originating from different tokamaks.
The WEST tokamak has superconducting magnets and actively cooled metallic PFCs which operate with steady-state long pulses and high particle fluence; its aim is to test the W divertor technology in an integrated tokamak environment [22,23,24]. A thorough testing of the changes in the surface morphology and composition of PFCs has been carried out by various methods [25,26,27]. LIBS is one method planned for the testing of elemental composition of selected divertor samples and the fuel retention in them. LIBS has not been previously used to investigate the elemental depth profiles and D retention of WEST tokamak PFC tiles, while there is ongoing work to apply LIBS to in situ analysis in WEST.
The aim of the present study was to investigate the feasibility of the LIBS method for the analysis of composition and fuel retention in samples originating from erosion marker tiles removed from the WEST divertor after the experimental campaign C3 [25,26]. The samples were obtained from the tile regions with expectedly small erosion and deposition. Ion-beam analysis of the whole tiles showed that these regions have only thin deposit layers with slowly varying composition and thickness [25]. This simplifies the cross-comparison between different analysis methods carried out in adjacent tile regions. In the present study, LIBS elemental depth profiles were compared with the profiles obtained by GDOES and SIMS. LIBS’ usability for comparison of the amount of various impurities in different samples was additionally investigated by determining the line ratios of the impurities and tungsten. Furthermore, the possibility of quantitatively determining deuterium concentration using the calibration-free (CF) LIBS method was assessed at the LIBS experimental parameters suitable both for depth profile analysis and impurity detection.

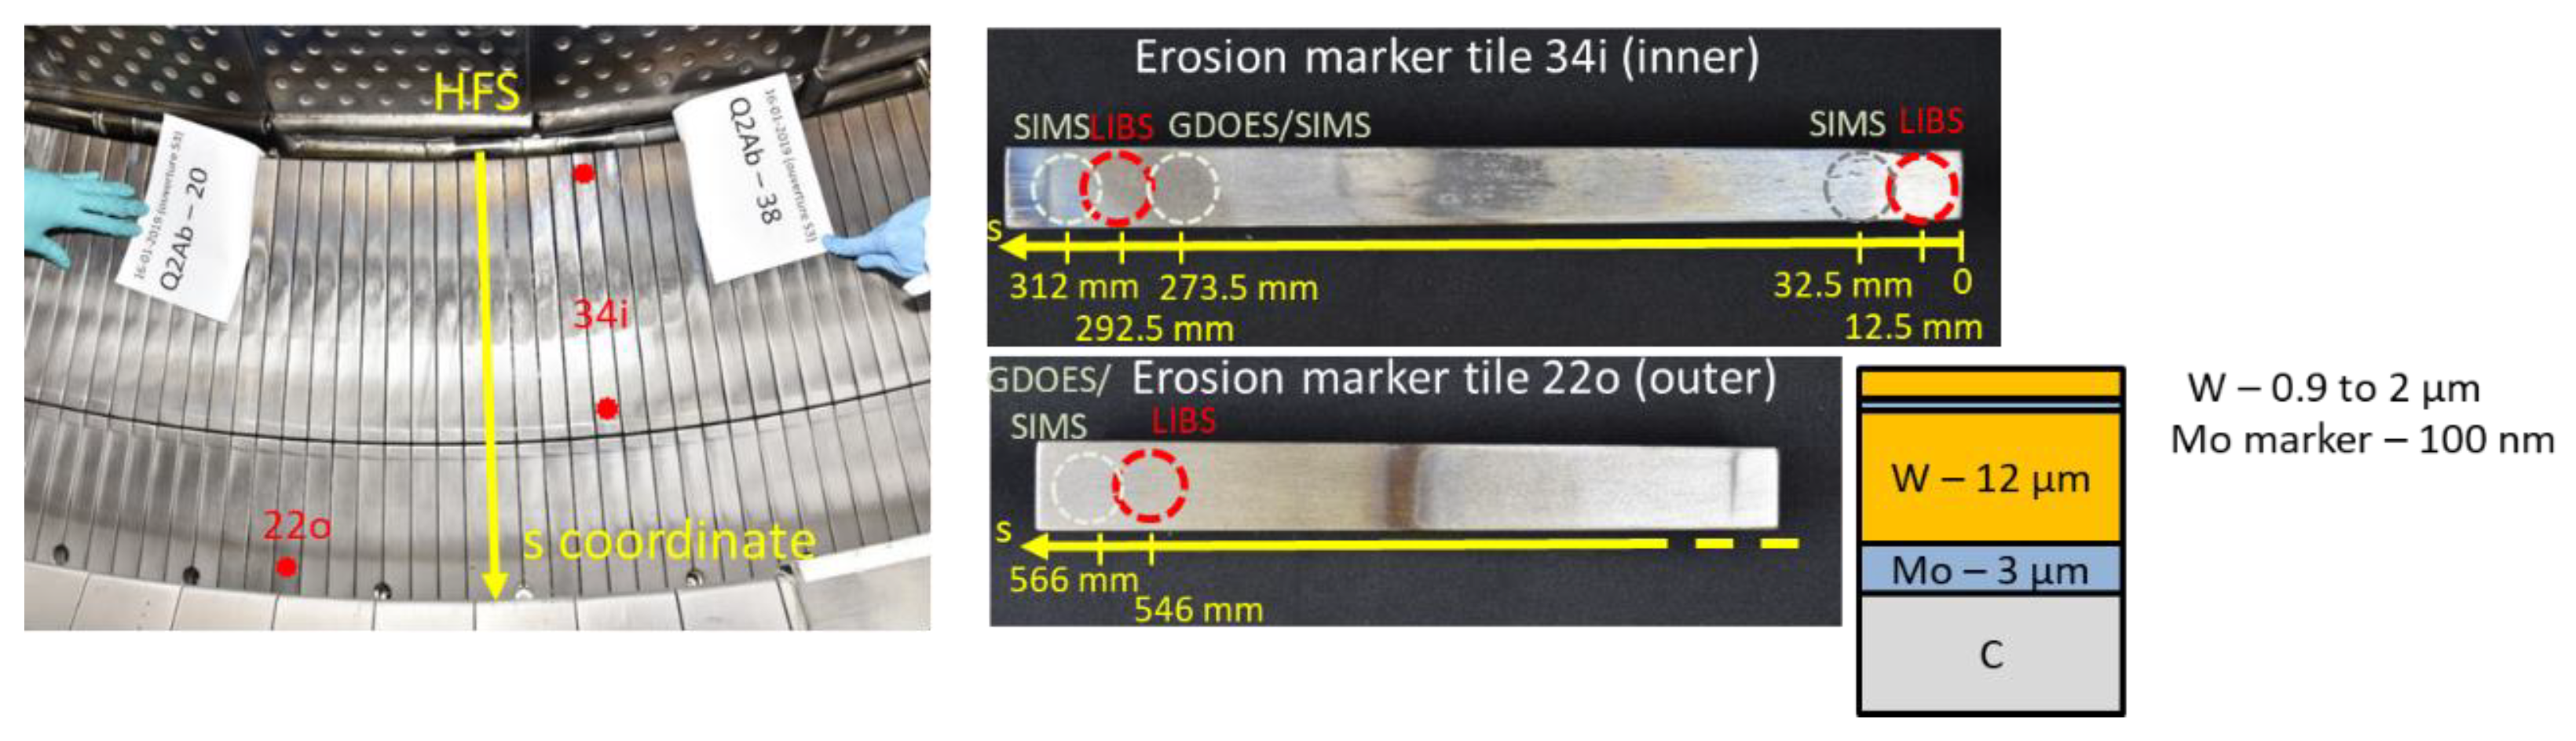
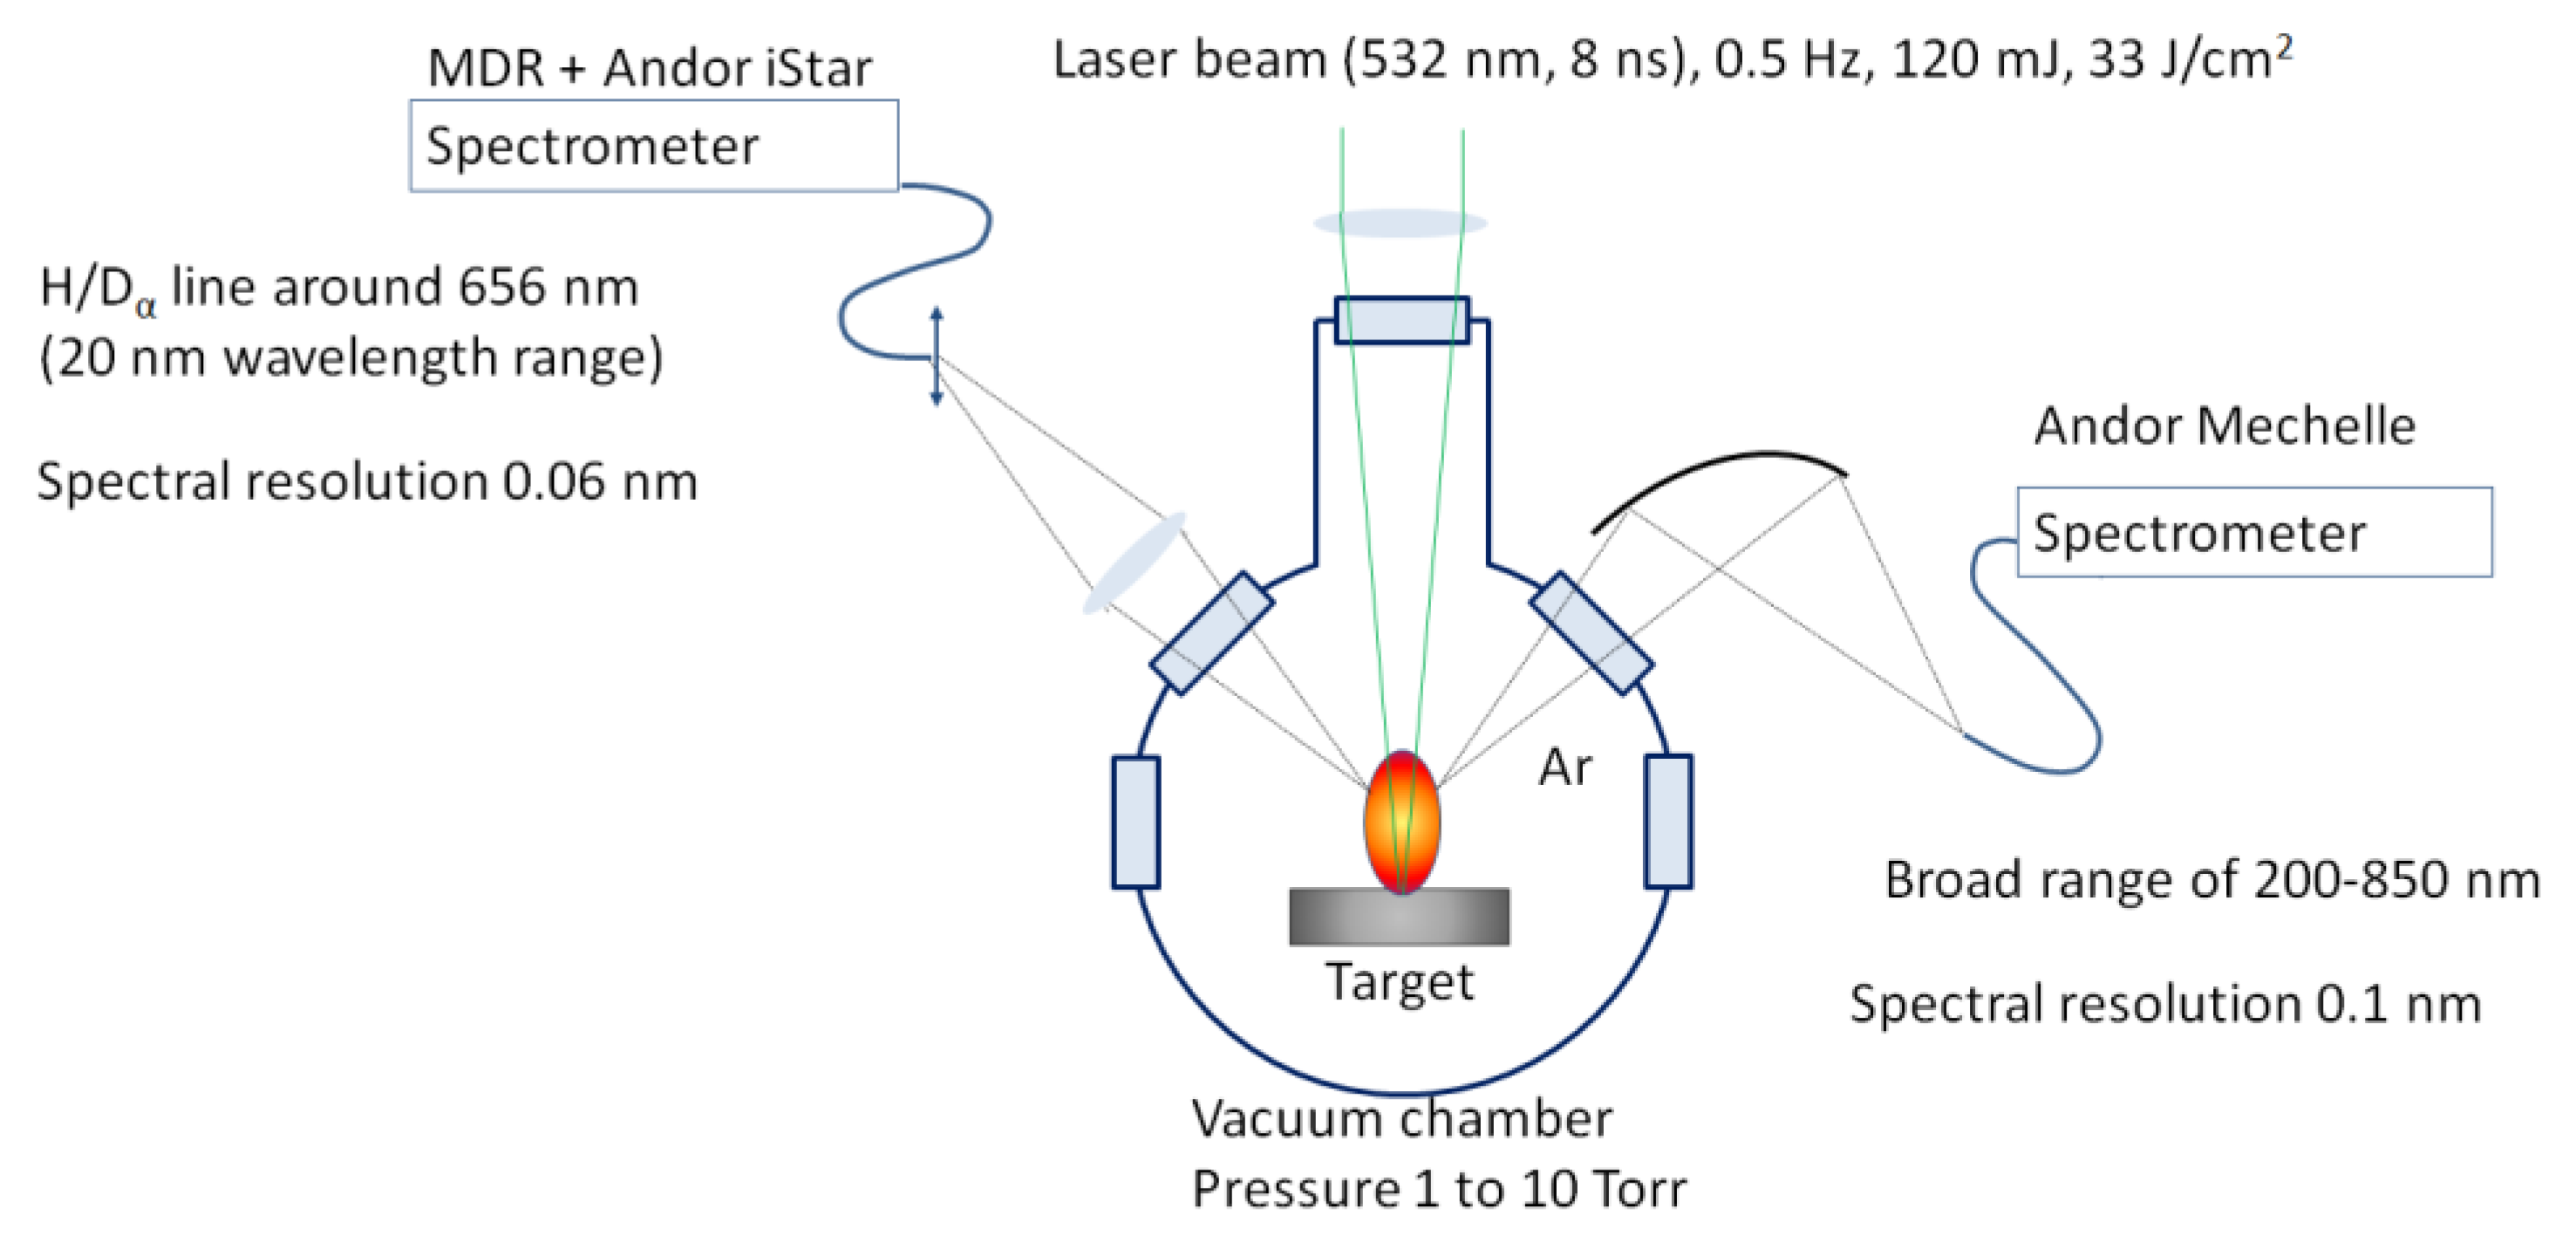
2. Materials and Methods

Three samples investigated by LIBS, two samples investigated by GDOES and four samples investigated by SIMS were part of the inner erosion marker tile #34 (34i) and the outer erosion marker tile #22 (22o) [26]. The position of the samples on the lower divertor of WEST is shown in Figure 1, together with a schematic illustration of the W and Mo layers on C substrate constituting the marker tiles. The investigated sample had a cylindrical shape with a diameter of 17 mm and a thickness of a few mm. According to scanning electron microscopy (SEM) studies from cross-sections of similar samples, the actual thicknesses of different layers varied and the average roughness of the graphite substrate together with Mo and W coatings was approximately 2 μm, which was considerably larger than the thickness of Mo marker layer (nominally 100 nm) [25]. The investigated LIBS samples originated from the inner marker tile 34i regions at s coordinates 12.5 mm and 292.5 mm, and from the outer marker tile 22o region at s = 546 mm. These regions were outside of the strong erosion and deposition regions where the composition of thin deposit layers varied relatively slowly according to preceding ion beam analysis of whole tiles [25]. Therefore, one can expect that the complementary GDOES and SIMS elemental composition depth profiles from adjacent s coordinate positions can be used for comparison with LIBS results. The GDOES samples were taken from the 34i marker tile at s coordinate of 273.5 mm and from the 22o marker tile at s coordinate of 566.0 mm. The SIMS samples originated from the 34i marker tile s coordinates 32.5 mm, 273.5 mm and 312 mm, and 22o marker tile s = 566 mm.
GDOES uses a low-pressure, glow-discharge plasma of argon to sputter away the surface of the measured sample. Subsequently, the sputtered material is excited into plasma and analysed by optical spectroscopy. The gradual sputtering of the material layers allows investigation of the elemental depth profiles of the samples. In the present study, the analysis was carried out with Spectruma GDA 750 equipment [28,29].
SIMS method uses primary ion beam for sputtering the sample surface. The ejected secondary ions are collected and analysed by mass spectrometry. In present study, a double-focusing magnetic sector SIMS (VG Ionex IX-70S) with a 5-keV O2+ primary ion beam at a current of 500 nA was used for the measurements. The analysis area was 0.3 × 0.4 mm2 and an electronic gate was used to record the signal from the 10% central region.
Figure 2 shows the schematic setup used for LIBS studies. Ex situ LIBS experiments were carried out in a vacuum chamber which was filled with argon to a pressure of 1 or 10 Torr. This pressure range was used because it allows good signal strength at narrow linewidths of hydrogen isotope lines required for D/H distinction. A Nd:YAG laser by Quantel (YG981C with 8 ns pulse length working at 532 nm) was focused perpendicularly to the target surface using a lens with a focal length of 150 cm. The diameter of the spot formed on the surface due to laser ablation was approximately 0.7 mm. Most of the LIBS experiments were made with a laser pulse energy of 120 mJ, which resulted in a fluence of 33 J/cm2 and allowed good signal intensity and a relatively low ablation rate. The optical emission originating from the plasma plume created by laser pulses was collected at 45 degrees with respect to the laser beam by two different spectrometers. A Czerny-Turner type spectrometer (MDR-63) with focal length of 0.5 m, diffraction grating 1200 L/mm and entrance slit width 15 µm was coupled with Andor iStar camera. The resulting spectral resolution was 0.06 nm, enabling us to resolve Dα and Hα emission lines in the 20 nm spectral window around 656 nm. A Mechelle 5000 spectrometer registering spectra in the broad spectral window from 200 to 850 nm was used to investigate the emission of other elements (W, Mo, C etc). The lines of W I and W II emission were further used to determine the electron temperature from the Saha-Boltzmann plot [30], while the width of the Hα line was used to determine electron density [31]. The time delay between the laser pulse and registering of the spectrum was either 300 ns at the pressure of 1 Torr Ar or 1300 ns at the pressure of 10 Torr Ar. The gate width during the spectral recording was equal with the used time-delay.

3. Results and Discussion

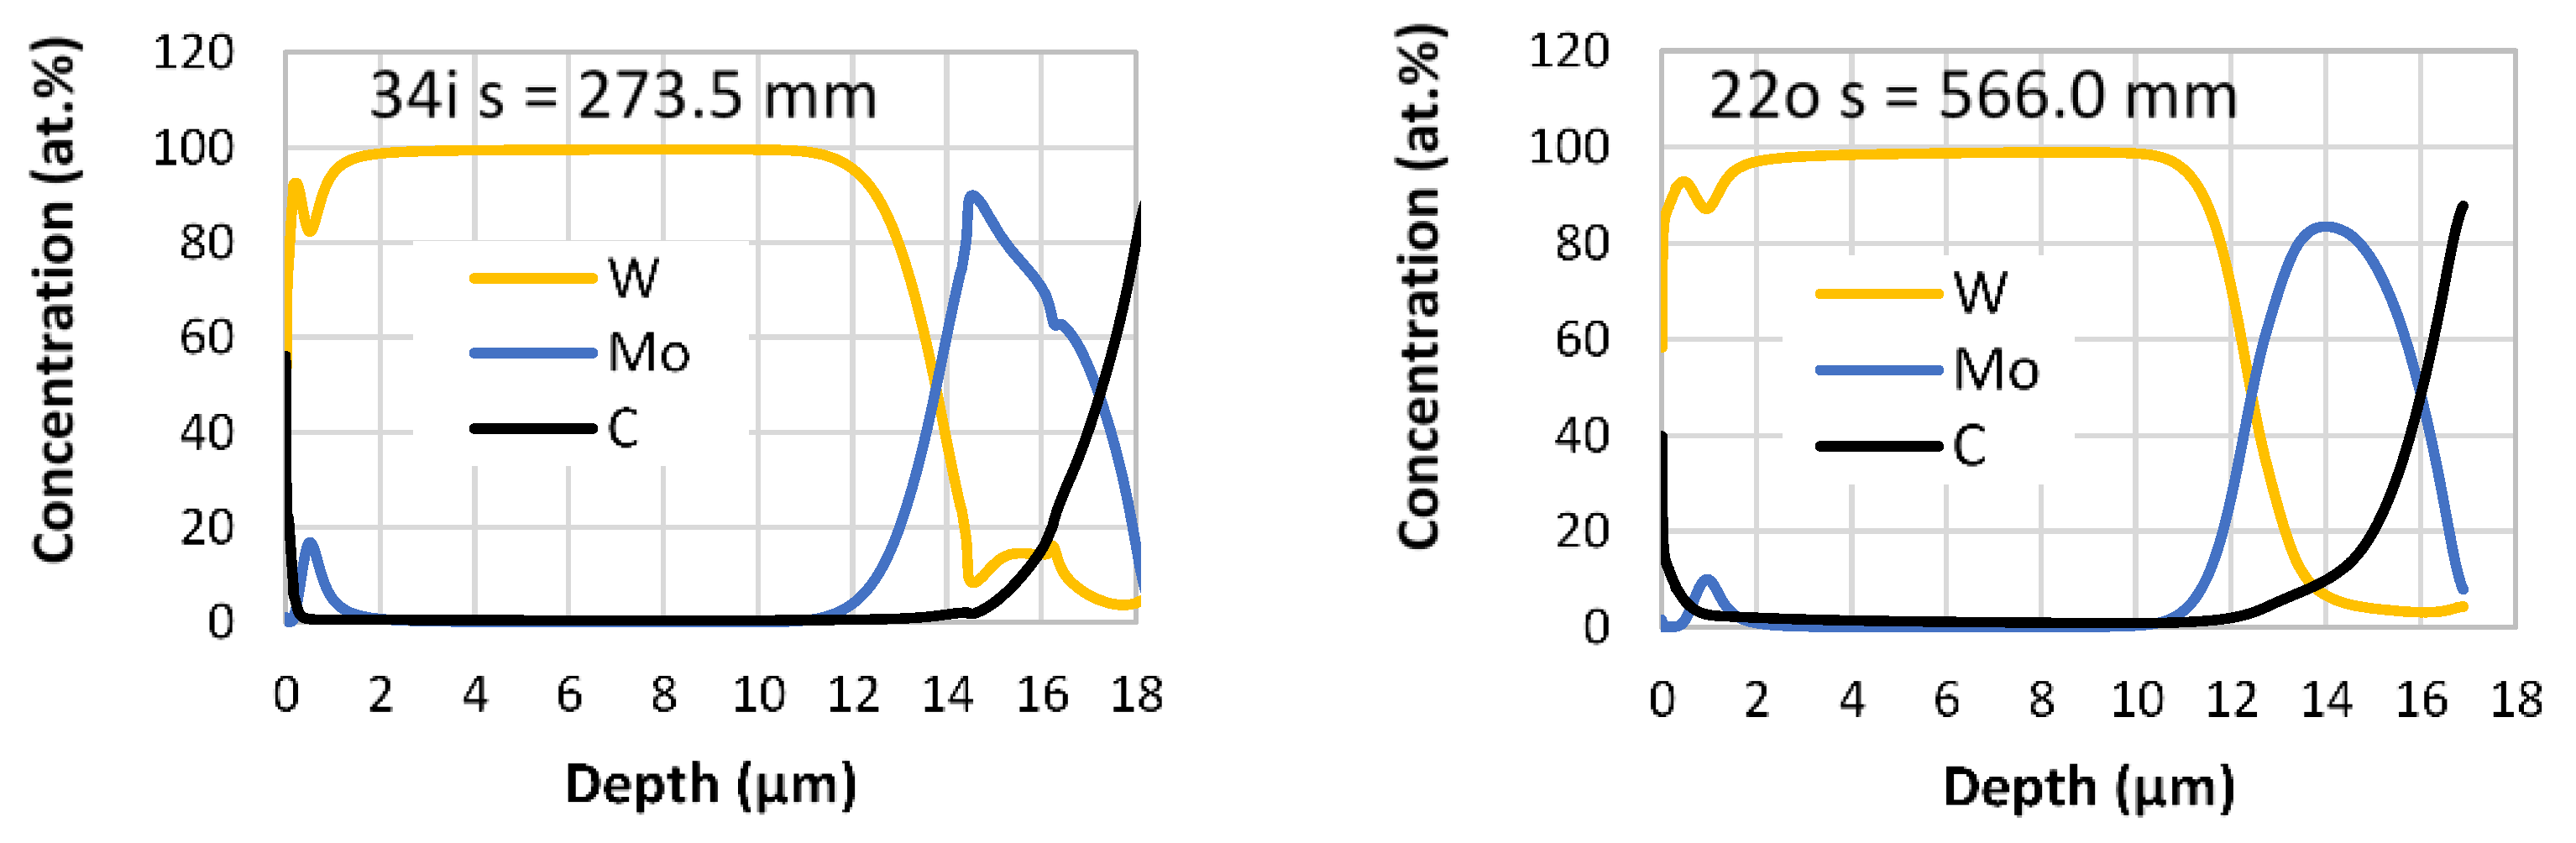
3.1. GDOES Depth Profiles
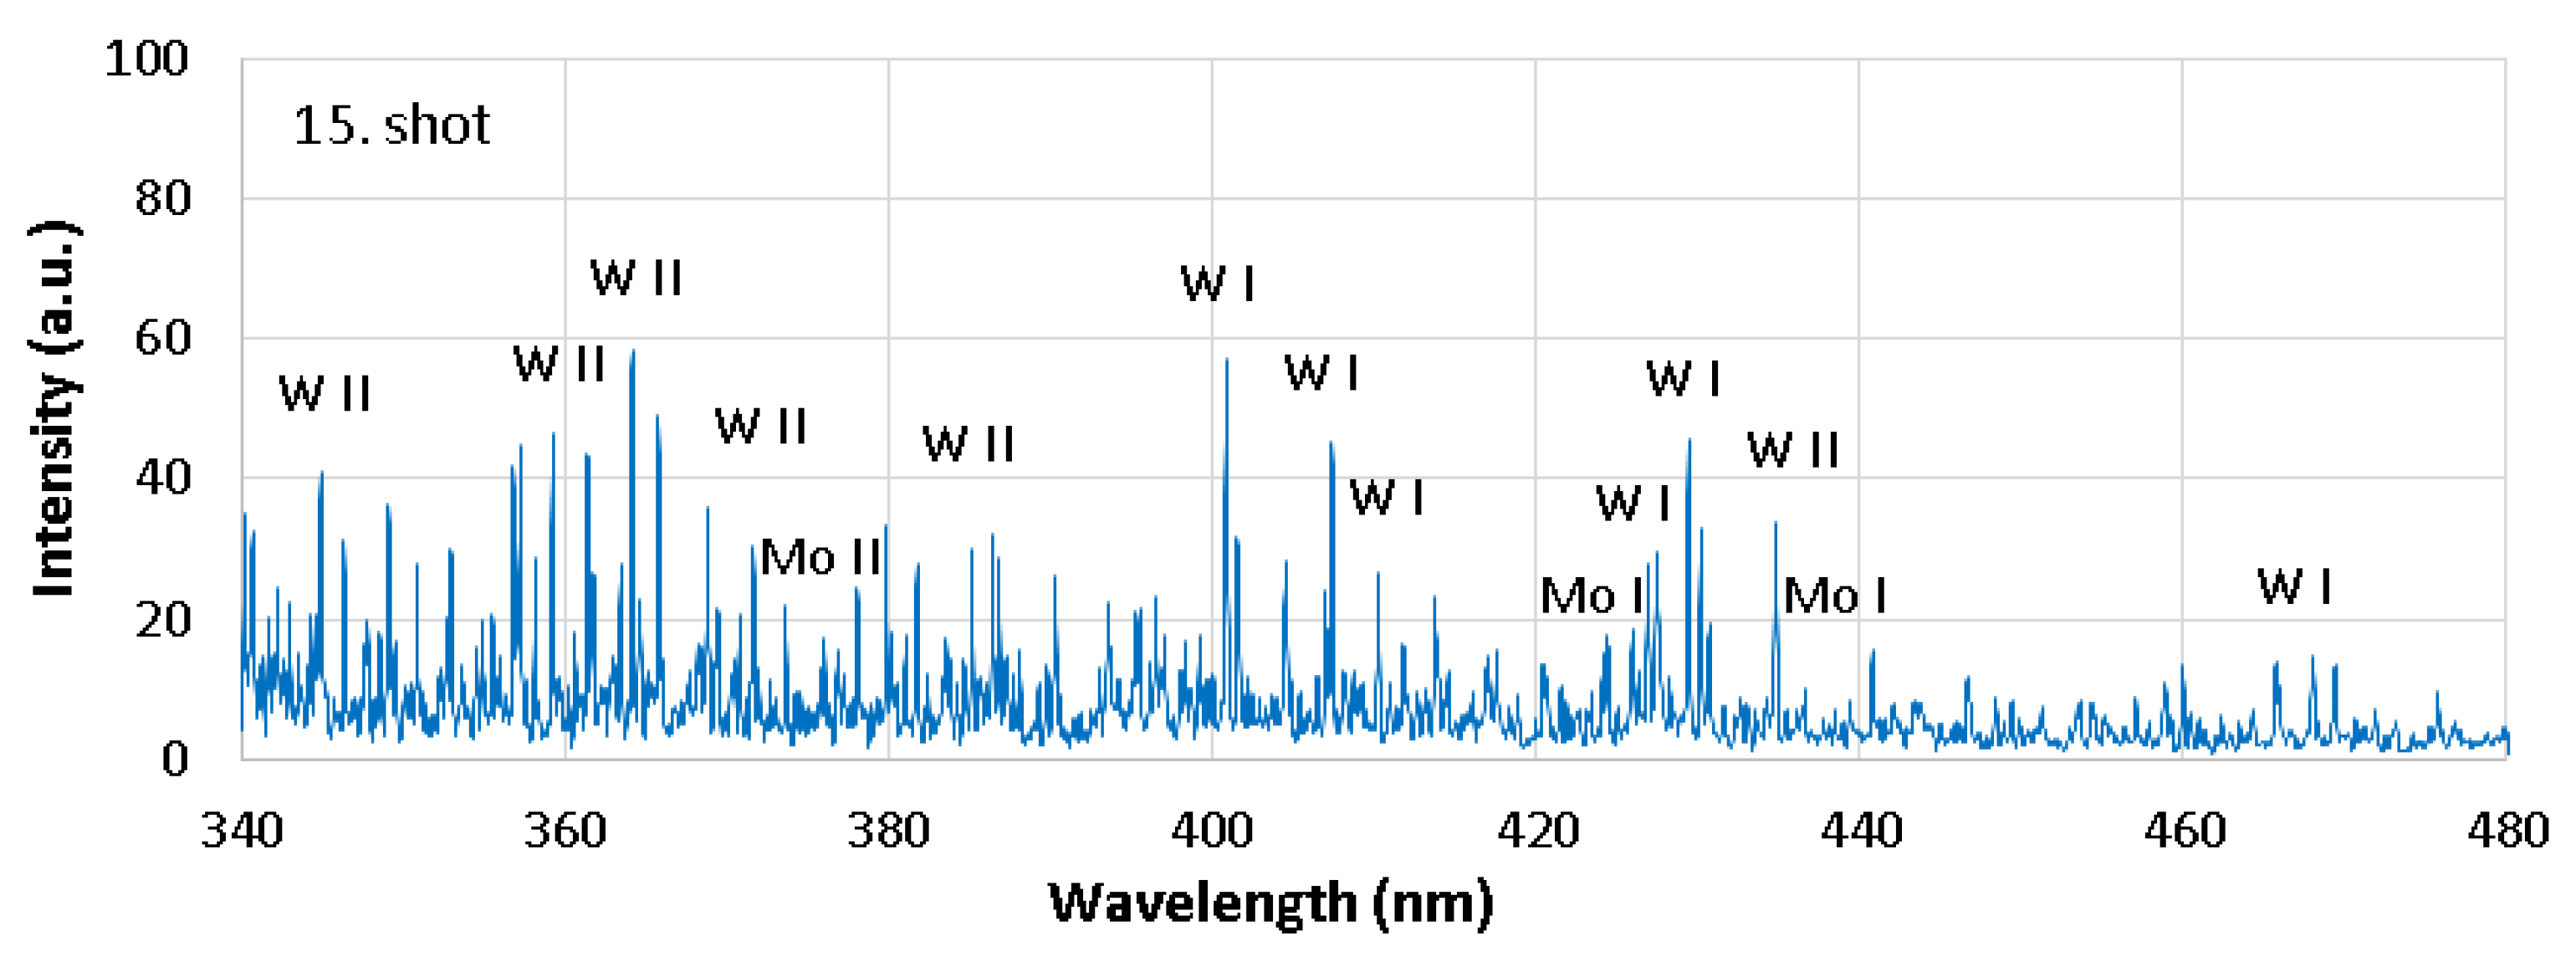
The GDOES depth profiles of W, Mo and C are shown in Figure 3 for tile 34i at s = 273.5 mm and tile 22o at s = 566 mm. Both depth profiles indicate the presence of a 0.5–2 μm thick W layer, a thin Mo containing layer, a 12 μm thick W layer and a 3–4 μm thick Mo layer on a C substrate. The increased Mo signal at the depth between 0.5 and 2 μm corresponds to the Mo marker layer, which is thinner than the roughness of the underlying 12 μm thick standard W layer. According to SEM studies, the roughness was approximately 2 μm while the Mo marker layer was only 100–200 nm thick [25]. Therefore, the depth profile of the Mo marker layer is smeared out and the concentration of Mo does not reach 100 at. %. The thicknesses of other layers are consistent with the SEM results [25]. The surface of the sample from the 34i tile at s = 273.5 mm also contained up to 17 at. % boron (B) in the depth of 50–100 nm. In the second sample from the outer tile at s = 566 mm, B was practically missing.
SIMS depth profiles in Figure 4 show the distribution of elements (W, Mo, C, B, H, D) in the topmost 1500 nm layer of the samples. The depth profile of Mo interlayer determined by SIMS and GDOES was similar to the Mo signal from the Mo interlayer, reaching a peak at a depth between 1000 and 1500 nm. An additional thin layer containing higher amounts of C, B, D and H was formed on the surface of the topmost W coating as a result of plasma exposure [25]. The thickness of the deposit layer depended on the sample position on marker tiles. In the case of inner tile #34i, the thickness was about 40 nm for s = 32.5 mm, 50 nm for s = 273.5 mm and 30–40 nm for s = 312 mm. The layer was practically missing on the outer tile #22o, consistent with the GDOES results. The highest amount of B was found at positions 273.5 mm and 312 mm, while C concentration was highest at 32.5 mm. Mo is also present in the re-deposits. The thickness of the deposit layer slightly decreased towards the edge of the inner tile at high s values (312 mm), consistent with the results of the preceding ion beam analysis [25]. Nevertheless, the difference remained relatively small, and justifies the comparison of LIBS results with the results of GDOES and SIMS at adjacent positions.

3.2. LIBS Spectra

An example of the LIBS spectrum registered by Andor Mechelle spectrometer and corresponding to the 15th laser shot is shown in Figure 5 in the wavelength range of 340–480 nm. According to LIBS depth profiles shown in Figure 6, the 15th laser shot corresponds to a thickness of approximately 1.5–2 μm and ablated material both from the Mo marker layer and surrounding W layers. As a result, the spectra contained numerous W I, W II, Mo I and Mo II lines. The relative intensity of the W I and W II lines depended on the Ar pressure and recording delay time, W II being higher at lower pressure and shorter delay time. W I and W II lines used in subsequent analyses are shown in Table 1. The average values of the intensities of these lines were used in the construction of W depth profiles shown in Figure 5. The Mo lines were relatively weak and usually not clearly distinguishable from the W lines. The Mo I line at 550.65 nm was one exception, and this line was subsequently used for the reconstruction of Mo depth profile. The well-known strong C I line at 247.86 nm was practically at the noise level at both applied pressures, and its intensity could not be detected from single LIBS spectra. At lower pressures, two C II lines at 657.81 and 658.29 nm were clearly distinguishable. The intensities of these lines were therefore used for the construction of the C depth profile. The emission lines of several trace elements were also detectable, usually during the first few laser shots, and these lines are described later in the text.

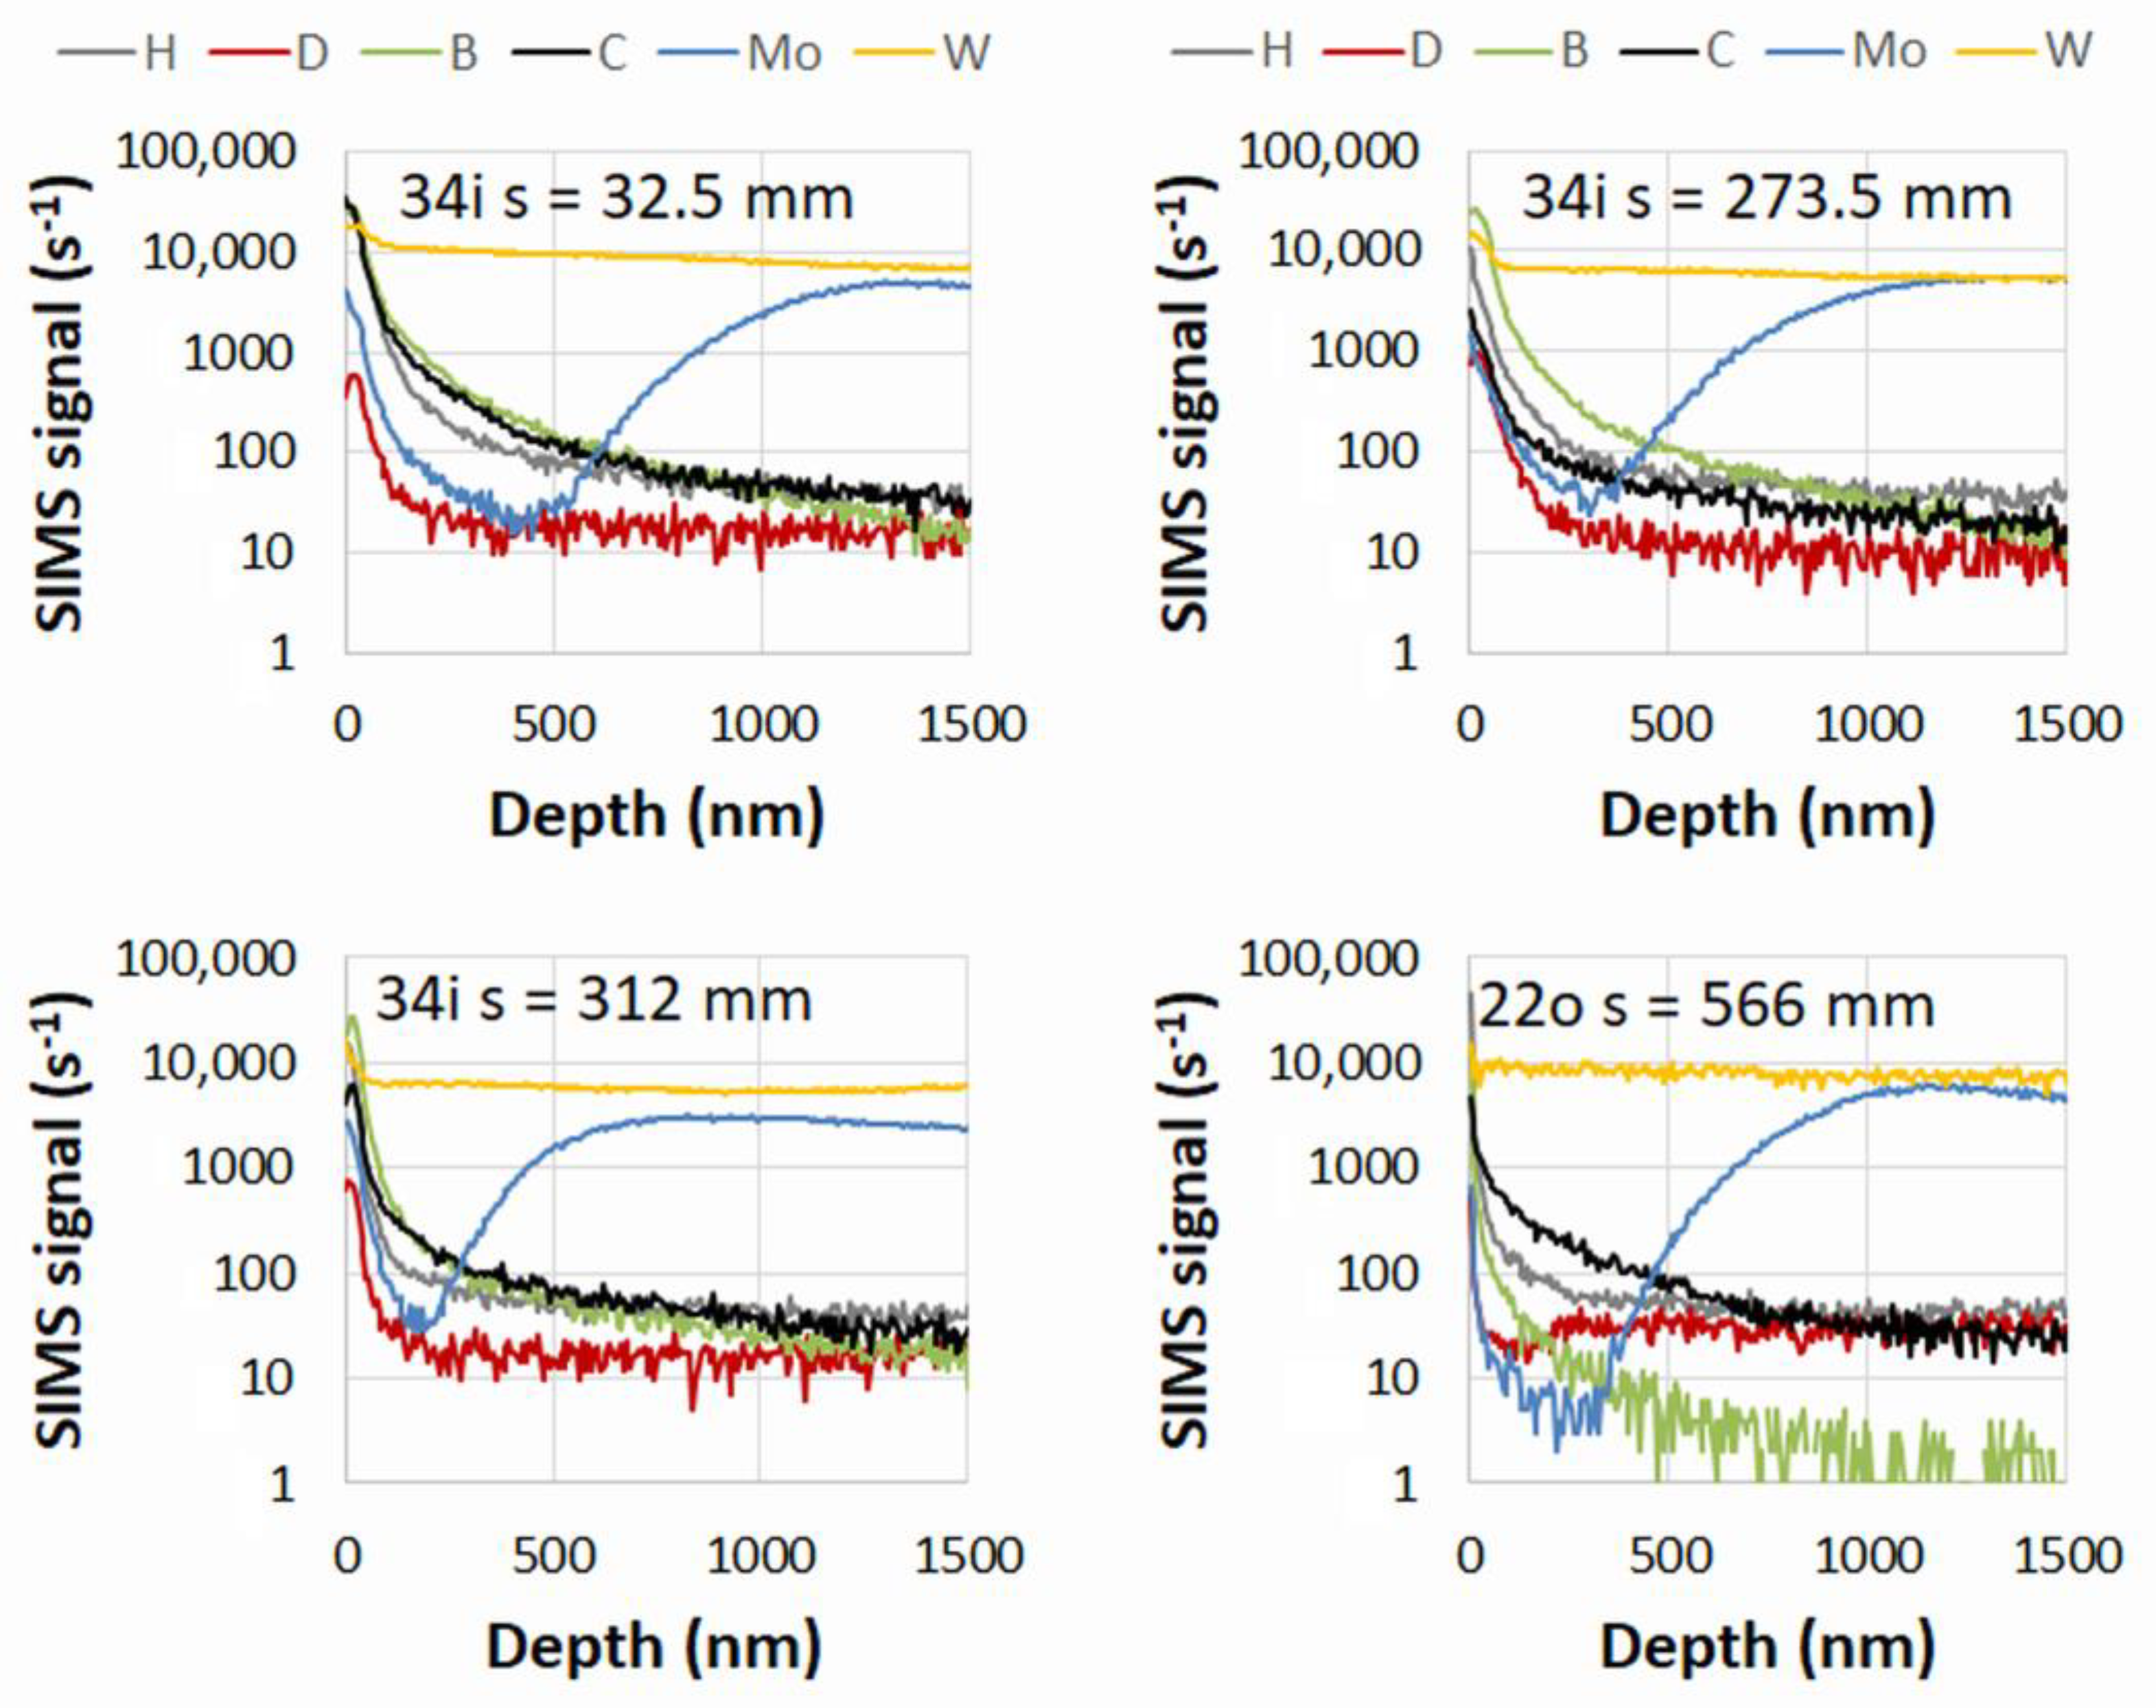
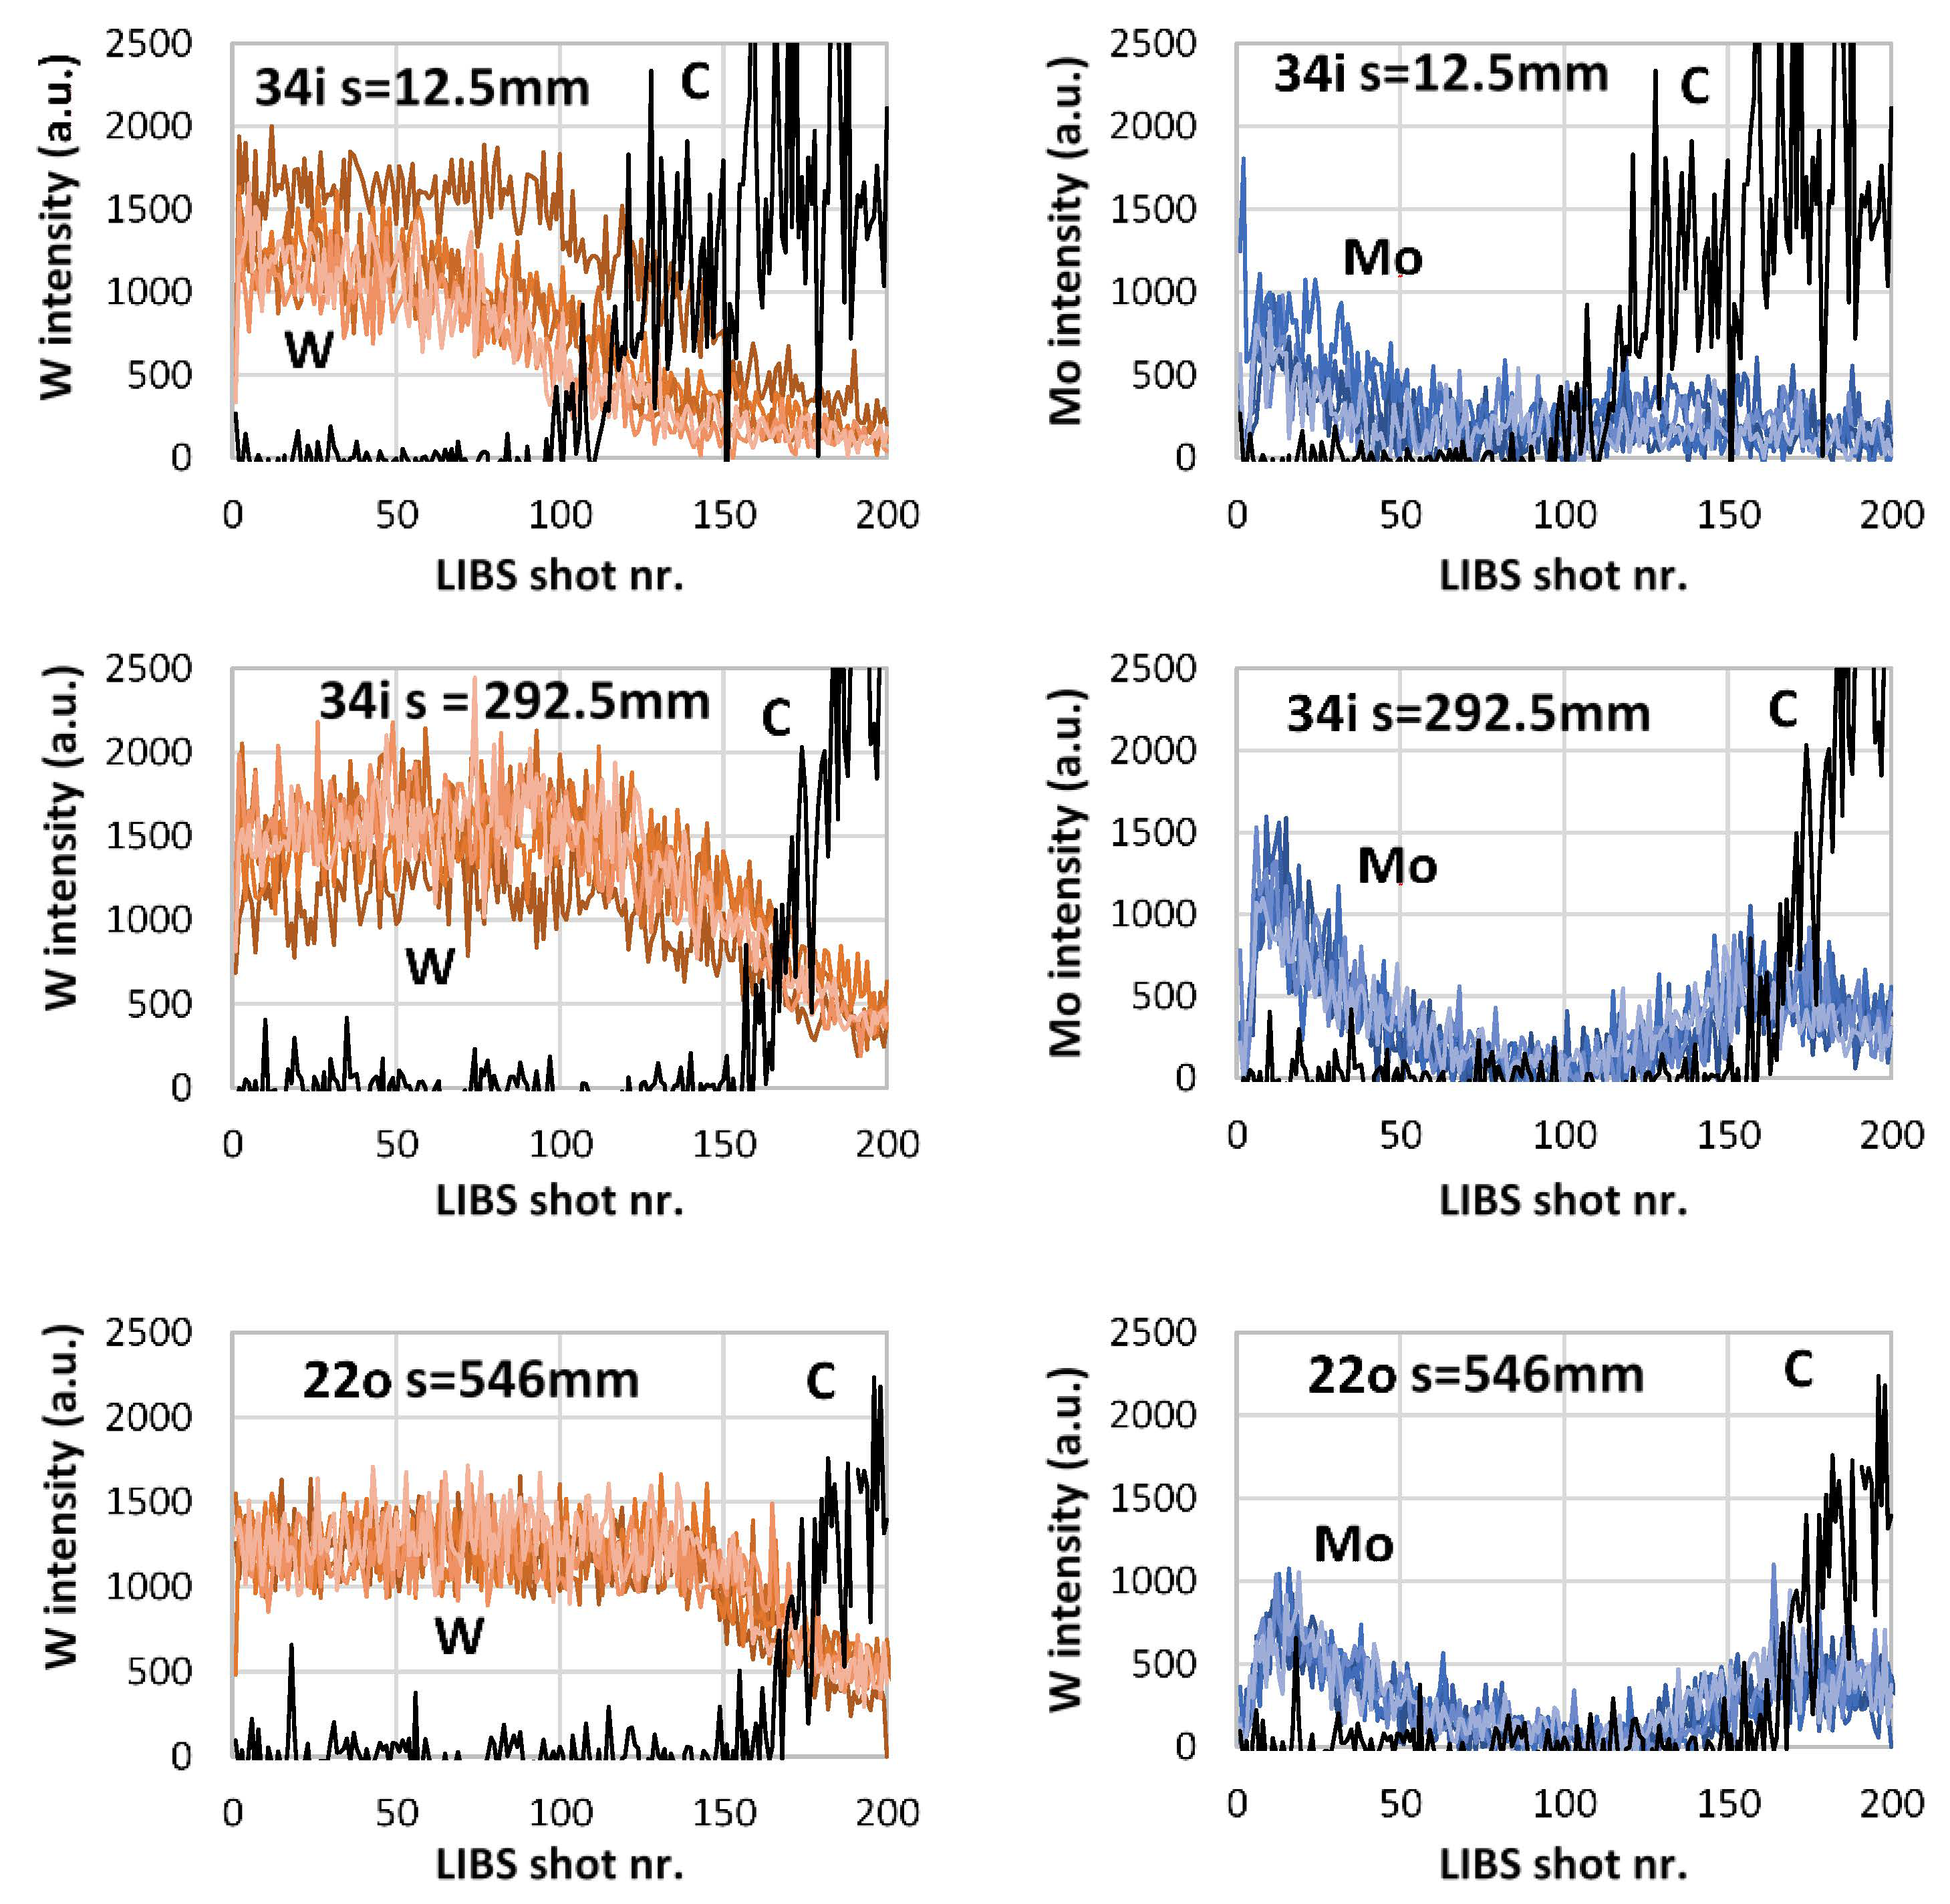
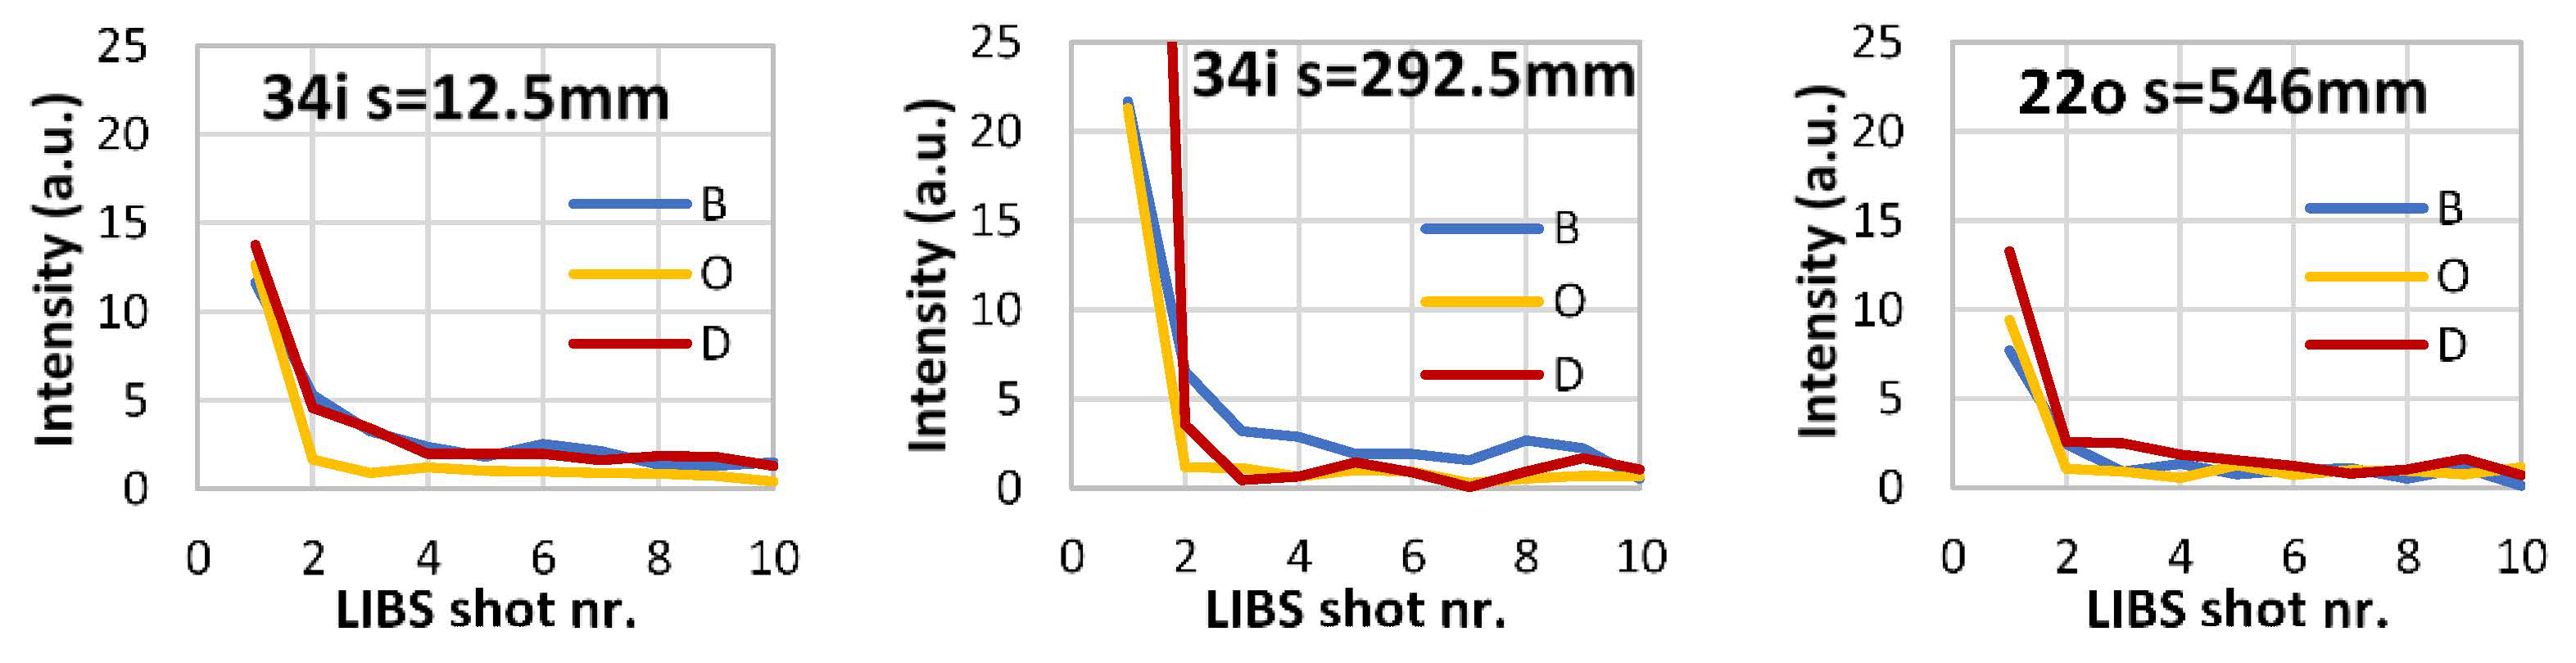
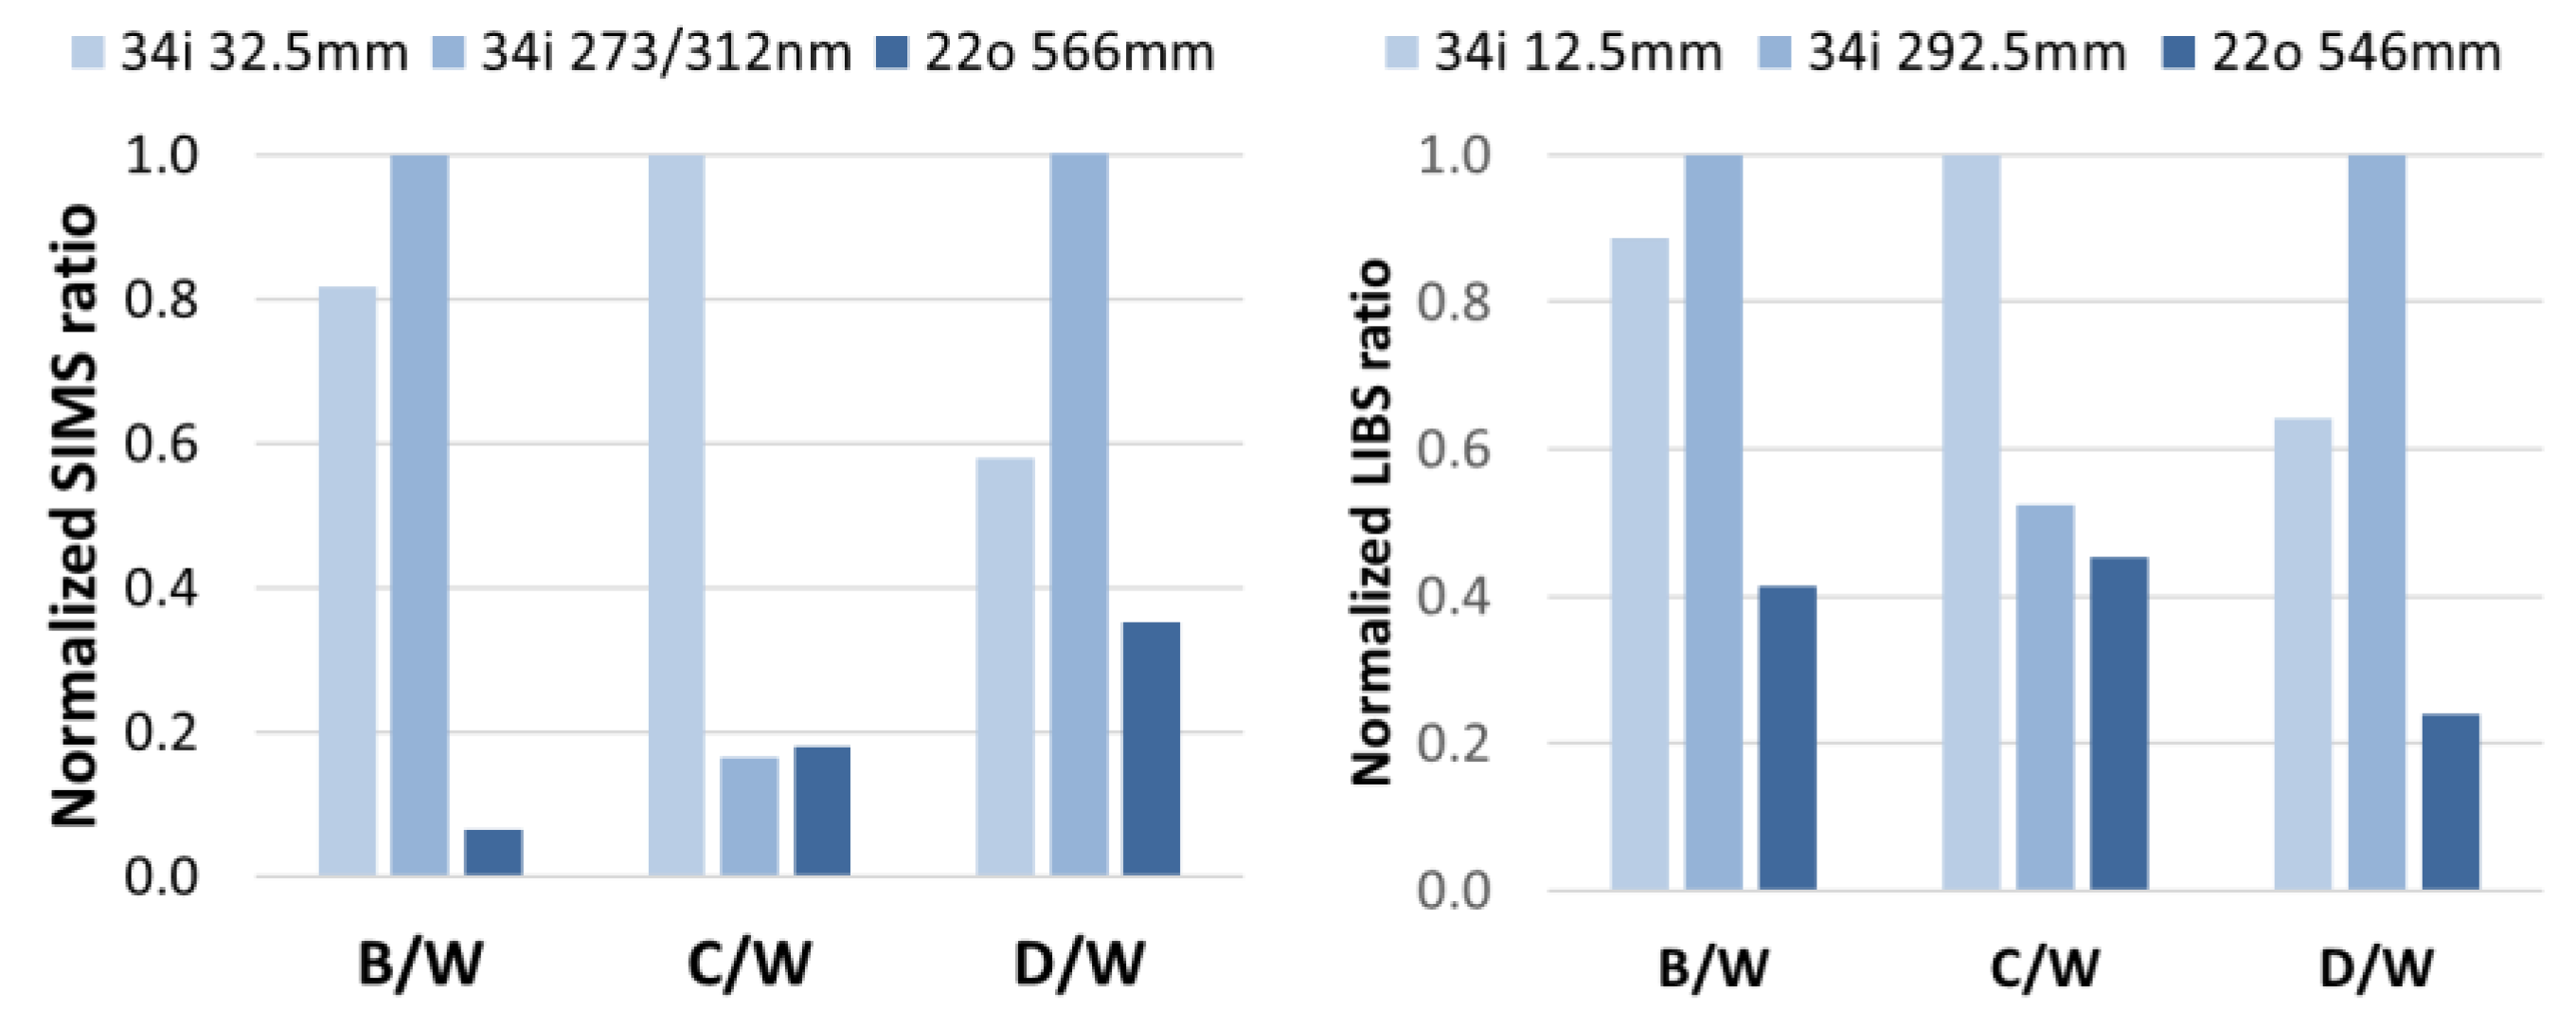
3.3. LIBS Depth Profiles

The depth profiles constructed from the selected W, Mo and C lines are shown in Figure 6. Depth profiles from five different spots are shown for each sample. The W intensity was nearly constant from shot 1 to 50 in the case of 34i s = 12.5 mm, shot 1 to 120 in the case of 34i s = 292.5 mm and shot 1 to 140 in the case of 22o s = 546 mm. At higher LIBS shot numbers, W intensity slowly decreased to zero. Mo intensity exhibited two peaks in the depth profiles. A first Mo peak started to appear at the LIBS shots 3-5 and reached maximum at 10 to 15 shots, depending on the sample s coordinate. Subsequently, the Mo intensity slowly decreased. A second Mo intensity peak appeared at approximately 100 or 120 shots and reached maximum at 120 shots or 160 shots for 34i s = 12.5 mm and other samples, respectively. At even higher LIBS shot numbers, Mo intensity slowly decreased. The appearance of the second Mo peak coincided with a reduction in the W intensity. C intensity started to grow at the shot numbers where the second Mo peak reached its maximum.
The depth profiles of W, Mo and C were consistent with the expected W and Mo layers in marker tiles, as shown in Figure 1, and experimentally determined GDOES depth profiles. The first Mo peak, starting from 3–5 shots and slowly decreasing up to 70–80 shots, is attributable to the thin Mo marker layer. The Mo marker layer is much broader in the LIBS depth profile than expected from SEM images [25]. The explanation is same as with GDOES depth profiles, i.e., the roughness of the underlaying W coating surface is much larger than the thickness of the Mo marker layer. The second Mo intensity peak in the depth profile was also smeared out, and this can be attributed to the peculiarities of laser ablation during LIBS measurements. With the Gaussian energy profile of laser beam, the more energetic central part of the Gaussian profile results in a higher ablation rate in the centre of laser spot [13]. Therefore, the laser crater becomes both deeper and wider with increasing laser shot numbers, and each subsequent LIBS spectra contains information at increasing thickness range [13,32].
The average LIBS depth resolution was 100 nm/shot, and it was determined by dividing the thickness of the total coating with the number of laser shots required to reach the C substrate. We must stress that the ablation rate may vary for different sublayers and co-deposits on the surface due to the different properties of these layers. However, the determination of the ablation rate of specific layers was more complicated, because of the variation in the actual thickness of the layer (e.g., 1–2 μm for the topmost W layer), roughness of the surfaces (up to 2 μm) and variability of the number of laser shots required to reach the next layer. For underlaying layers, distinguishing between different layers becomes even more complicated due to the uneven ablation rate along the LIBS spot caused by Gaussian beam shape. Nevertheless, the ablation rate of topmost W layer can be estimated to be approximately in the range of 200–300 nm/shots.
Good repeatability of depth profiles collected from different spots of the same sample allowed the use of multi-spot averaging [33]. In the case of the sample obtained from tile 34i s = 12.5 mm, one depth profile was left out from averaging because it clearly diverged from the other four profiles. The standard deviation of the nearly constant W intensity from shots 50–100 decreased by two times when using multi-spot averaging over 5 spots of same sample. However, it must be noted that the samples used in present study originated from tile regions where the spatial variation of the composition remains small. In tile regions with strong gradients along the surface, the application of multi-spot averaging may result in loss of information.

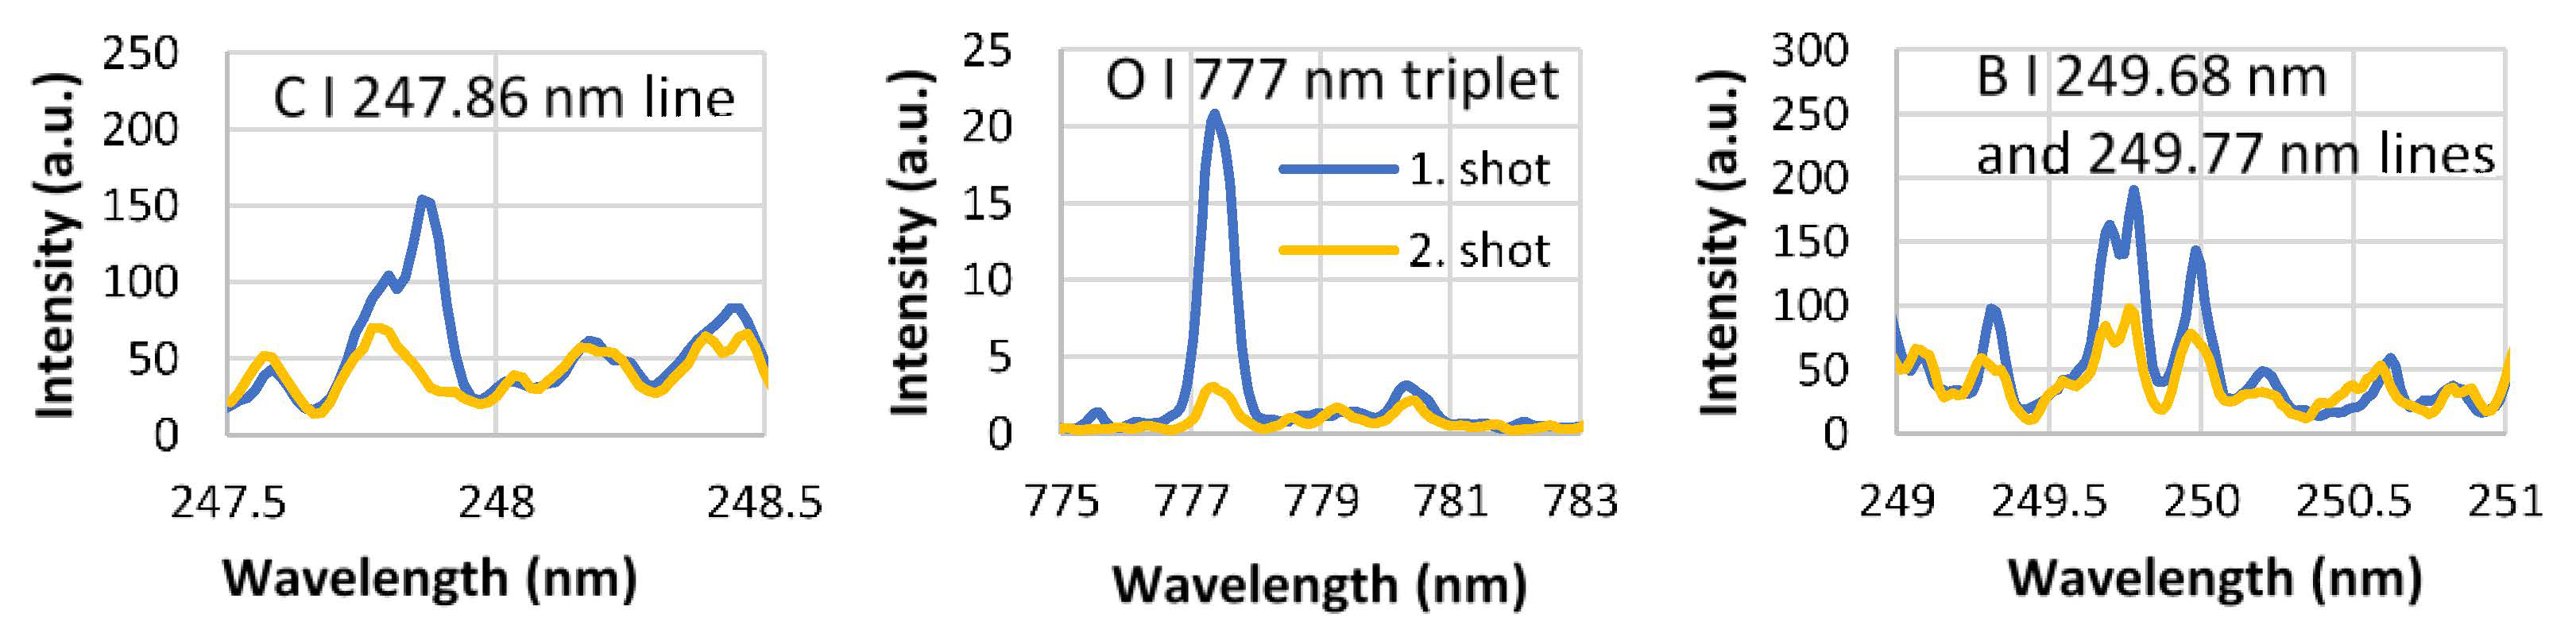
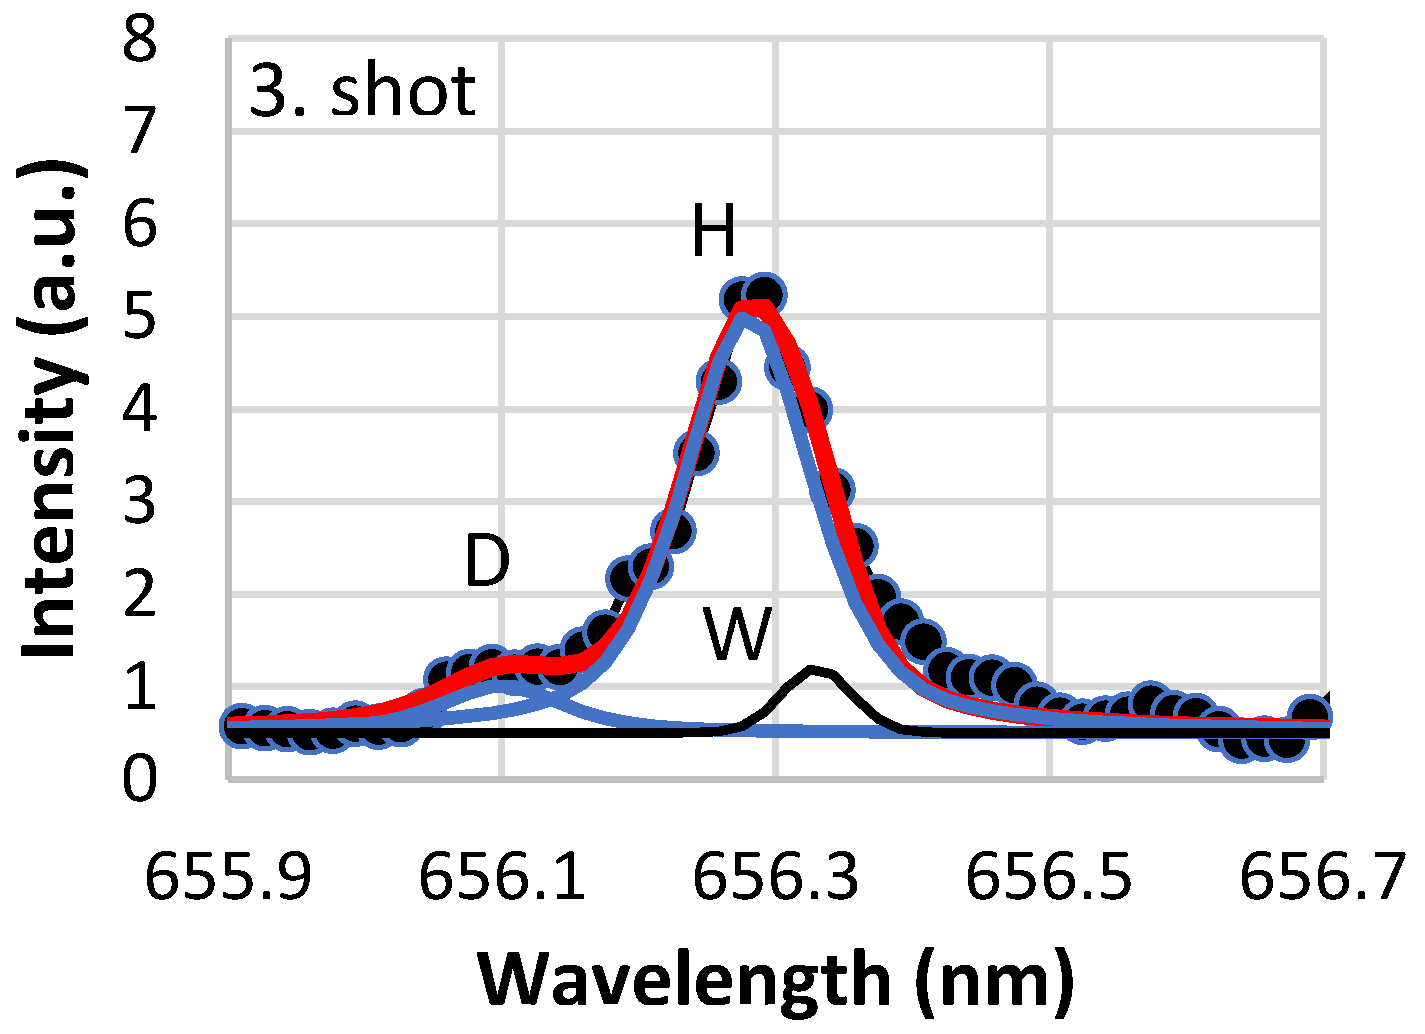
3.4. Detection of Trace Elements

The averaging of the spectra collected from multiple spots of same sample allowed us to improve the signal-to-noise ratio and investigate the presence of trace impurities such as C, B and oxygen (O) detected also by complementary methods of GDOES and SIMS. In addition, we observed spectral lines corresponding to Ca, Na, Cu, Mg and Fe during the first laser shot at a fresh LIBS spot. Some of these elements may originate from the deposition of a thin surface layer during the plasma exposure, and some from the surface contamination after plasma exposure. The averaged spectra around the C, B and O lines are shown in Figure 7 for LIBS shots 1 and 2. A strong C I 247.86 nm line was close to the W II 247.77 nm line and was clearly detectable only during the first shot. There were two clearly detectable B I lines at 249.68 nm and 249.77 nm. Both C I and B I lines were fitted by a Gaussian profile. A broad feature at 777 nm consists of an O triplet which was not separated with the spectrometer used in present study. This line was also fitted by a Gaussian profile.
The intensities of the Dα and Hα lines at 656.1 nm and 656.28 nm were determined from the spectra obtained by another spectrometer (MDR) with better spectral resolution (Figure 8). There was some overlap of the Dα and Hα lines, and there was a weak W I line at 656.32 nm which overlapped with the Hα line. The intensities of the Dα and Hα lines and the W I line were obtained from the experimental spectra by fitting Dα and Hα peaks with a pseudo-Voigt profile, while the intensity of the W I line was obtained by fitting with a Gaussian profile. The value of full width at half maximum (FWHM) of the Gaussian profile was determined by the apparatus function of the spectrometer (0.06 nm). The pseudo-Voigt profile is the sum of Gaussian and Lorentzian profiles where the FWHM value of the Gaussian profile was set to the value of the apparatus function and the FWHM value of the Lorentzian profile was the fitting parameter. The FWHM value of the Lorentzian profile was in the range of 0.25–0.45 nm for the first laser shot, and 0.08–0.11 nm for subsequent laser shots at the same LIBS spot. According to the results of fitting, the intensity of the Dα line decreased relatively quickly to noise level, while the Hα line intensity was very high during the first shot and then decreased to a constant level. The intensity of the Hα line remained clearly visible in spectra (Figure 8) and remained at least an order of magnitude higher than the intensity of Dα line for all investigated samples. This contradicts the SIMS data wherein the H and D signal became comparable at a depth higher than 1000 nm (Figure 4). One possible explanation for this discrepancy is the influence of the surrounding moisture.
In the investigated tile regions with negligible erosion and deposition, the impurities (B, O, C) and fuel D were clearly detectable during the first laser shot, while the signal decreased to noise level after a few subsequent laser shots at the same spot (Figure 9). It must be noted that C could also originate from previous LIBS measurements where some of C could redeposit on the sample surface, and carbon is therefore not shown in the graphs. The intensities of B and D were above noise level during the first 2–3 LIBS shots. This is consistent with the SIMS depth profiles in Figure 4 which show the co-deposition of a thin surface layer with higher D and B concentration. Both SIMS and GDOES showed considerably higher amounts of B at s = 273.5 mm of tile 34i, and much lower B concentration on the tile 22o at s = 566 mm. LIBS spectra determined at the adjacent position of the same sample (s = 546 mm) also showed the lowest B concentration, but the difference between other samples was less pronounced. This can be at least partially attributed to relatively high ablation rate of LIBS which was approximately 200–300 nm for the surface layer, while B concentration peaked in a 10–20 nm thick surface layer according to SIMS measurements. According to SIMS measurements, D intensity was highest in the tile #34i at s = 273.5 mm, which is consistent with the highest D signal determined by LIBS for the same tile at s = 292.5 mm. The O peak was clearly detectable only during the first LIBS shot, which suggests its origin from water adsorbed on the surface. This is consistent with the observation that the H line was also higher during the first shot.
Figure 10 compares the SIMS and LIBS signal ratios for B/W, C/W and D/W where the signal for elements was integrated over top layer of the depth profile. In the case of SIMS, the signal of each element was integrated over the first 1000 nm up to the Mo marker layer. The ratio was then calculated by dividing the integral of B, C or D with the integral of W. The ratios for samples at the tile positions s = 273 mm and 312 mm were averaged because these samples were on opposite sides of the LIBS sample at s = 292.5 mm. The LIBS line intensities were summed over the first 4 laser shots because the signal from the Mo marker layer started to increase at 4-5 laser shots. Neither the SIMS nor LIBS signals were calibrated to actual elemental compositions and the intensities of specific LIBS spectral lines are not directly comparable with the SIMS signals of the elements. Therefore, both SIMS and LIBS ratios were normalized for semi-quantitative comparison of the two methods. For normalization, the elemental ratios (for example B/W) of the samples were divided by the highest ratio of the same elements among the samples.
Both SIMS and LIBS line ratios corresponding to different samples followed the same trends. However, the SIMS line ratios of different samples varied more than an order of magnitude, while in the case of LIBS, the variation was less pronounced. One possible reason for relatively high LIBS signal for B and C in the samples where the SIMS signal was nearly zero could be the interference from the lines of other elements (see Figure 7). Furthermore, it is possible that laser shots 2–4 ablated some additional material from the surface layer and therefore increased the intensity of B and C.

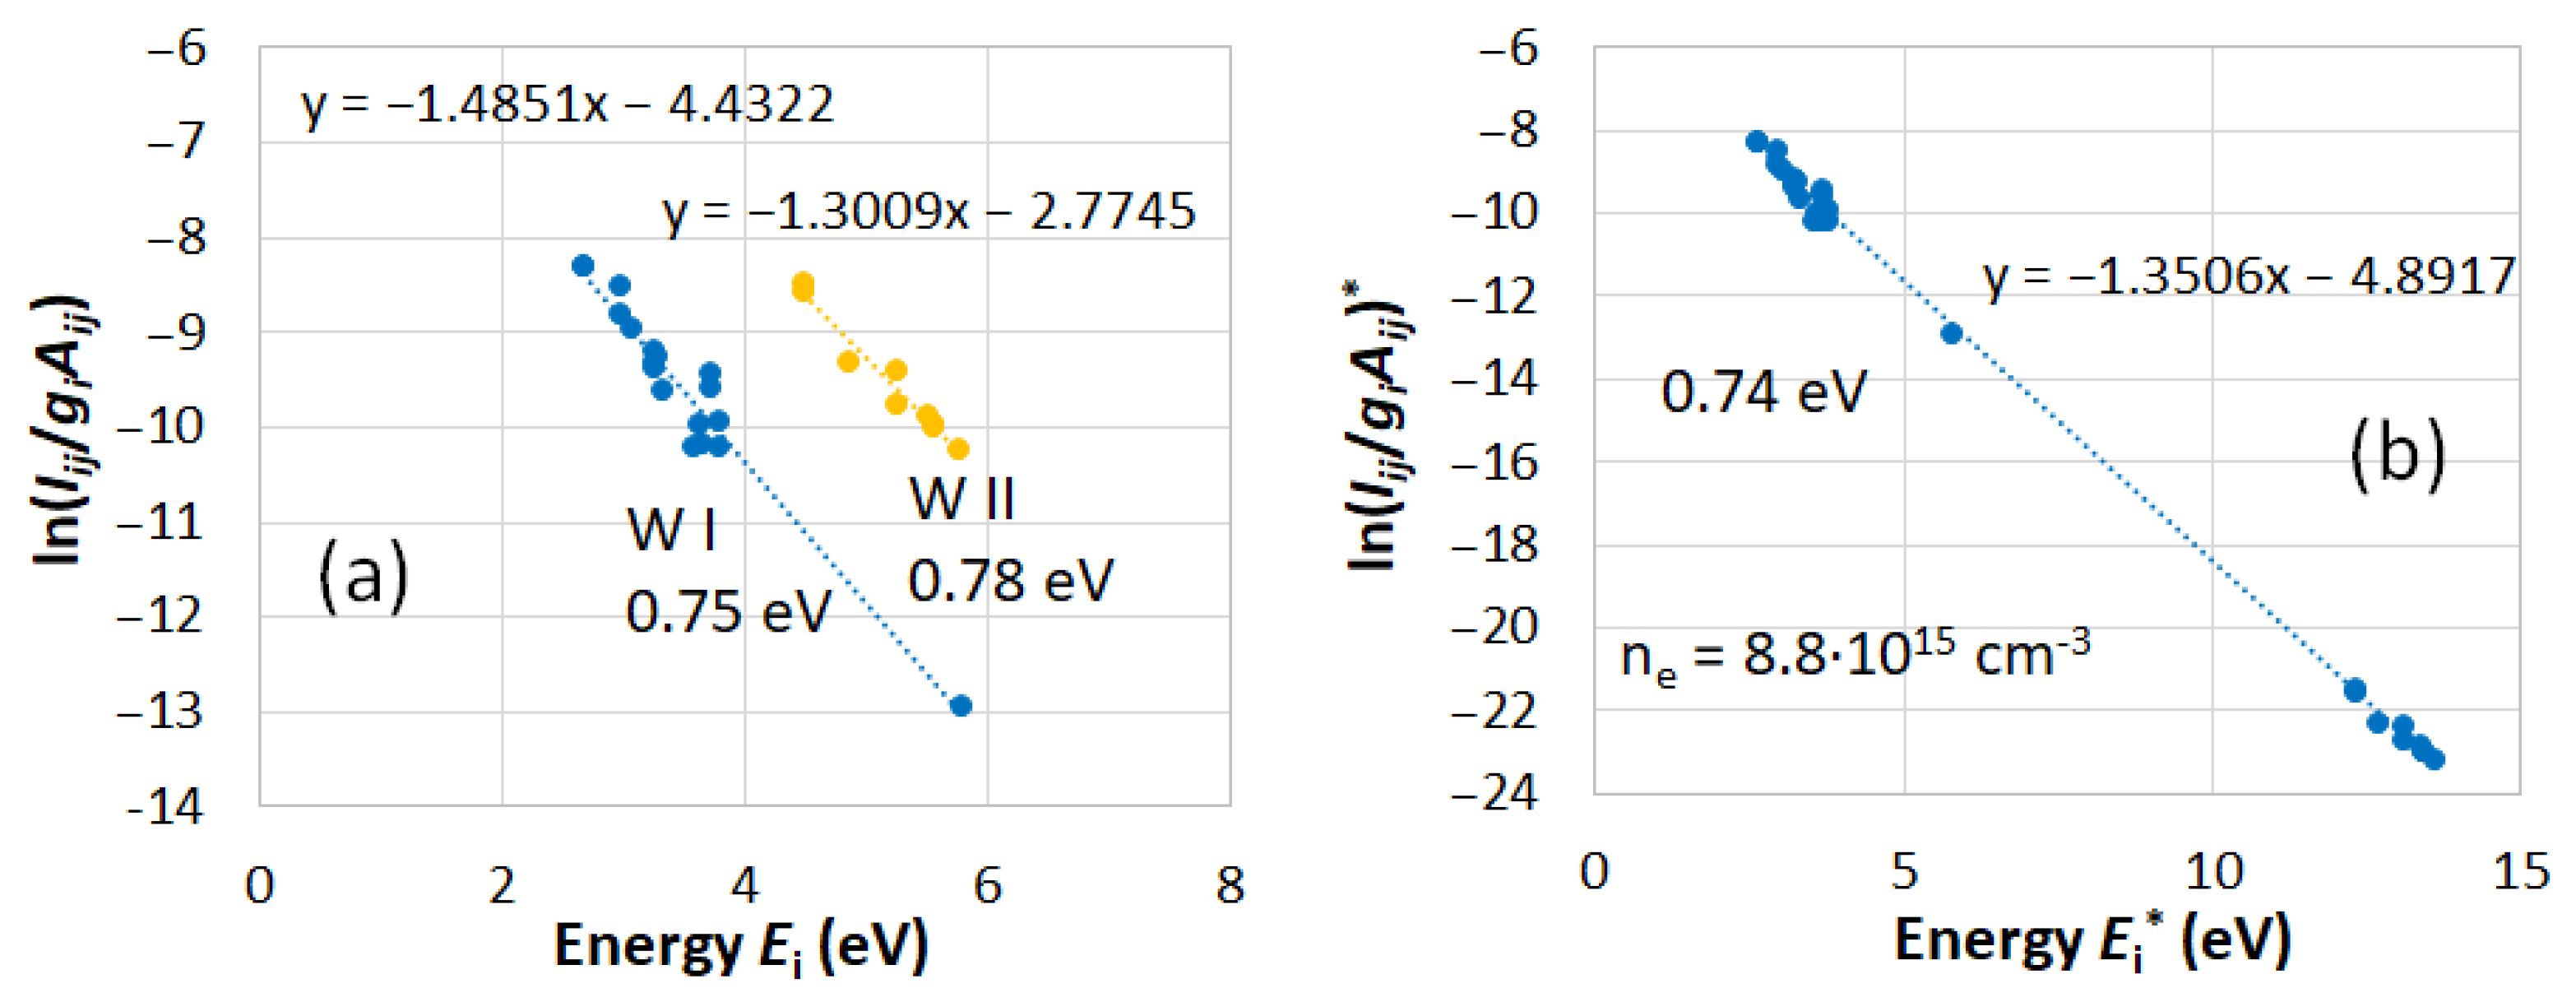
3.5. LIBS Plasma Plume Parameters

Electron density and electron temperature in the LIBS plasma plume are important parameters which determine the intensities of the emission lines in the LIBS spectra. Knowledge of these parameters is further required for calibration-free LIBS (CF-LIBS). Electron density ne was determined from the tabulated data of FWHM values of the Lorentzian profile component of the Hα line [21,31]. For each measurement spot of the sample, the average FWHM value of 2–20 first laser shots was used to determine the electron density. The FWHM values of the spectra corresponding to the first laser shot were considerably higher and were therefore omitted in the calculation. The electron temperature Te was determined from the Saha-Boltzmann plot of W lines (Figure 11b). In addition, the temperatures of W neutrals (W I) and ions (W II) were separately determined from the Boltzmann plot (Figure 11a) [30,34,35]. The lines used for the construction of the Boltzmann and Saha-Boltzmann plot were averaged over 2–100 laser shots because the intensities remained nearly constant in this range. The formulae used in the construction of Boltzmann and Saha-Boltzmann plot were the following:
E i = E i + E i o n
ln I i j / g i A i j = ln I i j / g i A i j ln 2 2 π m e 3 / 2 k B T 3 / 2 n e h 3
where E i is the excitation energy of the emitting neutral or ionized specimen, E i o n is the ionization energy, I i j is the intensity of the emission line, g i is the statistical weight A i j is the transition probability, m e is the electron mass, k B is the Boltzmann constant, h is the Planck constant and n e is the electron density. Ionization energy E i o n and the second part of the second equation were used only in the case of ions.
The values of the electron densities and electron temperatures corresponding to each sample are shown in Figure 12. Values of electron densities averaged over 5 spots of each sample varied between 6–8 × 1015 cm3, while values of electron temperatures varied from 0.72–0.74 eV. Similar plasma plume properties suggest that all samples had similar composition and mechanical properties.
The concentrations of the different elements can be calculated by CF-LIBS method when the LIBS plasma plume is in local thermodynamic equilibrium (LTE) and the lines of each element are detectable. One of the main LTE conditions is the McWhirter criterion which requires that the electron concentration in the plasma plume exceeds a certain threshold value (in the order of magnitude of 1017 cm3 for H and its isotopes and 1016 cm3 for W) [36]. In present study, the electron densities remained at least an order of magnitude lower than required for LTE condition for H isotopes. McWhirter criterion was practically fulfilled for W lines. In addition to McWhirter criterion, the thermodynamic parameters Te and ne of the transient and non-homogeneous laser plasma plume have to fulfil additional criteria to ensure LTE. The relaxation time of the emitting plasma species must remain shorter than the time constant for variation of thermodynamic parameters, and the diffusion length of ions and atoms must be shorter than the variation length of the thermodynamic parameters [36]. These characteristics were not determined in present study, but for metal atoms and ions, the relaxation times and diffusion lengths are generally much shorter than the characteristic times and variation lengths of thermodynamic parameters [31,36]., However, the characteristic time-scales of the parameters are expectedly shorter than the relaxation times for H and D atoms [31,36]. For tungsten, a small deviation from LTE could be hinted at by differences in W neutral and ion temperatures, while this difference remained within the scatter of shot to shot values.
The application of CF-LIBS method for determination of the D and W concentration ratio from the intensity ratio of the Dα line at 656.1 nm and W I line at 657.39 nm resulted in D/W ratio values of 0.2–0.35 during the LIBS shots, excluding the first laser shot. The first LIBS shot was omitted because the W I line at 657.39 nm was nearly missing in the spectra. The value of the D/W ratio is clearly higher than the expected value and shows that the measurement conditions were not suitable for achieving LTE conditions for H and D atoms and thus not suitable for the application of CF-LIBS method. Additional experiments must be carried out in the future to find more suitable conditions for CF-LIBS. One option is to carry out measurements at higher gas pressures where the electron density is known to increase. At higher pressures, the distinguishing of hydrogen isotopes will require longer delay times, and at comparable line widths the line intensities will be lower [37]. This limitation could be mitigated by using multi-spectral averaging with a larger number of LIBS spots, or improving the spectral collection efficiency [4]. In addition, it is possible to increase the laser energy [38] even though it may reduce the depth resolution.

4. Summary and Conclusions

The LIBS depth profiles of the main coating components W, Mo and C, were consistent with GDOES depth profiles.
The averaging of the spectra collected from multiple spots of the same sample allowed the improvement of the signal-to-noise ratio and the investigation of the presence of trace impurities such as D, O and B. However, the application of multi-spot averaging may result in loss of information in tile regions with strong gradients along the surface. For ex situ studies of the composition analysis of WEST tiles after C3 and C4 campaigns carried out under the EUROfusion work-package PWIE, other more local and sensitive techniques can complement the LIBS findings.
In the investigated tile regions with negligible erosion and deposition, these impurities were clearly detectable during the first laser shot, while the signal decreased to noise level after a few subsequent laser shots at the same spot.
The average LIBS depth resolution determined from the LIBS and GDOES depth profiles was 100 nm/shot, while the depth resolution for the upper W layer was in the range of 200–300 nm/shot. The depth resolution was sufficient for distinguishing different W and Mo layers, while the thickness of the deposit layers containing high concentrations of fuel D and impurities B and O remained below the depth resolution achieved in the present study. It may still be sufficient for the determination of the total fuel concentration in the layers.
LIBS investigation of samples originating from the regions of tiles with thick deposits may further clarify LIBS’ ability to investigate trace impurities.

Author Contributions

Conceptualization, E.T. and A.H.; methodology, P.P.; formal analysis, I.J., P.P., A.H. and E.G.; investigation, P.P., E.B., M.D., A.H., J.L., E.G. and EUROfusion WP PFC/PWIE Contributors; resources, E.B., M.D., T.V. and the WEST Team; writing—original draft preparation, I.J.; writing—review and editing, I.J., P.P., E.B., M.D., E.T., A.H., J.L., T.V. and E.G.; project administration, E.T. and A.H. All authors have read and agreed to the published version of the manuscript.

Funding

This work has been carried out within the framework of the EUROfusion Consortium, funded by the European Union via the Euratom Research and Training Programme (Grant Agreement No 101052200—EUROfusion). Views and opinions expressed are however those of the author(s) only and do not necessarily reflect those of the European Union or the European Commission. Neither the European Union nor the European Commission can be held responsible for them.

Data Availability Statement

The data presented in this study are available on request from the corresponding author. The data are not publicly available due to the large size of the original data files.

Conflicts of Interest

The authors declare no conflict of interest.

References

  1. Girard, J.P.; Garin, P.; Taylor, N.; Uzan-Elbez, J.; Rodríguez-Rodrigo, L.; Gulden, W. ITER, safety and licensing. Fusion Eng. Des. 2007, 82, 506–510. [Google Scholar] [CrossRef]
  2. Lukacs, M.; Williams, L.G. Nuclear safety issues for fusion power plants. Fusion Eng. Des. 2020, 150, 111377. [Google Scholar] [CrossRef]
  3. Malaquias, A.; Philipps, V.; Huber, A.; Hakola, A.; Likonen, J.; Kolehmainen, J.; Tervakangas, S.; Aints, M.; Paris, P.; Laan, M.; et al. Development of ITER relevant laser techniques for deposited layer characterisation and tritium inventory. J. Nucl. Mater. 2013, 438, S936–S939. [Google Scholar] [CrossRef]
  4. Van Der Meiden, H.J.; Almaviva, S.; Butikova, J.; Dwivedi, V.; Gasior, P.; Gromelski, W.; Hakola, A.; Jiang, X.; Jõgi, I.; Karhunen, J.; et al. Monitoring of tritium and impurities in the first wall of fusion devices using a LIBS based diagnostic. Nucl. Fusion 2021, 61, 125001. [Google Scholar] [CrossRef]
  5. Semerok, A.; Grisolia, C. LIBS for tokamak plasma facing components characterisation: Perspectives on in situ tritium cartography. Nucl. Instrum. Methods Phys. Res. Sect. A Accel. Spectrometers Detect. Assoc. Equip. 2013, 720, 31–35. [Google Scholar] [CrossRef]
  6. Semerok, A.; L’Hermite, D.; Weulersse, J.-M.; Lacour, J.-L.; Cheymol, G.; Kempenaars, M.; Bekris, N.; Grisolia, C. Laser induced breakdown spectroscopy application in joint European torus. Spectrochim. Acta Part B 2016, 123, 121–128. [Google Scholar] [CrossRef] [Green Version]
  7. Liu, P.; Zhao, D.Y.; Sun, L.Y.; Fu, C.L.; Liu, J.M.; Li, C.; Hai, R.; Sang, C.F.; Hu, Z.H.; Sun, Z.; et al. In situ diagnosis of Li-wall conditioning and H/D co-deposition on the first wall of EAST using laser-induced breakdown spectroscopy. Plasma Phys. Control. Fusion 2018, 60, 085019. [Google Scholar] [CrossRef]
  8. Imran, M.; Hai, R.; Sun, L.Y.; Sattar, H.; He, Z.L.; Wu, D.; Li, C.; Wang, W.J.; Hu, Z.H.; Luo, G.N.; et al. Characterization of multi-element impurity deposited on EAST divertor tile using laser-induced breakdown spectroscopy. J. Nucl. Mater. 2019, 526, 151775. [Google Scholar] [CrossRef]
  9. Oelmann, J.; Hu, Z.; Li, C.; Sun, L.; Liu, J.; Ding, F.; Wang, L.; Brezinsek, S.; Ding, R.; Ding, H.; et al. Analyses of deuterium retention in tungsten and graphite first wall materials by laser-induced ablation spectroscopy on EAST. Fusion Eng. Des. 2021, 162, 112108. [Google Scholar] [CrossRef]
  10. Li, C.; Zhao, D.; Hu, Z.; Wu, X.; Luo, G.N.; Hu, J.; Ding, H. Characterization of deuterium retention and co-deposition of fuel with lithium on the divertor tile of EAST using laser induced breakdown spectroscopy. J. Nucl. Mater. 2015, 463, 915–918. [Google Scholar] [CrossRef]
  11. Li, C.; Sun, L.; Hu, Z.; Zhao, D.; Liu, J.; Gierse, N.; Nicolai, D.; Wu, D.; Hai, R.; Ding, F.; et al. An in situ diagnostic method for monitoring of fuel retention on the first wall under long-pulse operation of experimental advanced superconducting tokamak. Phys. Scr. 2020, 2020, 014069. [Google Scholar] [CrossRef]
  12. Zhao, D.; Li, C.; Hu, Z.; Feng, C.; Xiao, Q.; Hai, R.; Liu, P.; Sun, L.; Wu, D.; Fu, C.; et al. Remote in situ laser-induced breakdown spectroscopic approach for diagnostics of the plasma facing components on experimental advanced superconducting tokamak. Rev. Sci. Instrum. 2018, 89, 073501. [Google Scholar] [CrossRef] [PubMed]
  13. Karhunen, J.; Hakola, A.; Likonen, J.; Lissovski, A.; Laan, M.; Paris, P. Applicability of LIBS for in situ monitoring of deposition and retention on the ITER-like wall of JET—Comparison to SIMS. J. Nucl. Mater. 2015, 463, 931–935. [Google Scholar] [CrossRef]
  14. Paris, P.; Piip, K.; Hakola, A.; Laan, M.; Aints, M.; Koivuranta, S.; Likonen, J.; Lissovski, A.; Mayer, M.; Neu, R.; et al. Development of laser induced breakdown spectroscopy for studying erosion, deposition, and fuel retention in ASDEX Upgrade. Fusion Eng. Des. 2015, 98–99, 1349–1352. [Google Scholar] [CrossRef] [Green Version]
  15. Xiao, Q.; Hai, R.; Ding, H.; Huber, A.; Philipps, V.; Gierse, N.; Sergienko, G. In-situ analysis of the first wall by laser-induced breakdown spectroscopy in the TEXTOR tokamak: Dependence on the magnetic field strength. J. Nucl. Mater. 2015, 463, 911–914. [Google Scholar] [CrossRef]
  16. Sun, L.; Wu, D.; Li, C.; Zhao, D.; Wu, J.; Hong, S.H.; Bang, E.; Hu, Z.; Ding, H. Ex-situ diagnosis of deuterium retention and carbon deposition on shaped tungsten castellated blocks exposed in KSTAR by laser-induced breakdown spectroscopy. Fusion Eng. Des. 2021, 173, 112811. [Google Scholar] [CrossRef]
  17. Veis, P.; Atikkuke, S.; Marin Roldan, A.; Dwivedi, V.; Veis, M.; Barton, P.; Jerab, M.; Dejarnac, R. LIBS analysis of samples from the COMPASS vacuum chamber after liquid metal experiments—Li campaign. Nucl. Mater. Energy 2020, 25, 100809. [Google Scholar] [CrossRef]
  18. Maurya, G.S.; Kumar, R.; Kumar, A.; Rai, A.K. Analysis of impurities on contaminated surface of the tokamak limiter using laser induced breakdown spectroscopy. Spectrochim. Acta Part B At. Spectrosc. 2016, 126, 17–22. [Google Scholar] [CrossRef]
  19. Maddaluno, G.; Almaviva, S.; Caneve, L.; Colao, F.; Lazic, V.; Laguardia, L.; Gasior, P.; Kubkowska, M. Detection by LIBS of the deuterium retained in the FTU toroidal limiter. Nucl. Mater. Energy 2019, 18, 208–211. [Google Scholar] [CrossRef]
  20. Almaviva, S.; Caneve, L.; Colao, F.; Lazic, V.; Maddaluno, G.; Mosetti, P.; Palucci, A.; Reale, A.; Gasior, P.; Gromelski, W.; et al. LIBS measurements inside the FTU vacuum vessel by using a robotic arm. Fusion Eng. Des. 2021, 169, 112638. [Google Scholar] [CrossRef]
  21. Paris, P.; Jõgi, I.; Piip, K.; Passoni, M.; Dellasega, D.; Grigore, E.; Arnoldbik, W.M.; van der Meiden, H. In-situ LIBS and NRA deuterium retention study in porous W-O and compact W coatings loaded by Magnum-PSI. Fusion Eng. Des. 2021, 168, 23–27. [Google Scholar] [CrossRef]
  22. Bucalossi, J.; Missirlian, M.; Moreau, P.; Samaille, F.; Tsitrone, E.; Van Houtte, D.; Batal, T.; Bourdelle, C.; Chantant, M.; Corre, Y.; et al. The WEST project: Testing ITER divertor high heat flux component technology in a steady state tokamak environment. Fusion Eng. Des. 2014, 89, 907–912. [Google Scholar] [CrossRef]
  23. Missirlian, M.; Bucalossi, J.; Corre, Y.; Ferlay, F.; Firdaouss, M.; Garin, P.; Grosman, A.; Guilhem, D.; Gunn, J.; Languille, P.; et al. The WEST project: Current status of the ITER-like tungsten divertor. Fusion Eng. Des. 2014, 89, 1048–1053. [Google Scholar] [CrossRef]
  24. Bucalossi, J.; Achard, J.; Agullo, O.; Alarcon, T.; Allegretti, L.; Ancher, H.; Antar, G.; Antusch, S.; Anzallo, V.; Arnas, C.; et al. Operating a full tungsten actively cooled tokamak: Overview of WEST first phase of operation. Nucl. Fusion 2022, 62, 042007. [Google Scholar] [CrossRef]
  25. Balden, M.; Mayer, M.; Bliewert, B.; Bernard, E.; Diez, M.; Firdaouss, M.; Missirlian, M.; Pégourié, B.; Richou, M.; Roche, H.; et al. Erosion and redeposition patterns on entire erosion marker tiles after exposure in the first operation phase of WEST. Phys. Scr. 2021, 96, 124020. [Google Scholar] [CrossRef]
  26. Martin, C.; Diez, M.; Campos, A.; Cabié, M.; Giacometti, G.; Balden, M.; Gallo, A.; Pegourié, B.; Bernard, E.; Tsitrone, E. First post-mortem analysis of deposits collected on ITER-like components in WEST after the C3 and C4 campaigns. Phys. Scr. 2021, 96, 124035. [Google Scholar] [CrossRef]
  27. Gaspar, J.; Corre, Y.; Rigollet, F.; Aumeunier, M.H.; Bernard, E.; Brezinsek, S.; Courtois, X.; Dejarnac, R.; Diez, M.; Dubus, L.; et al. Overview of the emissivity measurements performed in WEST: In situ and post-mortem observations. Nucl. Fusion 2022, 62, 096023. [Google Scholar] [CrossRef]
  28. Grigore, E.; Ruset, C.; Firdaouss, M.; Petersson, P.; Bogdanovic Radovic, I.; Siketic, Z. Helium depth profile measurements within tungsten coatings by using Glow Discharge Optical Emission Spectrometry (GDOES). Surf. Coat. Technol. 2019, 376, 21–24. [Google Scholar] [CrossRef]
  29. Grigore, E.; Gherendi, M.; Baiasu, F.; Firdaouss, M.; Hernandez, C.; Weckmann, A.; Petersson, P.; Hakola, A. The influence of N on the D retention within W coatings for fusion applications. Fusion Eng. Des. 2019, 146, 1959–1962. [Google Scholar] [CrossRef]
  30. Marín Roldán, A.; Pisarčík, M.; Veis, M.; Držík, M.; Veis, P. Calibration-free analysis of a tungsten-based target for diagnostics of relevant fusion materials comparing picosecond and nanosecond LIBS. Spectrochim. Acta Part B At. Spectrosc. 2021, 177, 106055. [Google Scholar] [CrossRef]
  31. Jõgi, I.; Ristkok, J.; Raud, J.; Butikova, J.; Mizohata, K.; Paris, P. Laser induced breakdown spectroscopy for hydrogen detection in molybdenum at atmospheric pressure mixtures of argon and nitrogen. Fusion Eng. Des. 2022, 179, 113131. [Google Scholar] [CrossRef]
  32. Shaw, G.; Bannister, M.; Biewer, T.M.; Martin, M.Z.; Meyer, F.; Wirth, B.D. The detection of He in tungsten following ion implantation by laser-induced breakdown spectroscopy. Appl. Surf. Sci. 2018, 427, 695–703. [Google Scholar] [CrossRef]
  33. Paris, P.; Aints, M.; Hakola, A.; Kiisk, M.; Kolehmainen, J.; Laan, M.; Likonen, J.; Ruset, C.; Sugiyama, K.; Tervakangas, S. Determination of elemental depth profiles by multi-spot averaging technique of LIBS spectra. Fusion Eng. Des. 2011, 86, 1125–1128. [Google Scholar] [CrossRef]
  34. Tognoni, E.; Cristoforetti, G.; Legnaioli, S.; Palleschi, V.; Salvetti, A.; Mueller, M.; Panne, U.; Gornushkin, I. A numerical study of expected accuracy and precision in Calibration-Free Laser-Induced Breakdown Spectroscopy in the assumption of ideal analytical plasma. Spectrochim. Acta Part B At. Spectrosc. 2007, 62, 1287–1302. [Google Scholar] [CrossRef]
  35. Aragón, C.; Aguilera, J.A. Characterization of laser induced plasmas by optical emission spectroscopy: A review of experiments and methods. Spectrochim. Acta Part B At. Spectrosc. 2008, 63, 893–916. [Google Scholar] [CrossRef]
  36. Cristoforetti, G.; De Giacomo, A.; Dell’Aglio, M.; Legnaioli, S.; Tognoni, E.; Palleschi, V.; Omenetto, N. Local Thermodynamic Equilibrium in Laser-Induced Breakdown Spectroscopy: Beyond the McWhirter criterion. Spectrochim. Acta Part B At. Spectrosc. 2010, 65, 86–95. [Google Scholar] [CrossRef]
  37. Paris, P.; Butikova, J.; Laan, M.; Aints, M.; Hakola, A.; Piip, K.; Tufail, I.; Veis, P. Detection of deuterium retention by LIBS at different background pressures. Phys. Scr. 2017, T170, 014003. [Google Scholar] [CrossRef]
  38. Li, C.; Feng, C.L.; Oderji, H.Y.; Luo, G.N.; Ding, H. Bin Review of LIBS application in nuclear fusion technology. Front. Phys. 2016, 11, 114214. [Google Scholar] [CrossRef]
Figure 1. The positions of the erosion marker tiles in the WEST divertor and the positions of the investigated LIBS samples together with the depiction of the layers of the erosion marker tile. The positions are marked by red dashed rings. The position of the samples investigated by GDOES and SIMS methods are shown by light-grey dashed rings.
Jne 04 00007 g001
Figure 2. Experimental setup for LIBS measurements.
Jne 04 00007 g002
Figure 3. GDOES depth profiles of W, Mo and C from tile 34i at s = 273.5 mm and tile 22o at s = 566 mm.
Jne 04 00007 g003
Figure 4. SIMS depth profiles of W, Mo, C, B, D and H from tile 34i at s coordinate 32.5 mm, 273.5 mm and 312 mm, and tile 22o at s coordinate 566 mm.
Jne 04 00007 g004
Figure 5. Selected range of LIBS spectra collected by Andor Mechelle 5000 spectrometer after 15th laser shot at 10 Torr Ar pressure and 1300 ns delay time.
Jne 04 00007 g005
Figure 6. LIBS depth profiles of W and Mo, as the function of LIBS shot number, from 5 different spots of each sample. Depth profiles of C are shown for comparison. The intensity of the average values of W lines, Mo line at 550.65 nm and C II line at 657.81 nm was used for construction of depth profiles.
Jne 04 00007 g006
Figure 7. LIBS intensities of C I line at 247.86 nm, O I triplet at 777 nm and B I lines at 249.68 and 249.77 nm. The spectra of the first and second laser shots are averaged over 5 measured spectra collected at different spots of the same sample.
Jne 04 00007 g007
Figure 8. LIBS intensities of Dα and Hα lines at 656.1 and 656. 28 nm after 3rd shot in sample 34i s = 12.5 mm at 10 Torr Ar and delay time 1300 ns. The peaks of Dα and Hα lines were fitted with pseudo-Voigt contours, while the W I line at 656.32 nm was fitted with Gaussian. Black rings show experimental measurements and solid lines show fitted spectral lines.
Jne 04 00007 g008
Figure 9. Depth profiles of B, O and D line intensities during first 10 laser shots on three samples. The intensities are determined from averaged spectra of 5 (or 4) different spots of the same sample. In the case of the sample 34i s = 292.5 mm, the D intensity was about 100.
Jne 04 00007 g009
Figure 10. B/W, C/W and D/W ratios for SIMS signals and LIBS line intensities.
Jne 04 00007 g010
Figure 11. Boltzmann plot of W I and W II (a) and Saha-Boltzmann plot for W (b) determined from the W I and W II lines shown in Table 1.
Jne 04 00007 g011
Figure 12. Electron density and electron temperature values averaged over 5 spots of each sample. The error bars show the standard deviation for measurements.
Jne 04 00007 g012
Table 1. W I and W II lines used for the construction of W depth profiles and Saha-Boltzmann plots.
LineEi, eVEj, eVgiAij·107, s−1
W I 354.52 nm3.4900.96
W I 370.81 nm3.710.372.0
W I 373.04 nm5.782.4610.4
W I 376.01 nm3.710.411.4
W I 378.08 nm3.640.372.1
W I 381.75 nm3.610.372.2
W I 386.80 nm3.570.374.1
W I 388.14 nm3.790.602.5
W I 410.27 nm3.790.773.4
W I 426.94 nm3.270.371.5
W I 430.21 nm3.250.372.5
W I 468.06 nm3.250.600.98
W I 484.38 nm2.970.410.95
W I 488.68 nm3.310.770.89
W I 500.62 nm3.250.770.84
W I 501.53 nm3.070.600.49
W I 505.32 nm2.660.210.57
W I 522.47 nm2.970.600.60
W I 551.47 nm2.660.410.22
WII 316.00 nm5.761.846.38
WII 337.61 nm5.551.886.03
WII 340.19 nm5.51.864.22
WII 346.35 nm5.241.672.37
WII 361.38 nm5.241.814.60
WII 364.14 nm4.481.081.98
WII 373.62 nm5.552.233.42
WII 385.15 nm4.851.631.22
WII 434.81 nm4.481.631.01
Disclaimer/Publisher’s Note: The statements, opinions and data contained in all publications are solely those of the individual author(s) and contributor(s) and not of MDPI and/or the editor(s). MDPI and/or the editor(s) disclaim responsibility for any injury to people or property resulting from any ideas, methods, instructions or products referred to in the content.

