

Heat Pipe-Based DEMO Divertor Target Concept: High Heat Flux Performance Evaluation
 , , ,
, , ,
Abstract
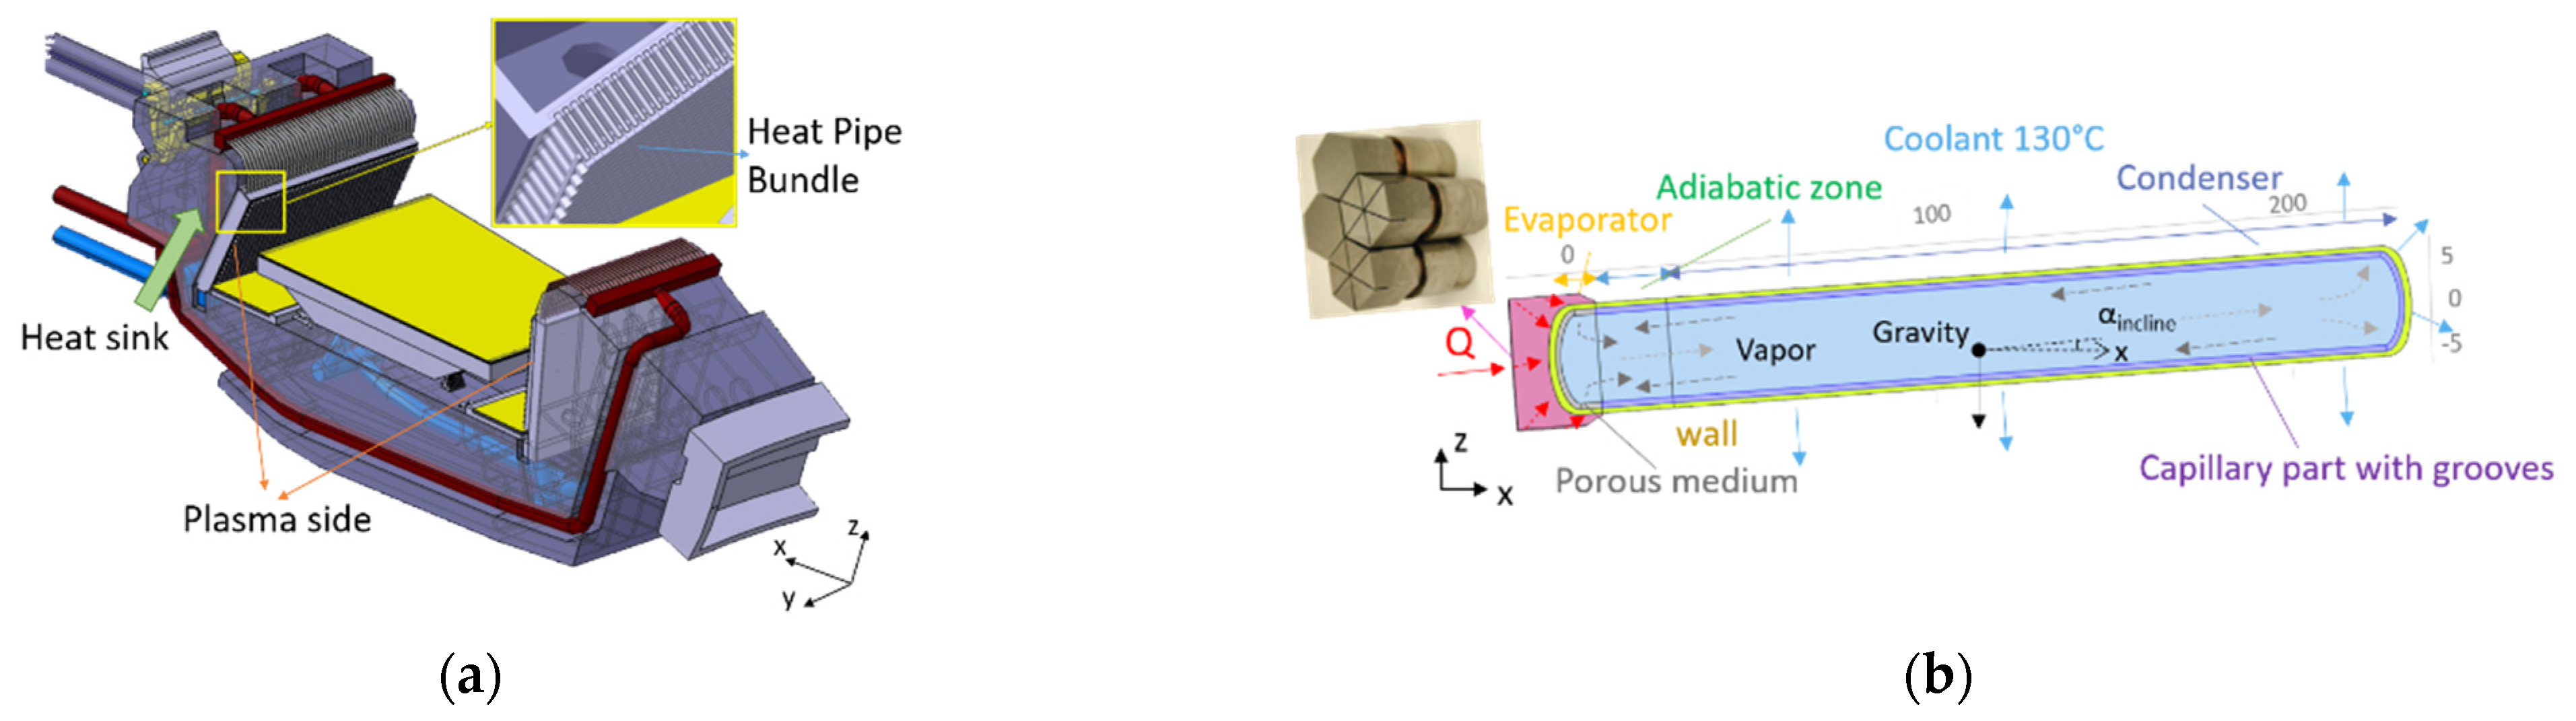
:1. Introduction
2. Mock-Up Design and Layout of the Experimental Setup
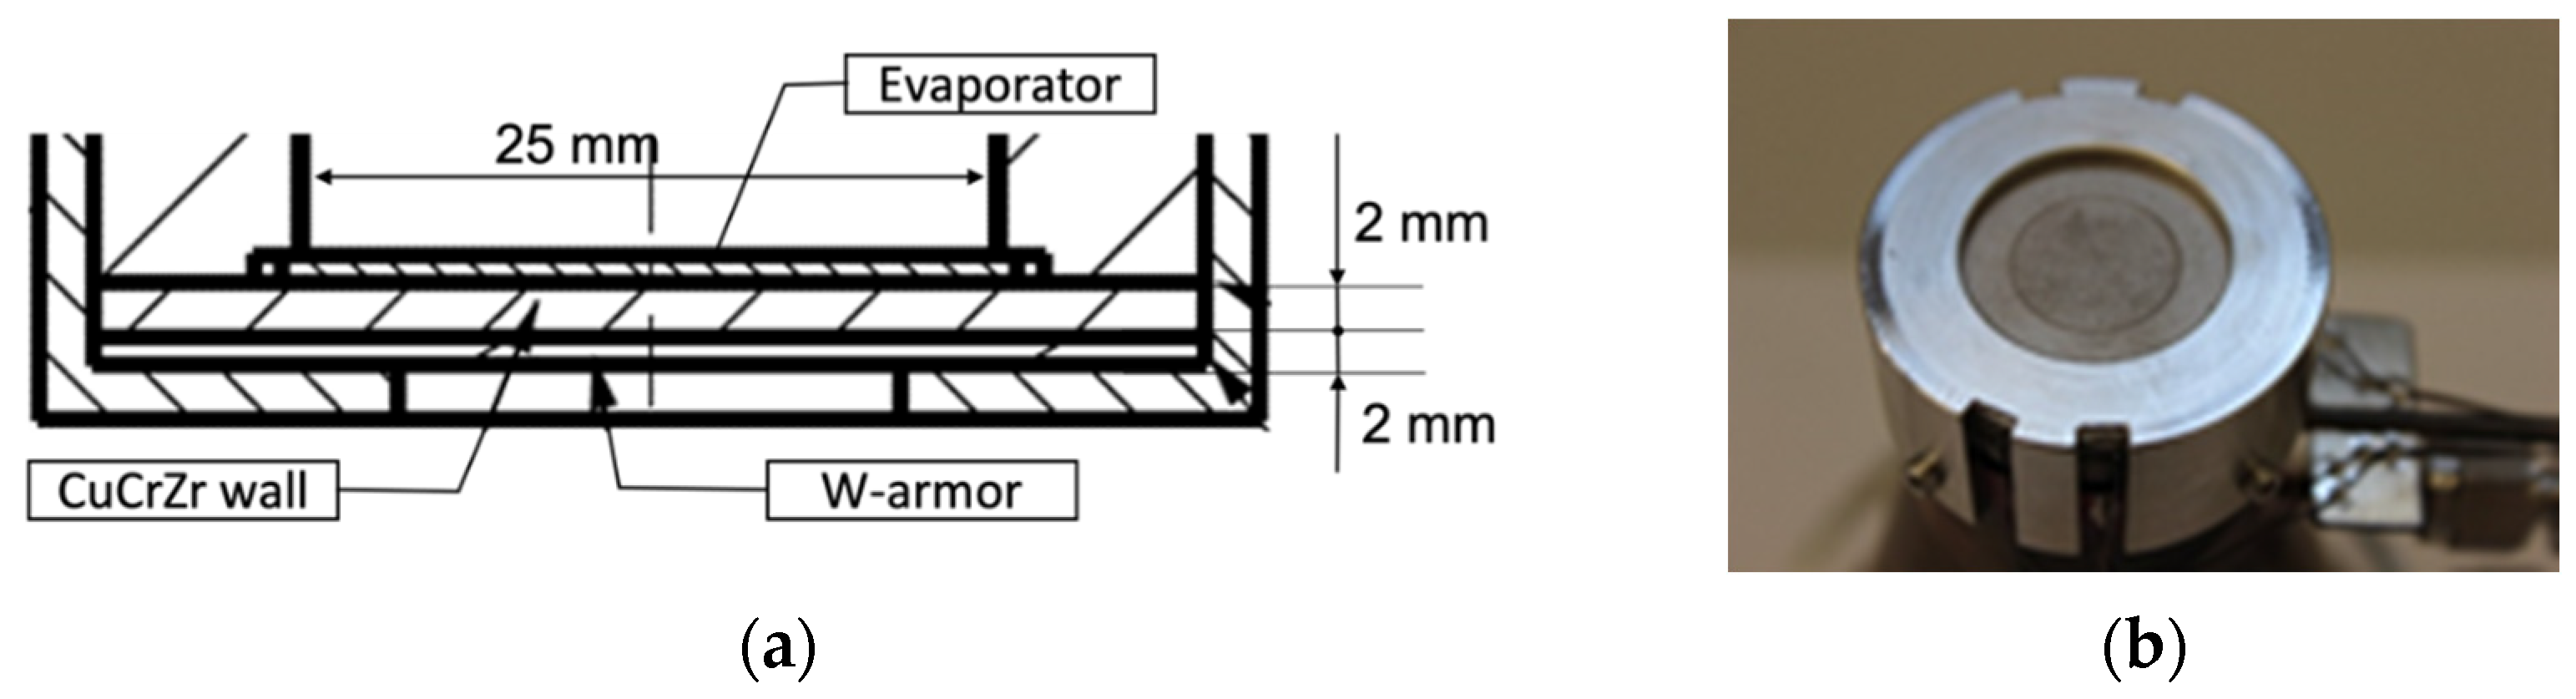
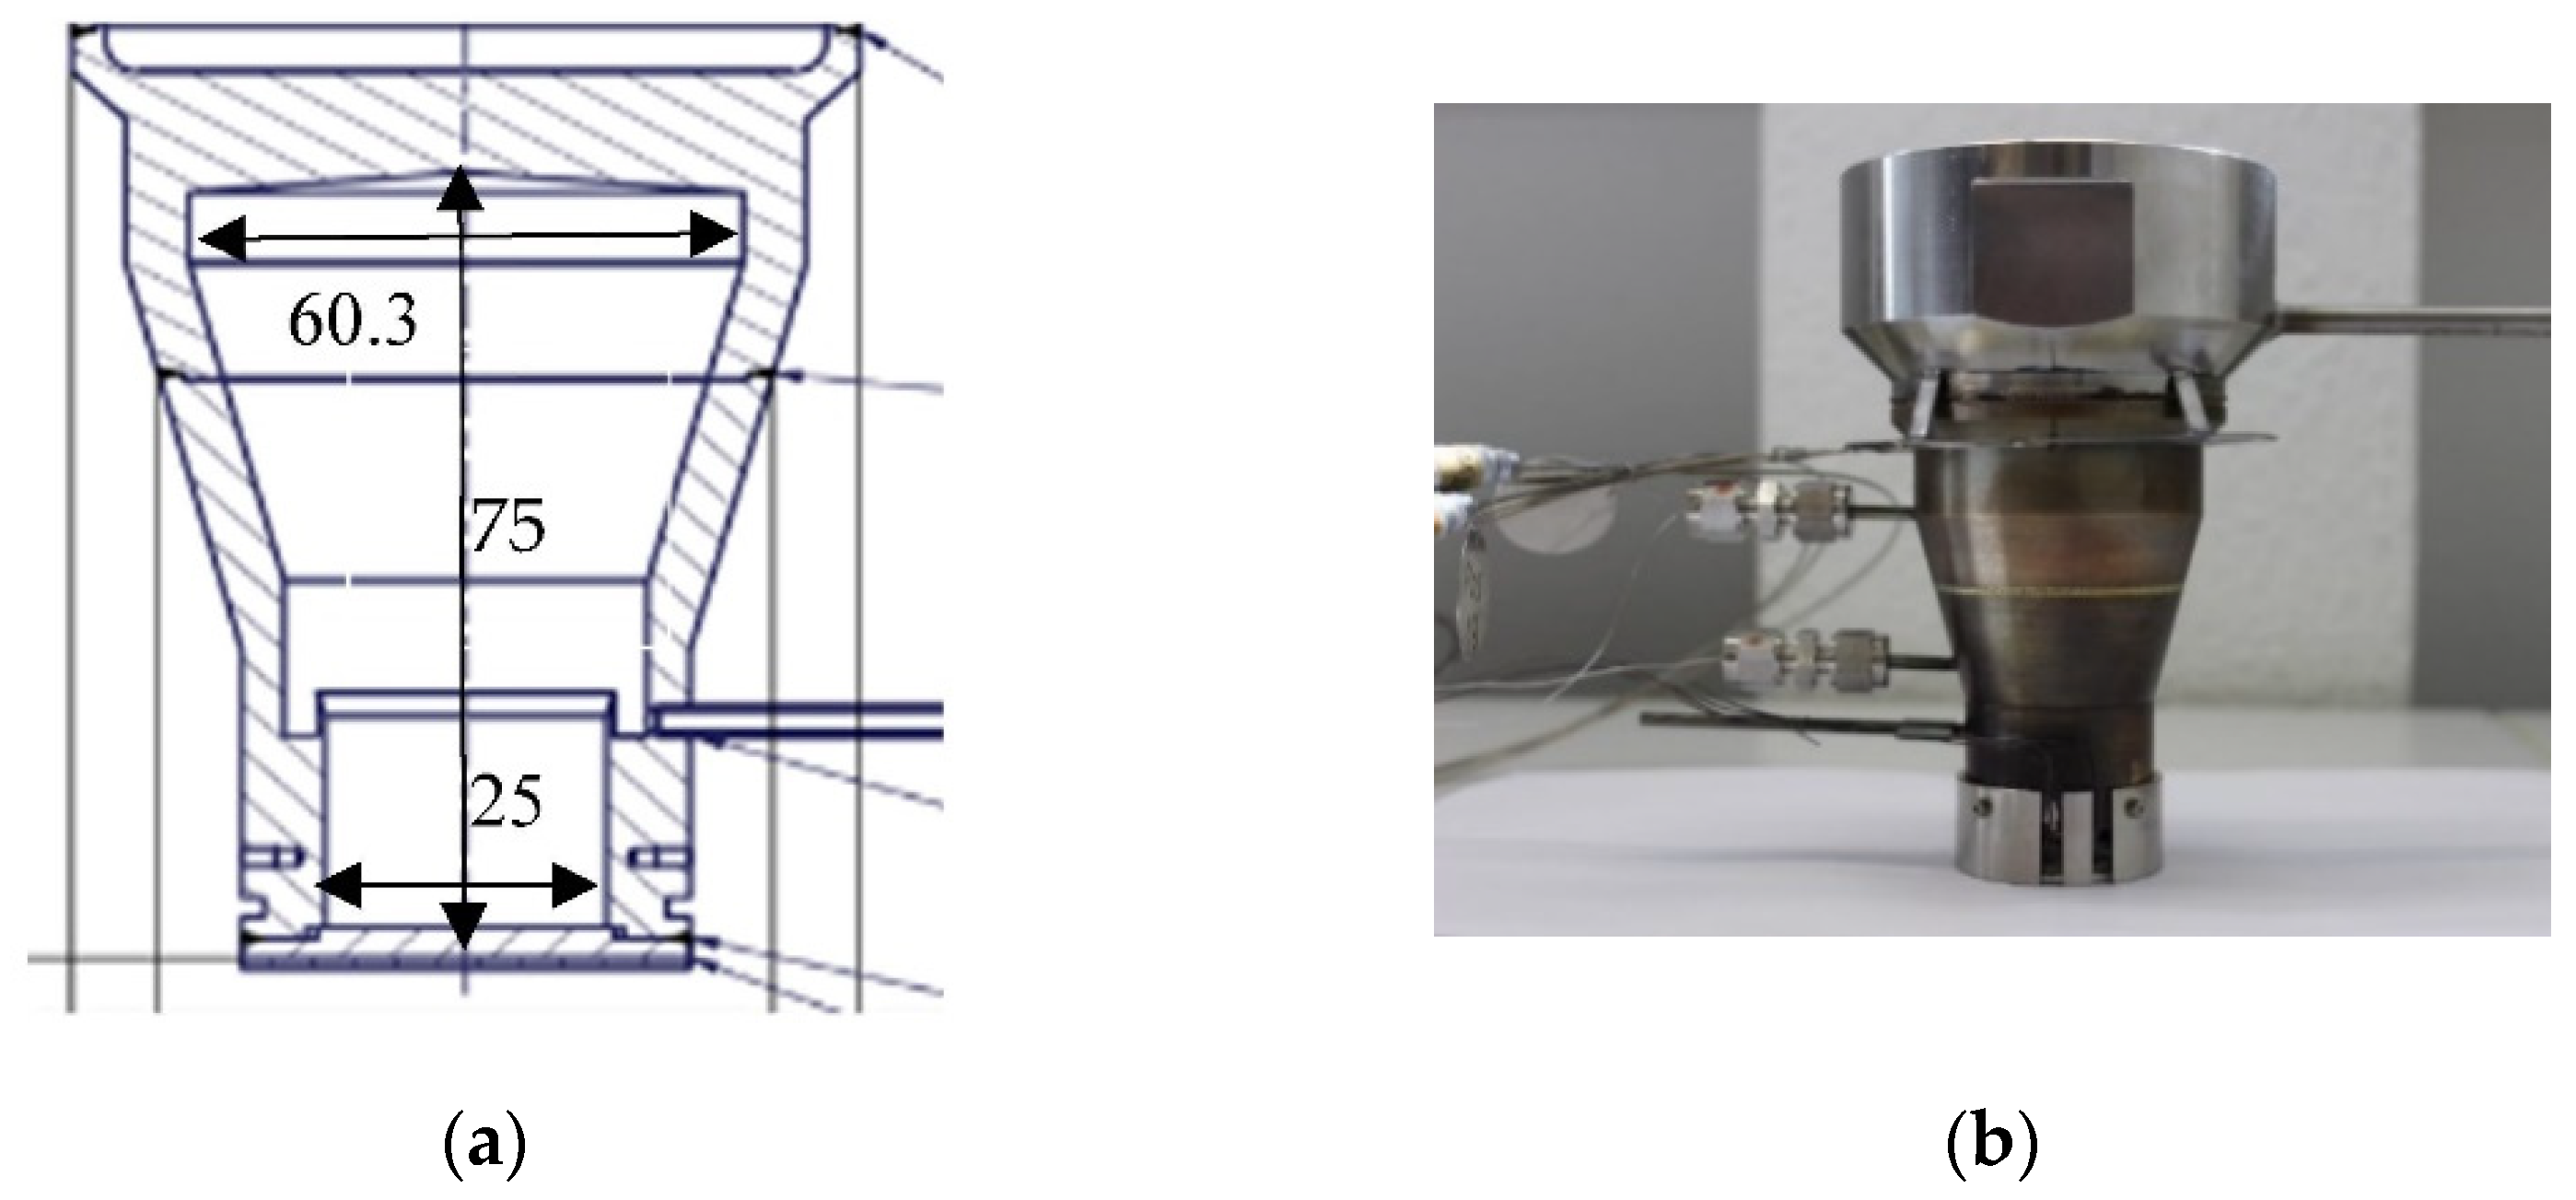
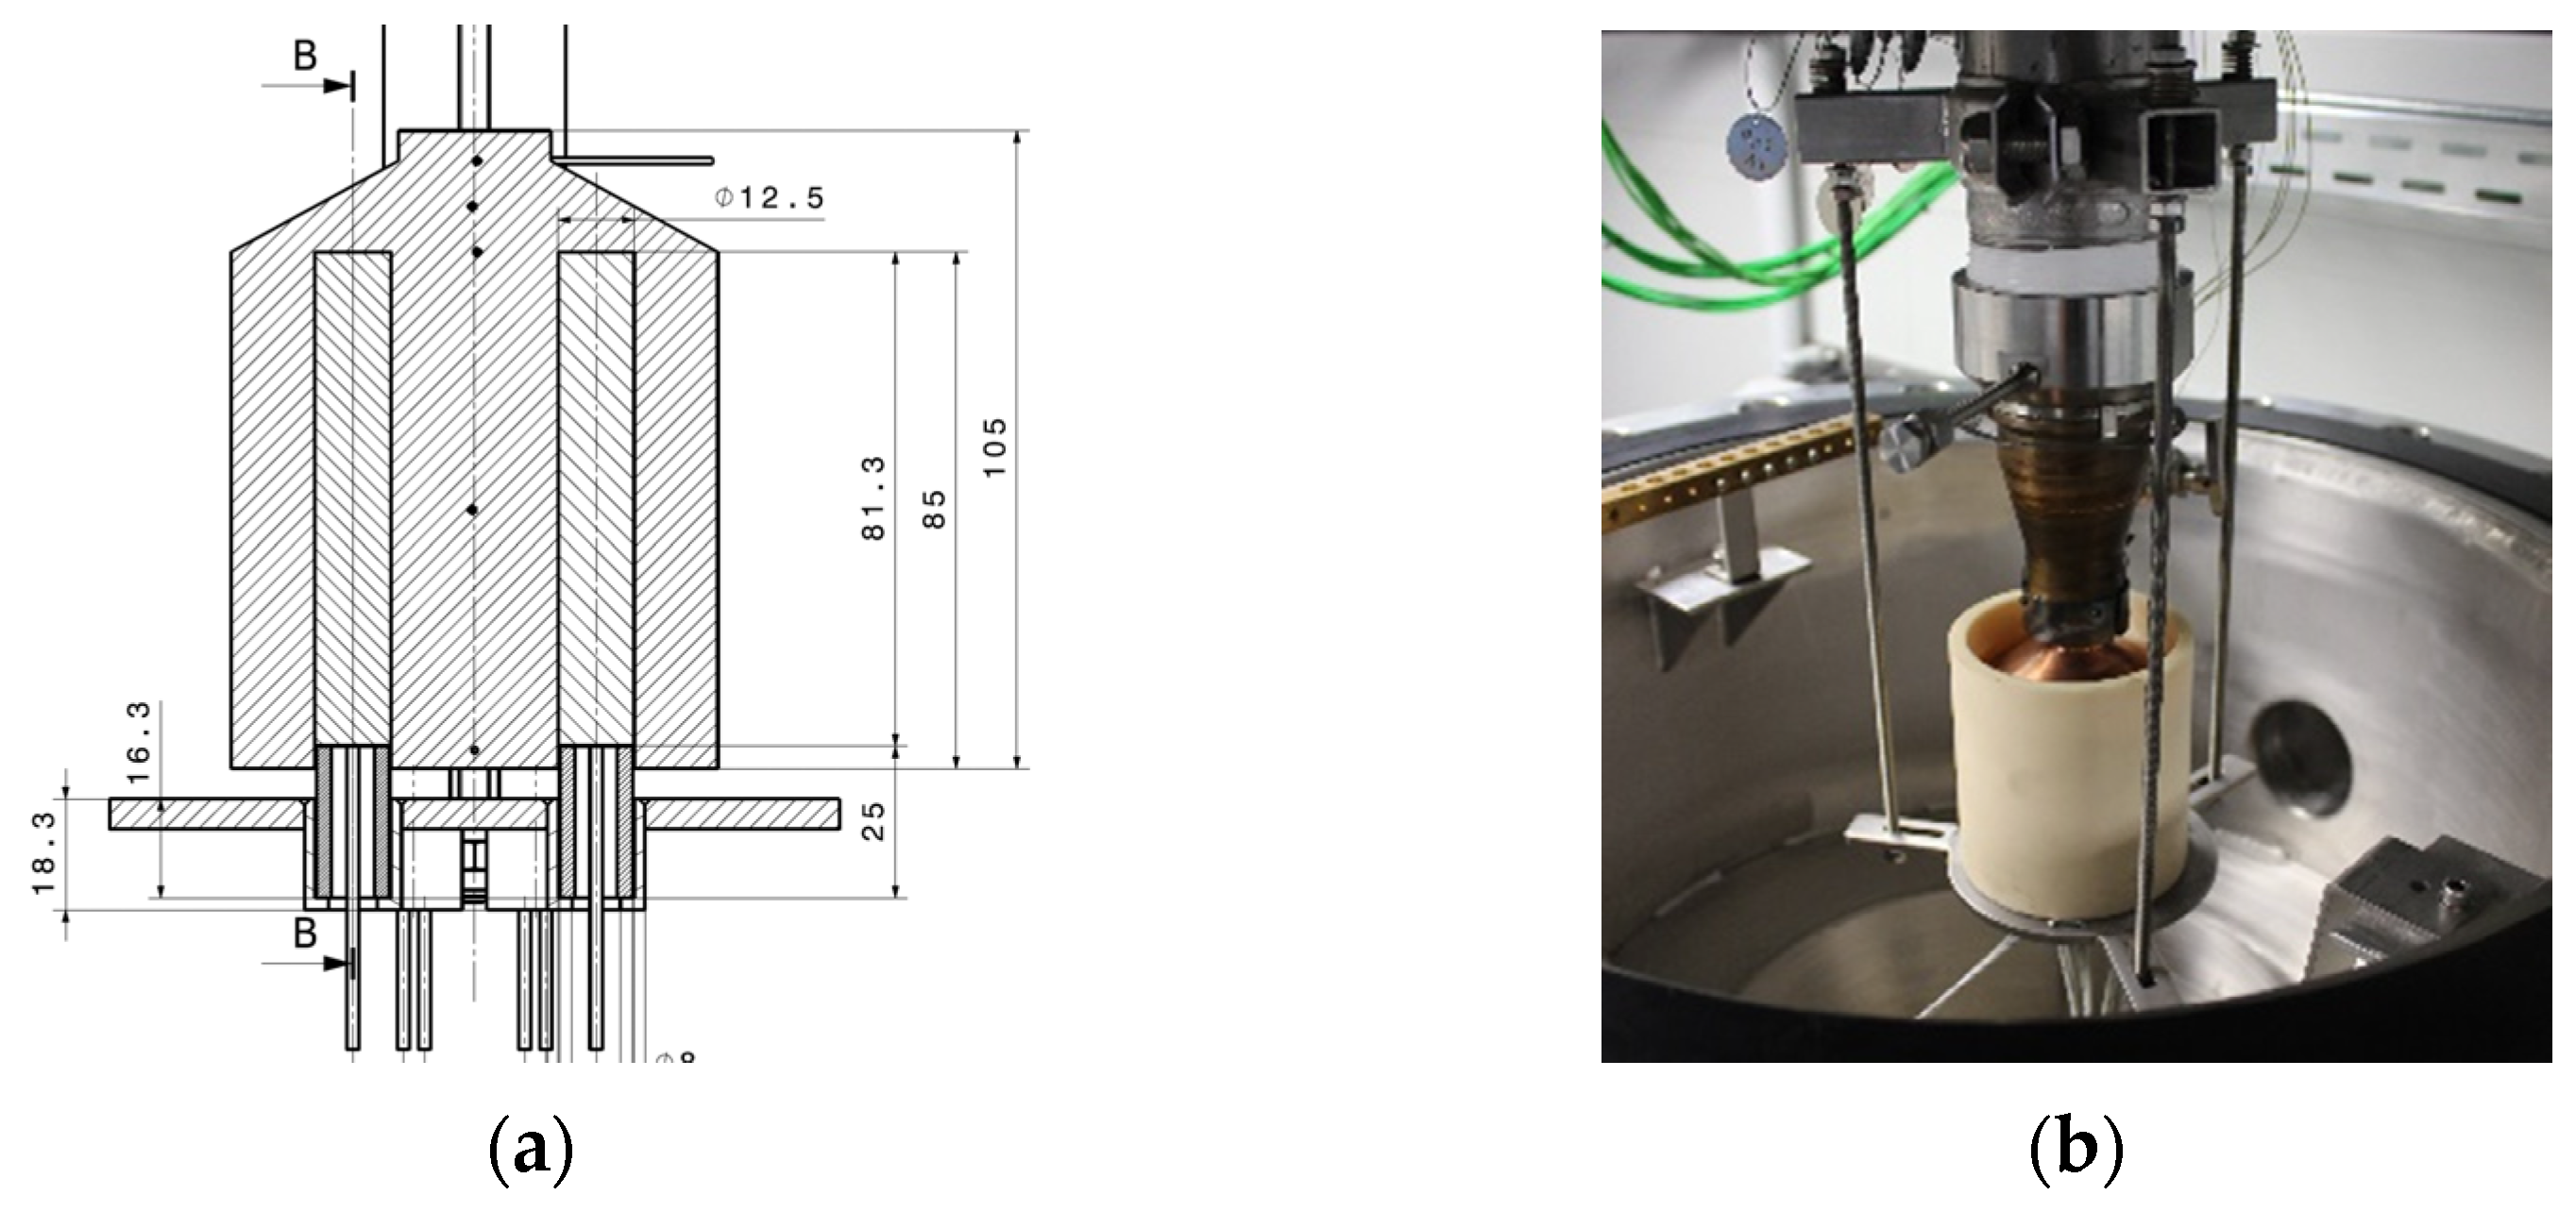
2.1. Evaporator
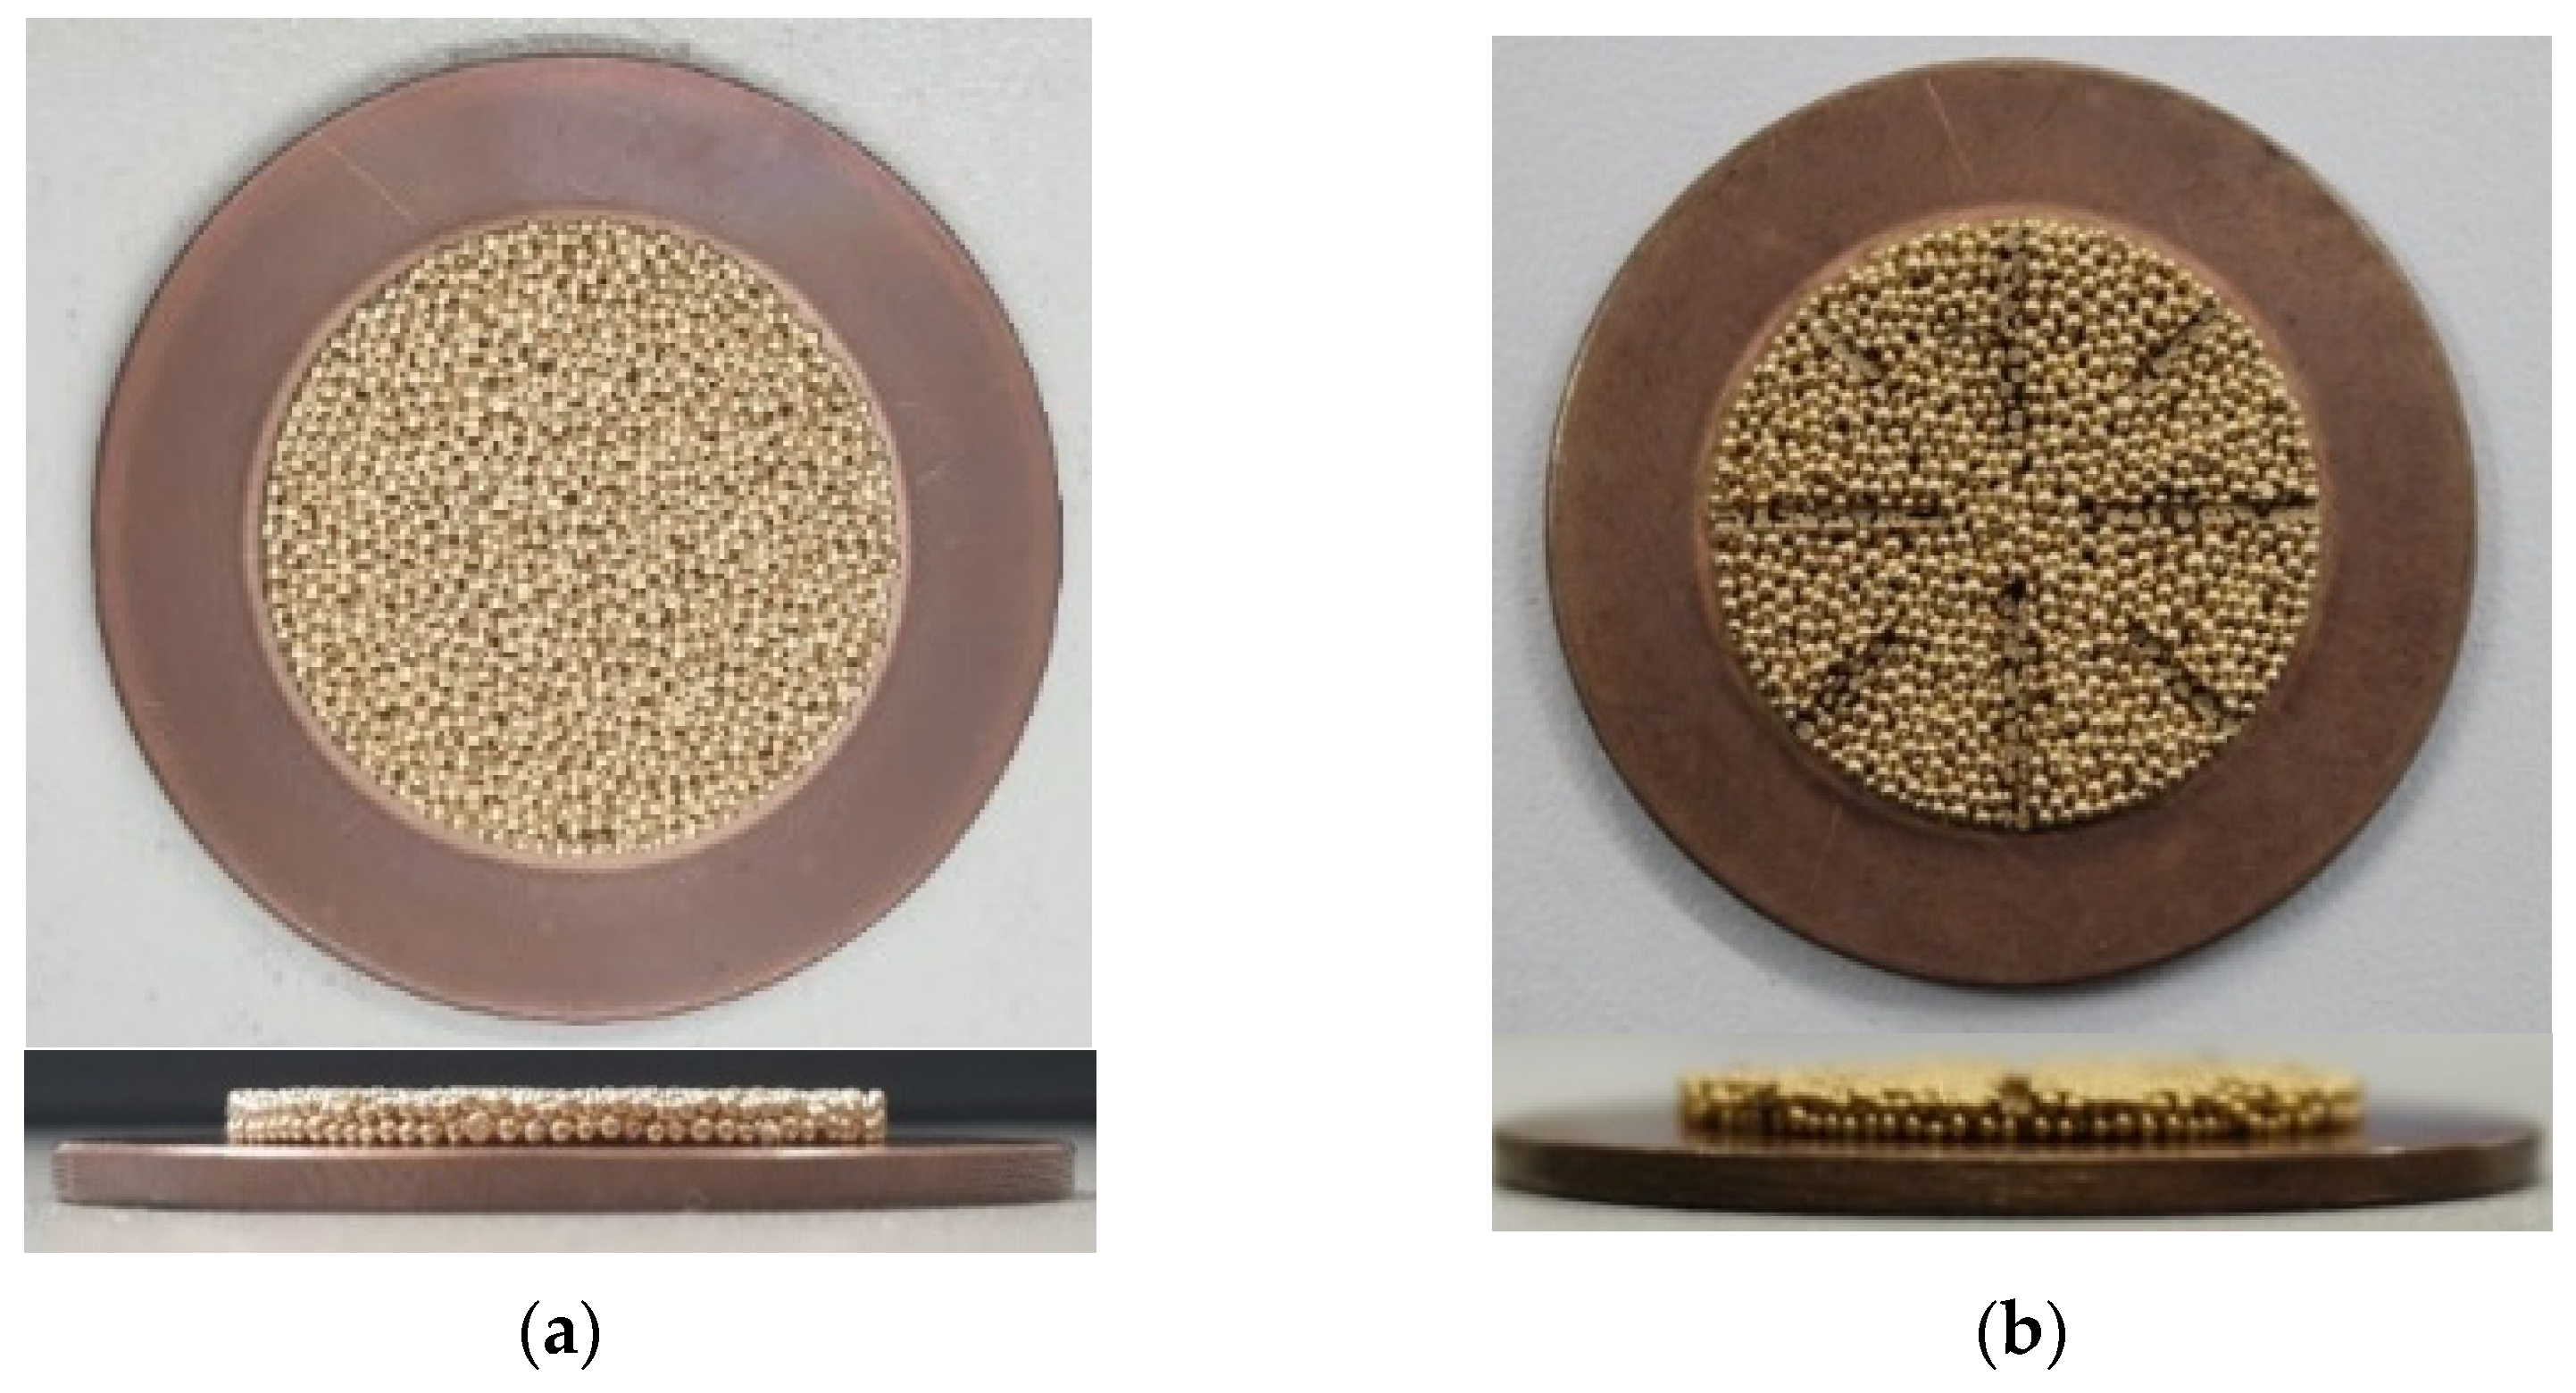
2.2. Wick Structure
- The thickness of the wick porous B200 on the CuCrZr plate was increased from 1 mm to 2 mm due to the larger grain size of the sintered material (B200);
- The maximum heat flux that the B200-mockup could receive was only 4 MW/m2, which was mainly due to the sintered material’s low heat conductivity (40 W/m/K), thus resulting in an increased wall temperature. The heat flux of 4 MW/m2 corresponds to the loading at which the CuCrZr wall approaches its operational limits.
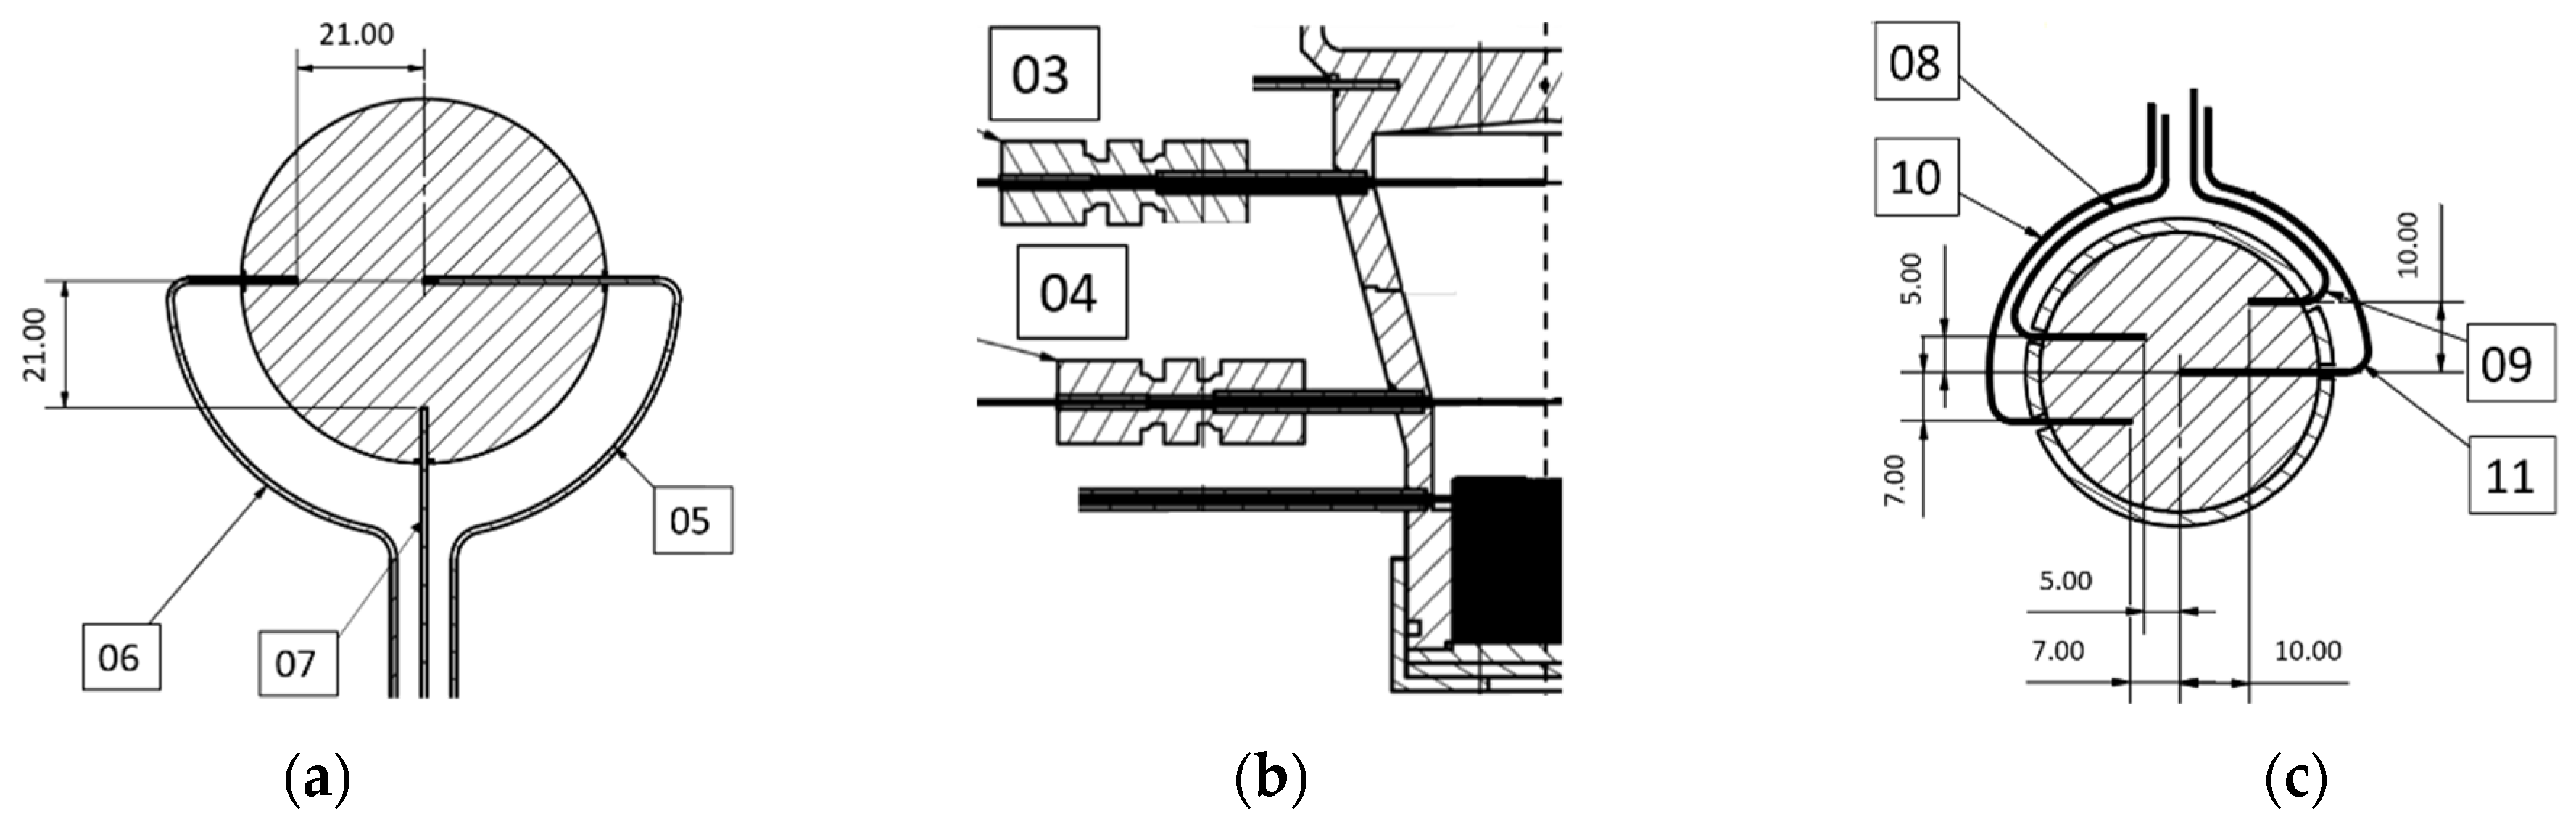
2.3. Reservoir for Volume Change
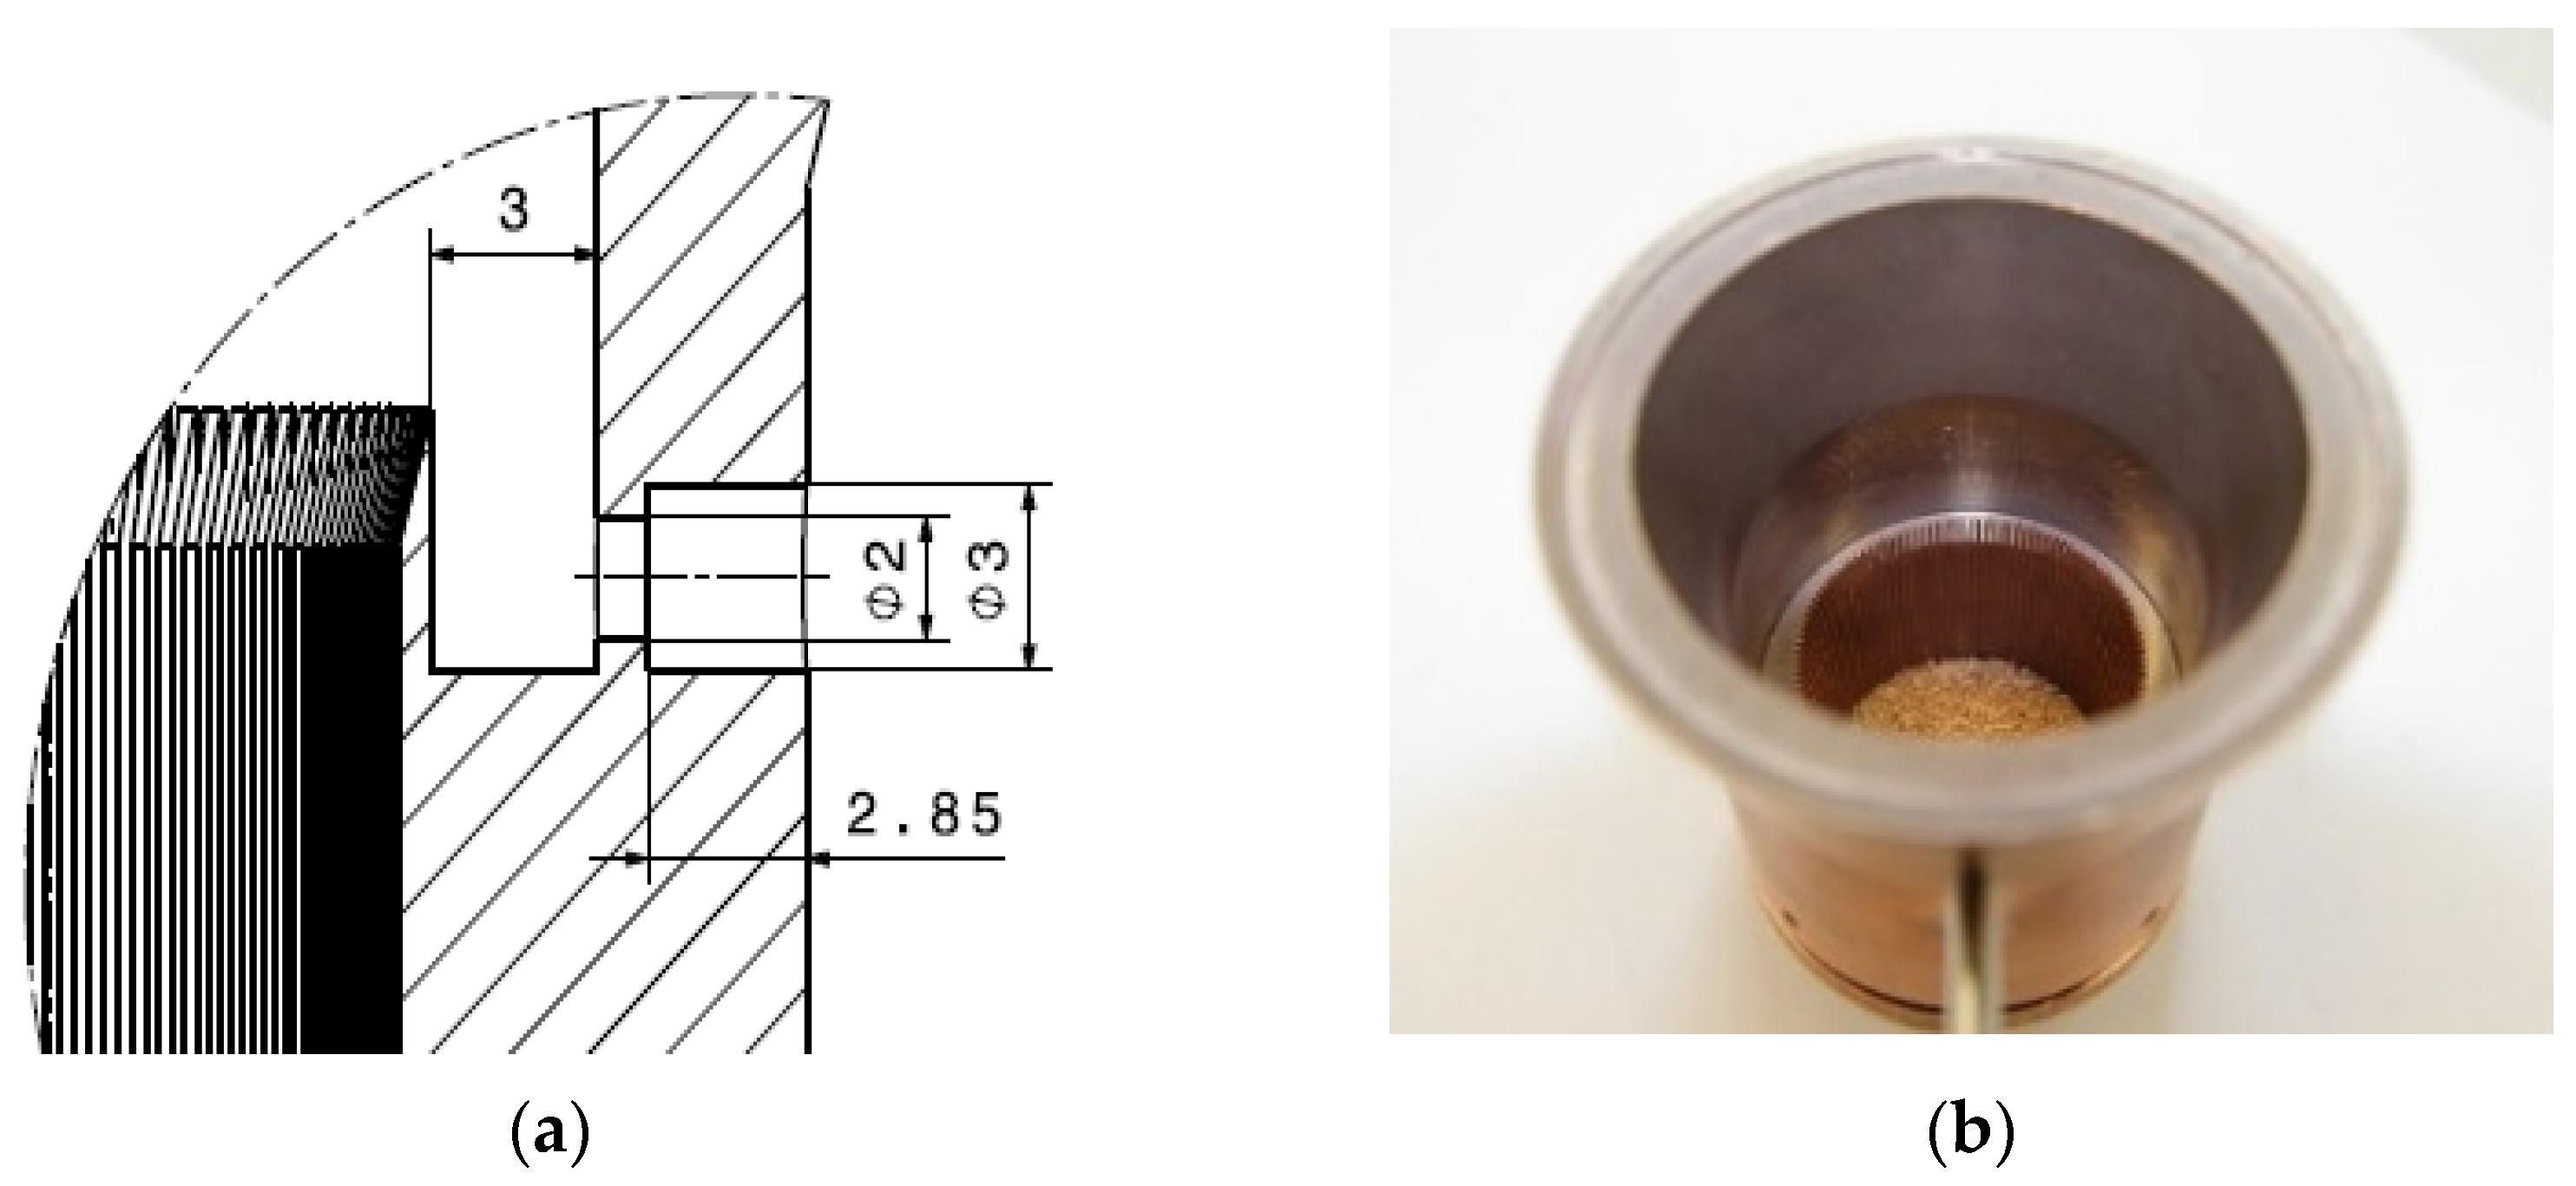
2.4. Condenser
2.5. Instrumentation of the HPEE Mock-Up
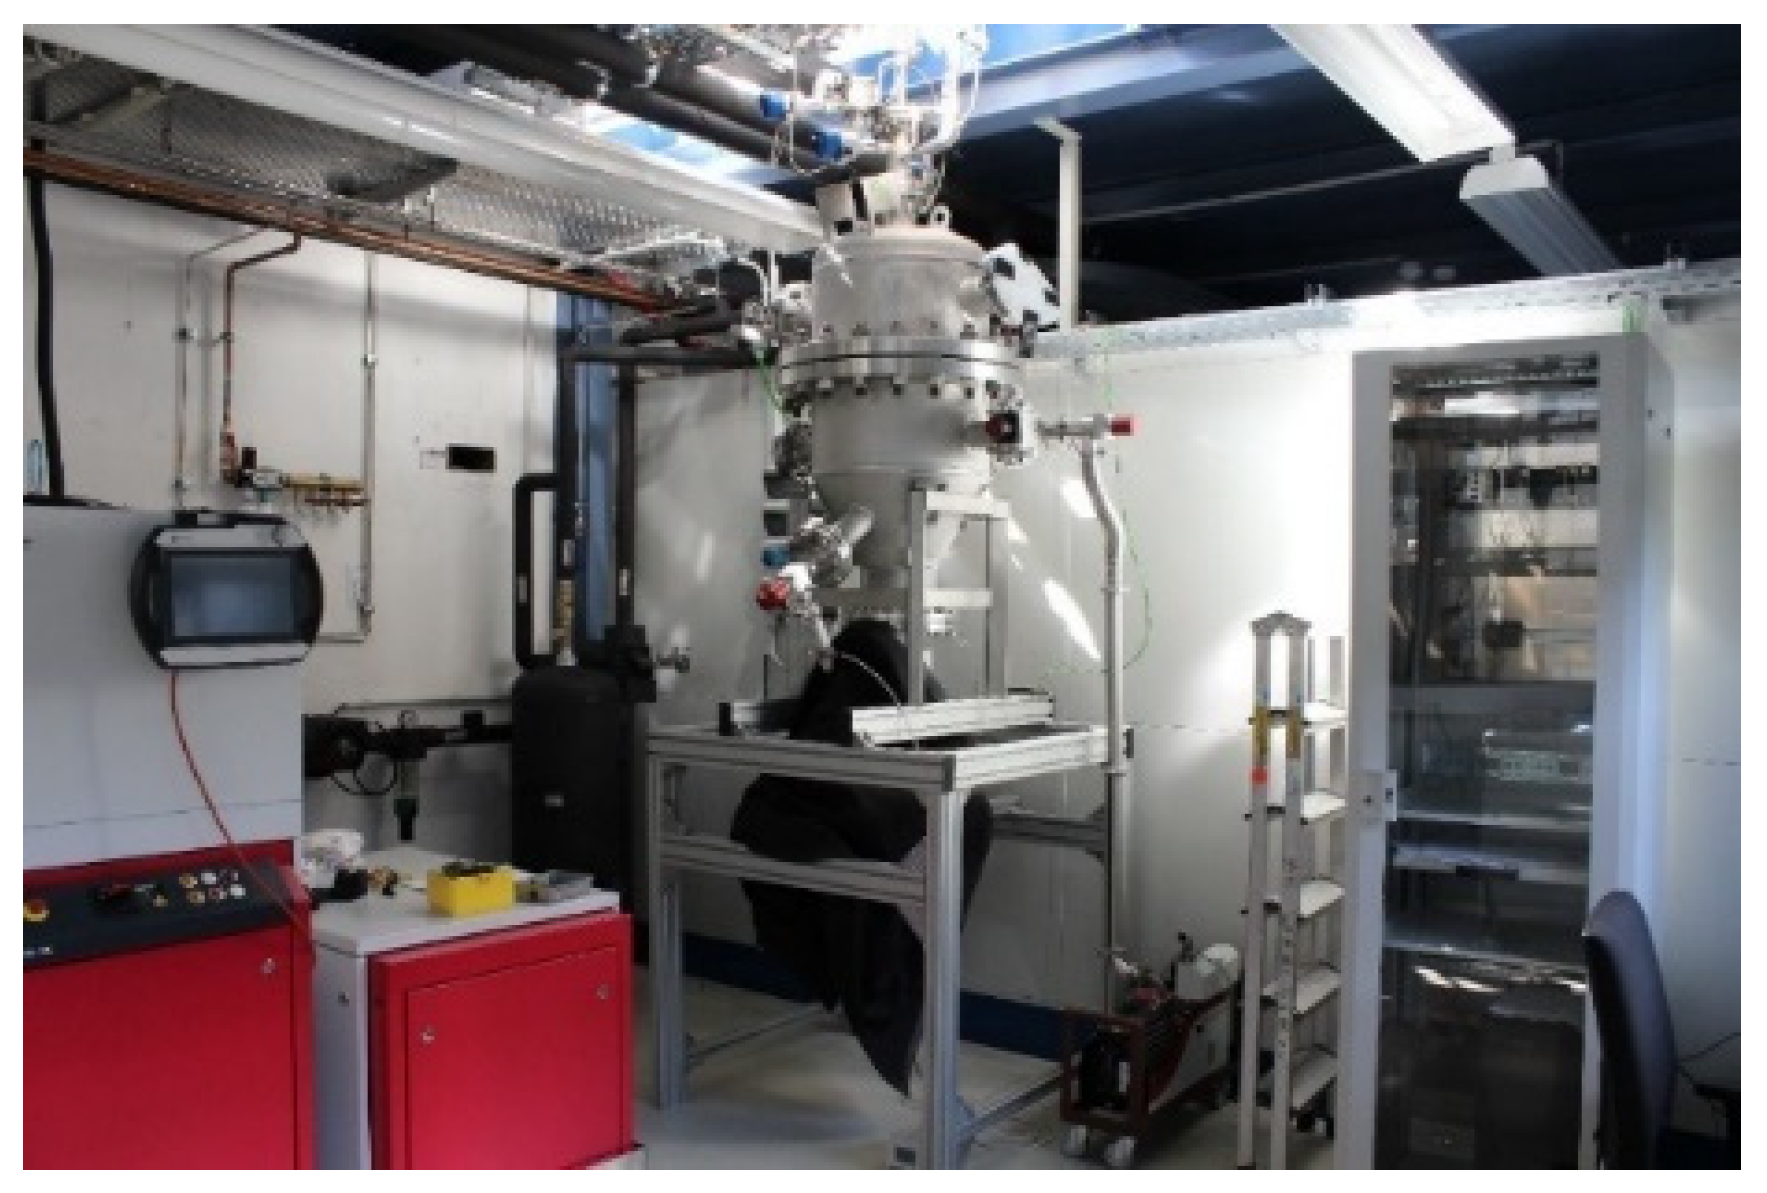
2.6. Experimental Setup
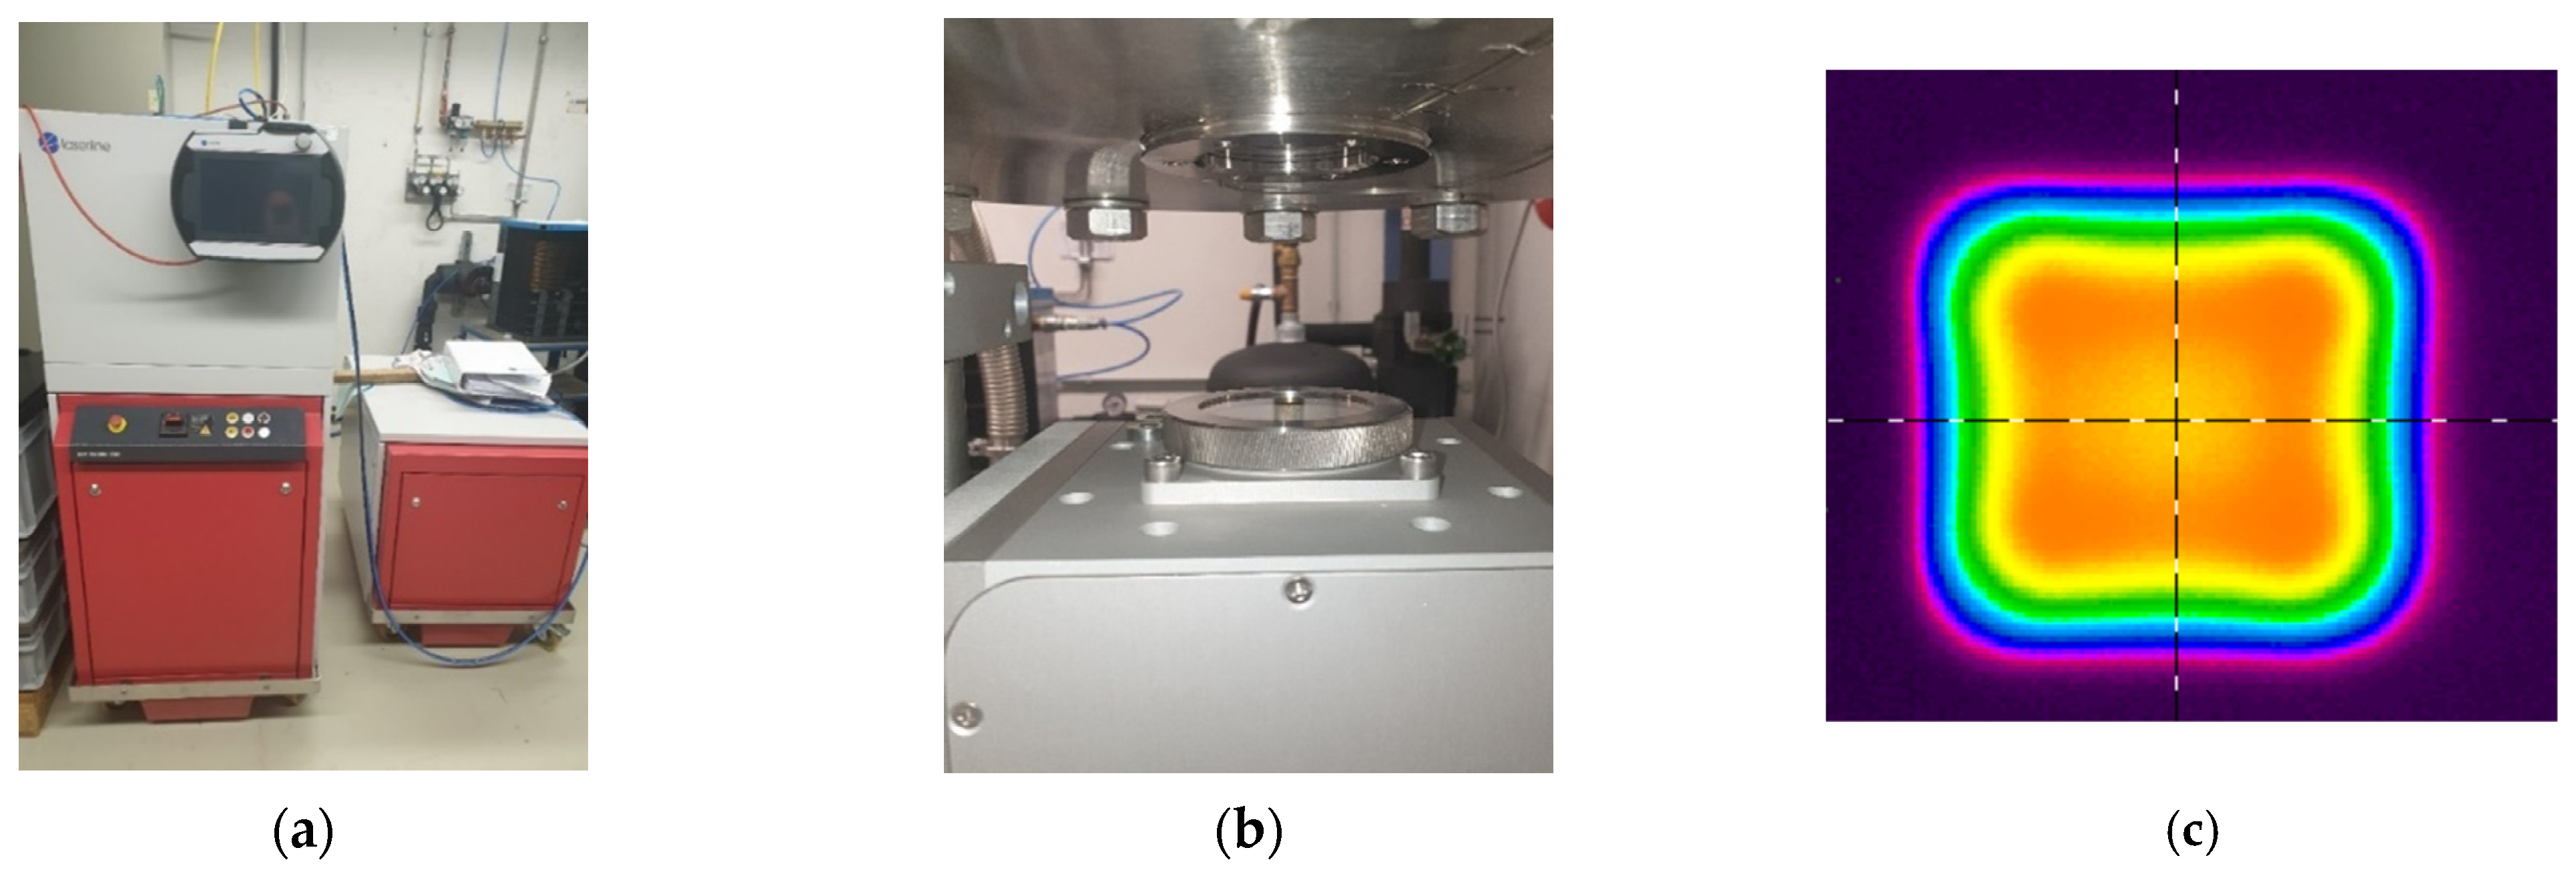
2.6.1. Heat Source Systems
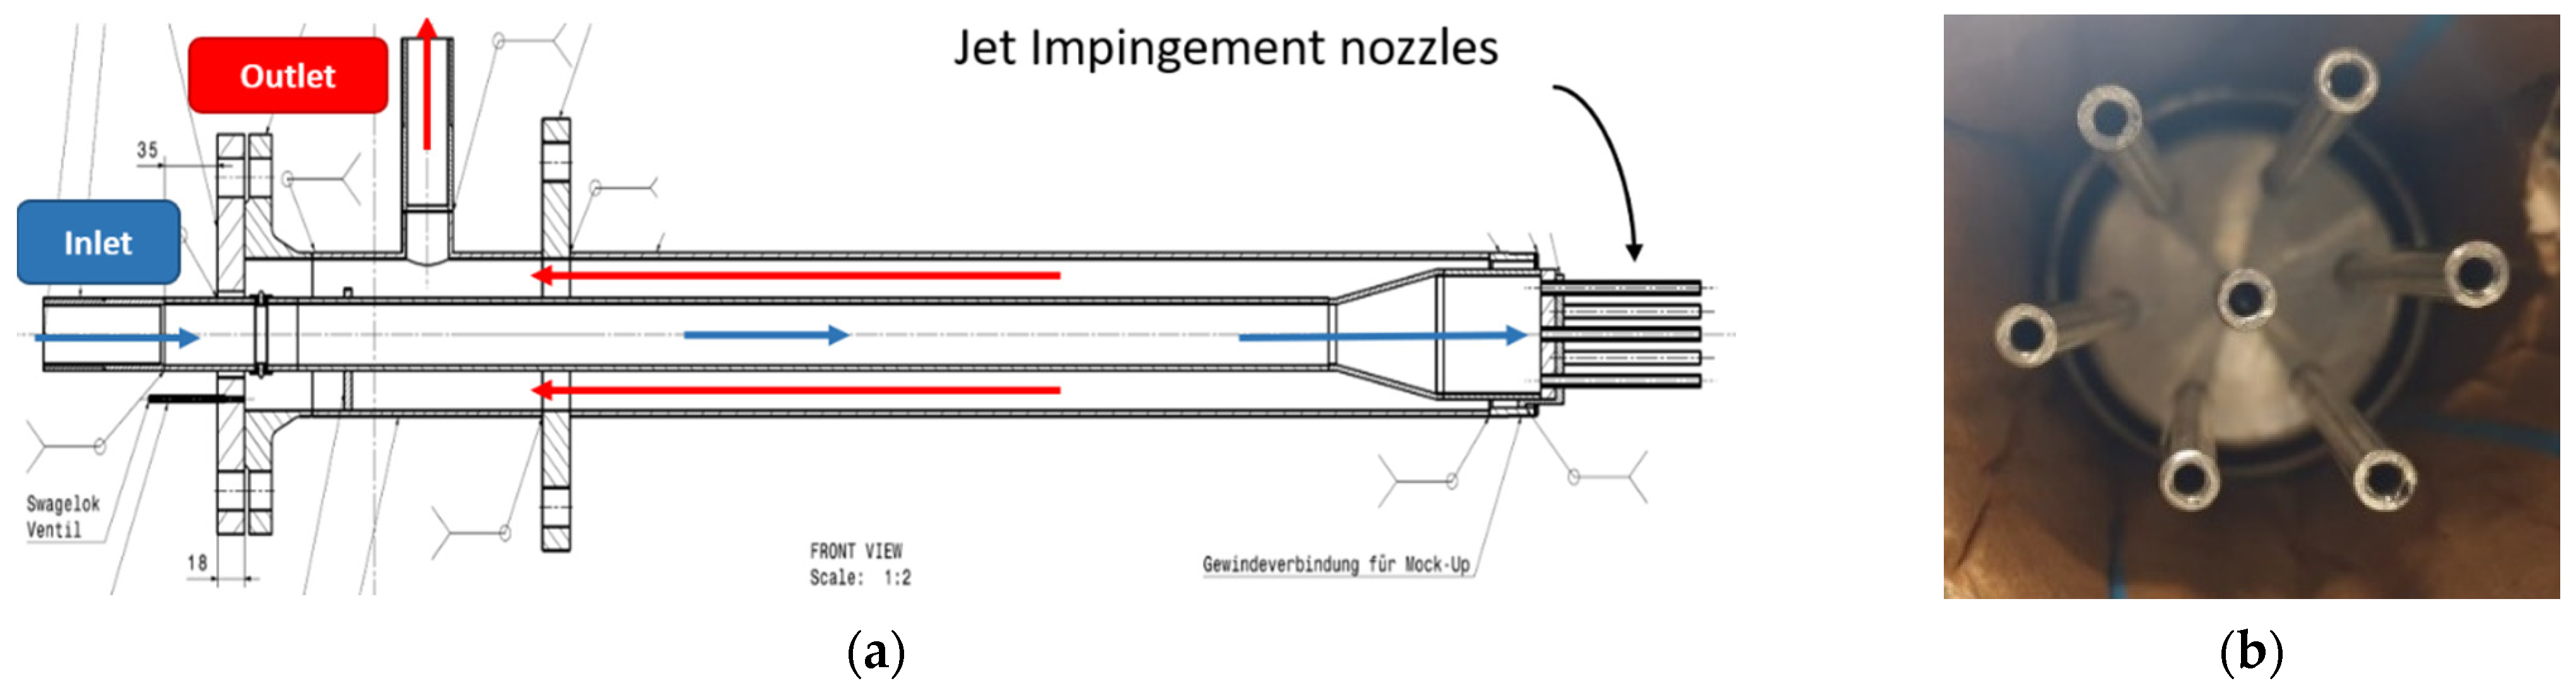
2.6.2. External Cooling System/Heat Sink System for HPEE
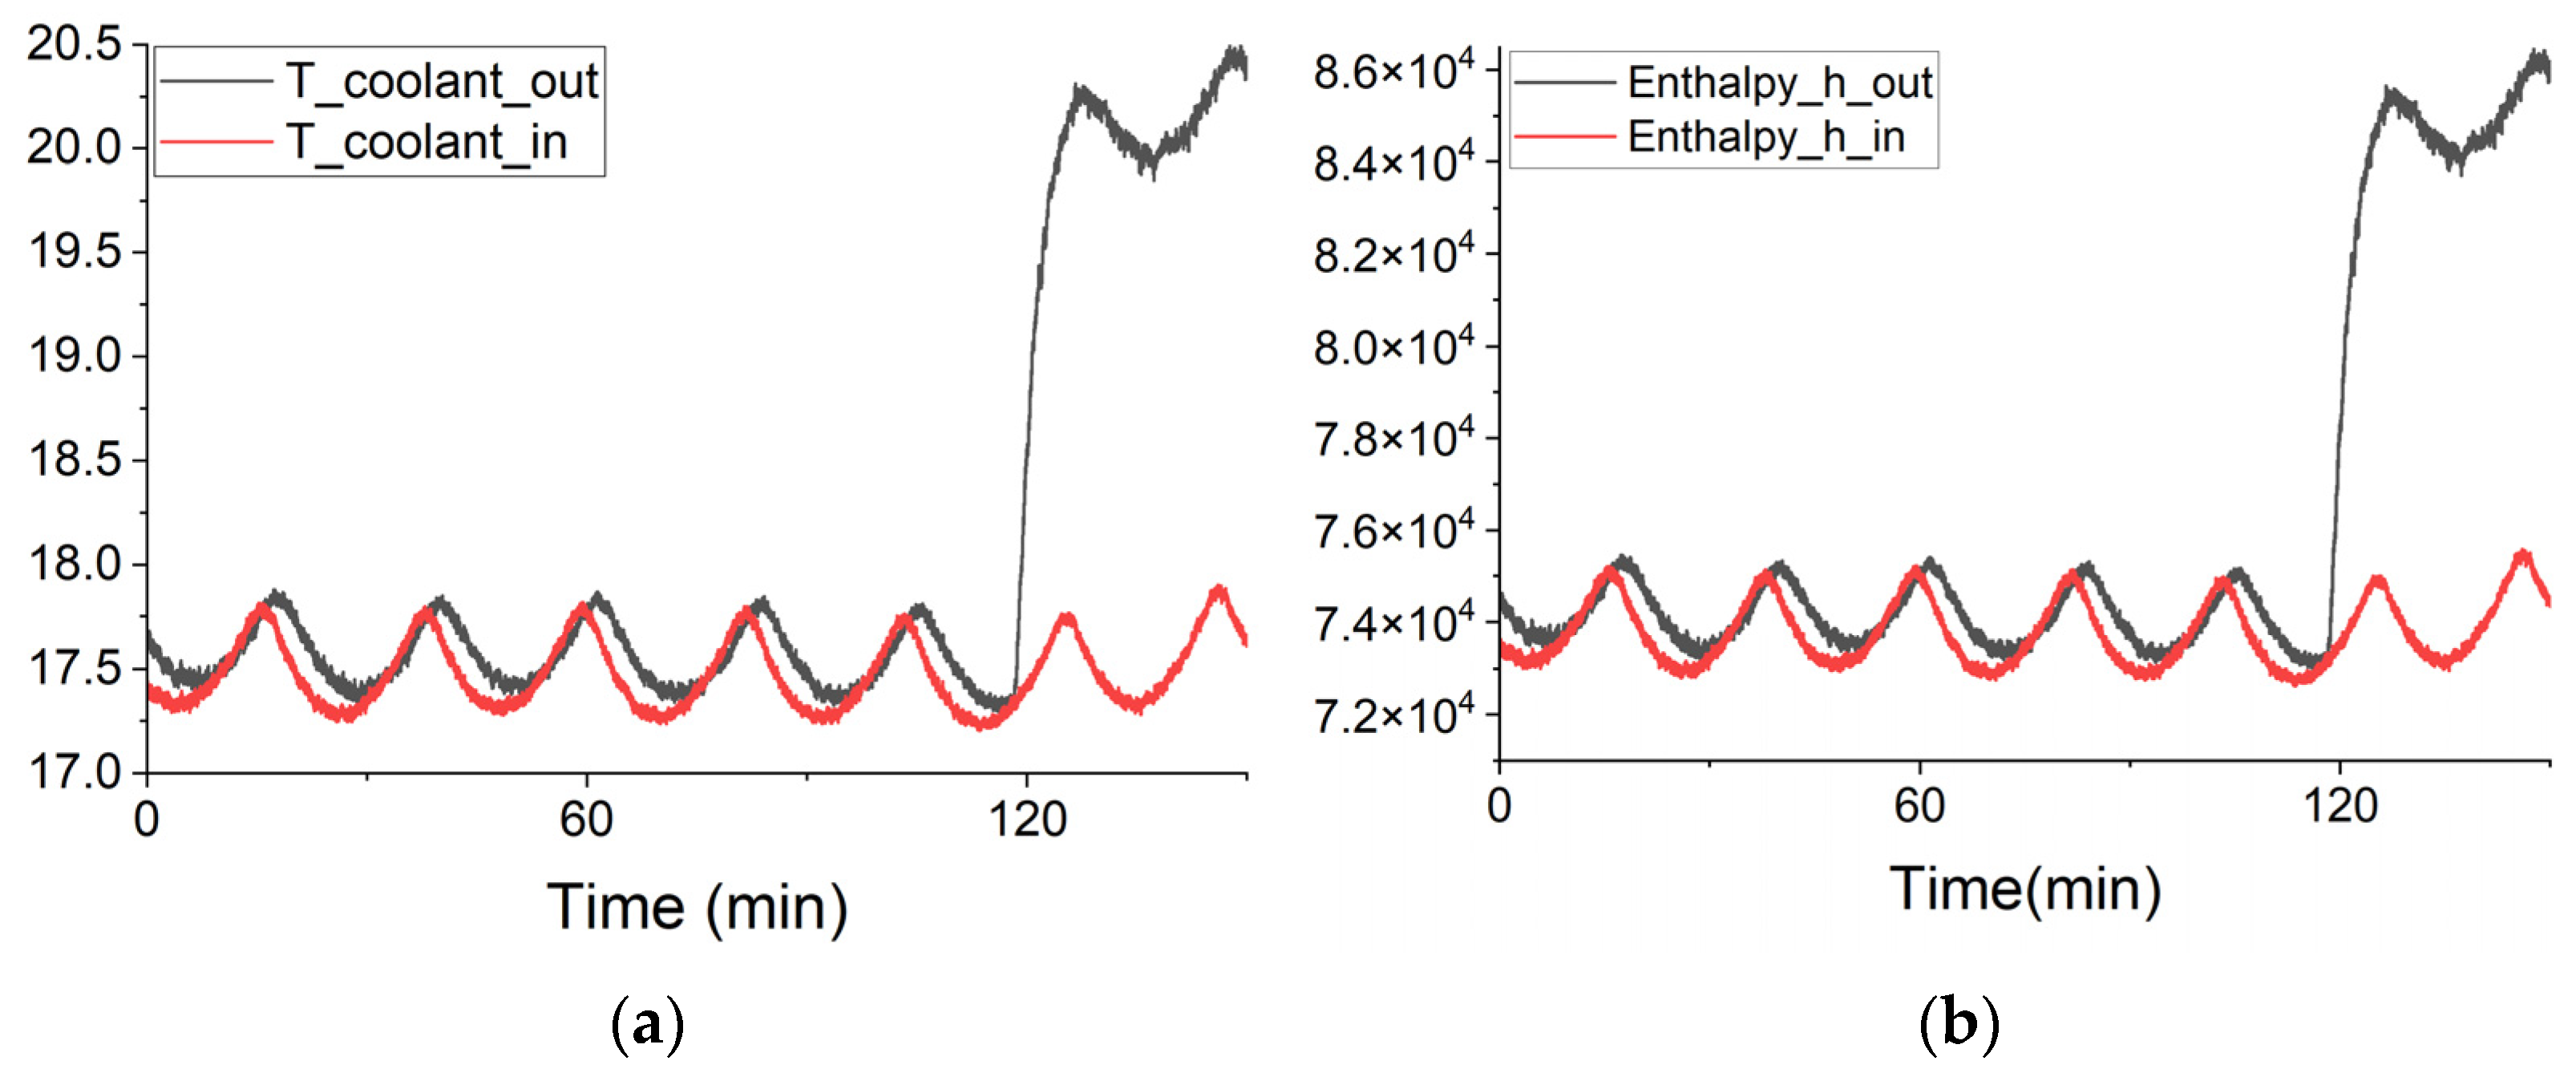
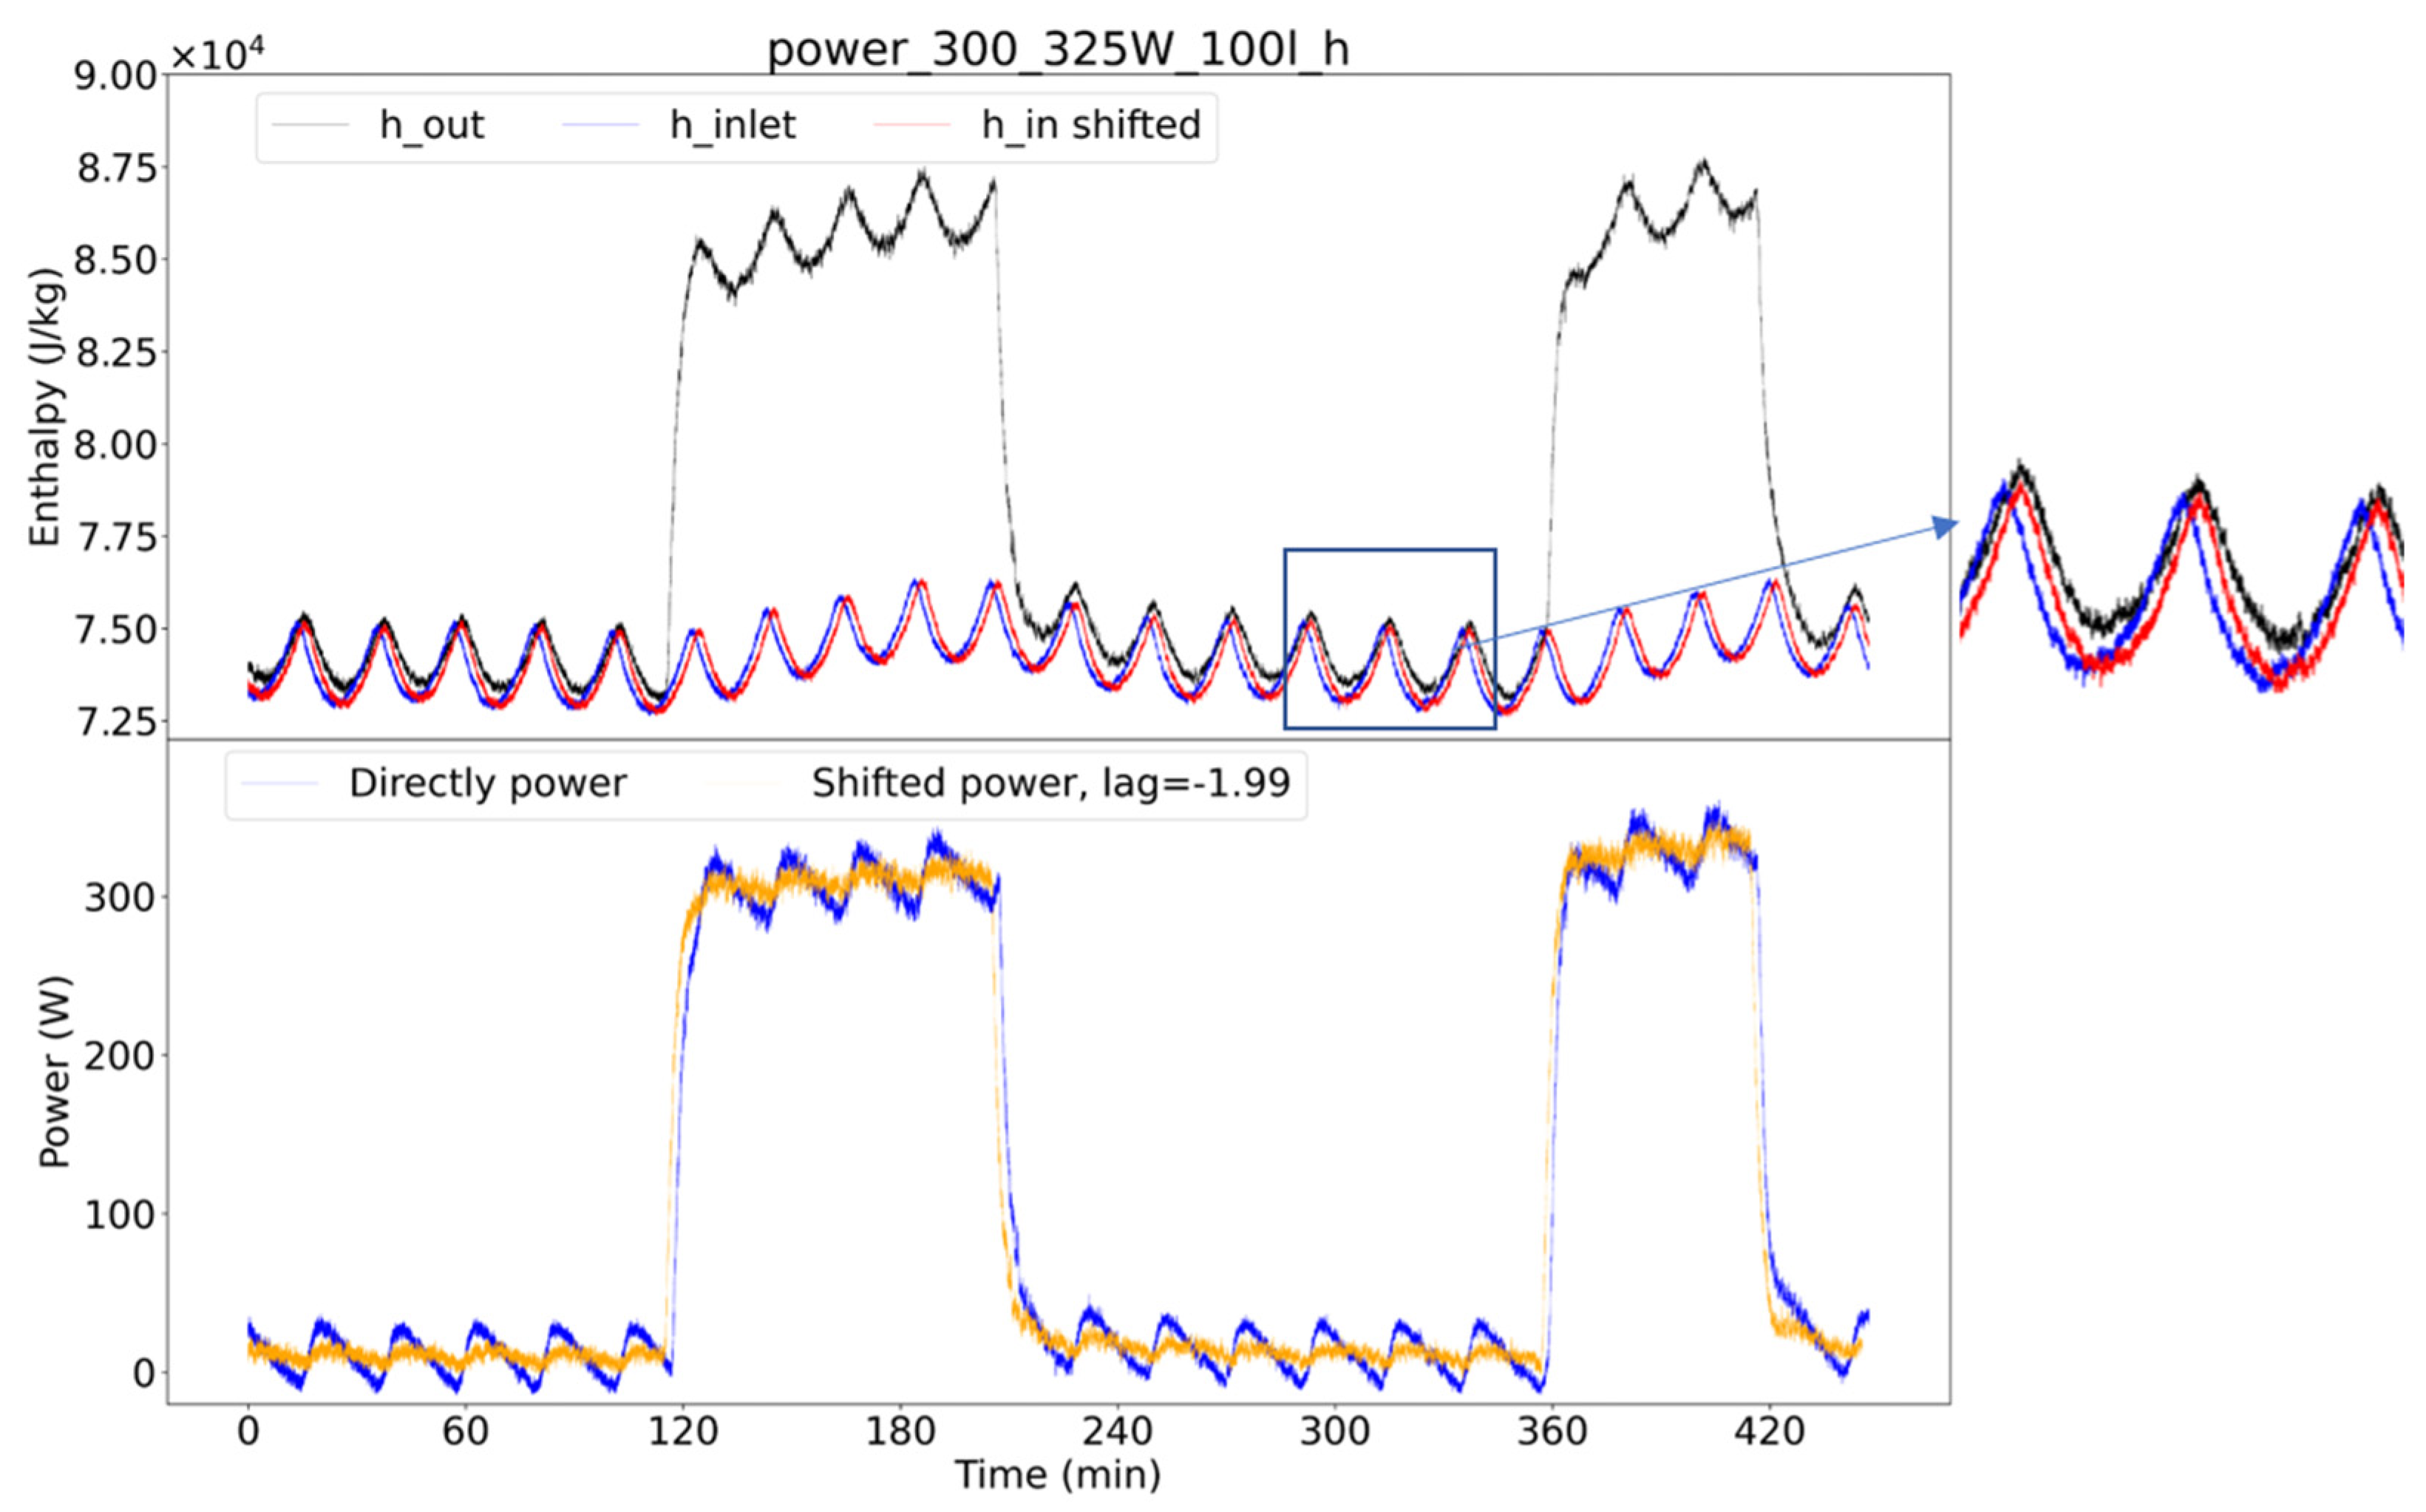
2.6.3. Calorimetric Evaluation of the Power Applied to the Mock-Up
3. Results
3.1. Consideration of the Evaluation of the Transported Power via the Calorimetric Method
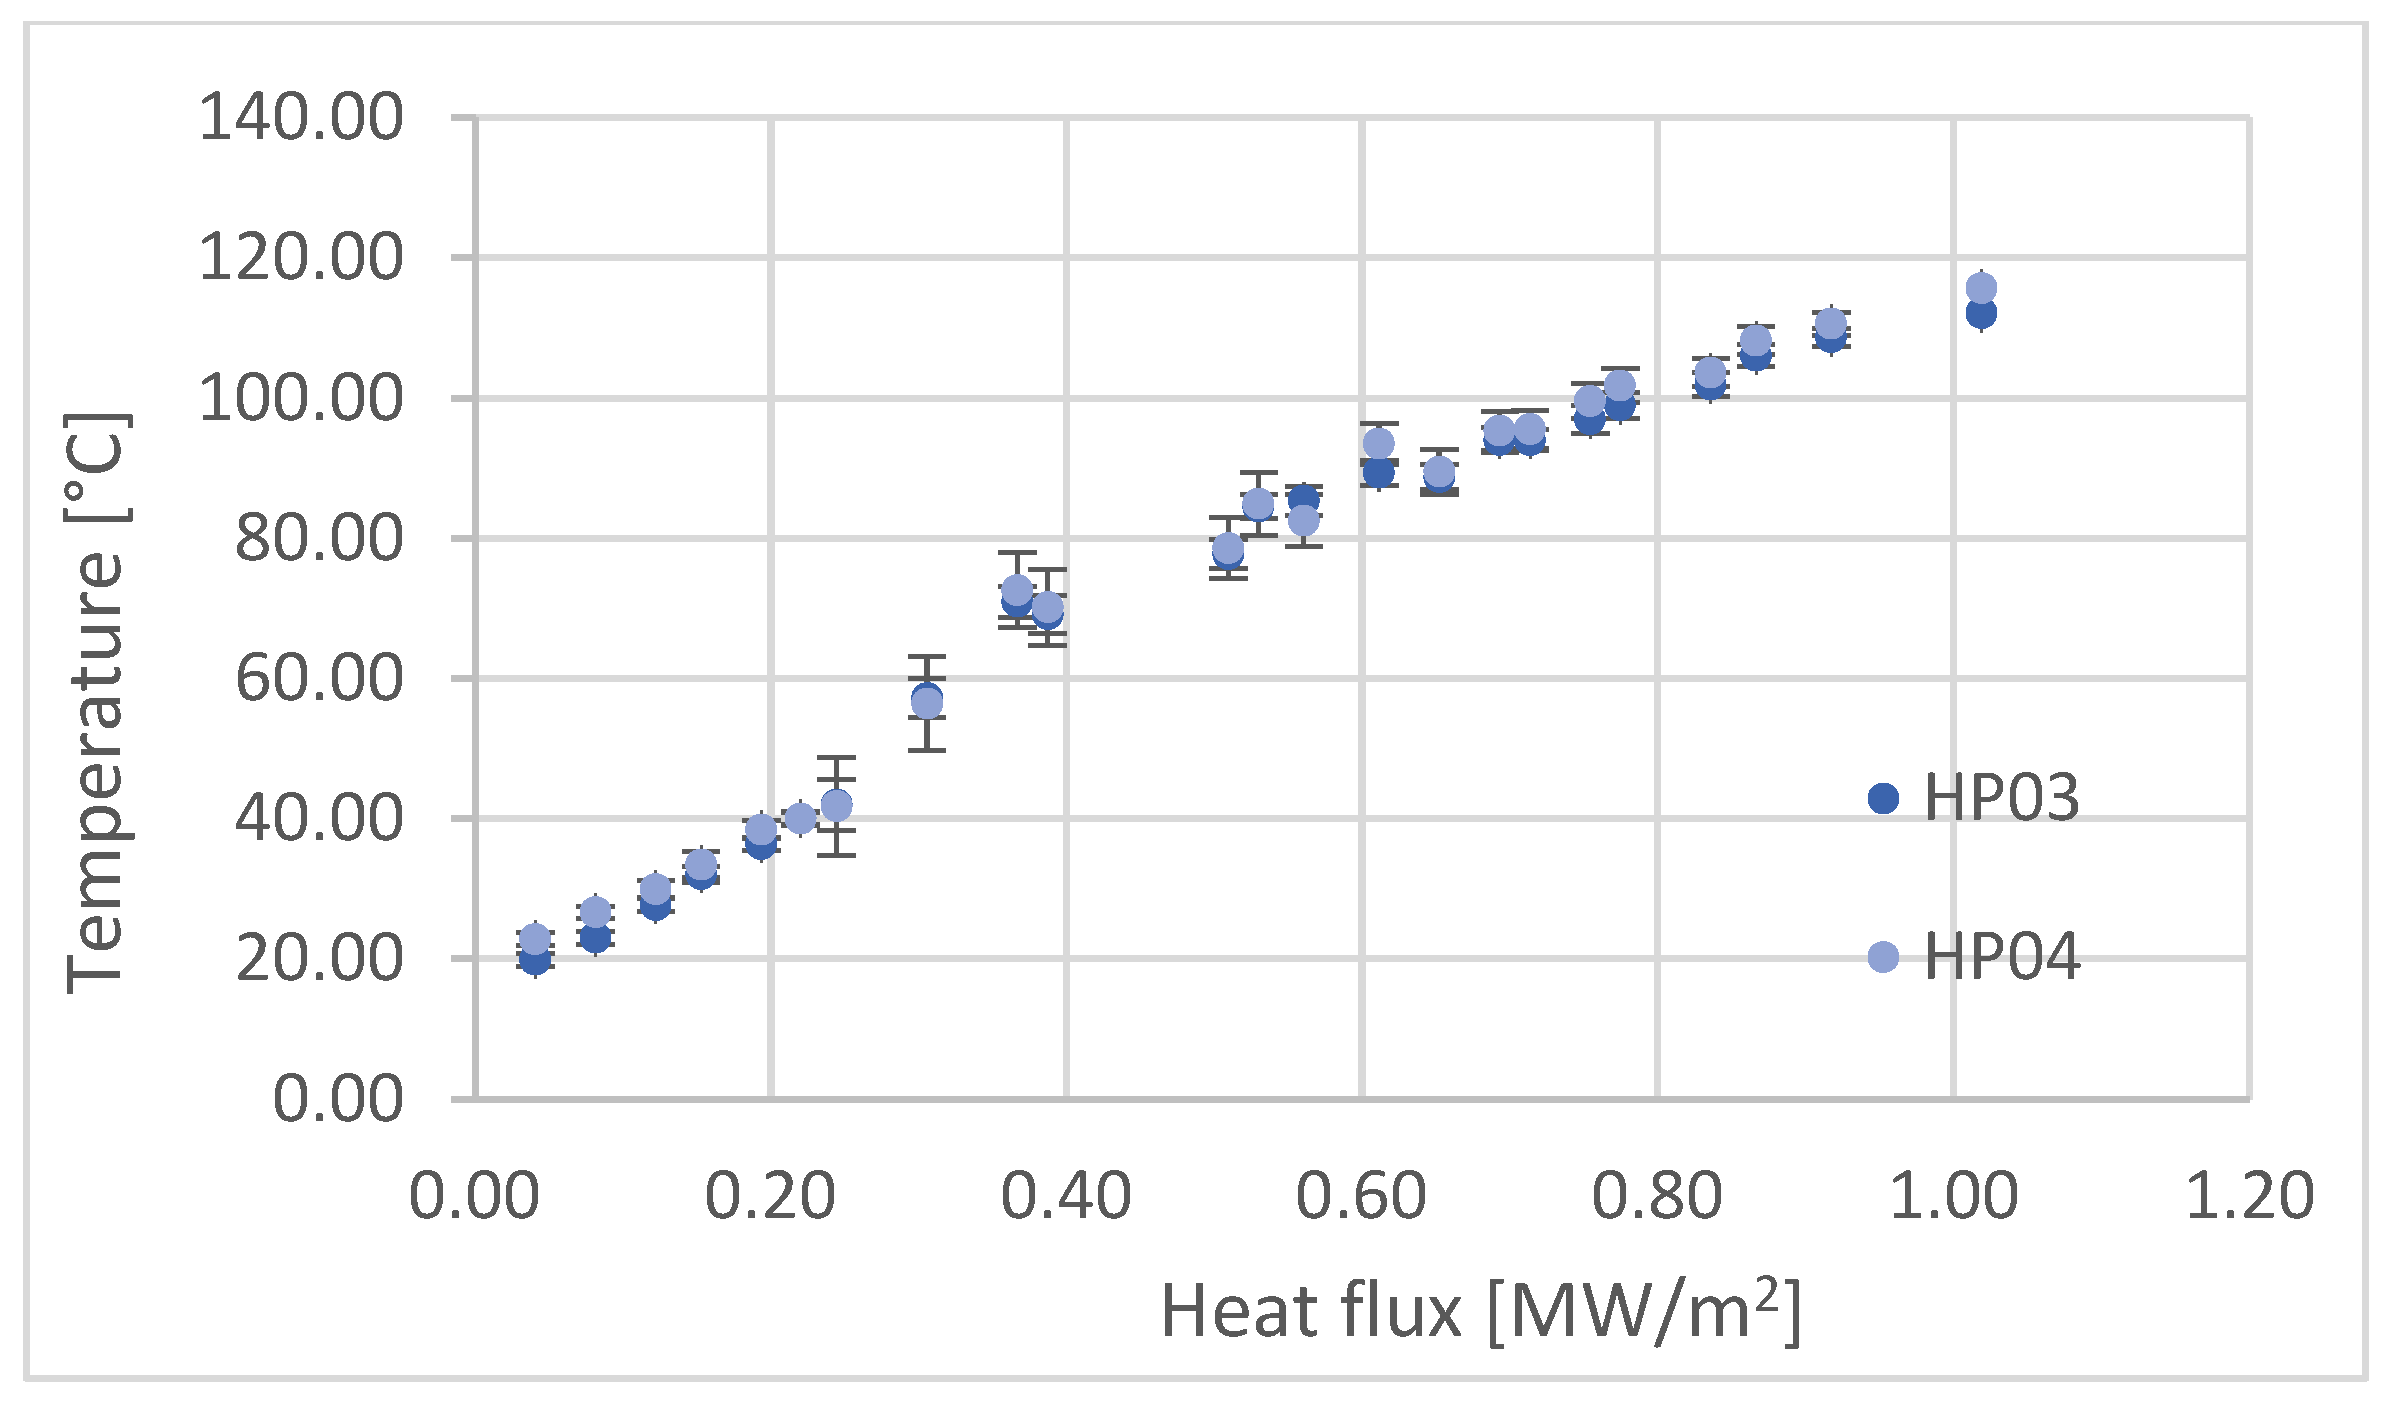
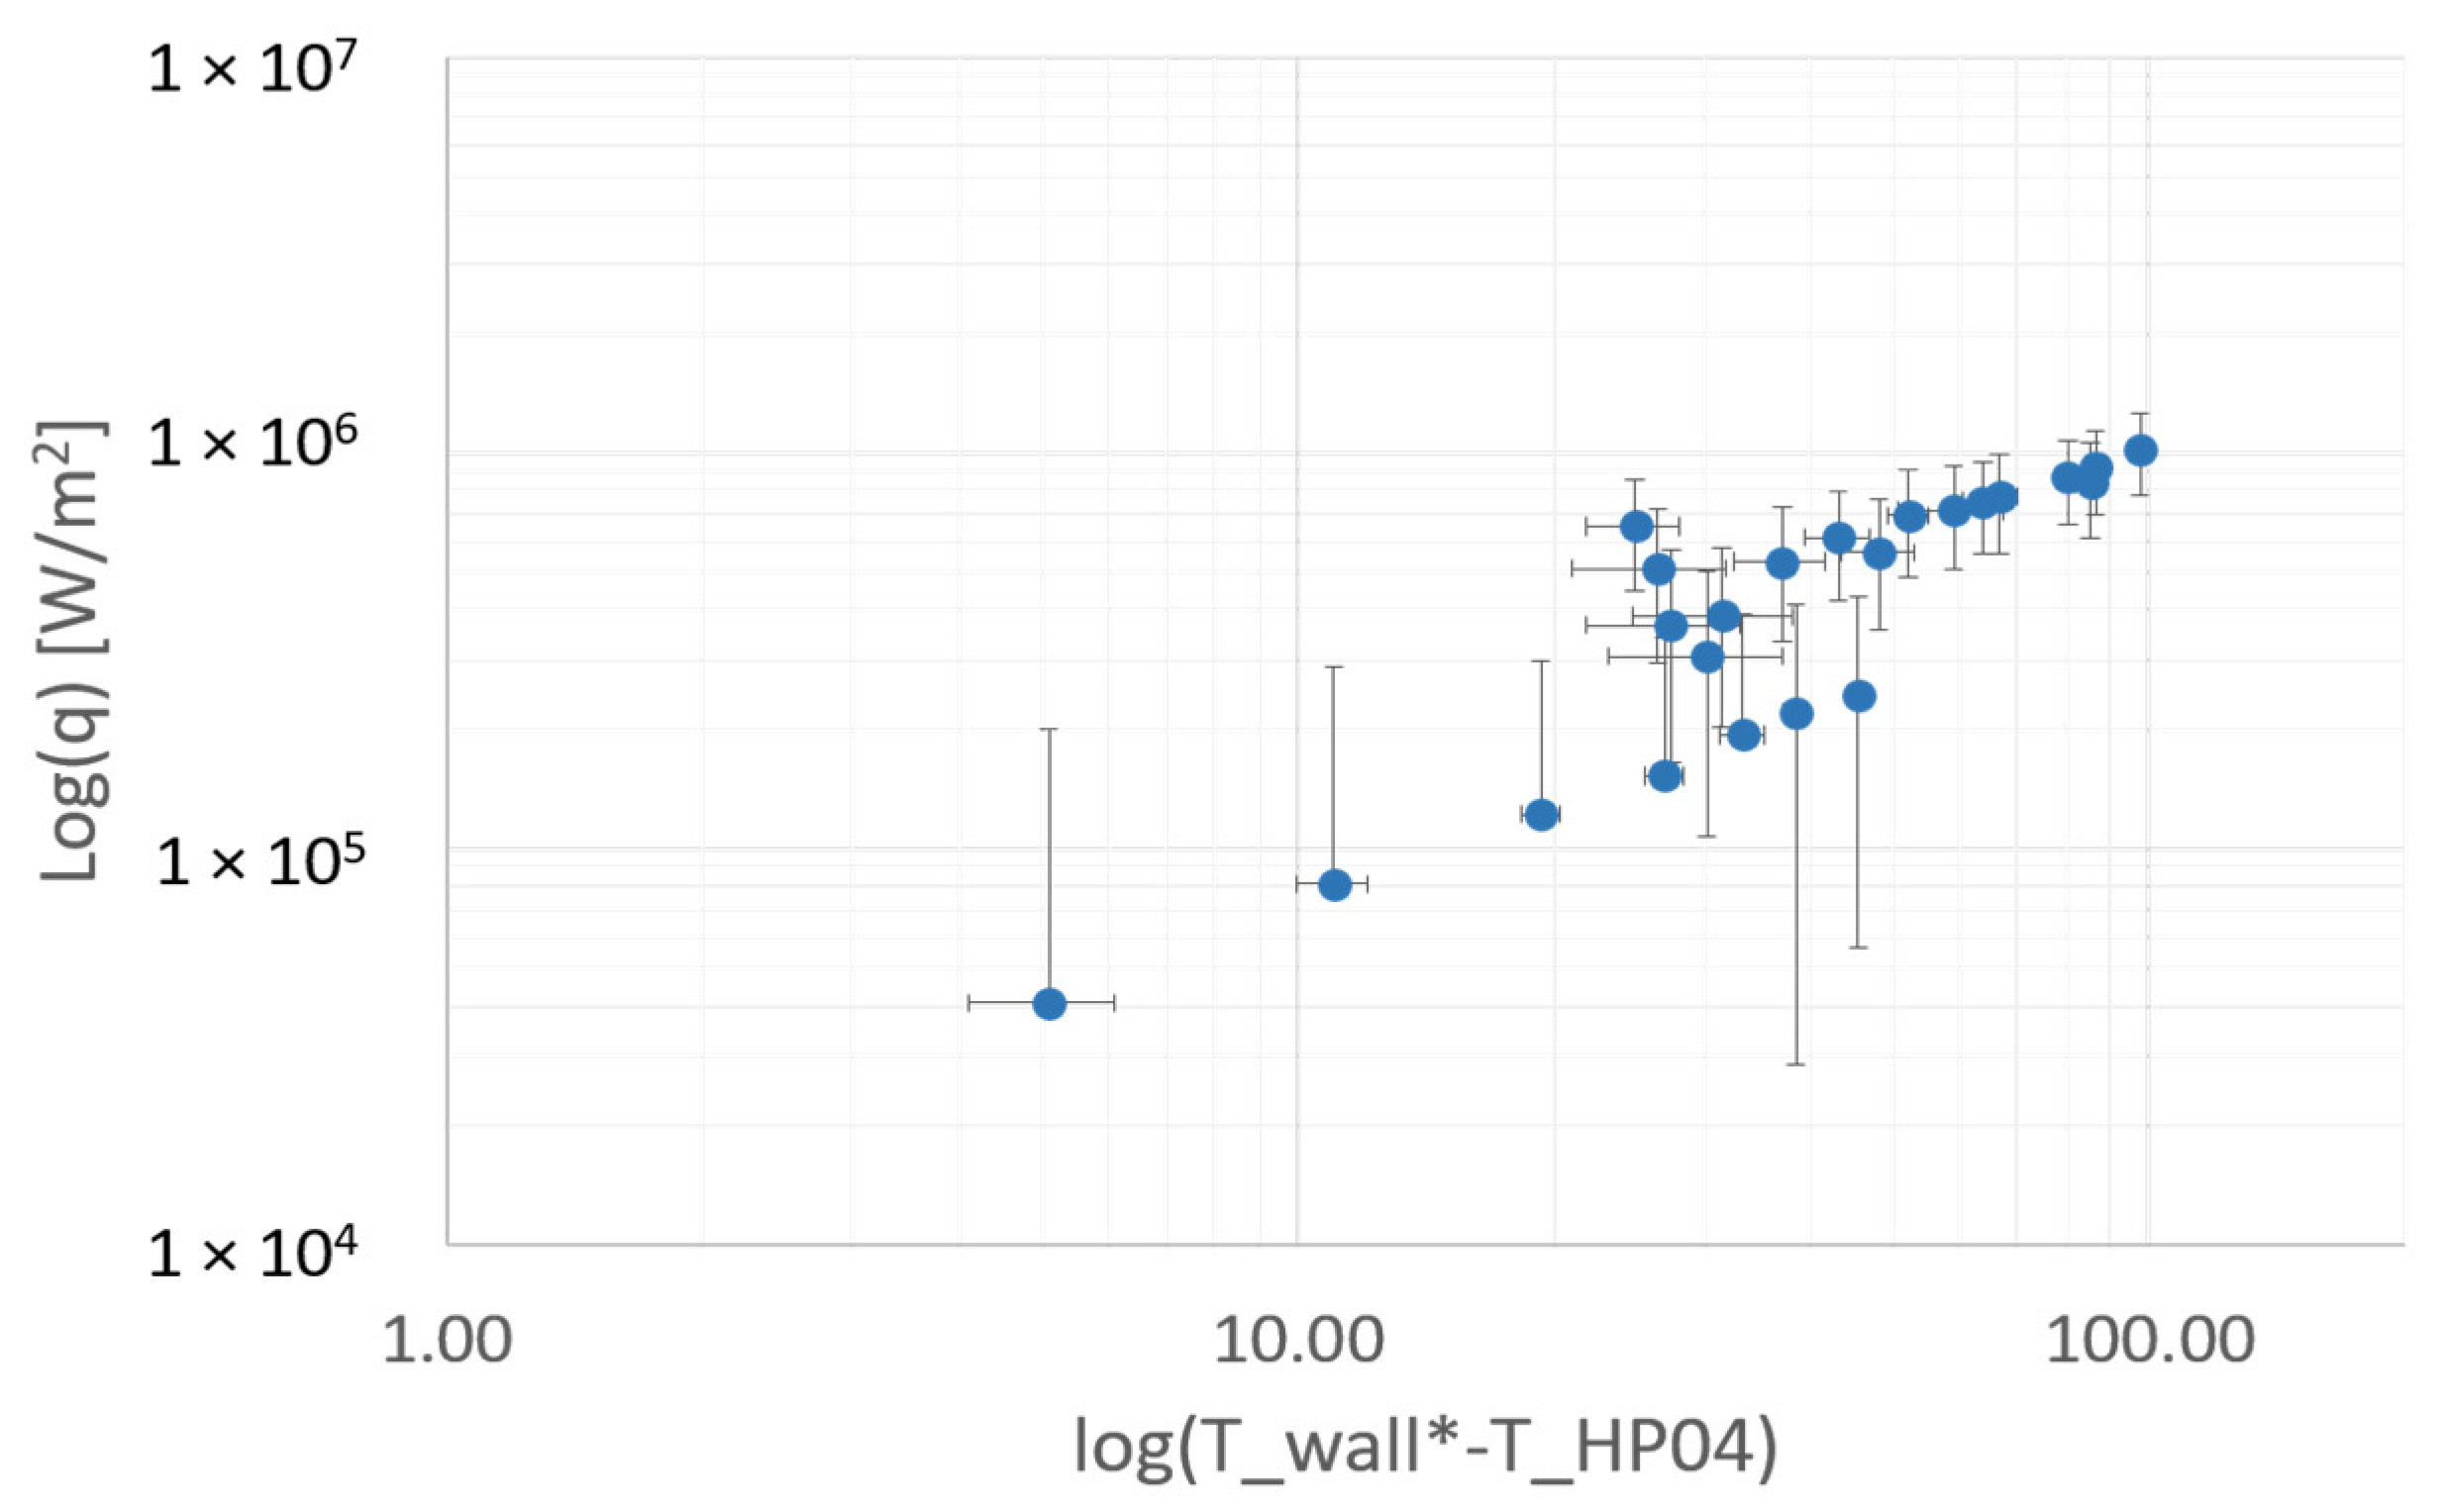
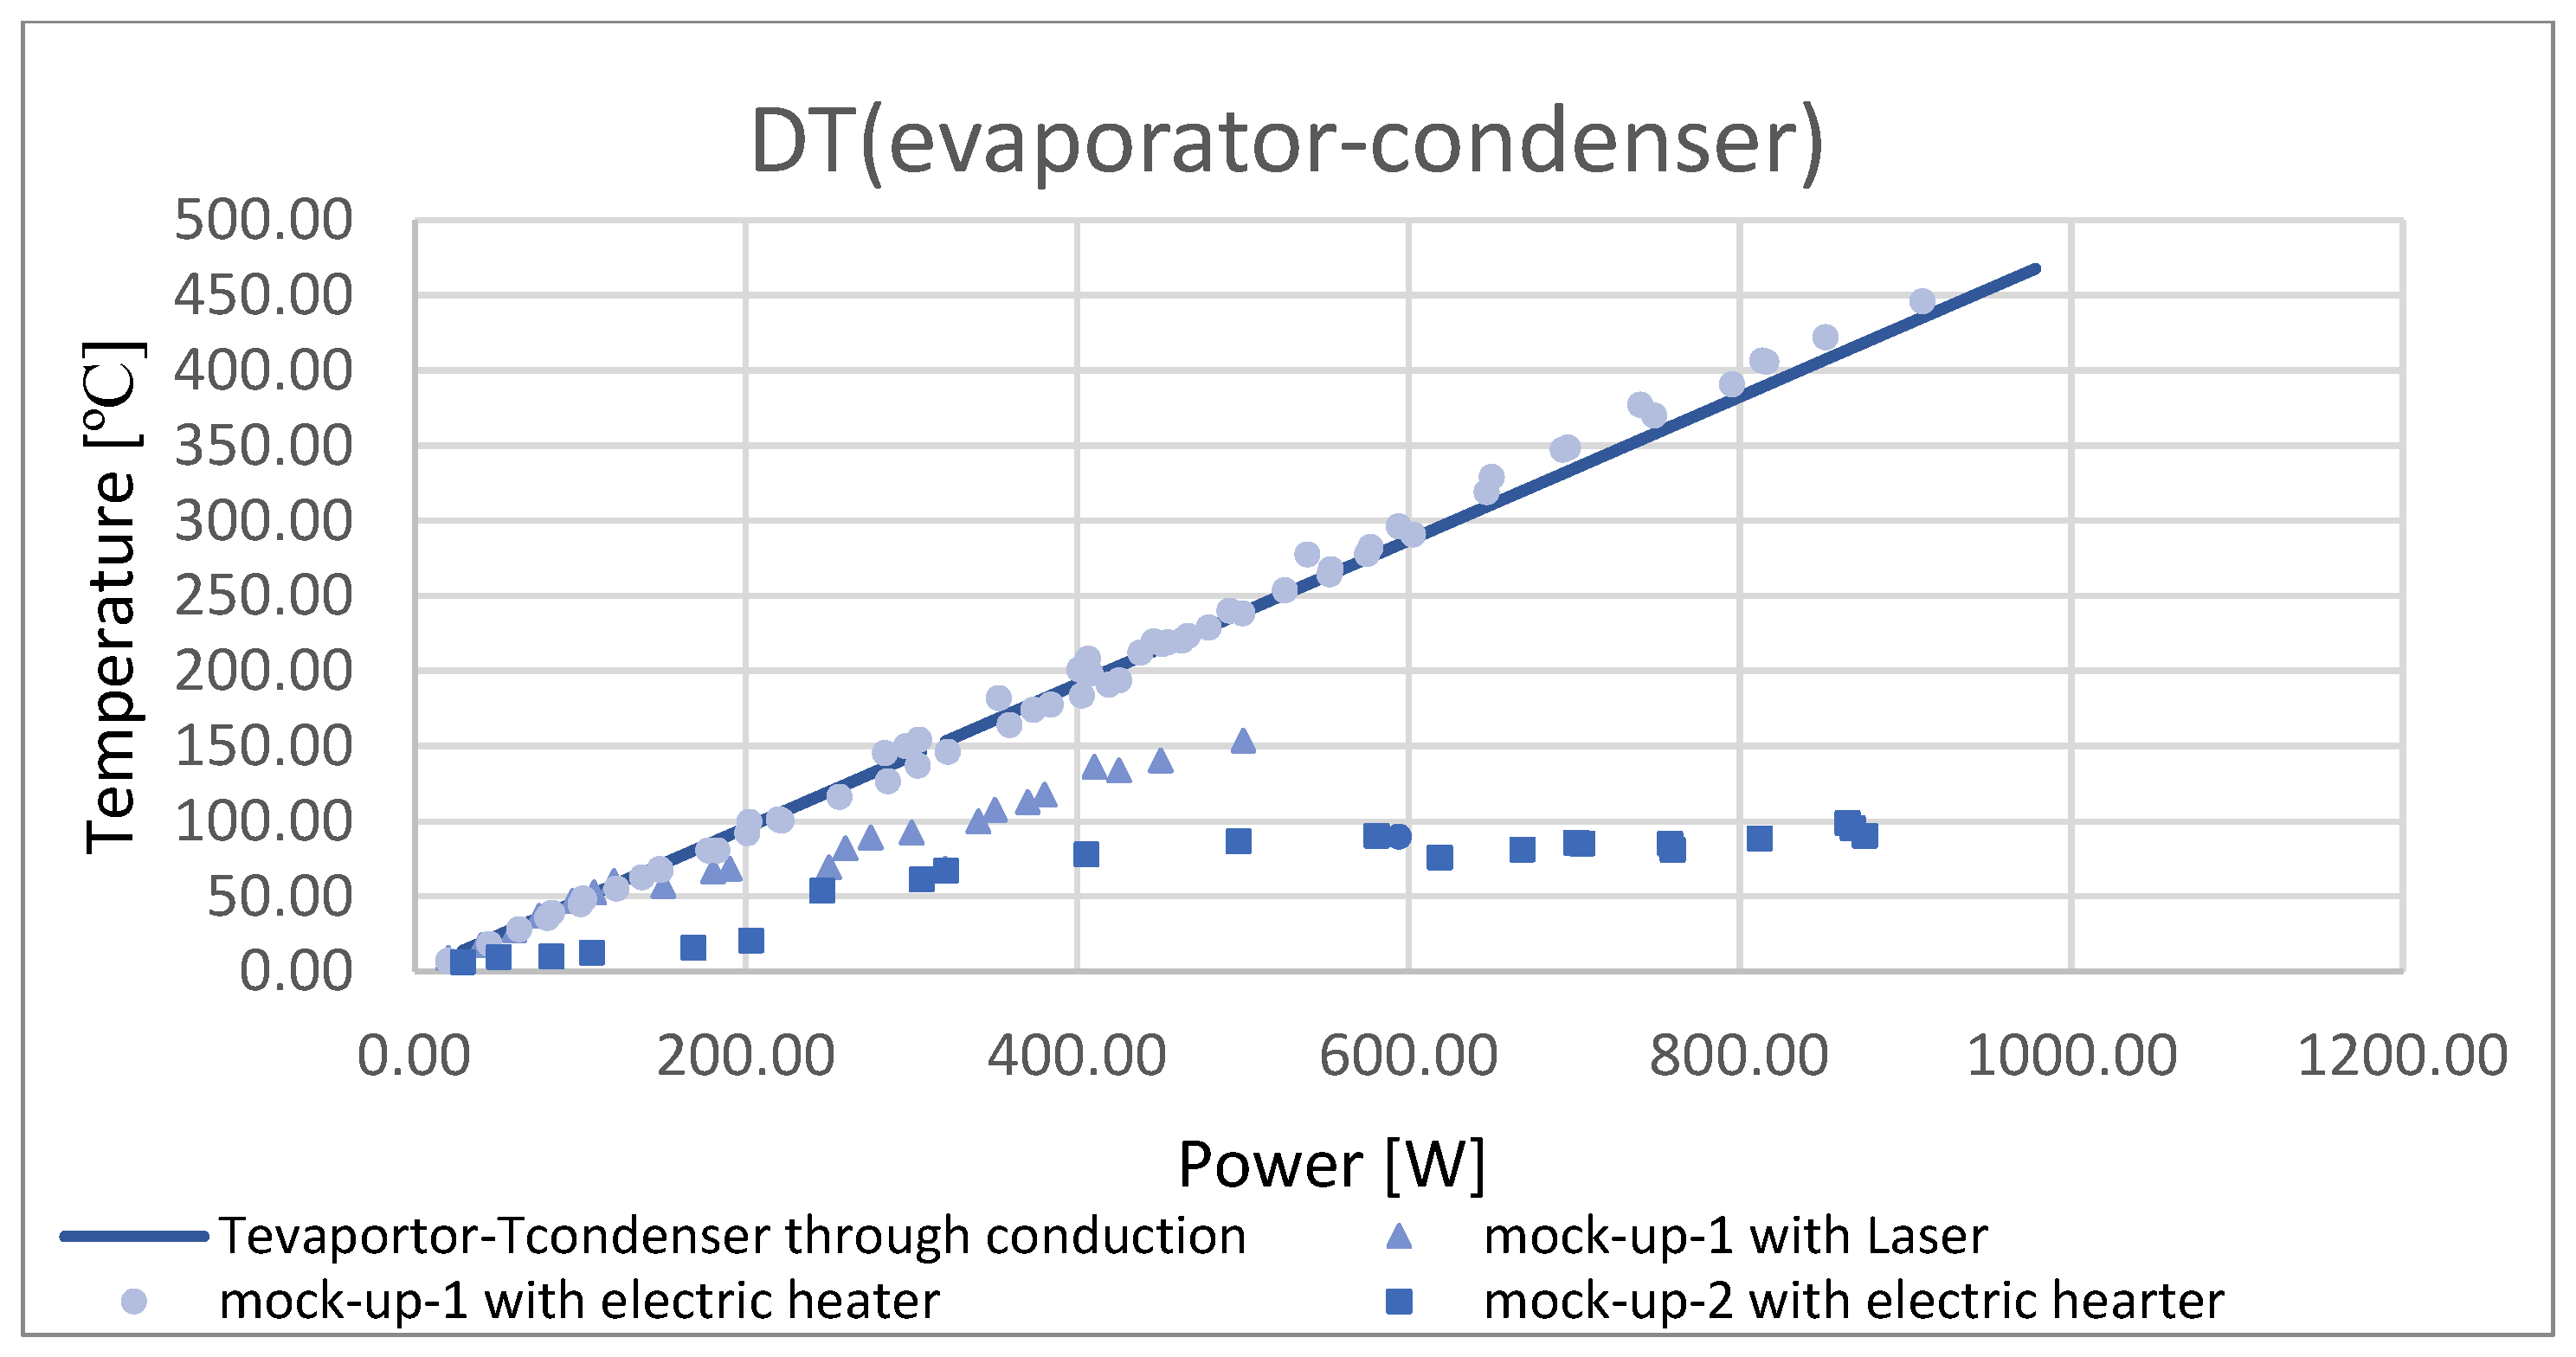
3.2. Temperature Measurements of Mock-Up-1 through the Laser Machine Test
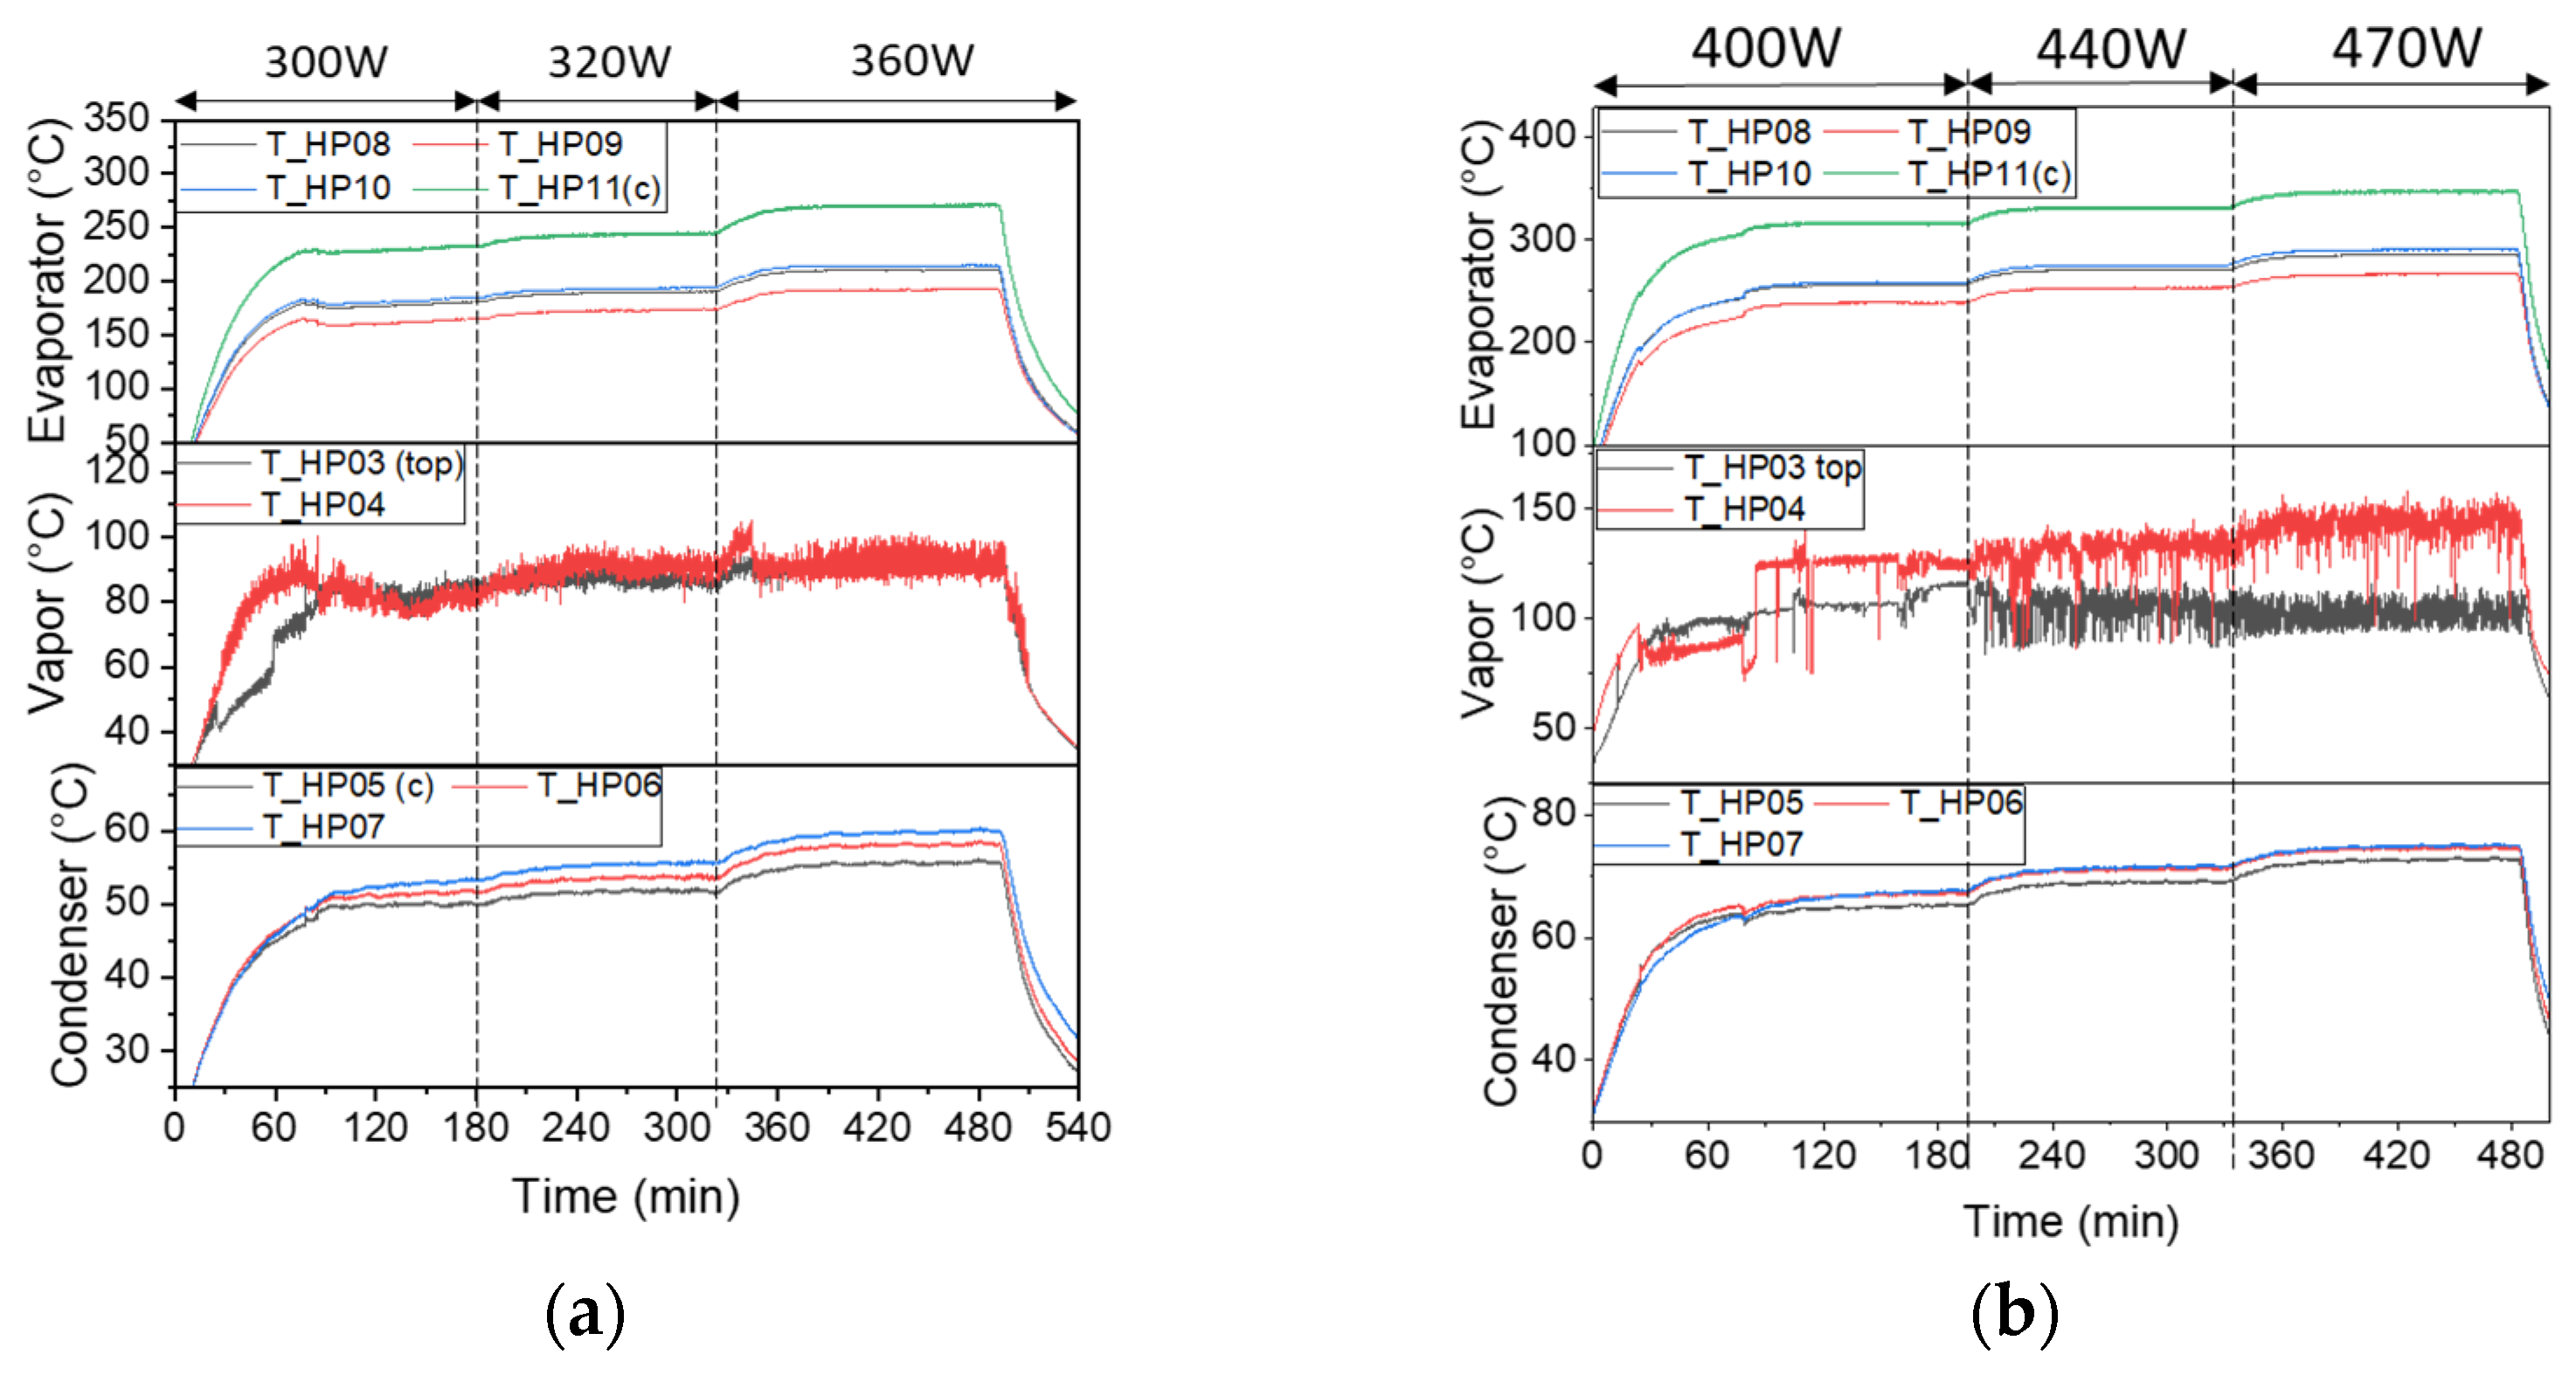
3.3. Temperature Measurements of Mock-Up-1 via the Electric Copper Heater Test
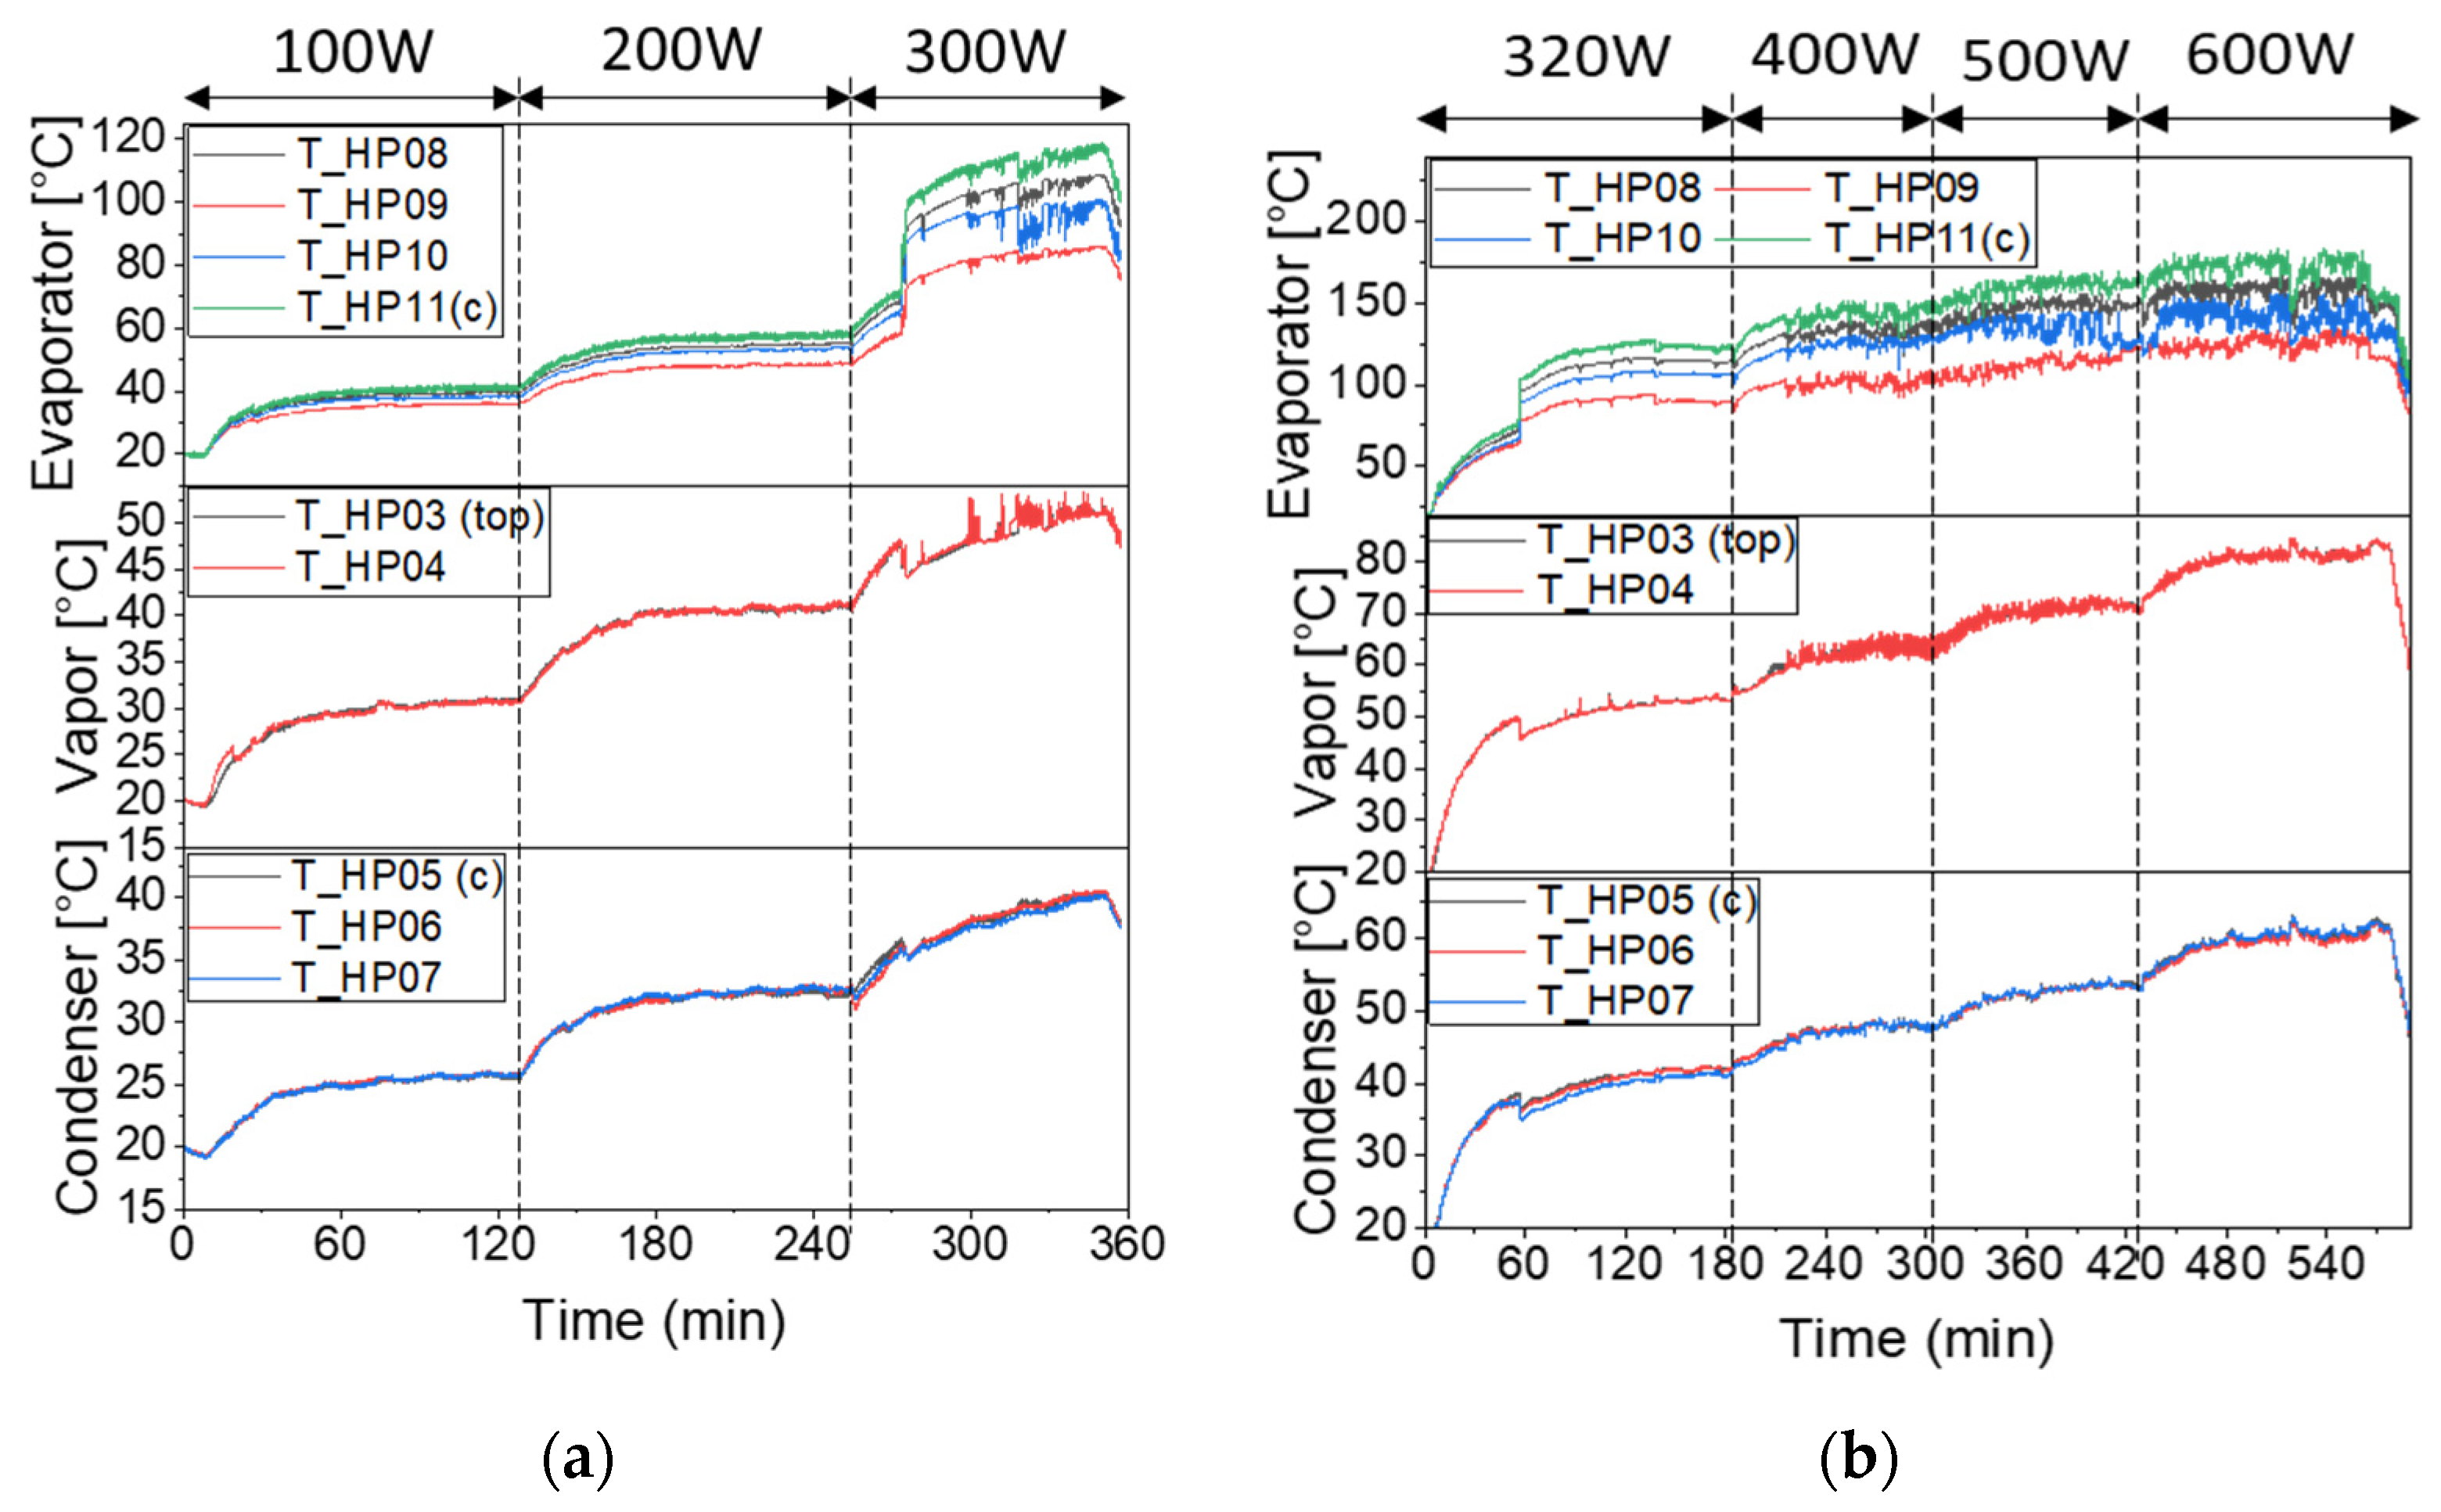
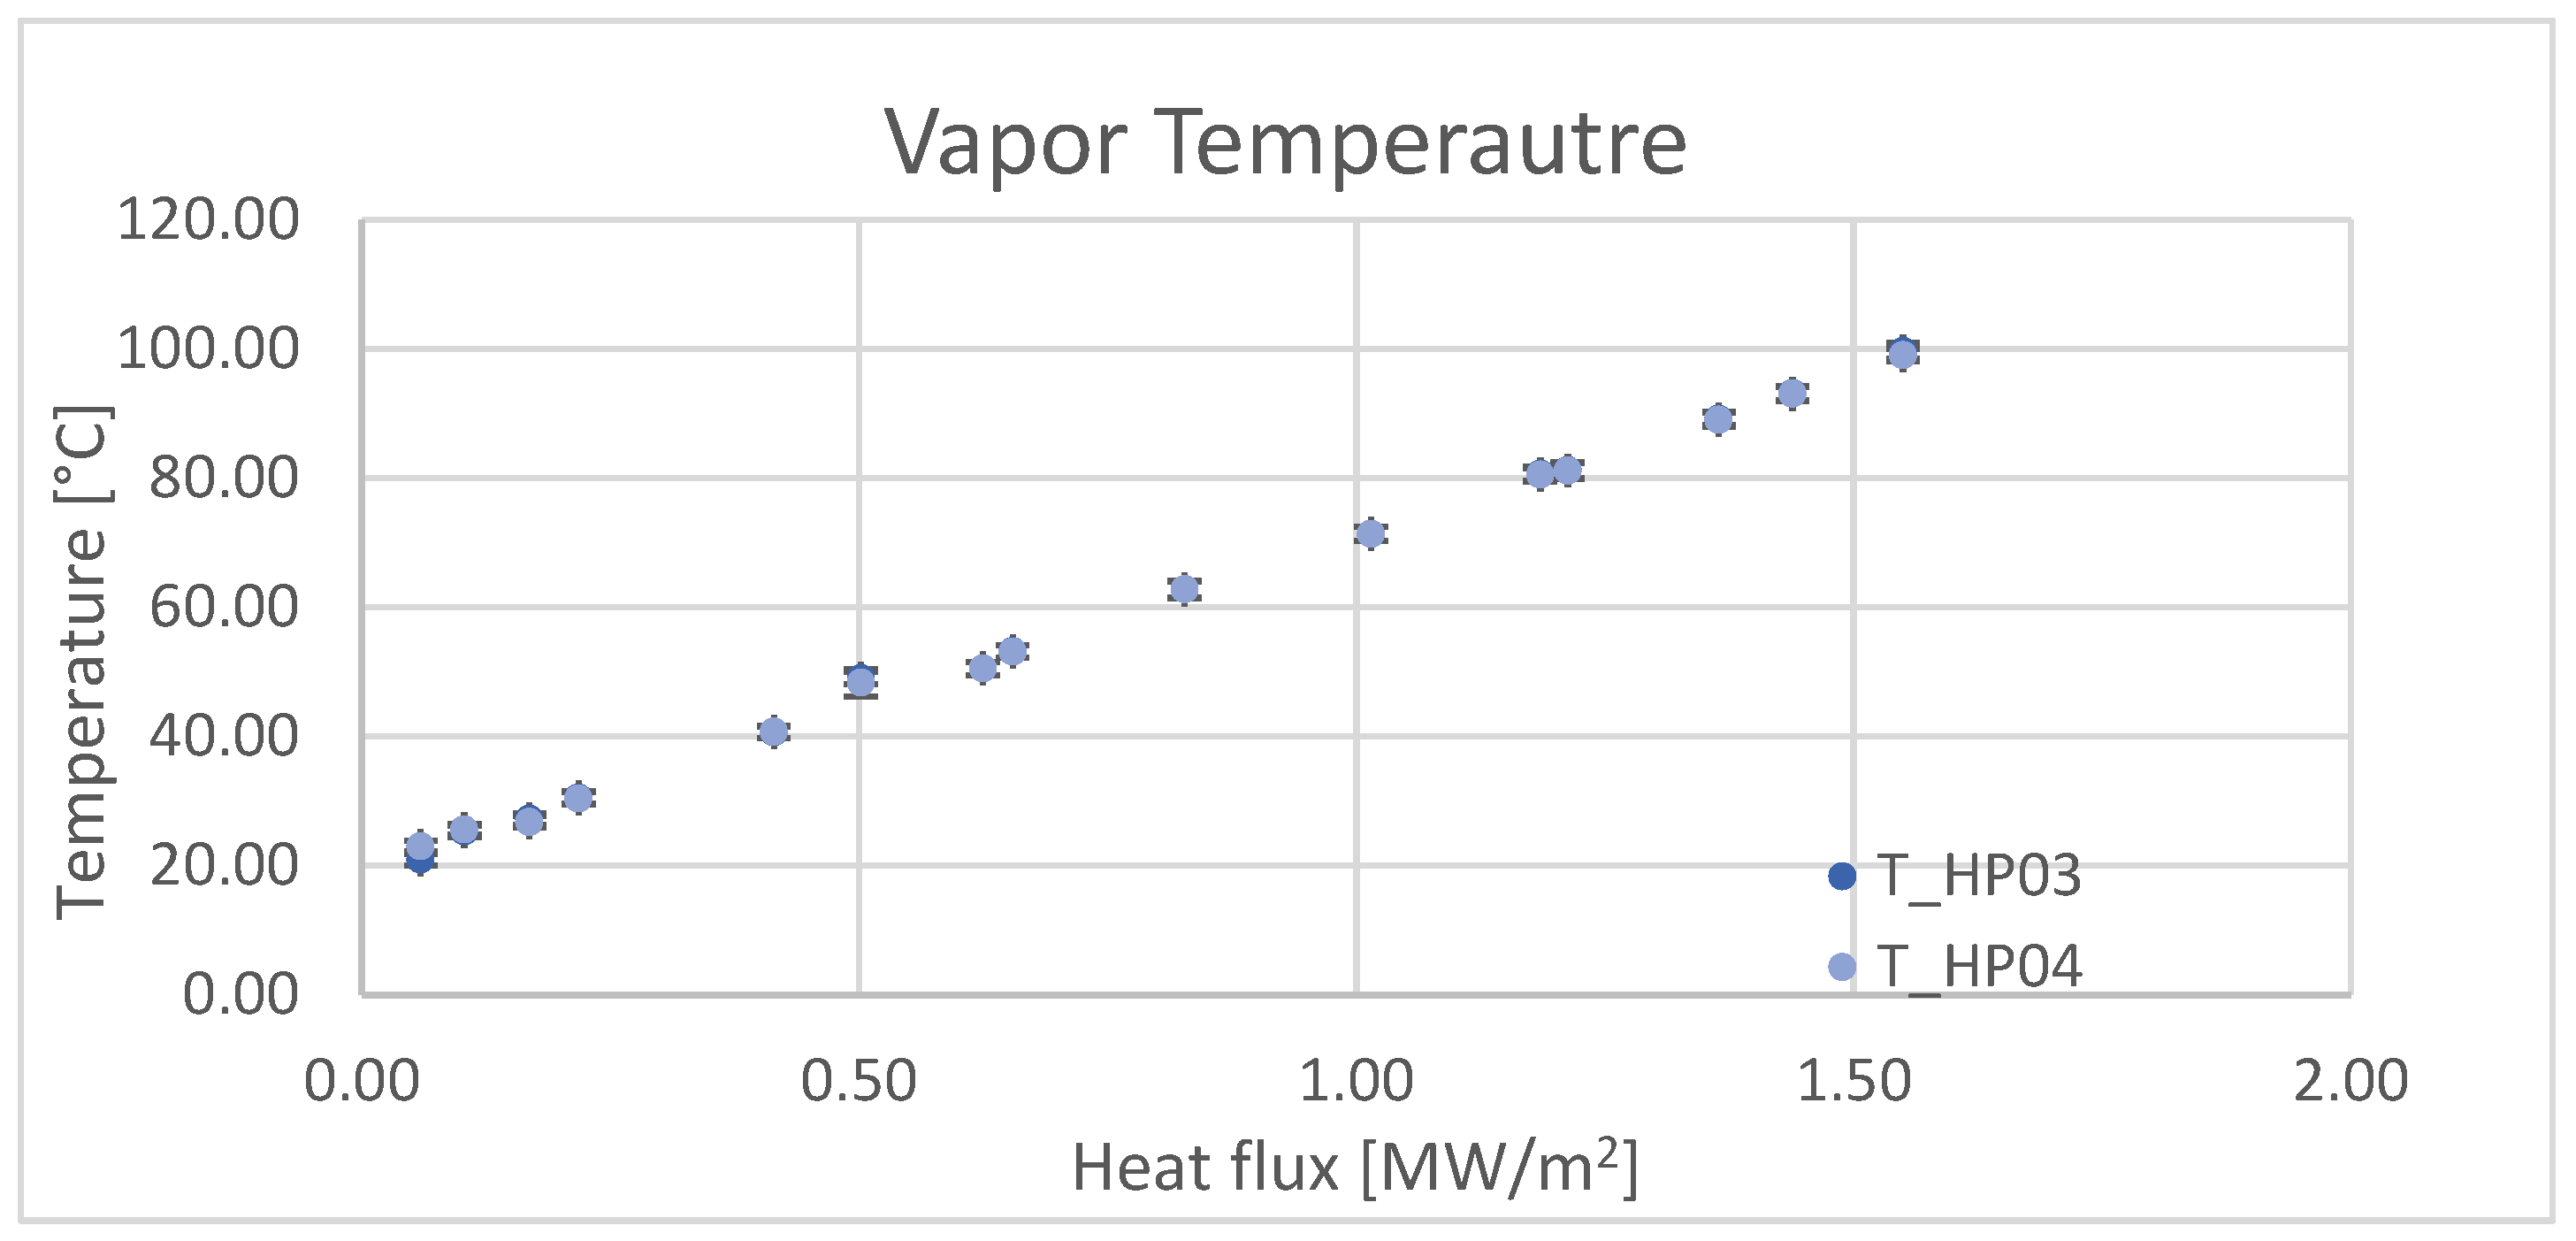
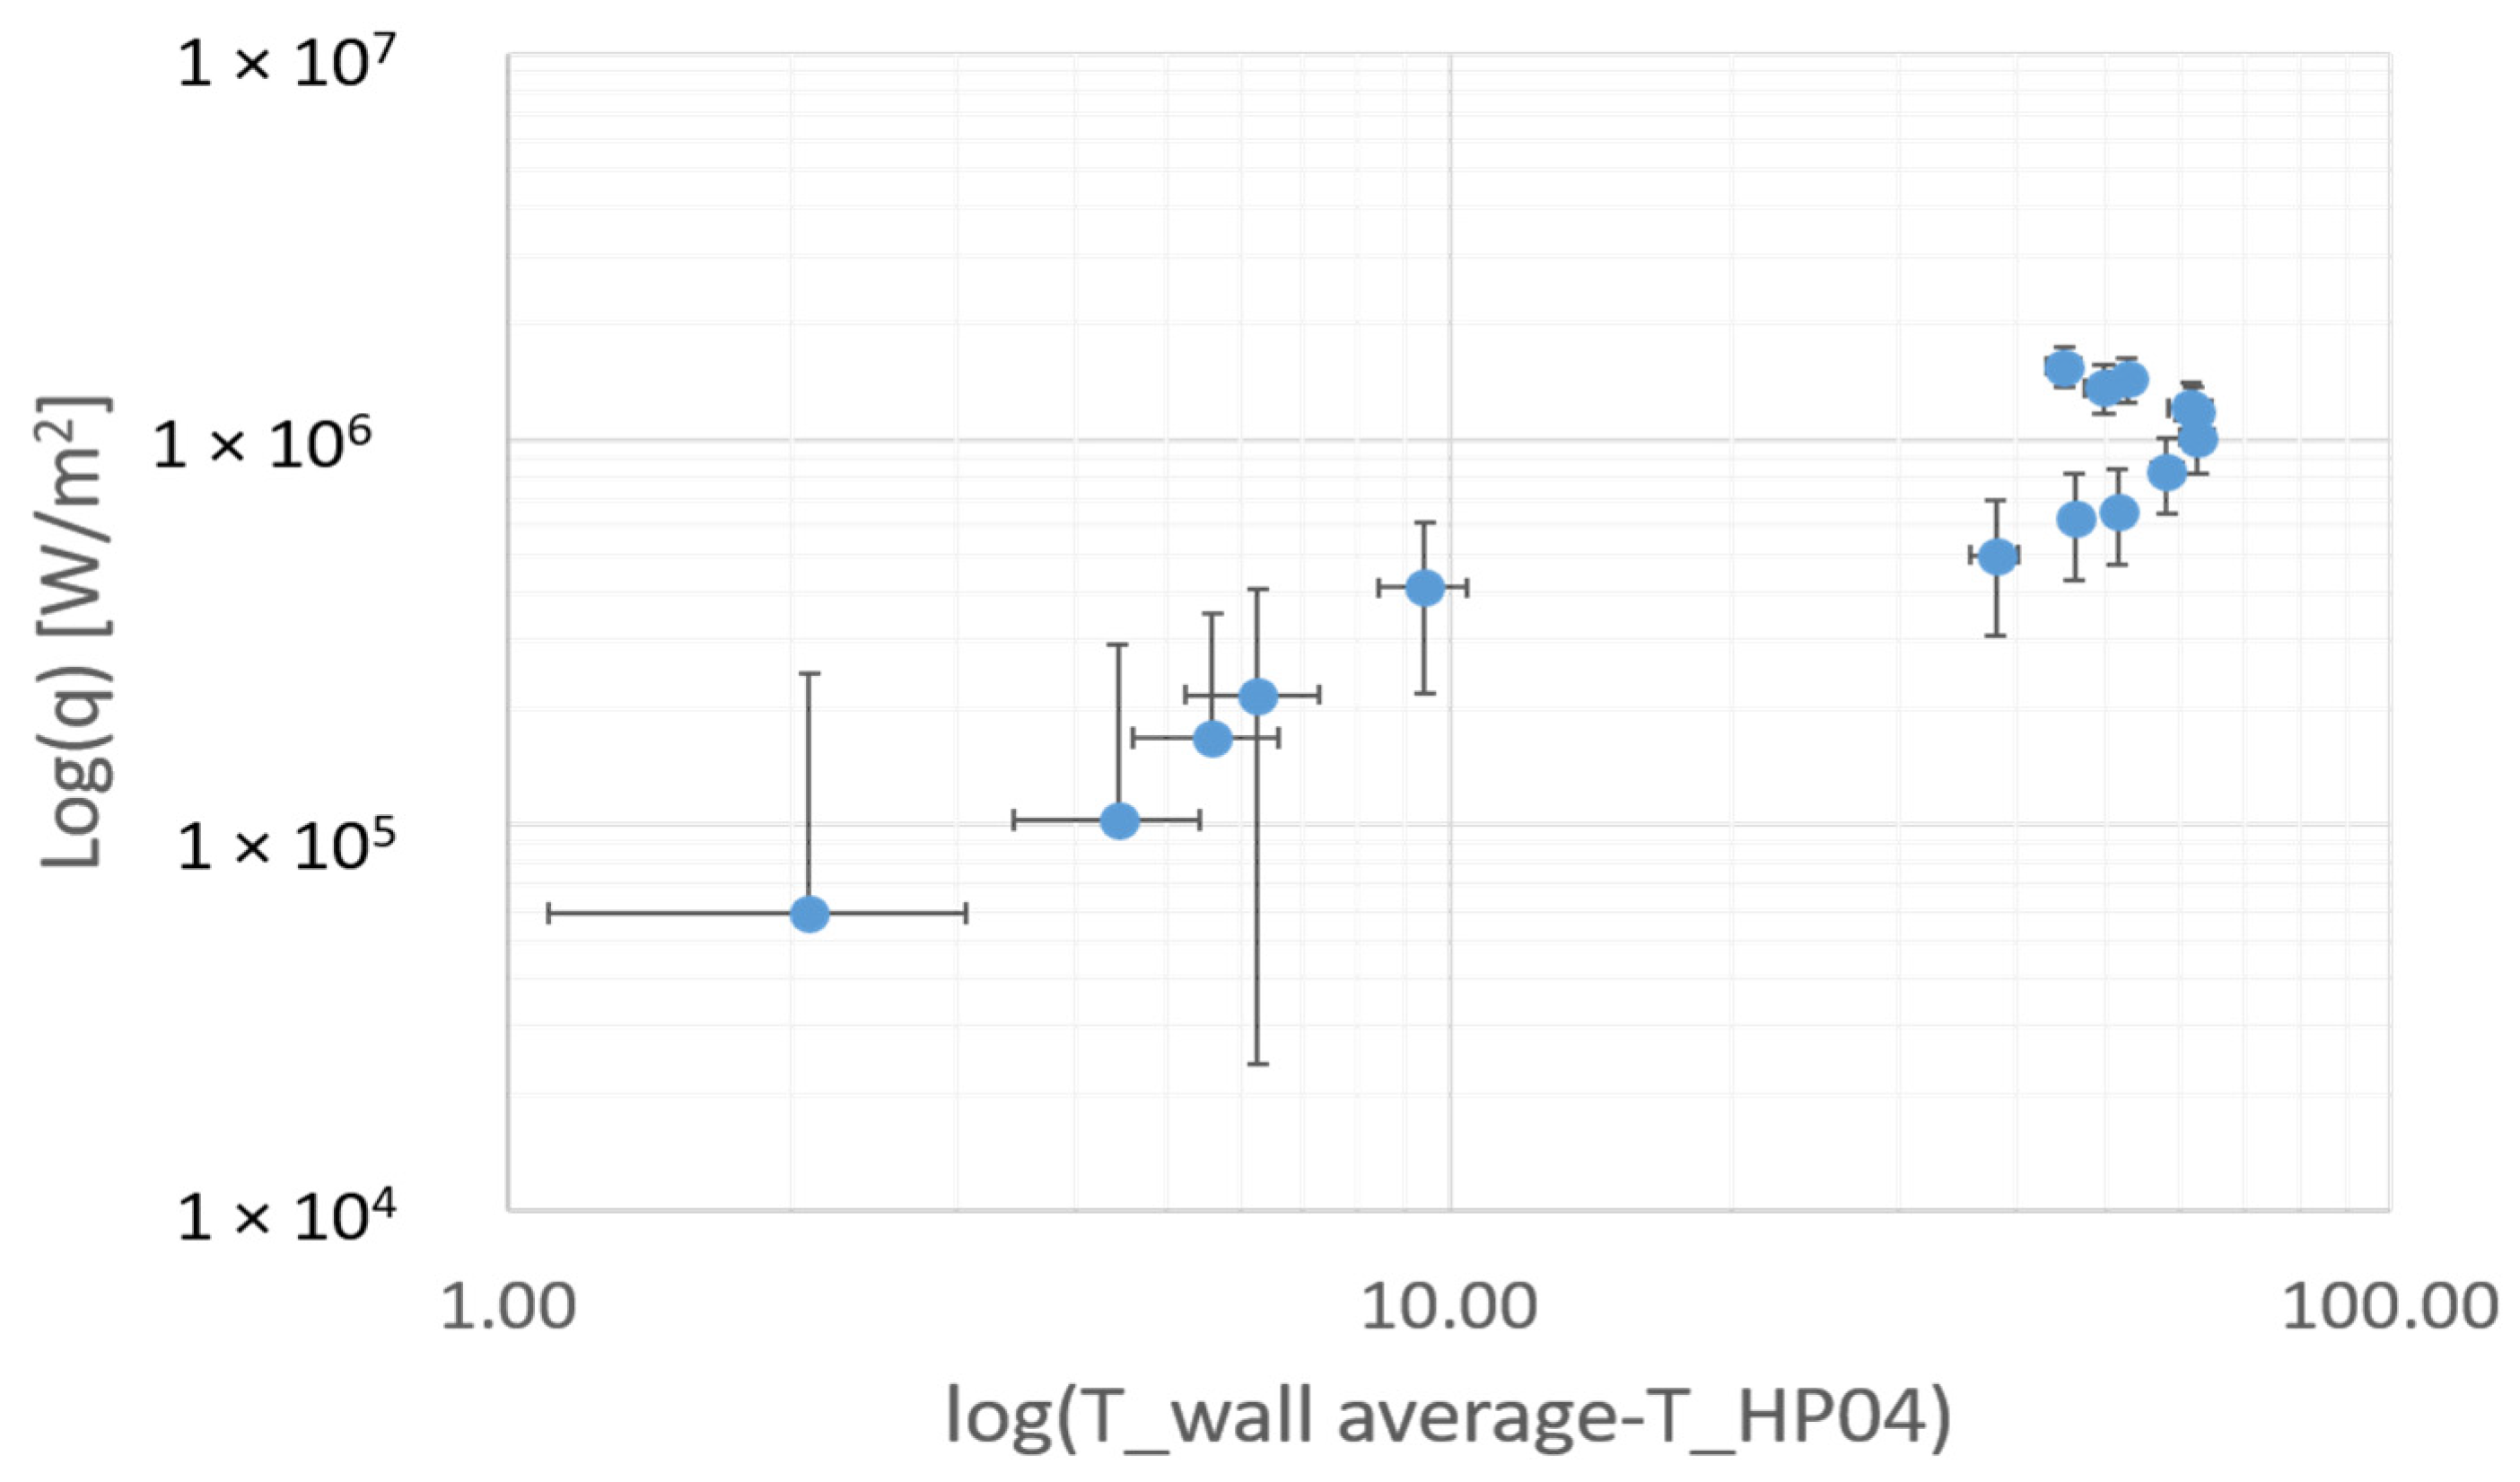
3.4. Temperature Measurements of Mock-Up-2 via the Electric Copper Heater Test
4. Conclusions
- The laser heat source can heat the evaporator immediately without requiring other heat transport material and can operate at a high heat flux level. However, the problem of alignment renders the heated surface difficult to control; further, this method is limited by the maximum laser window working temperature of 150 °C at 1 kW laser power. Above this temperature, the vacuum tightness is compromised due to the loss of the gasket’s elasticity and the signs of the deterioration of the window material, for which the latter had to be replaced.
- The electric copper heater can effectively heat the evaporator at the correct position. However, a very long time is required to reach a steady state for full power, and a stepwise application of the heating power to the mock-up is impossible. An electric copper heater’s maximum heat flux is around 2 MW/m2 due to its working temperature of 750 °C.
Author Contributions
Funding
Data Availability Statement
Conflicts of Interest
References
- You, J.H.; Visca, E.; Barrett, T.; Böswirth, B.; Crescenzi, F.; Domptail, F.; Fursdon, M.; Gallay, F.; Ghidersa, B.E.; Greuner, H.; et al. European Divertor Target Concepts for DEMO: Design Rationales and High Heat Flux Performance. Nucl. Mater. Energy 2018, 16, 1–11. [Google Scholar] [CrossRef]
- Makhankov, A.; Anisimov, A.; Arakelov, A.; Gekov, A.; Jablokov, N.; Yuditskiy, V.; Kirillov, I.; Komarov, V.; Mazul, I.; Ogorodnikov, A.; et al. Liquid Metal Heat Pipes for Fusion Application. Fusion Eng. Des. 1998, 42, 373–379. [Google Scholar] [CrossRef]
- Bolt, H.; Kohlhaas, W.; Duwe, R.; Gervash, A.; Linke, J.; Mazul, I. Heat Flux Experiments on Heat Pipes for Plasma Facing Applications. 1995. In Proceedings of the European Symposium on Fusion Technology (SOFT-18), Karlsruhe, Germany, 22–26 August 1994. [Google Scholar]
- Rosenfeld, J.; Lindemuth, J. Evaluation of Porous Media Heat Exchangers for Plasma Facing Components. Proc.—Symp. Fusion Eng. 1993, 2, 1210–1213. [Google Scholar] [CrossRef]
- Wen, W.; Ghidersa, B.E.; Hering, W.; Starflinger, J.; Stieglitz, R. Heat Pipe Technology Based Divertor Plasma Facing Component Concept for European DEMO. Fusion Eng. Des. 2021, 164. [Google Scholar] [CrossRef]
- Stephan, P. N5 Heat Pipes. In VDI Heat Atlas, 2nd ed.; Springer: Berlin/Heidelberg, Germany, 2010; pp. 1503–1514. [Google Scholar]
- Hwang, G.S.; Fleming, E.; Carne, B.; Sharratt, S.; Nam, Y.; Dussinger, P.; Ju, Y.S.; Kaviany, M. Multi-Artery Heat-Pipe Spreader: Lateral Liquid Supply. Int. J. Heat Mass Transf. 2011, 54, 2334–2340. [Google Scholar] [CrossRef]
- Guichet, V.; Jouhara, H. Condensation, Evaporation and Boiling of Falling Films in Wickless Heat Pipes (Two-Phase Closed Thermosyphons): A Critical Review of Correlations. Int. J. Thermofluids 2020, 1–2, 100001. [Google Scholar] [CrossRef]
- Schabel, W.; Martin, H. G10 Impinging Jet Flow Heat Transfer. In VDI Heat Atlas, 2nd ed.; Springer: Berlin/Heidelberg, Germany, 2010; pp. 745–751. [Google Scholar]
- Kretzschmar, H.-J.; Wagner, W. International Steam Tables, 3rd ed.; Springer: Berlin, Germany, 2019. [Google Scholar] [CrossRef]
- Carey, V.P. Chapter 7 Pool Boiling. In Liquid-Vapor Phase-Change Phenomena; CRC Press Taylor&Francis Group: New York, NY, USA, 2020; pp. 249–330. [Google Scholar]


| Parameters | Symbol | Value |
|---|---|---|
| Width of groove | w | 0.3 mm |
| Depth of groove in the evaporator | h | 0.65 mm |
| Number of grooves | Ng | 125 |
| Sintered porous configuration for mock-up-1 | ||
| Height of porous evaporator (Bronze) | he | 2 mm |
| The grain size of the sinter’s | rp | ~400 um |
| porosity | ε | 0.47 |
| Sintered porous configuration for mock-up-2 | ||
| Height of porous evaporator (Bronze) | he | 2 mm |
| The grain size of the sinter’s | rp | ~400 um |
| porosity | ε | 0.47 |
| Width of porous channels | wpc | 1 mm |
| Depth of porous channels | hpc | 1 mm |
| Number of porous channels and their length | Npc | 4 × 10 mm + 4 × 6 mm |
| Heat Load Range | Liquid Inventory |
|---|---|
| 0–1 MW/m2 | 1.5 mL |
| 1–5 MW/m2 | 2 mL |
| 5–20 MW/m2 | 2.5 mL |
| Parameters | Symbol | Value |
|---|---|---|
| The outer diameter of the evaporator | de,o | 33.4 mm |
| The inner diameter of the evaporator | de,i | 25 mm |
| The thickness of the evaporator wall (CuCrZr) | tt | 2 mm |
| Outer diameter of condenser | dcond | 60.3 mm |
| Inner diameter of condenser | db | 52 mm |
| The thickness of the condenser wall (CuCrZr) | tc | 10 mm |
| The inner height of the adiabatic zone | had | 75 mm |
| Incision angle | β | 19.5° |
| Evaporator protect plate (W) | tw | 2 mm |
| Parameters | Symbol | Value |
|---|---|---|
| The inlet temperature of the coolant | θin | 20 °C |
| Pressure | p | 4 Bar |
| The inner diameter of the coolant pipe | dcoolant | 60.3 mm |
| The thickness of the coolant box wall (steel) | tcool | 4 mm |
| Number of jets | Nn | 7 |
| The inner diameter of the jet | D | 3 mm |
| Distance between jet and bottom of FHP | H | 15 mm |
| Component | Location | Model | Accuracy |
|---|---|---|---|
| Temperature T-01 | Coolant inlet | RTD | ±(0.15 + 0.002 ×|T|) (Class A) [DIN43760] |
| Temperature T-02 | Coolant outlet | RTD | |
| Pressure P-01 | Coolant inlet | PM-5060-C | ≤±0.5% of span [IEC 61298-2] |
| Pressure P-02 | Coolant outlet | PM-5060-C | |
| The volume flow rate sensor F-01 | Coolant outlet | H250 M40 | 1.6% of measured value VDI/VDE 3513-2 |
Disclaimer/Publisher’s Note: The statements, opinions and data contained in all publications are solely those of the individual author(s) and contributor(s) and not of MDPI and/or the editor(s). MDPI and/or the editor(s) disclaim responsibility for any injury to people or property resulting from any ideas, methods, instructions or products referred to in the content. |
© 2023 by the authors. Licensee MDPI, Basel, Switzerland. This article is an open access article distributed under the terms and conditions of the Creative Commons Attribution (CC BY) license (https://creativecommons.org/licenses/by/4.0/).
Share and Cite
Wen, W.; Ghidersa, B.-E.; Hering, W.; Starflinger, J.; Stieglitz, R. Heat Pipe-Based DEMO Divertor Target Concept: High Heat Flux Performance Evaluation. J. Nucl. Eng. 2023, 4, 278-296. https://doi.org/10.3390/jne4010021
Wen W, Ghidersa B-E, Hering W, Starflinger J, Stieglitz R. Heat Pipe-Based DEMO Divertor Target Concept: High Heat Flux Performance Evaluation. Journal of Nuclear Engineering. 2023; 4(1):278-296. https://doi.org/10.3390/jne4010021
Chicago/Turabian StyleWen, Wen, Bradut-Eugen Ghidersa, Wolfgang Hering, Jörg Starflinger, and Robert Stieglitz. 2023. "Heat Pipe-Based DEMO Divertor Target Concept: High Heat Flux Performance Evaluation" Journal of Nuclear Engineering 4, no. 1: 278-296. https://doi.org/10.3390/jne4010021