Article

Development of the W7-X Alkali Metal Beam Diagnostic Observation System for OP2

1
Centre for Energy Research, 1121 Budapest, Hungary
2
Max-Planck-Institute for Plasma Physics, 17491 Greifswald, Germany
*
Author to whom correspondence should be addressed.
Collaborators/Membership of the W7-X Team is provided in the Acknowledgments.
J. Nucl. Eng. 2023, 4(1), 142-151; https://doi.org/10.3390/jne4010010
Submission received: 29 October 2022 / Revised: 8 January 2023 / Accepted: 11 January 2023 / Published: 18 January 2023

Abstract

:
On a Wendelstein 7-X (W7-X), an alkali metal beam (AMB) diagnostic system was installed in order to measure the plasma edge electron density profiles and turbulence transport. A sodium beam was injected in the plasma, and the light emission was observed by an optical system. During the last operation phase, OP1.2b campaign trial spectral measurements were performed with a dedicated optical branch. The results showed the emergence of potential CX lines in the light spectra during sodium injection. The lines were identified as Carbon III, which were the dominant lines observed by other diagnostics at the edge plasma. Based on these results, an additional dedicated optical system was developed and installed in 2021 for the upcoming operational phase, OP2. The optics were designed for multiple purposes: spectral measurements for the AMB system and for a He/Ne gas jet. The system was designed to allow implementation of further diagnostics on this port later (e.g., coherence imaging system). The details of the implementation of the design requirements and the main challenges of the manufacturing process and installation are discussed in this paper.

1. Introduction

Beam Emission Spectroscopy (BES) is a key nonperturbative diagnostic technique used for electron density and turbulence transport measurements at the plasma edge of magnetic fusion devices. In addition to the good spatial resolution (a few mm), an excellent time resolution (around 20 μ s) can be achieved by BES diagnostics. The classical BES configuration uses the light emitted through the plasma interaction with the neutral beam heating [1,2]. On the other hand, alkali metal beam (AMB) spectroscopy (also called alkali beam emission spectroscopy (ABES) or atomic beam probe (ABP) spectroscopy) utilizes the interaction between the plasma constituents and the high-energy alkaline atoms injected into the plasma. The effectiveness of the latter concept lies in its flexibility and, according to current diagnostic systems, in keeping the quasi nonperturbative property of the BES. Due to these advantages, AMB diagnostics are used in almost every current tokamak and stellarator experiment (e.g., ASDEX Upgrade [3]; JET [4]; LHD [5]; COMPASS [6]; KSTAR [7]; EAST [8,9]; W7-X [10]).
The working principle of an AMB diagnostic system is the following: lithium or sodium ions are extracted from a thermionic ion source and accelerated by ion optics. The beam direction can be fine tuned by deflection plates, which are also used for chopping the beam from the plasma in order to filter the background signals. After the ion beam is neutralized in a sodium or potassium vapor chamber, it then penetrates the plasma. The collisional excitation and subsequent de-excitation of the alkali beam atoms generates photons along the beam trajectory with characteristic wavelength. The resulting light profile is observed by an optical viewing system. As the excitation is mainly determined by the plasma electron density, the AMB diagnostic can derive the plasma electron density profile and its fluctuation in the plasma edge [11].

2. Alkali Metal Beam Diagnostic System for the Wendelstein 7-X

An AMB diagnostic system was designed and installed on the W7-X stellarator in 2017. The system was composed of a 60 keV alkali beam injector and a dedicated observation system. The injector was placed at the AEA21 port, between the two NBI systems. The beam was injected at the equatorial plane and observed from a poloidal direction.
The first observation system was placed at the AEB20 port, from where the viewing direction was perpendicular to the beam axis. The observed area was a 200 mm long range of the beam line (between R = 6300 mm and R = 6100 mm), which was imaged onto a radially arranged fiber plate by custom-designed optics. The fiber plate consisted of 40 pieces of special optical fibers with a rectangular shaped ending, laid side by side along the beam line. Each fiber was connected to a detector from the high sensitivity avalanche photodiode system (APDCAM, Fusion Instruments Ltd., Budapest, Hungary) About 2.5% of the light was measured by a CMOS camera (Photonfocus AG, Lachen, Switzerland) for overview and spatial calibration [10]. (See Figure 1.)
In 2018, an additional optical side branch was added to the first observation system, through which a few percent of the collected light were transmitted in order to prepare for charge–exchange (CX) measurements of the edge ion temperature with the alkali beam [12,13].
During the OP1.2b campaign, trial spectral measurements were performed with the abovementioned dedicated optics. Light from 10 mm diameter spots along the beam was collected into 400 μ m diameter fibers and transmitted to a spectrometer. Spectra of both the sodium beam light and various potential CX lines were measured. Figure 2 shows the measured spectra, when the alkali beam was on (blue curve) and off (orange curve). Figure 2a shows the sodium spectrum (NaI 588.955 nm and NaI 589.592 nm), Figure 2b shows the potential CX spectrum, where two lines were modulated by the sodium beam. The modulation was small at 2–3% but systematic, as it was in phase with the sodium beam modulation. Low modulation was expected from the previous CX measurements on the W7-AS [12] and ASDEX Upgrade [13]. The lines shown in Figure 2b were identified as Carbon III, the left one was CIII 464.742 nm, and the middle one was potentially the mixture of CIII 465.025 nm and CIII 465.147 nm. The third line in Figure 2b seemed to not be modulated, and it was not identfied. The few tenths of nm discrepancies between the theoretical and measured values were probably the results of the inaccurate calibration of the spectrometer. The calibration was performed a year after the campaign; then, the used spectrometer setup was disassembled. Therefore, it was not possible to recalibrate it. Nevertheless, the results of the measurements showed the emergence of Carbon III at the observed area. Other diagnostics also indicated that CIII was the dominant source of radiation in the edge plasma [14].

3. Aim of the New Observation System

Based on the results of the trial spectral measurements, an additional dedicated optical system was developed and installed in 2021 for the upcoming operational phase, OP2. These optics were designed for multiple purposes: spectral measurements (e.g., CX measurements of the edge ion temperature) for the AMB system and for the He/Ne gas jet. The latter diagnostic is planned to be installed for later campaigns. It will have the same injection plane and region of interest as the alkali beam. The system was designed to allow the implementation of further optical systems for other diagnostics on this port (e.g., coherence imaging system). This second observation system was designed for the AEB21 port (3), which was at the same toroidal cross section as the beam injection at AEA21 (1) and was on the opposite side of the first observation point at AEB20 (2). (See Figure 3.)

4. System Requirements and the Determination of the Design Parameters

The observed radial range of the new system was determined to be 150 mm long (between R = 6300 mm and R = 6150 mm in W7-X coordinates). The light from this area is imaged onto optical fibers arranged in two rows along the beam line. Depending on the light intensity and the specific application needs, the two rows can be shared between the alkali and He/Ne beam diagnostics. To increase the signal intensity, 2 × 2 fiber blocks can be placed on both sides of the rows at a few radial positions. Therefore, the total observed object size is 150 mm × 25 mm. For manufacturing reasons, the ends of the fibers were placed in the same plane; thus, the fiber plate has a flat surface. In this way, the collected light is transmitted by the optical fibers to the spectrometer.
The observation system was placed on a DN250 size port flange, which was 2.57 m away from the observed beam. A custom-made sapphire window with a diameter of 184 mm was used. However, the effective visible diameter was reduced to 160 mm due to the port liners. The minimum necessary input aperture of the optics was 70 mm, which leaves space for the installation of additional optics at this port.
The fiber core diameter was determined by the size of the previously installed fibers at the spectroscopy laboratory. To avoid light loss, the same (160 μ m) core diameter fibers must be mounted to the fiber plate. A commercially available fiber was selected in the early design phase with a total outer diameter of 205 μ m, including the cladding and jacket around the fiber core. Considering this fiber diameter and the numerical aperture (NA = 0.22) of the fibers, while recognizing the need for a reasonable amount of fibers in the system, the magnification was determined to be M = 15.8. With this configuration, the observed area can be covered by 130 fibers, and a 100 ms time resolution is achievable for the ion temperature measurements. The length of the fibers is 8 m, so they can be directly routed to the patch panel, where they are connected to the 60 m long fiber bundles ending in the spectroscopy lab outside the torus hall.
The He-beam measurements require a wide spectral range; therefore, the necessary operational wavelength range of the optics was determined to be 340–930 nm. Furthermore, the system enables the adjustment of focus and the fiber plate position and orientation, while the mechanical design allows the absolute intensity calibration of the optics from outside the vacuum vessel, without removing the optics from their installed position.

5. Design Solutions and Implementation

5.1. Overview of Design

A section view of the optics system is shown in Figure 4. The following design description contains the numbering used in this figure.
Taking into account that the expected mass of the system was relatively small (less than 30 kg), we decided to fix it directly to the flange of the custom-made sapphire glass vacuum window (1), even though it was installed from the bottom.
An optics holder ring (2) was attached to the vacuum window by screws. The opened sides of the optics holder can be covered by side closure ring sections (3) to provide ECRH protection and light shielding. The optics holder was designed so that folding mirrors (4) could be temporarily attached for absolute intensity calibration as follows: the fiber plate can be illuminated by placing a light source (an Ulbricht sphere) under the optics, turning its opening towards the outer folding mirror. Thus, the emitted light is transmitted to the optics through the folding mirrors. In this way, the absolute intensity calibration can be performed without entering the vacuum vessel or removing the optics from their installed position. Sufficient space was provided between the vacuum window and optics to insert a heat shield during a baking procedure. There are two additional 46 mm diameter apertures on the optics holder plate, where further diagnostics or cooling devices can be attached later.
To fulfill all optical requirements, a custom-made objective (5) was designed and manufactured (OMI Ltd., Budapest, Hungary). Various commercially available optics were investigated (photo lenses, achromats, offset parabolic mirrors, and other mirror systems), but for the required wavelength range (340–930 nm) and aperture diameter (70 mm), no such solution was found. The optics holder (6) was designed so that the focus can be adjusted by a spindle mechanism. The fiber plate (8) was attached to an XY translation mount where a precise fiber plate position can be adjusted by micrometers. The sides of the fiber plate holder (9) were protected by half tube coverings. The entire fiber plate holder can be turned around by the rotating unit (7) to ensure the adjustment of the fiber plate orientation.
The optical fibers (10) were protected by a plastic tube, which has a larger minimum bending radius than the fibers. During transportation and storage, the entire fiber bundle can be rolled up to its holder (11). After installation of the bundle to its dedicated cable tray, the remaining cable can be stored at the holder as well.

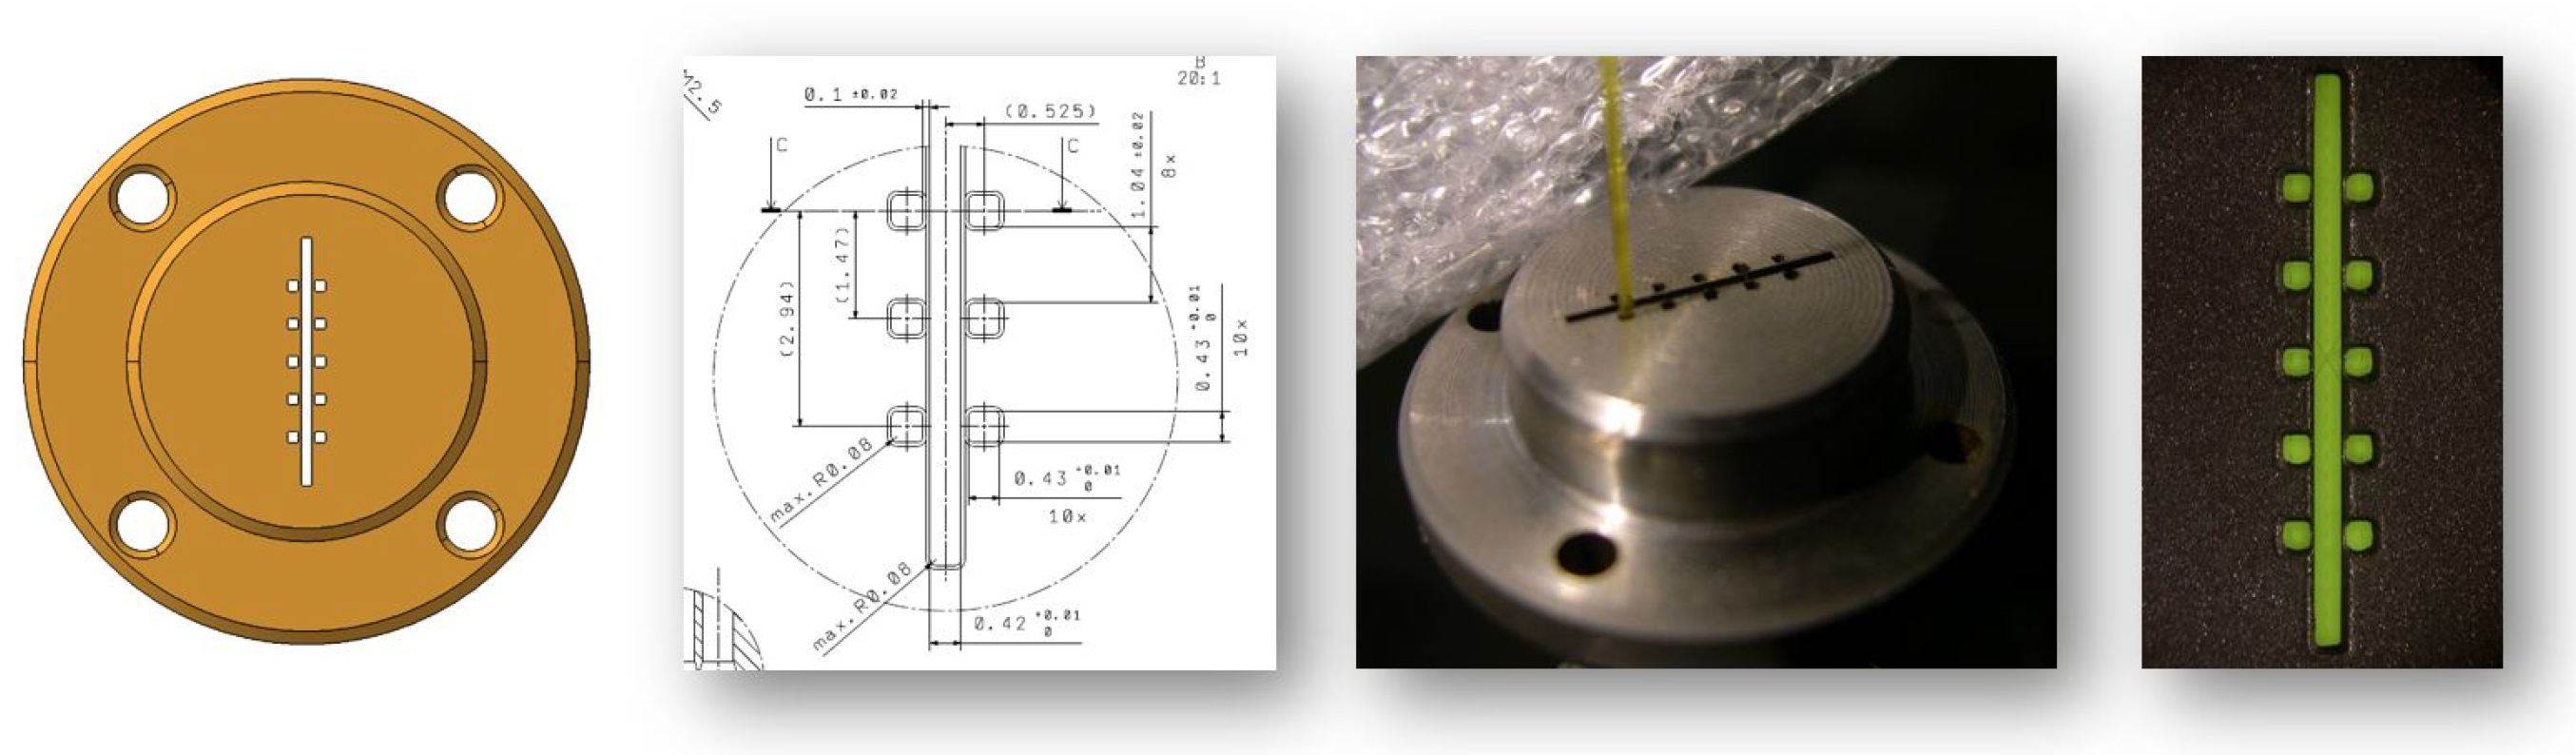
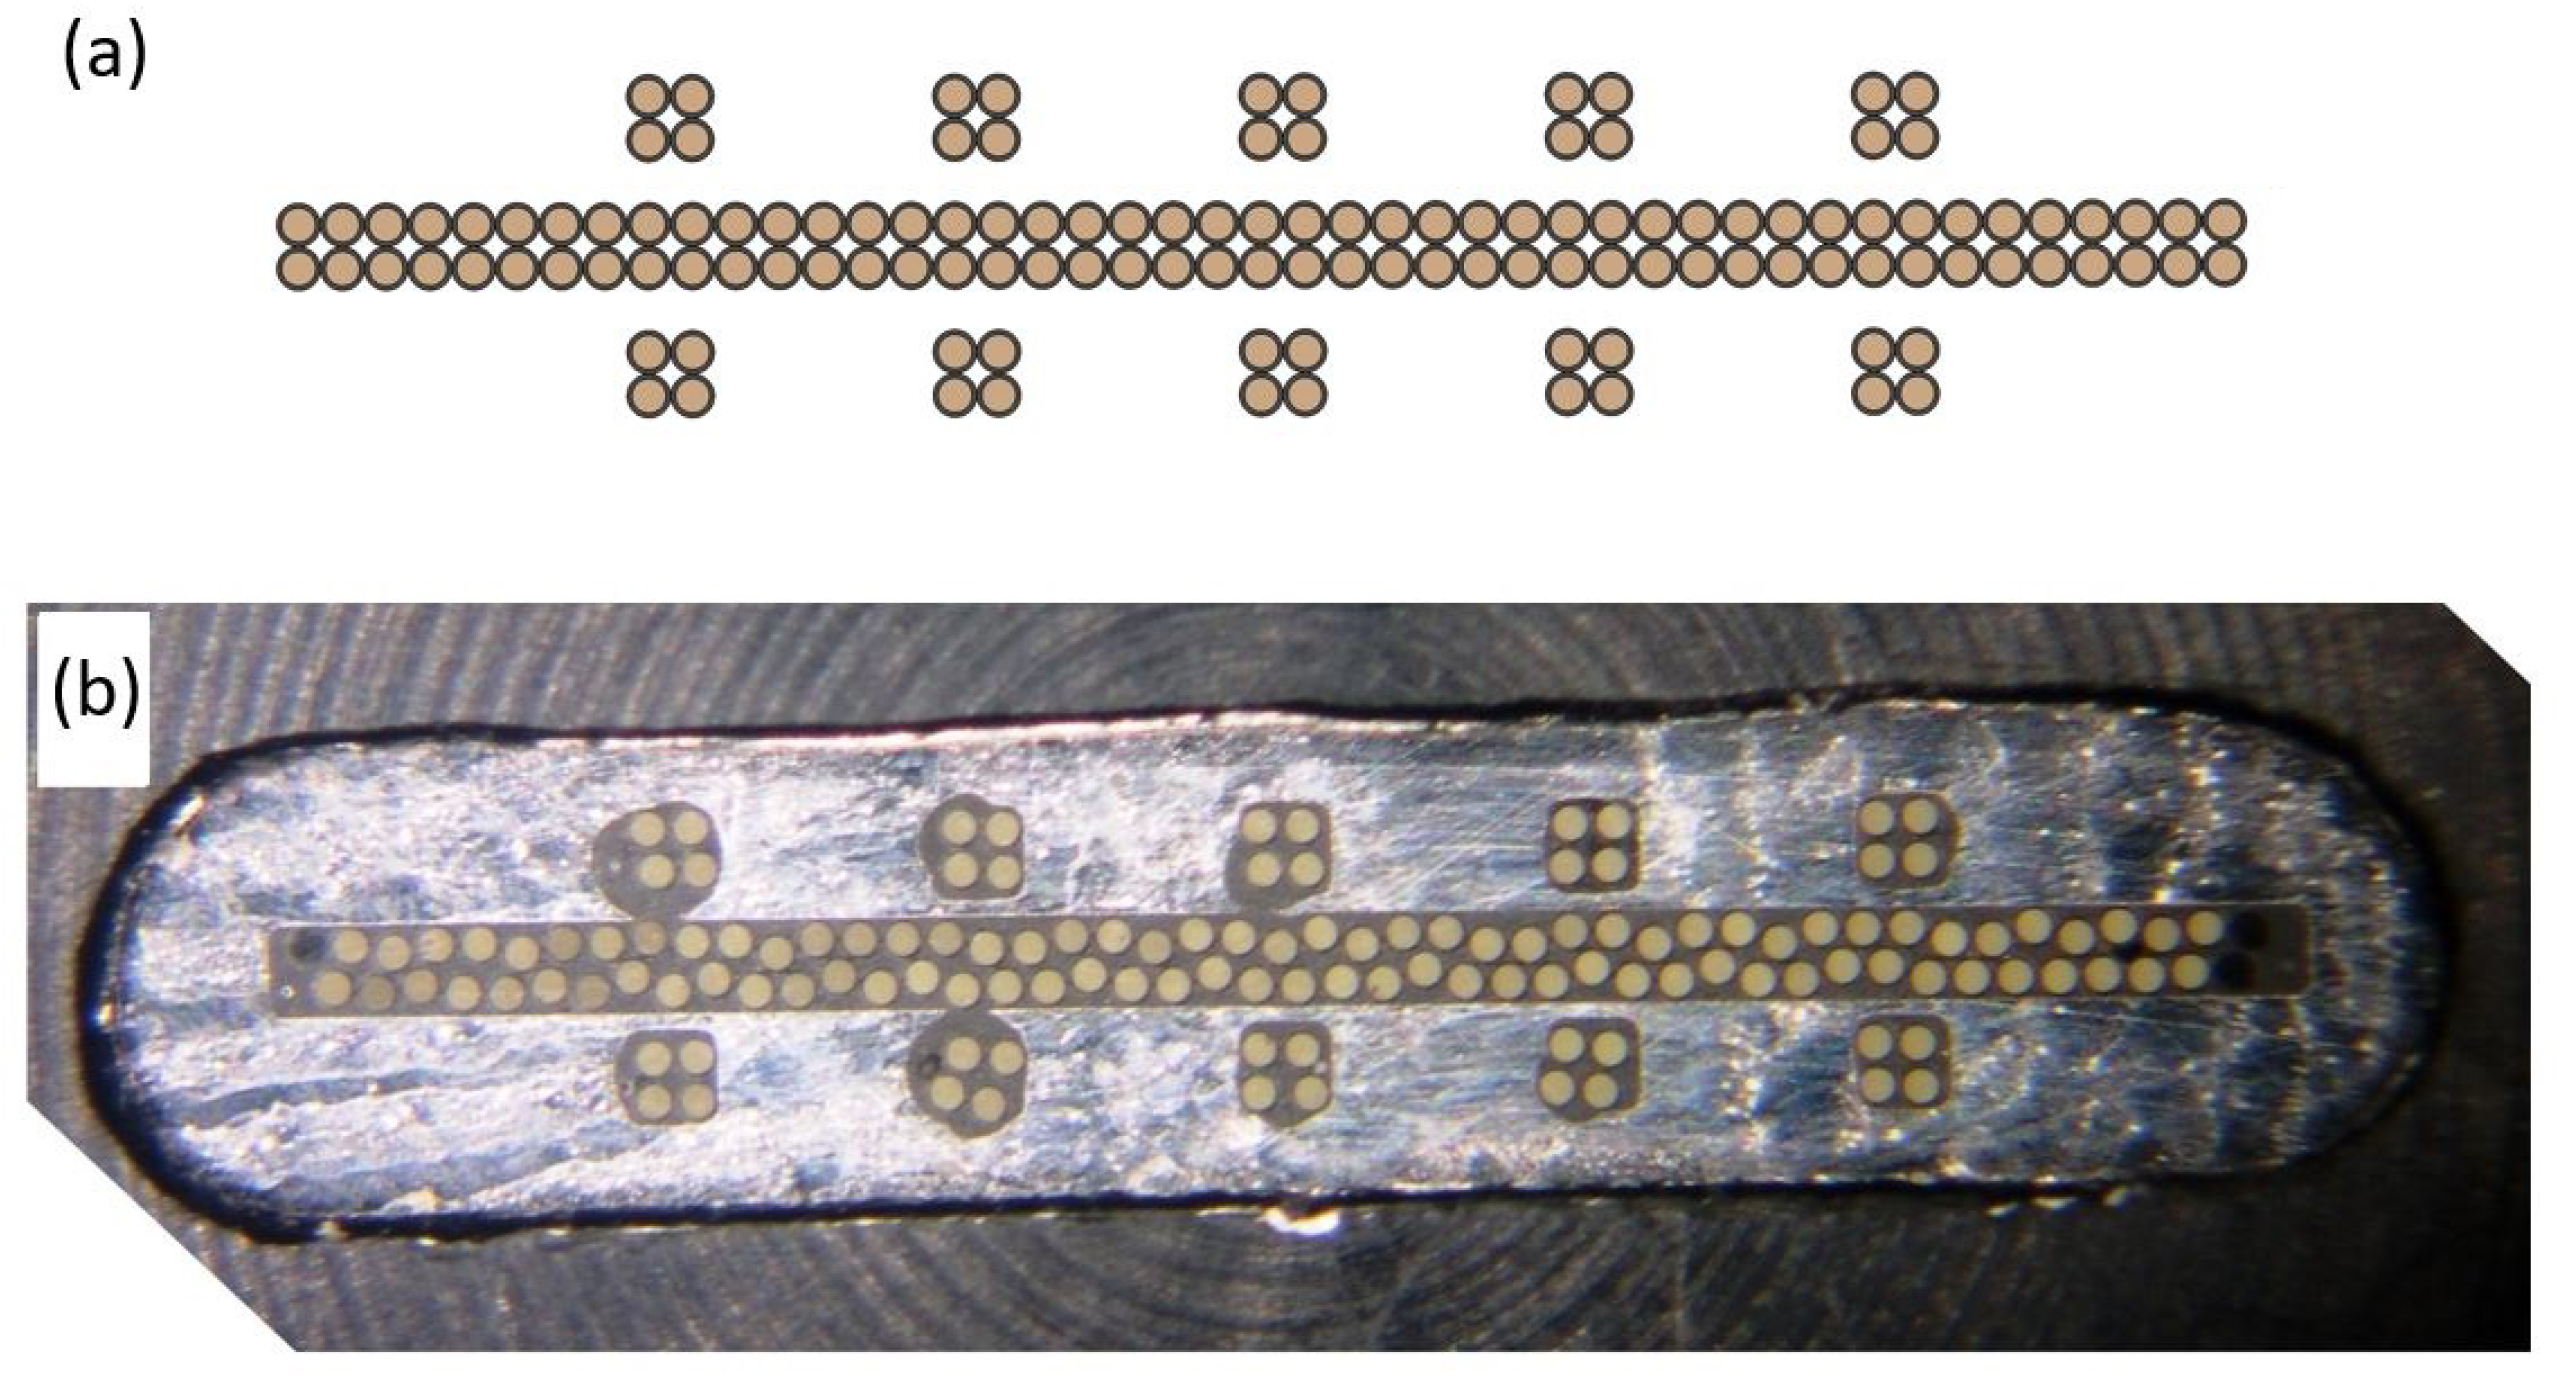
5.2. Fiber Plate Manufacturing

Manufacturing and assembly of the fiber plate was a considerable challenge. The fibers were glued into a 5 mm thick and 14 mm diameter stainless-steel disc, called a fiber plate. To ensure the exact position of the fibers, the contour of the cutout on the original fiber plate was designed to follow the contour of the fibers (Figure 5). The selected manufacturing method to produce the cutouts for the fibers was wire-cut electrical discharge machining (EDM). To be able to cut out the contour of the 205 μ m fibers (plus tolerances), the manufacturer had to use the smallest diameter wire (0.1 mm) available for the EDM machine. Although the shape of the cutouts looked promising, the manufacturer was unable to meet the dimensional and shape tolerances; thus, it was impossible to insert all the fibers into the cutouts.
After multiple failed attempts to manufacture the original shape of cutouts, we decided to simplify the fiber plate design. The modified cutouts had straight contours and rounded edges (Figure 6).
The result of the modification was as expected: the tolerances were easier to meet; therefore, all fibers could be inserted and glued into the fiber plate. However, the position of the fibers was not as precise as originally planned (Figure 7). Nevertheless, with a proper spatial calibration of the diagnostic, the increased inaccuracy in the fiber locations was not expected to cause any difficulties.

6. Adjustment and Calibration of the System

The adjustment and calibration of the optics was performed after the installation to the port at the end of 2021, when the W7-X vacuum chamber was open. The AEA21 port plug was temporarily removed because this port was used for human access. Through this opened port a semi-transparent screen was inserted to the observed plane, while the optical fibers of the AEB21 system were back-illuminated, and their images on the screen were observed by the overview CMOS camera of the AEB20 optical system (Figure 3).

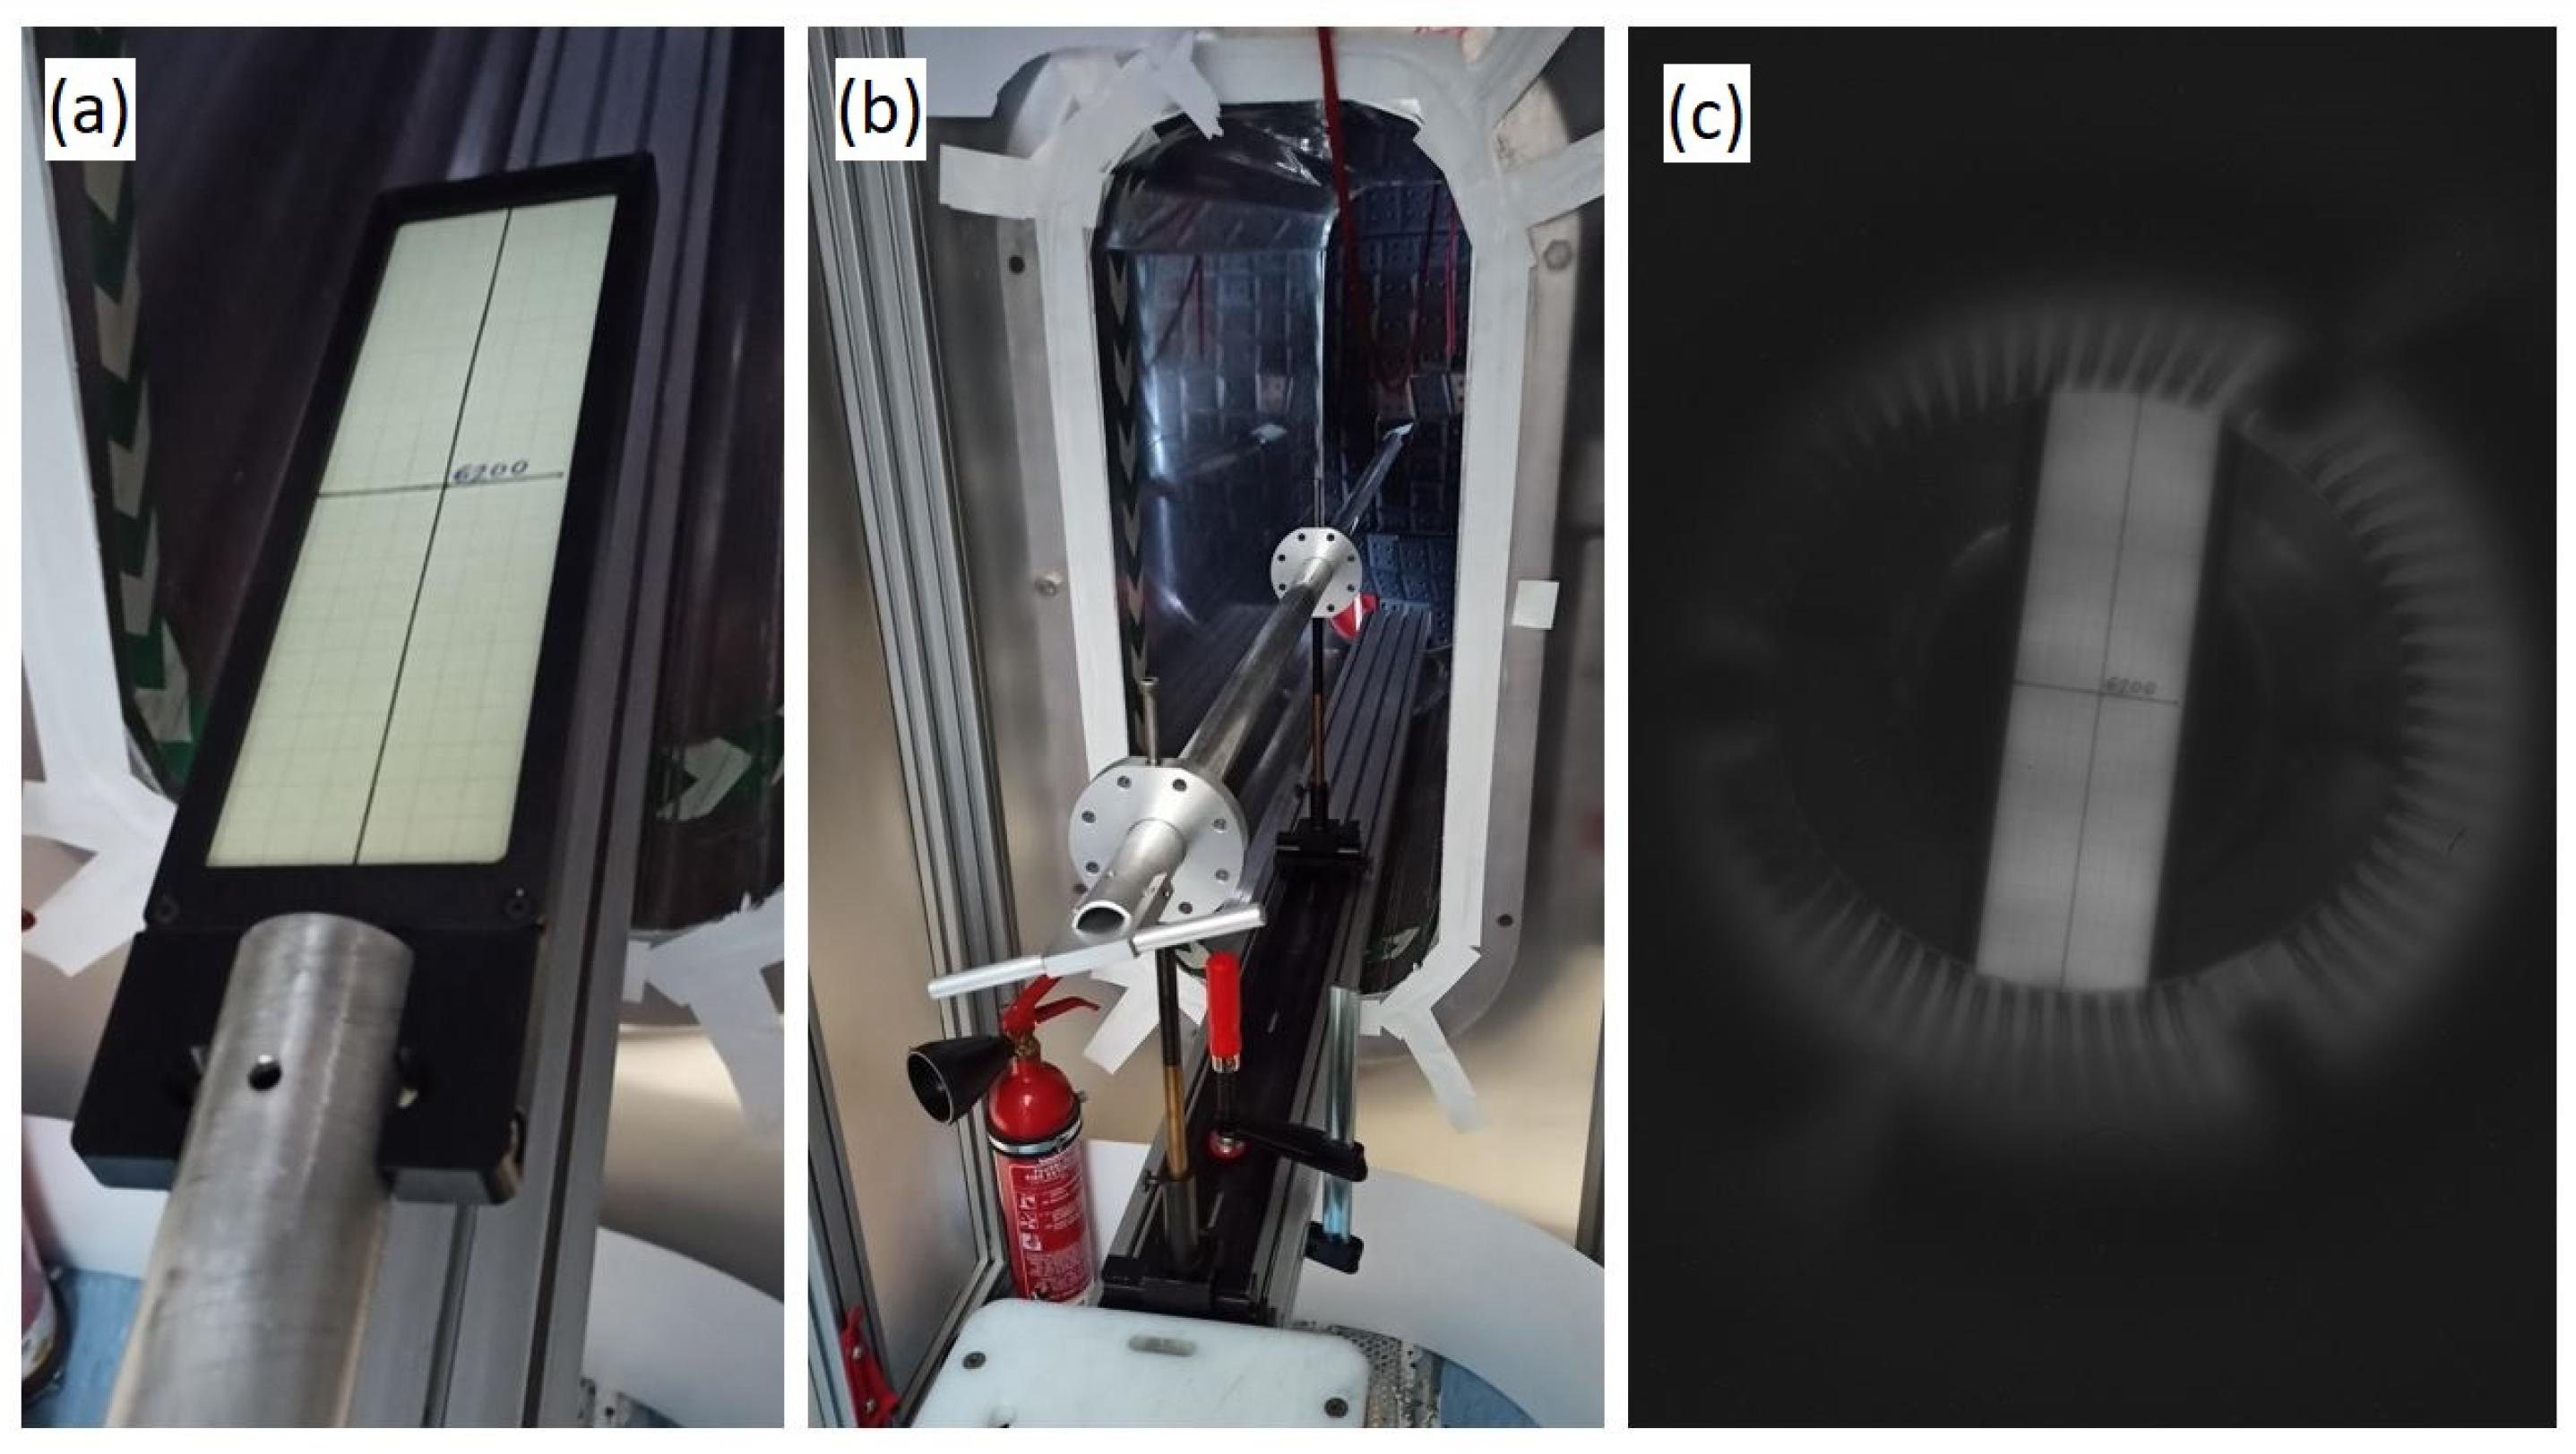
6.1. Setup for the Adjustment and Spatial Calibration

The screen was fixed to the end of an aluminum pipe called a calibration rod. The other end of the calibration rod was fixed to an optical rail system through two flanges. These two flanges were fixed onto the rail by adjustable holders; thus, all DOF of both flanges could be adjusted. The optical rail was fixed to the aluminum profiles on the bottom of the AEA21 port (Figure 8b). The absolute coordinates of the two dedicated points of the rod were extracted from the CAD model; then, these points were measured by a 3D laser measurement technique. The position of the rod was adjusted according to the measurement results until the discrepancy was below 1 mm. Thus, the position of the screen was adjusted.
The semi-transparent screen was a piece of 238 × 64 mm graph paper fixed onto a glass plate (Figure 8a). At the middle of the screen the center lines were marked: the longitudinal center line was aligned to the beam line, and the cross line was aligned to the R = 6200 mm radial position (Figure 8a). Since the fibers were not connected to the patch box until later, it was possible to back-illuminate all of them simultaneously, or one by one.

6.2. Adjustment of the Optics

As a first step, the orientation of the fiber plate was adjusted by back-illuminating all fibers simultaneously using a large LED panel. The image on the screen was checked, while the orientation was adjusted by the rotatable unit (Figure 4(7)). Then, the focus was adjusted similarly with the dedicated tool on the objective holder (Figure 4(6)). Finally, the X-Y position of the fiber plate was adjusted by the translation mount located on the fiber plate holder (Figure 4(9)). Then, we fixed all the adjustable elements.

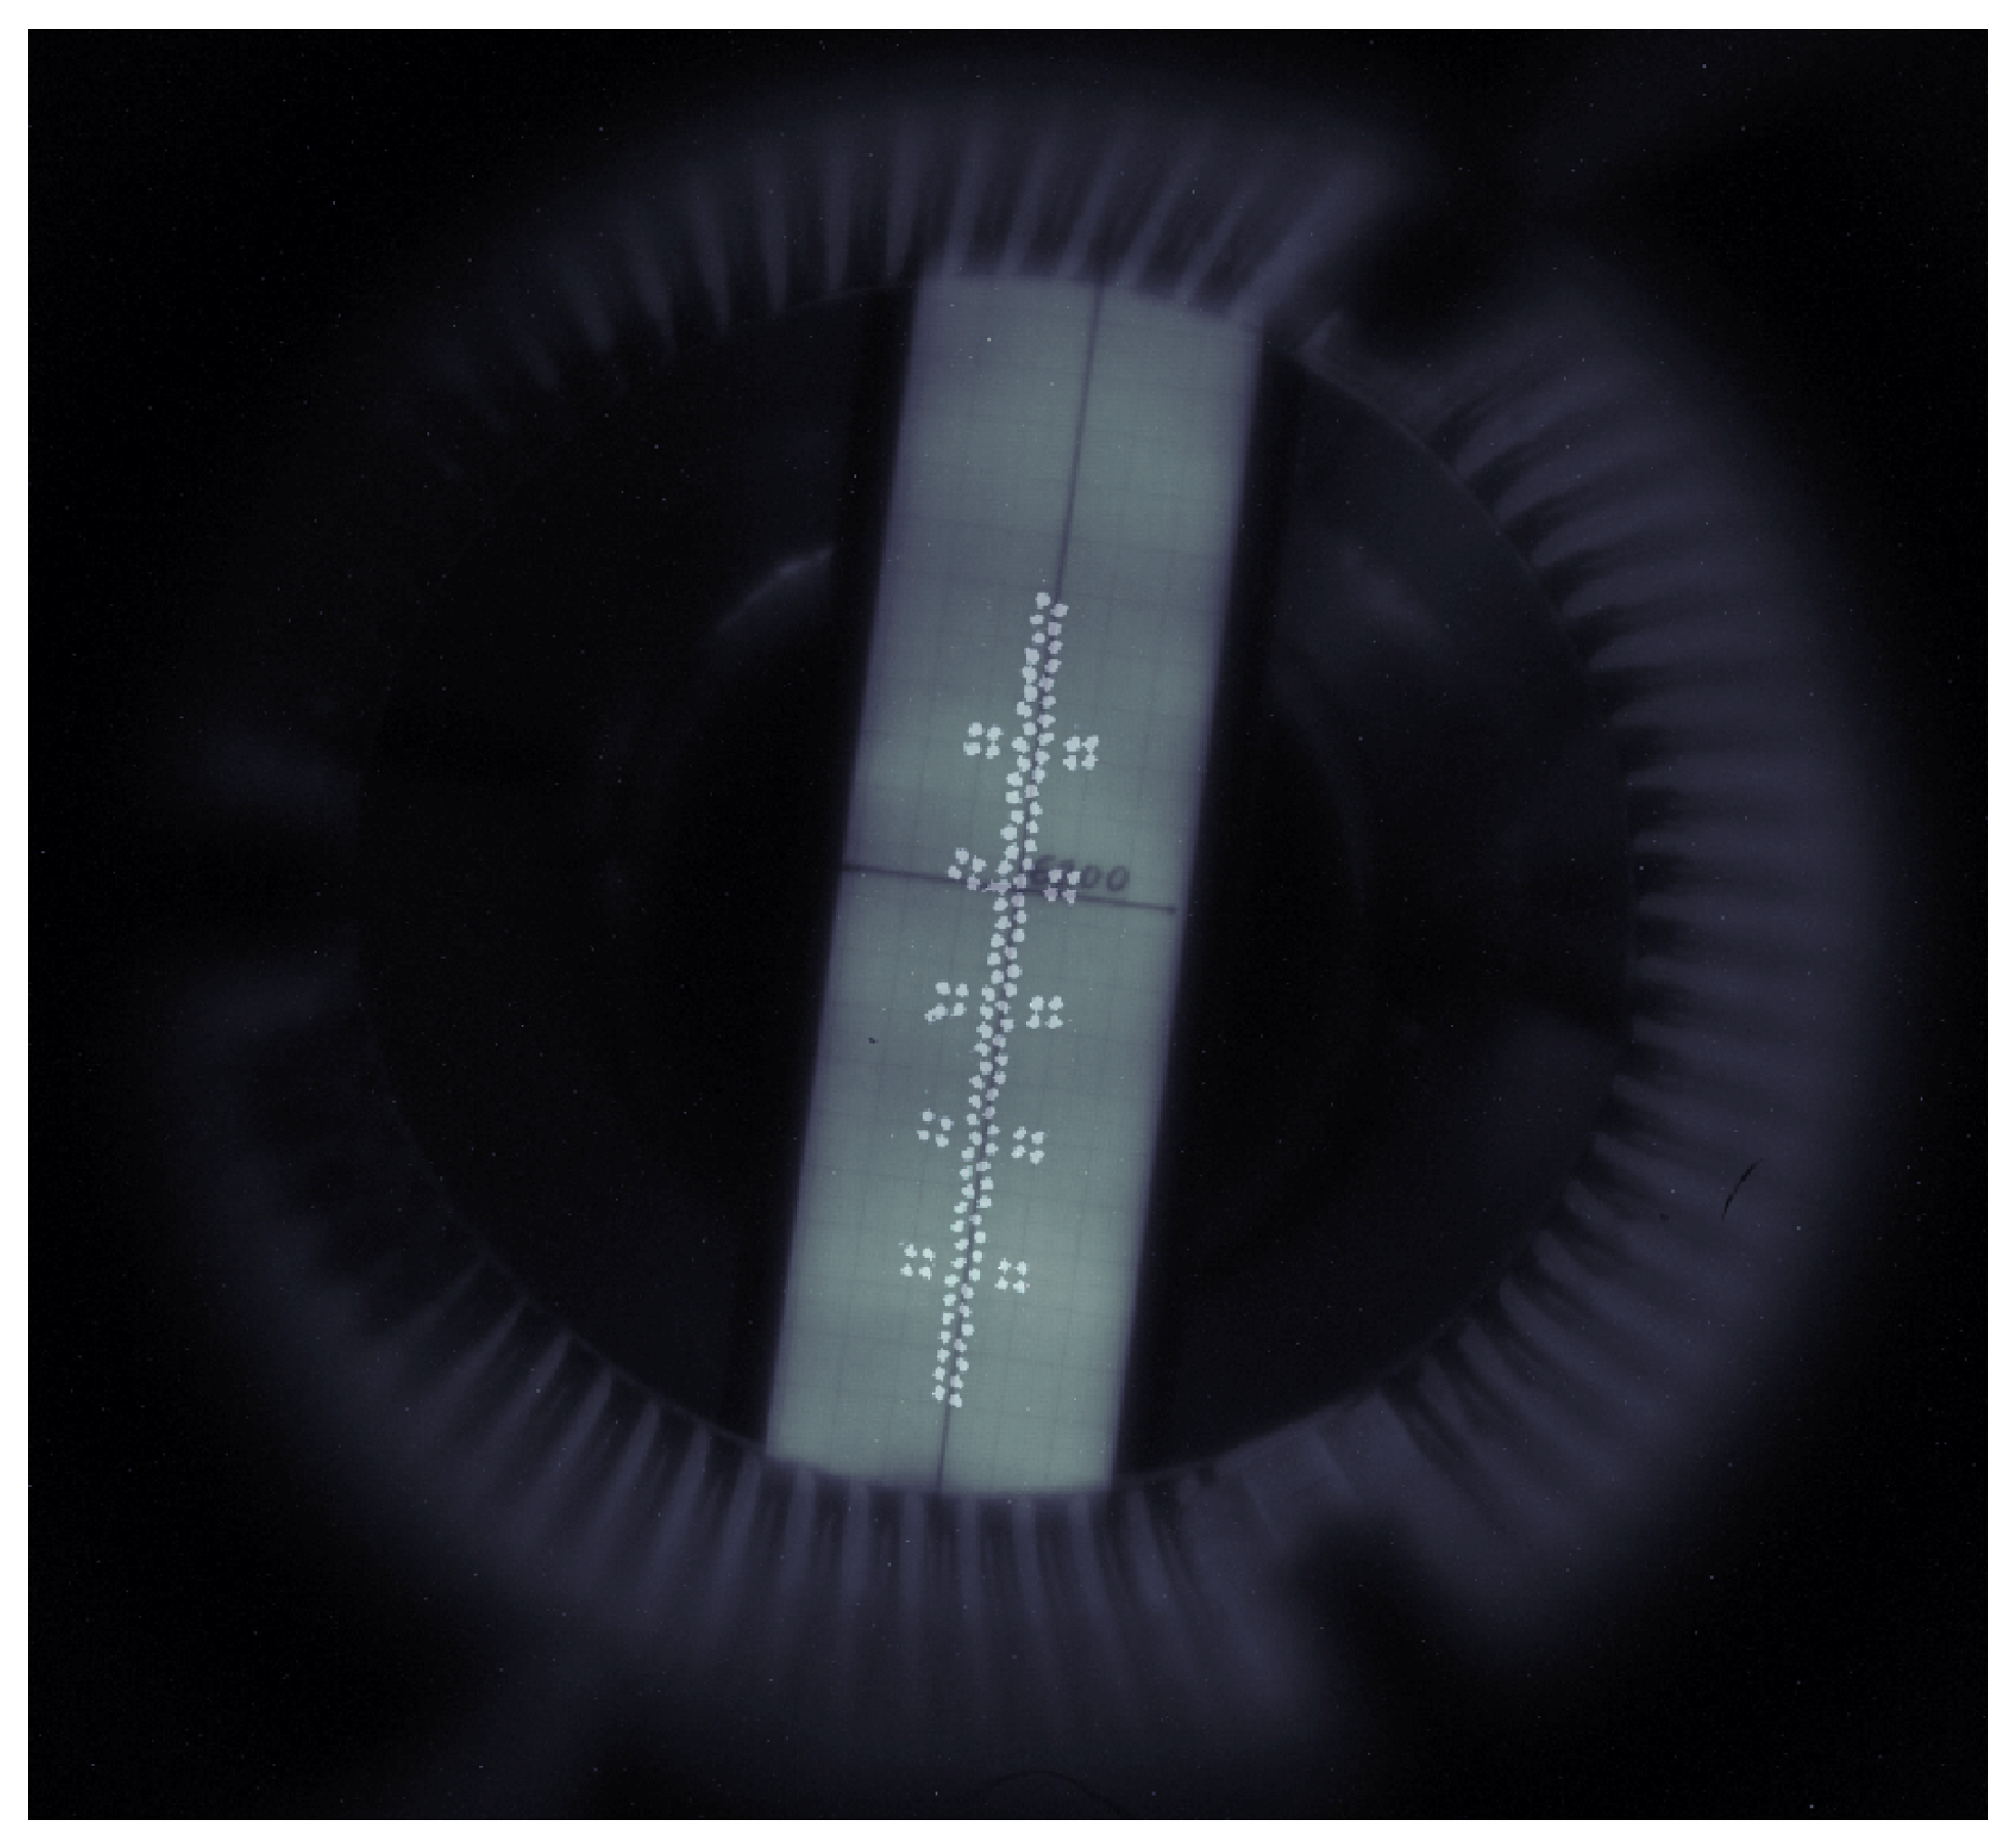
6.3. Results of the Spatial Calibration

After adjusting the fiber plate position, the fibers were back-illuminated one by one, and a CMOS image was taken. Thus, the spatial positions of all fibers were identified. A merged CMOS camera image of the fiber positions can be seen in Figure 9.
According to the calibration results, the channel positions were between R = 6145 mm and R = 6295 mm; so, the length of the observed radial range was 150 mm. The width of the observed range was about 22 mm, and the average diameter of the channels was 2.5 mm. These values very well matched the design parameters described in Section 4.

7. Summary and Conclusions

Based on the results of the OP1.2b campaign on the Wendelstein 7-X experimental device, an additional observation system was developed, manufactured, installed, and calibrated for the alkali metal beam diagnostic. The observation system is designed to serve multiple diagnostics and meet the complex requirements discussed in Section 4 and Section 5.
Although the fiber arrangement in the fiber plate was less precise than originally planned, it provided sufficient performance for measurements using the result of the spatial calibration. Due to the lack of time, there was no possibility to further refine the original fiber plate design in order to achieve a more accurate setup. The use of slightly larger nominal dimensions or more relaxed tolerances could lead to a successful production of a more precisely arranged fiber plate.
The installation, adjustment, and calibration of the system was performed at the end of 2021. After connecting the spectroscopy lab fibers to the patch box, the system is ready for measurements as of November 2022.

Author Contributions

Conceptualization, D.N., S.Z., M.O., M.V., M.K., R.K., D.D., G.A., B.C. and I.K.; Software, S.Z., M.V. and D.D.; Investigation, D.N.; Resources, S.Z., M.O., W7-X Team; Writing—original draft, D.N., M.O. and M.V.; Writing—review and editing, D.N., S.Z. and M.V.; Visualization, S.H.; Supervision, S.Z. and M.O.; Project administration, M.O.; Funding acquisition, M.O. All authors have read and agreed to the published version of the manuscript.

Funding

This work was carried out within the framework of the EUROfusion Consortium, funded by the European Union via the Euratom Research and Training Programme (Grant Agreement No 101052200—EUROfusion). The views and opinions expressed are however those of the author(s) only and do not necessarily reflect those of the European Union or the European Commission. Neither the European Union nor the European Commission can be held responsible for them.

Institutional Review Board Statement

Not applicable.

Informed Consent Statement

Not applicable.

Data Availability Statement

Not applicable.

Acknowledgments

W7-X Team members: T.S. Pedersen, I. Abramovic, P. Agostinetti, M. Agredano Torres, S. Äkäslompolo, J. Alcuson Belloso, P. Aleynikov, K. Aleynikova, M. Alhashimi, A. Ali, N. Allen, A. Alonso, G. Anda, T. Andreeva, C. Angioni, A. Arkhipov, A. Arnold, W. Asad, E. Ascasibar, M.-H. Aumeunier, K. Avramidis, E. Aymerich, S.-G. Baek, J. Bähner, A. Baillod, M. Balden, M. Balden, J. Baldzuhn, S. Ballinger, M. Banduch, S. Bannmann, A. Banon Navarro, A. Bañón Navarro, T. Barbui, C. Beidler, C. Belafdil, A. Bencze, A. Benndorf, M. Beurskens, C. Biedermann, O. Biletskyi, B. Blackwell, M. Blatzheim, T. Bluhm, D. Böckenhoff, G. Bongiovi, M. Borchardt, D. Borodin, J. Boscary, H. Bosch, T. Bosmann, B. Böswirth, L. Böttger, A. Bottino, S. Bozhenkov, R. Brakel, C. Brandt, T. Bräuer, H. Braune, S. Brezinsek, K. Brunner, S. Buller, R. Burhenn, R. Bussiahn, B. Buttenschön, A. Buzás, V. Bykov, I. Calvo, K. Camacho Mata, I. Caminal, B. Cannas, A. Cappa, A. Carls, F. Carovani, M. Carr, D. Carralero, B. Carvalho, J. Casas, D. Castano-Bardawil, F. Castejon, N. Chaudhary, I. Chelis, A. Chomiczewska, J.W. Coenen, M. Cole, F. Cordella, Y. Corre, K. Crombe, G. Cseh, B. Csillag, H. Damm, C. Day, M. de Baar, E. De la Cal, S. Degenkolbe, A. Demby, S. Denk, C. Dhard, A. Di Siena, A. Dinklag, T. Dittmar, M. Dreval, M. Drevlak, P. Drewelow, P. Drews, D. Dunai, E. Edlund, F. Effenberg, G. Ehrke, M. Endler, D.A. Ennis, F.J. Escoto, T. Estrada, E. Fable, N. Fahrenkamp, A. Fanni, J. Faustin, J. Fellinger, Y. Feng, W. Figacz, E. Flom, O. Ford, T. Fornal, H. Frerichs, S. Freundt, G. Fuchert, M. Fukuyama, F. Füllenbach, G. Gantenbein, Y. Gao, K. Garcia, J.M. García Regaña, I.García-Cortés, J. Gaspar, D.A. Gates, J. Geiger, B. Geiger, L. Giudicotti, A. González, A. Goriaev, D. Gradic, M. Grahl, J.P. Graves, J. Green, E. Grelier, H. Greuner, S. Groß, H. Grote, M. Groth, M. Gruca, O. Grulke, M. Grün, J. Guerrero Arnaiz, S. Günter, V. Haak, M. Haas, P. Hacker, A. Hakola, A. Hallenbert, K. Hammond, X. Han, S.K. Hansen, J.H. Harris, H. Hartfuß, D. Hartmann, D. Hathiramani, R. Hatzky, J. Hawke, S. Hegedus, B. Hein, B. Heinemann, P. Helander, S. Henneberg, U. Hergenhahn, C. Hidalgo, F. Hindenlang, M. Hirsch, U. Höfel, K.P. Hollfeld, A. Holtz, D. Hopf, D. Höschen, M. Houry, J. Howard, X. Huang, M. Hubeny, S. Hudson, K. Ida, Y. Igitkhanov, V. Igochine, S. Illy, C. Ionita-Schrittwieser, M. Isobe, M. Jabłczyńska, S. Jablonski, B. Jagielski, M. Jakubowski, A. Jansen van Vuuren, J. Jelonnek, F. Jenko, F. Jenko, T. Jensen, H. Jenzsch, P. Junghanns, J. Kaczmarczyk, J. Kallmeyer, U. Kamionka, M. Kandler, S. Kasilov, Y. Kazakov, D. Kennedy, A. Kharwandikar, M. Khokhlov, C. Kiefer, C. Killer, A. Kirschner, R. Kleiber, T. Klinger, S. Klose, J. Knauer, A. Knieps, F. Köchl, G. Kocsis, Ya.I. Kolesnichenko, A. Könies, R. König, J. Kontula, P. Kornejew, J. Koschinsky, M.M. Kozulia, A. Krämer-Flecken, R. Krampitz, M. Krause, N. Krawczyk, T. Kremeyer, L. Krier, D.M. Kriete, M. Krychowiak, I. Ksiazek, M. Kubkowska, M. Kuczynski, G. Kühner, A. Kumar, T. Kurki-Suonio, S. Kwak, M. Landreman, P.T. Lang, A. Langenberg, H.P. Laqua, H. Laqua, R. Laube, S. Lazerson, M. Lewerentz, C. Li, Y. Liang, Ch. Linsmeier, J. Lion, A. Litnovsky, S. Liu, J. Lobsien, J. Loizu, J. Lore, A. Lorenz, U. Losada, F. Louche, R. Lunsford, V. Lutsenko, M. Machielsen, F. Mackel, J. Maisano-Brown, O. Maj, D. Makowski, G. Manduchi, E. Maragkoudakis, O. Marchuk, S. Marsen, E. Martines, J. Martinez-Fernandez, M. Marushchenko, S. Masuzaki, D. Maurer, M. Mayer, K.J. McCarthy, O. Mccormack, P. McNeely, H. Meister, B. Mendelevitch, S. Mendes, A. Merlo, A. Messian, A. Mielczarek, O. Mishchenko, B. Missal, R. Mitteau, V.E. Moiseenko, A. Mollen, V. Moncada, T. Mönnich, T. Morisaki, D. Moseev, G. Motojima, S. Mulas, M. Mulsow, M. Nagel, D. Naujoks, V. Naulin, T. Neelis, H. Neilson, R. Neu, O. Neubauer, U. Neuner, D. Nicolai, S.K. Nielsen, H. Niemann, T. Nishiza, T. Nishizawa, T. Nishizawa, C. Nührenberg, R. Ochoukov, J. Oelmann, G. Offermanns, K. Ogawa, S. Okamura, J. Ölmanns, J. Ongena, J. Oosterbeek, M. Otte, N. Pablant, N. Panadero Alvarez, N. Panadero Alvarez, A. Pandey, E. Pasch, R. Pavlichenko, A. Pavone, E. Pawelec, G. Pechstein, G. Pelka, V. Perseo, B. Peterson, D. Pilopp, S. Pingel, F. Pisano, B. Plöck, G. Plunk, P. Pölöskei, B. Pompe, A. Popov, M. Porkolab, J. Proll, M.J. Pueschel, M.-E. Puiatti, A. Puig Sitjes, F. Purps, K. Rahbarnia, M. Rasiński, J. Rasmussen, A. Reiman, F. Reimold, M. Reisner, D. Reiter, M. Richou, R. Riedl, J. Riemann, K. Riße, G. Roberg-Clark, V. Rohde, J. Romazanov, D. Rondeshagen, P. Rong, L. Rudischhauser, T. Rummel, K. Rummel, A. Runov, N. Rust, L. Ryc, P. Salembier, M. Salewski, E. Sanchez, S. Satake, G. Satheeswaran, J. Schacht, E. Scharff, F. Schauer, J. Schilling, G. Schlisio, K. Schmid, J. Schmitt, O. Schmitz, W. Schneider, M. Schneider, P. Schneider, R. Schrittwieser, T. Schröder, M. Schröder, R. Schroeder, B. Schweer, D. Schwörer, E. Scott, E. Scott, B. Shanahan, G. Sias, P. Sichta, M. Singer, P. Sinha, S. Sipliä, C. Slaby, M. Sleczka, H. Smith, J. Smoniewski, E. Sonnendrücker, M. Spolaore, A. Spring, R. Stadler, D. Stańczak, T. Stange, I. Stepanov, L. Stephey, J. Stober, U. Stroth, E. Strumberger, C. Suzuki, Y. Suzuki, J. Svensson, T. Szabolics, T. Szepesi, M. Szücs, F.L. Tabarés, N. Tamura, A. Tancetti, C. Tantos, J. Terry, H. Thienpondt, H. Thomsen, M. Thumm, J.M. Travere, P. Traverso, J. Tretter, E. Trier, H. Trimino Mora, T. Tsujimura, Y. Turkin, A. Tykhyi, B. Unterberg, P. van Eeten, B.Ph. van Milligen, M. van Schoor, L. Vano, S. Varoutis, M. Vecsei, L. Vela, J.L. Velasco, M. Vervier, N. Vianello, H. Viebke, R. Vilbrandt, G. Vogel, N. Vogt, C. Volkhausen, A. von Stechow, F. Wagner, E. Wang, H. Wang, F. Warmer, T. Wauters, L. Wegener, T. Wegner, G. Weir, U. Wenzel, A. White, F. Wilde, F. Wilms, T. Windisch, M. Winkler, A. Winter, V. Winters, R. Wolf, A.M. Wright, G.A. Wurden, P. Xanthopoulos, S. Xu, H. Yamada, H. Yamaguchi, M. Yokoyama, M. Yoshinuma, Q. Yu, M. Zamanov, M. Zanini, M. Zarnstorff, D. Zhang, S. Zhou, J. Zhu, C. Zhu, M. Zilker, A. Zocco, H. Zohm, S. Zoletnik and L. Zsuga.

Conflicts of Interest

The authors declare no conflict of interest.

Abbreviations

The following abbreviations were used in this manuscript:
ABESAlkali Beam Emission Spectroscopy
ABPAtomic Beam Probe
AMBAlkali Metal Beam
APDCAMAvalanche Photodiode Camera
BESBeam Emission Spectroscopy
CMOSComplementary Metal-Oxide Semiconductor
CXCharge–Exchange
DOFDegrees Of Freedom
EDMElectrical Discharge Machining
W7-XWendelstein 7-X

References

  1. Fonck, R.J.; Duperrex, P.A.; Paul, S.F. Plasma fluctuation measurements in tokamaks using beam-plasma interactions. Rev. Sci. Instrum. 1990, 61, 3487. [Google Scholar] [CrossRef]
  2. Oishi, T.; Kado, S.; Yoshinuma, M.; Ida, K.; Akiyama, T.; Minami, T.; Nagaoka, K.; Shimizu, A.; Okamura, S.; Tanaka, S.; et al. EHO-like density fluctuations measured using beam emission spectroscopy in ETB discharges in CHS. Nucl. Fusion 2006, 46, 317. [Google Scholar] [CrossRef]
  3. Willensdorfer, M.; Birkenmeier, G.; Fischer, R.; Laggner, F.M.; Wolfrum, E.; Veres, G.; Aumayr, F.; Carralero, D.; Guimarãis, L.; Kurzan, B. Characterization of the Li-BES at ASDEX Upgrade. Plasma Phys. Control. Fusion 2014, 56, 025008. [Google Scholar] [CrossRef] [Green Version]
  4. Brix, M.; Dodt, D.; Dunai, D.; Lupelli, I.; Marsen, S.; Melson, T.F.; Meszaros, B.; Morgan, P.; Petravich, G.; Refy, D.I.; et al. Recent improvements of the JET lithium beam diagnostic. Rev. Sci. Instrum. 2012, 83, 10D533. [Google Scholar] [CrossRef] [PubMed] [Green Version]
  5. Morisaki, T.; Komori, A.; Motojima, O. Lithium beam probe for edge density profile measurements on the large helical device. Rev. Sci. Instrum. 2003, 74, 1865. [Google Scholar] [CrossRef]
  6. Anda, G.; Bencze, A.; Berta, M.; Dunai, D.; Hacek, P.; Krbec, J.; Réfy, D.; Krizsanóczi, T.; Bató, S.; Ilkei, T.; et al. Lithium beam diagnostic system on the COMPASS tokamak. Fusion Eng. Des. 2016, 108, 1–6. [Google Scholar] [CrossRef]
  7. Lampert, M.; Anda, G.; Czopf, A.; Erdei, G.; Guszejnov, D.; Kovácsik, Á.; Pokol, G.I.; Réfy, D.; Nam, Y.U.; Zoletnik, S. Combined hydrogen and lithium beam emission spectroscopy observation system for Korea Superconducting Tokamak Advanced Research. Rev. Sci. Instrum. 2015, 86, 073501. [Google Scholar] [CrossRef] [PubMed]
  8. Anda, G.; Dunai, D.; Lampert, M.; Krizsanóczi, T.; Németh, J.; Bató, S.; Nam, Y.U.; Hu, G.H.; Zoletnik, S. Development of a high current 60 keV neutral lithium beam injector for beam emission spectroscopy measurements on fusion experiments. Rev. Sci. Instrum. 2018, 89, 013503. [Google Scholar] [CrossRef] [PubMed]
  9. Zoletnik, S.; Hu, G.H.; Tál, B.; Dunai, D.; Anda, G.; Asztalos, O.; Pokol, G.I.; Kálvin, S.; Németh, J.; Krizsanóczi, T. Ultrafast two-dimensional lithium beam emission spectroscopy diagnostic on the EAST tokamak. Rev. Sci. Instrum. 2018, 89, 063503. [Google Scholar] [CrossRef] [PubMed]
  10. Anda, G.; Dunai, D.; Krizsanóczi, T.; Nagy, D.; Otte, M.; Hegedűs, S.; Vécsei, M.; Zoletnik, S.; Gárdonyi, G. Measurement of edge plasma parameters at W7-X using alkali beam emission spectroscopy. Fusion Eng. Des. 2019, 146, 1814–1819. [Google Scholar] [CrossRef]
  11. Zoletnik, S.; Anton, M.; Endler, M.; Fiedler, S.; Hirsch, M.; McCormick, K.; Schweinzer, J. Density fluctuation phenomena in the scrape-off layer and edge plasma of the Wendelstein 7-AS stellarator. Phys. Plasmas 1999, 6, 4239. [Google Scholar] [CrossRef]
  12. Ehmler, H.; Baldzuhn, J.; McCormick, K.; Kreter, A.; Klinger, T.; Team, W.A. Charge-exchange spectroscopy at the W7-AS stellarator employing a high-energy Li beam. Plasma Phys. Control. Fusion 2003, 45, 53. [Google Scholar] [CrossRef] [Green Version]
  13. Reich, M.; Wolfrum, E.; Schweinzer, J.; Ehmler, H.; Horton, L.D.; Neuhauser, J.; Team, A.U. Lithium beam charge exchange diagnostic for edge ion temperature measurements at the ASDEX Upgrade tokamak. Plasma Phys. Control. Fusion 2004, 46, 797. [Google Scholar] [CrossRef]
  14. Gradic, D.; Krychowiak, M.; König, R.; Henke, F.; Otte, M.; Perseo, V.; SunnPedersen, T.; Team, W.X. Impurity temperatures measured via line shape analysis in the island scrape-off-layer of Wendelstein 7-X. Plasma Phys. Control. Fusion 2022, 64, 075010. [Google Scholar] [CrossRef]
Figure 1. The W7-X alkali metal beam diagnostic system schematics.
Jne 04 00010 g001
Figure 2. The sodium beam spectrum (a) and a potential CX line spectrum (b) when the alkali beam is on (blue) and off (orange).
Jne 04 00010 g002
Figure 3. The entire W7-X alkali metal beam diagnostic system (section view) with the injector (1), first observation system (2), second observation system (3), and the optical fiber patch box (4).
Jne 04 00010 g003
Figure 4. Section view of the optics system consisting of the vacuum window (1), optics holder (2), side closure (3), folding mirrors (4), objective (5), objective holder (6), rotating unit (7), fiber plate (8), fiber plate holder (9), optical fibers (10), and the fiber bundle holder (11).
Jne 04 00010 g004
Figure 5. Original fiber plate design (CAD design, manufacturing drawing, photo, and microscopy image).
Jne 04 00010 g005
Figure 6. Simplified fiber plate design (CAD design, manufacturing drawing, photo, and microscopy image).
Jne 04 00010 g006
Figure 7. Fiber arrangement—theoretical (a) and result (b).
Jne 04 00010 g007
Figure 8. Photo of the semi-transparent screen (a); calibration rod setup (b); CMOS camera image of the semi-transparent screen (c).
Jne 04 00010 g008
Figure 9. Image of all the fibers on the semi-transparent screen taken by the AEB20 CMOS camera (merged image).
Jne 04 00010 g009
Disclaimer/Publisher’s Note: The statements, opinions and data contained in all publications are solely those of the individual author(s) and contributor(s) and not of MDPI and/or the editor(s). MDPI and/or the editor(s) disclaim responsibility for any injury to people or property resulting from any ideas, methods, instructions or products referred to in the content.

