

Body Image, Body Composition, and Aging in Women: Insights into an Older Adult Problem


School of Public Health Sciences, University of Waterloo, Waterloo, ON N2L 3G1, Canada
Women 2023, 3(2), 214-224; https://doi.org/10.3390/women3020017
Submission received: 2 March 2023
/
Revised: 30 March 2023
/
Accepted: 5 April 2023
/
Published: 12 April 2023
(This article belongs to the Topic Women's Health and Aging)
Abstract
:Body image is understudied in aging women. The present perspective article reviews body image, body composition, and aging in women. Sarcopenia, a condition of low muscle mass, is associated with aging, and sarcopenia in combination with excessive body fat causes sarcopenic obesity. Findings of improved health in people with a higher body mass index, known as the obesity paradox, are due to misclassifying healthy people as overweight according to height and body weight instead of according to fat mass and fat-free mass. Body fat infiltrates internal organs in aging adults as increasing levels of body fat are redistributed into the trunk, especially in the abdomen, while subcutaneous fat in the appendages decreases. Accuracy of body image perceptions can determine an individual’s control of body weight. Aging women can protect against sarcopenic obesity by increasing fat-free mass with resistance training and by lowering body fat levels with weight management knowledge and skills. Healthy dietary patterns are low in ultra-processed foods that stimulate excessive consumption of calories and increase body fat levels. In combination with the phosphate additives in ultra-processed food which increase sarcopenia and aging, the present article proposes an etiological pathway in which ultra-processed food consumption eventually leads to aging-related sarcopenic obesity.
1. Introduction
Noting that the proportion of older people in the world is increasing, the World Health Organization (WHO) defined biological aging as “the accumulation of a wide variety of molecular and cellular damage over time” which “leads to a gradual decrease in physical and mental capacity, a growing risk of disease and ultimately death” [1]. Importantly, the WHO also noted that aging effects within the population are inconsistent, nonlinear, and exhibit a diversity of changes, implying that aging at an individual level may be modifiable with healthy lifestyle behaviors. Accordingly, people’s attitudes toward their bodies may influence lifestyle behaviors that affect aging. Conversely, aging effects may influence people’s attitudes toward their bodies.
Studies of body image have mostly focused on younger populations, with significantly fewer studies investigating body image in populations of aging adults [2]. The present perspective paper used a Grounded Theory–Literature Review method (GT-LR)—an inductive approach that synthesizes new knowledge through a comparative analysis of published findings from the research literature [3]. GT–LR was used to examine aging and women’s body image—defined as the way people feel about and view their bodies [4]. The paper also examines body composition changes in aging women and reviews knowledge and skills for effective weight management to control undesirable changes in body fat and fat-free mass.
2. Sarcopenic Obesity
Physical changes associated with aging include reduced bone mass, increased hypervolemic retention of extracellular fluids, and sarcopenia, a condition of reduced skeletal muscle mass due to muscle atrophy, reduced muscle strength, and low quality of muscle (e.g., changes in muscle architecture and composition from fat infiltration), all of which increase the burden of health care costs [5]. These physical changes are associated with lower nutritional status and physical disability which accelerate “molecular and cellular damage overtime”, according to the WHO definition of biological aging [1]. Furthermore, changes associated with lower nutritional status and physical disability, including unintended weight loss, low energy, exhaustion, slow walking gait, and weak grip strength, contribute to a state of frailty with increased risk of all-cause and cause-specific mortality [6]. Decreased quality of life and increased comorbid conditions occur most often in older adults who have both sarcopenia and excessive body fat—known as sarcopenic obesity [7]. Accurate measurements of body fat and fat-free mass in sarcopenic obesity can be obtained with dual-energy X-ray absorptiometry.
Excess body weight in older adults is associated with a higher prevalence of cardiovascular disease, several cancers, metabolic disease, and many other medical conditions [8]. A study published in 2000 analyzed obesity, sarcopenia, and sarcopenic obesity by age in the New Mexico Elder Health Survey and New Mexico Aging Process Study [7]. Sarcopenia prevalence, independent of body fat levels, increased from about 15% in adults aged 60 to 69 years to about 40% in adults older than 80 years. Sarcopenic obesity increased from about 2% in adults aged 60 to 69 years to about 10% in adults over 80 years. The study also found that the prevalence of people having obesity without sarcopenia decreased with aging within an approximate range of 55% to 30%. However, the researchers suggested that rather than losing body fat with age, obese people are more likely to lose muscle mass as they age, which causes sarcopenic obesity.
3. The Obesity Paradox and Body Composition
In 1999, Fleischmann et al. observed protective health benefits in overweight people, including higher survival rates among patients in hemodialysis who weighed more than patients classified as normal weight or lower according to the Body Mass Index (BMI) which is based on height and body weight [9]. Similarly, researchers studying myocardial infarction in patients with coronary artery disease also found that patients who were classified as obese or overweight by BMI standards had lower mortality rates at one year and fewer in-hospital complications compared to patients classified as normal weight, which the researchers described with the coined term obesity paradox [10].
Based on published findings on the obesity paradox, recent research continues to search for answers explaining how excessive body weight in aging protects health [11]. Nevertheless, the obesity paradox in older adults is most likely an artifact of information bias due to overestimating adiposity based on body weight and height, as measured by the BMI, instead of measuring specific body fat and fat-free mass levels. Consequently, the BMI may miscategorize healthy people as overweight for their height because they carry more protective fat-free mass such as skeletal muscle, bone, and other healthy organ and cellular tissue.
An interesting study recently supporting the obesity paradox in heart failure patients used body composition analysis instead of the BMI to estimate patients’ fat-free mass and body fat levels, finding that higher body fat percentages were correlated with fewer cardiac events in patients. However, retained extracellular fluid in hypervolemia (fluid overload) is common in congestive heart failure patients [12], and retained extracellular fluid can distort body composition analyses by overestimating fat-free mass levels, thereby providing biased underestimations of body fat percentages [13]. Feasibly, heart failure patients with more cardiac events and higher levels of hypervolemia may appear to have comparatively lower body fat percentages than other patients due to biased overestimations of fat-free mass. More research is needed to investigate this controversy.
Body fat tends to infiltrate internal organs in aging adults as increasing levels of body fat are redistributed into the trunk, especially the abdomen, while subcutaneous fat in the appendages decreases [14]. A recent study in Taiwan investigating associations of body composition, age, and gender with all-cause mortality measured participants’ fat mass index (FMI), fat-free mass index (FFMI), skeletal muscle mass index (SMMI), and visceral-fat-area index (VFAI) [15]. In adults aged 65 years, the FFMI and SMMI were found to have a negative association with all-cause mortality in the total group, in both males and females, while the FMI and VFAI were only positively associated with mortality in females.
Another lesser-known paradox related to the obesity paradox, coined here as the gender body fat paradox, implies that healthy females normally carry a higher amount of body fat than healthy males, which is implied from higher body fat percentages in women compared to men [16]. Once again, this is likely an artifact of information bias when calculating body fat percentages while failing to account for differences in fat-free mass between average females and males [17]. Proportions of fat-free mass from skeletal muscle in overall body weight are higher in average males than females, thereby mathematically lowering the calculation of body fat percentages in males. In other words, even allowing for additional fat in reproductive tissue, women generally have higher body fat percentages compared to men mostly because women have lower muscle mass levels in proportion to their body weight.
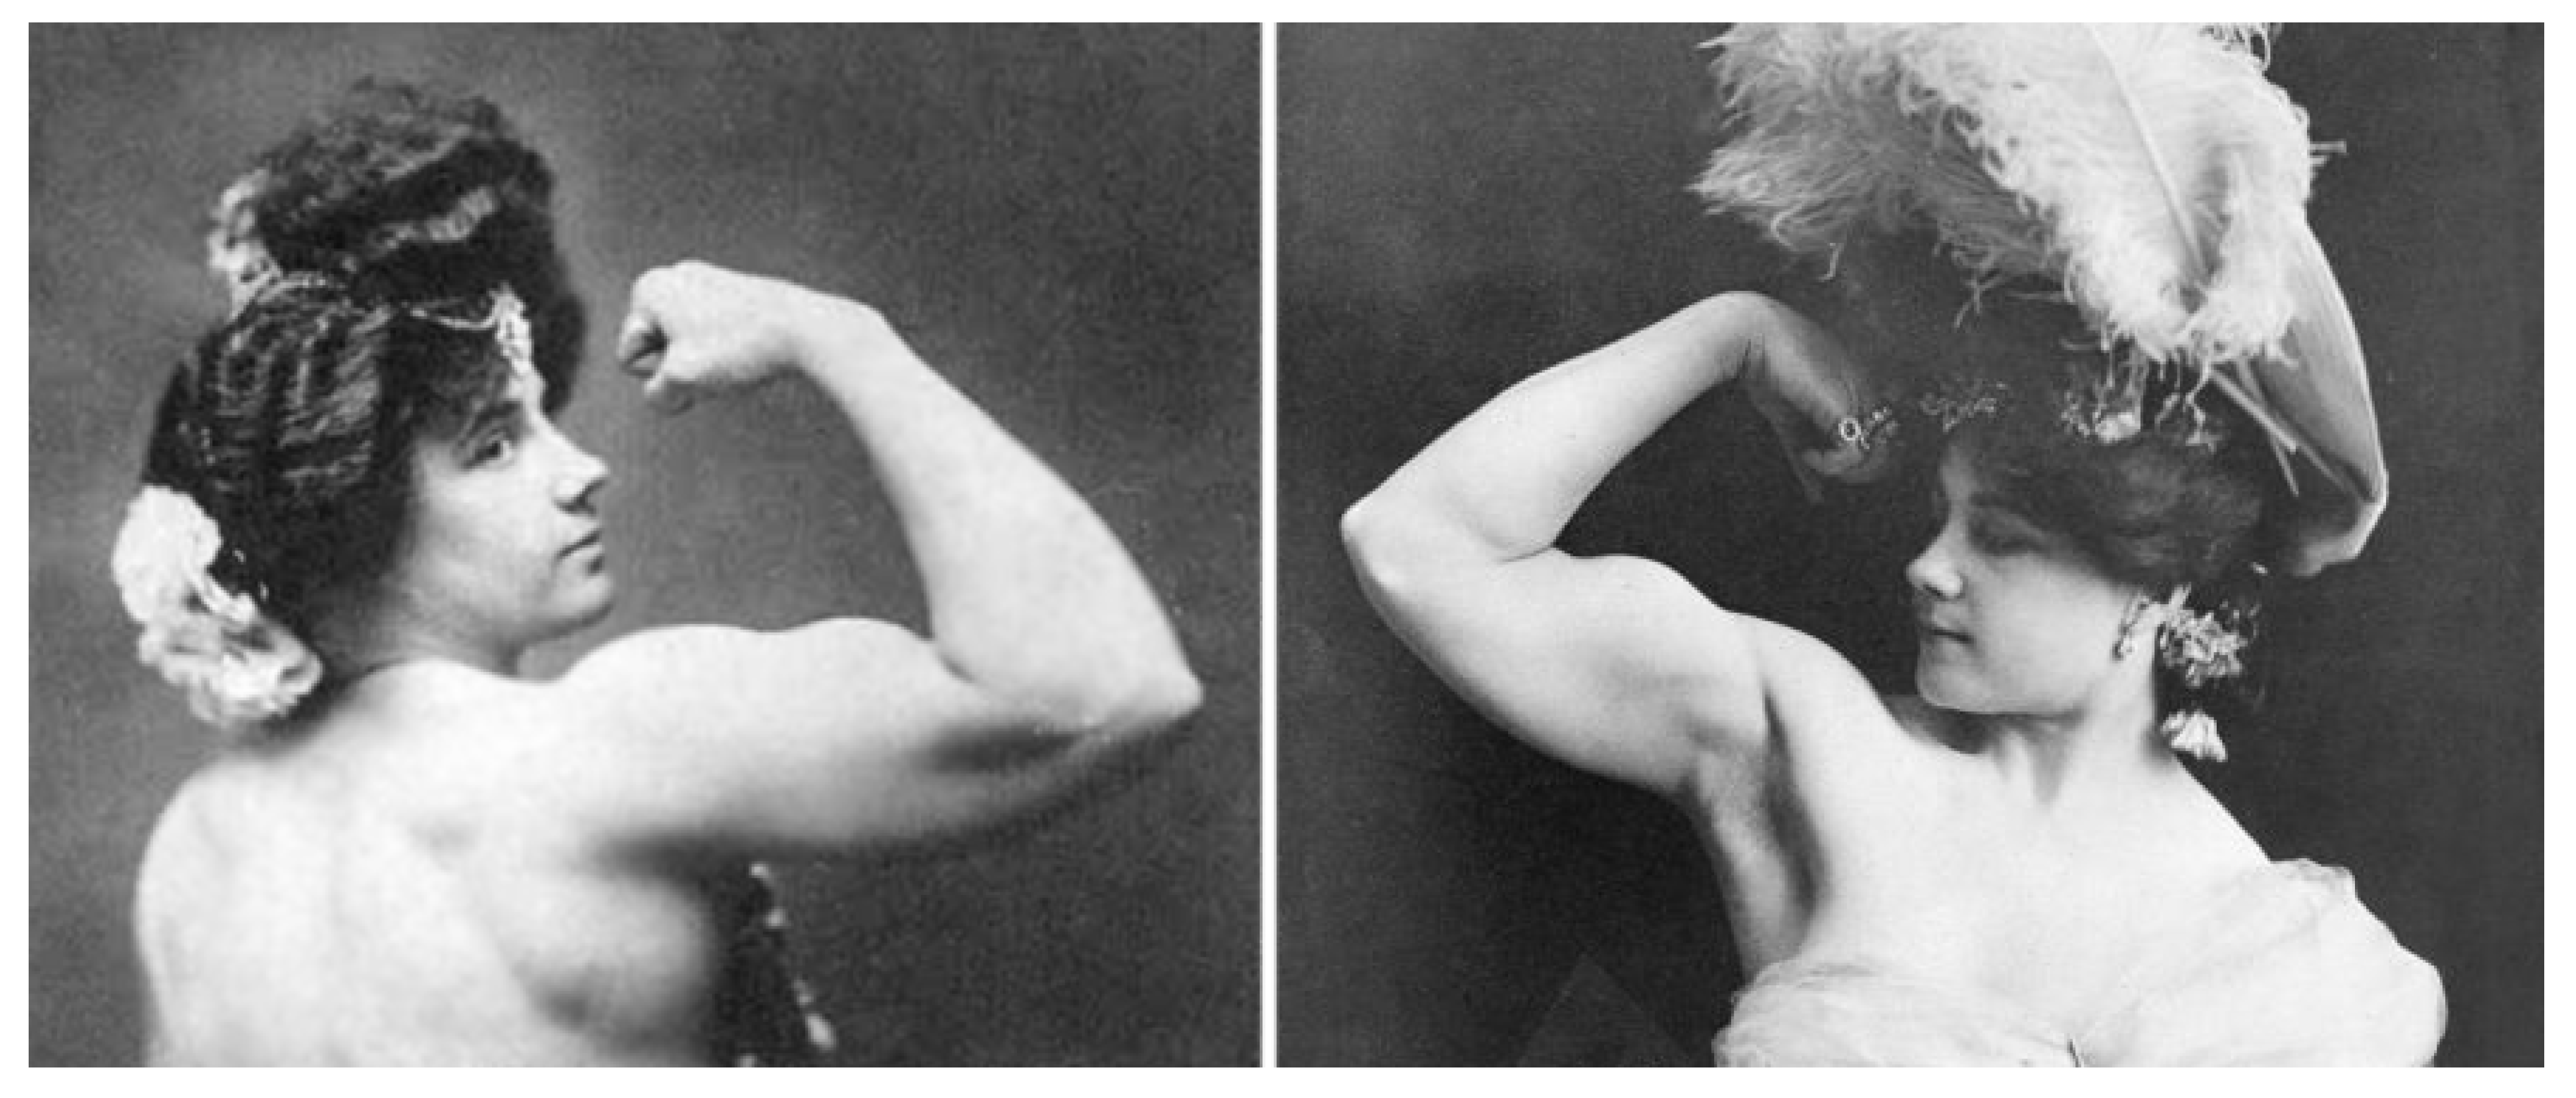
Interestingly, healthy females who compete in physique events attain low body fat levels and use resistance exercise training to increase skeletal muscle levels, displaying muscle and body fat proportions for their body weight approaching the proportions of male athletes [18]. This is not surprising when considering that higher levels of protein synthesis in skeletal muscle were found in women compared to men at young and older ages [19], and young and older women have the same muscle volume response from strength training as young and older men [20]. Figure 1 shows Charmion, a strongwoman from the late 19th century, before modern performance-enhancing drugs became popular.
Nevertheless, as average females age, muscle loss from age-associated sarcopenia has a more negative health effect on females who are already lower in proportional levels of fat-free mass compared to males. “Resistance exercise (RE) is recommended as the first-line treatment for counteracting the deleterious consequences of sarcopenia in older adults” [21]. An adult female does not have to attain the muscle mass of a late 19th century strongwoman to benefit from adequate levels of lean muscle, nor does she have to invest money in protein supplements to achieve satisfying results. A systematic review and meta-analysis of randomized controlled trials found that protein supplements have little effect on improving muscular size, strength, functioning ability, and body composition in older adults training with resistance exercise [22].
Unfortunately, cultural stereotypes continue to associate muscle mass in females with masculinity [18], which may discourage females, especially younger females, from achieving levels of skeletal muscle mass that could protect their health as they advance in age. Additionally, cultural stereotypes that associate higher body fat levels with females may also support yet another paradox, the fat but fit paradox which states that “high cardiorespiratory fitness (CRF) might mitigate the detrimental effects of excess body weight on cardiometabolic health” [23]. Based on the association of the higher BMI levels observed in healthy people, the evidence is insufficient to suggest that one can be fat and still be fit, mainly because, due to the lack of body composition assessments as previously described, BMI levels are biased and overestimate a healthy individual’s level of body fat.
At the other extreme, collateral harm to heavier people from society’s stigmatization of excessive body weight and body fat [24] has spawned movements such as Healthy At Every Size (HAES) and the fat acceptance movement [25]. All people at every physical size have a right to be treated with fairness and respect without prejudgment by others, which is among the aims of HAES. Fat acceptance social movements emphasize the need to establish a healthy balance in how society views and handles the epidemic of overweight and obesity, which is as much a societal problem as a medical one, as it has many determinants beyond the control of individuals [26]. By contrast, the biomedical and health science model of the cause of obesity blames an individual’s “excess caloric consumption and lack of physical activity” as the principal causes of the pathophysiological mechanisms and adverse health outcomes associated with obesity [27]. Furthermore, controversy arises if the public views fat acceptance as a movement that denies or disparages credible evidence-based health risks associated with obesity and overweight [28].
4. Obesity Determinants
According to adult obesity facts published by the U.S. Centers for Disease Control and Prevention (CDC) [29], U.S. obesity prevalence in 2017 was 41.9%, which increased from 30.5% in 1999–2000. During the same time period, severe obesity prevalence also increased from 4.7% to 9.2%. Obesity-related conditions “are among the leading causes of preventable, premature death”, and include heart disease, stroke, type 2 diabetes, and certain cancers. Estimated in 2019 dollars, the annual medical cost of obesity in the United States in 2017 was approximately $173 billion.
The two social determinants most consistently associated with obesity are socio-economic status (SES) and inequality [30]. Higher obesity rates are found in adults with lower SES in high-income countries and in countries with more social inequality in general. In addition to social determinants, individual and environmental determinants also play a role in the development of obesity [26]. Specific to the aging population, a qualitative study investigating determinants of health that affect obesity in older people found three main themes within a community context [31]:
- Influences of the neighborhood food environment, with easy access to unhealthy food, and no choices to select nutritious food.
- Social network influence on obesity, including family preferences for food choices, low priority for exercise, and beliefs and perceptions of body image socially imposed on the aged that contribute to obesity.
- Individual knowledge, attitudes, and beliefs behind lifestyle choices that cause obesity in older adults, including lack of awareness, personal attitudes, and job and familial duties as barriers to engaging in physical activities, as well as over-consumption behaviors leading to obesity in older people.
5. Weight Management Knowledge and Skills
The accuracy of an individual’s body image perceptions can determine an individual’s control of body weight. “Overweight people misperceiving their weight were observed to be less likely to desire or pursuit weight control than accurate weight perceivers” [2]. Because weight gain with increasing age is associated with increased risk of disease and comorbid conditions, strengthening accuracy of body image and perception of overweight in older people “may contribute to more effective health practices and higher quality of life”. Of some concern, a systematic review of studies in aging adults suggests that “aging is associated with a decrease in weight concerns and lower overweight perception” [2]. Interestingly, the systematic review also found that women over 55 years of age had less concern for losing weight than similarly aged men, which is reversed in younger men who have less concern for losing weight than younger women.
5.1. Caloric Requirements
Estimating individual caloric requirements for weight management can involve complicated formulas to calculate basal metabolic rate and total daily energy expenditure based on age, gender, activity levels, body weight, and height, providing a potential barrier to pursuing weight control. However, a much simpler formula suggests that the difference in caloric intake between goals of healthy weight loss, weight maintenance, and weight gain for most people amounts to a mere three calories per pound of body weight for each successive goal [32,33]. In general, an individual needs to eat 12–13 calories per pound of body weight to lose body fat while maintaining fat-free mass, and consume 15–16 calories per pound to maintain a healthy body weight once it is obtained. Additionally, 18–19 calories per pound of body weight are needed to gain healthy fat-free mass in combination with resistance exercise targeting muscle growth. For most people these formulas allow approximately 500 additional calories above weight maintenance to gain healthy weight, and approximately 500 fewer calories below weight maintenance to lose body fat while preserving fat-free mass. If an individual is losing weight and burns an additional 500 calories from physical activity, weight can be lost at a rate of 1000 calories per day or 2 pounds of body fat per week at 3500 calories per pound of fat.
Lack of knowledge and skills to precisely measure and adjust the small incremental differences in calorie intake necessary for weight loss and weight maintenance is the most logical explanation for the high failure rates in maintaining long-term weight loss. Only about 20% of people who lose significant amounts of weight manage to keep the weight off for twelve months, and more than 50% of lost weight on average is regained after two years [34,35]. Unfortunately, many popular weight-loss methods discourage individuals from developing an awareness of precise caloric intake when dieting for weight loss, offering instead diet plans that restrict calories below maintenance levels which may be initially effective when followed. Eventually, however, lacking the skill and knowledge to precisely adjust caloric intake back up to healthy maintenance levels after losing weight (an increase of only three calories per pound of body weight), individuals may be susceptible to falling back on old overeating habits and regaining lost body weight.
5.2. Self-Monitoring
Self-monitoring caloric intake using diet journals is consistently the most effective method to master effective weight management skills and achieve lasting weight management goals [36]. Regularly self-monitoring changes in body composition with inexpensive methods such as skin-fold calipers, regression formulas involving anthropometric measurements such as waist and hip size, or bioelectric impedance devices are also useful to further adjust caloric intake and activity levels and safely meet one’s healthy weight management and body composition goals [37]. Digital tools to self-monitor caloric intake are also increasingly available to the public and have been found effective for weight loss [38]. Using these tools, individuals can monitor undesirable losses in fat-free mass due to overly rapid weight loss, and they can adjust their diet and activity levels accordingly while controlling body fat levels. Intermittent fasting is another weight management technique that may be incorporated into a weight management plan to monitor and manage caloric intake over limited time periods throughout the day [39].
5.3. Activity Levels and Energy Balance
A variety of physical activities that increase aerobic metabolism of body fat for energy purposes can also be integrated into a comprehensive weight management program [40]. Low-intensity aerobic activities, such as walking and easy bicycling, are effective in increasing calorie expenditures if engaged in for moderate periods. Higher intensity anaerobic activities that burn more carbohydrates from glycogen stored in muscle and the liver are more useful for stimulating muscle growth, and both aerobic and anerobic activities should be included in a weight management program. “Aerobic exercise reduces weight and improves cardiopulmonary fitness in obese subjects better than anaerobic exercise” [40]; however, anaerobic resistance exercise is necessary to increase and maintain skeletal muscle mass, which is especially important for older people to prevent sarcopenic obesity [41]. The advantages of low or moderate intensity aerobics such as walking include greater manageability and increased reductions in fat mass in combination with dietary control [42].
Knowledge and skills are also required to monitor and adjust energy balance, the balance between caloric intake and caloric expenditures which include activity levels and one’s resting metabolic rate (RMR), the number of calories burned by the body at rest [43]. Because RMR is largely determined by the quantity of fat-free mass, reducing one’s caloric intake to levels below RMR levels likely explains why fat-free mass is metabolized for energy if calorie intake is insufficient to provide energy for fat-free mass maintenance [44]. In a study from 1967, Ball et al. found that a diet severely restricting daily calories in obese patients (600–800 calories) resulted in a 30% loss of fat-free mass, which increased to over 85% loss during total starvation [45]. Increasing calorie intake rapidly restored fat-free mass lost from over-restricting calories, and Ball et al. reported “considerable accumulation of lean tissue” as weight was regained in previously fasted obese patients [45]. However, rapid changes in fat-free mass can have a negative impact on crash dieters as they observe their weight rebounding, not realizing that weight gains can include recovery of healthy fat-free mass lost from over-restricting calorie intake. Recovery of lost fat-free mass also helps restore RMR to normal levels, which accounts for approximately 60% to 75% of overall calorie expenditures [46].
Knowledge and skills using a self-monitoring approach to accurately adjust energy balance and meet body composition goals also has potential use in treating eating disorders which lead to anorexia nervosa, bulimia nervosa, and binge–purging disorder [47]. Women with late-life eating disorders have a higher risk of death from cardiovascular complications and other complications associated with eating disorders [48], and more research in recovery from eating disorders could be especially valuable for aging women.
6. Healthy Dietary Patterns
Even if one calculates the exact quantity of calories required for weight management, other factors that influence food intake must be considered. One such factor is the influence of the quality of food consumed. Dietary patterns can range from providing predominantly whole unprocessed natural foods with a high nutritional value, which contribute to health, to providing highly refined ultra-processed foods with a lower nutritional value, which increase illness and disease risks. The following research shows that consuming highly processed food is also associated with weight gain and biological aging.
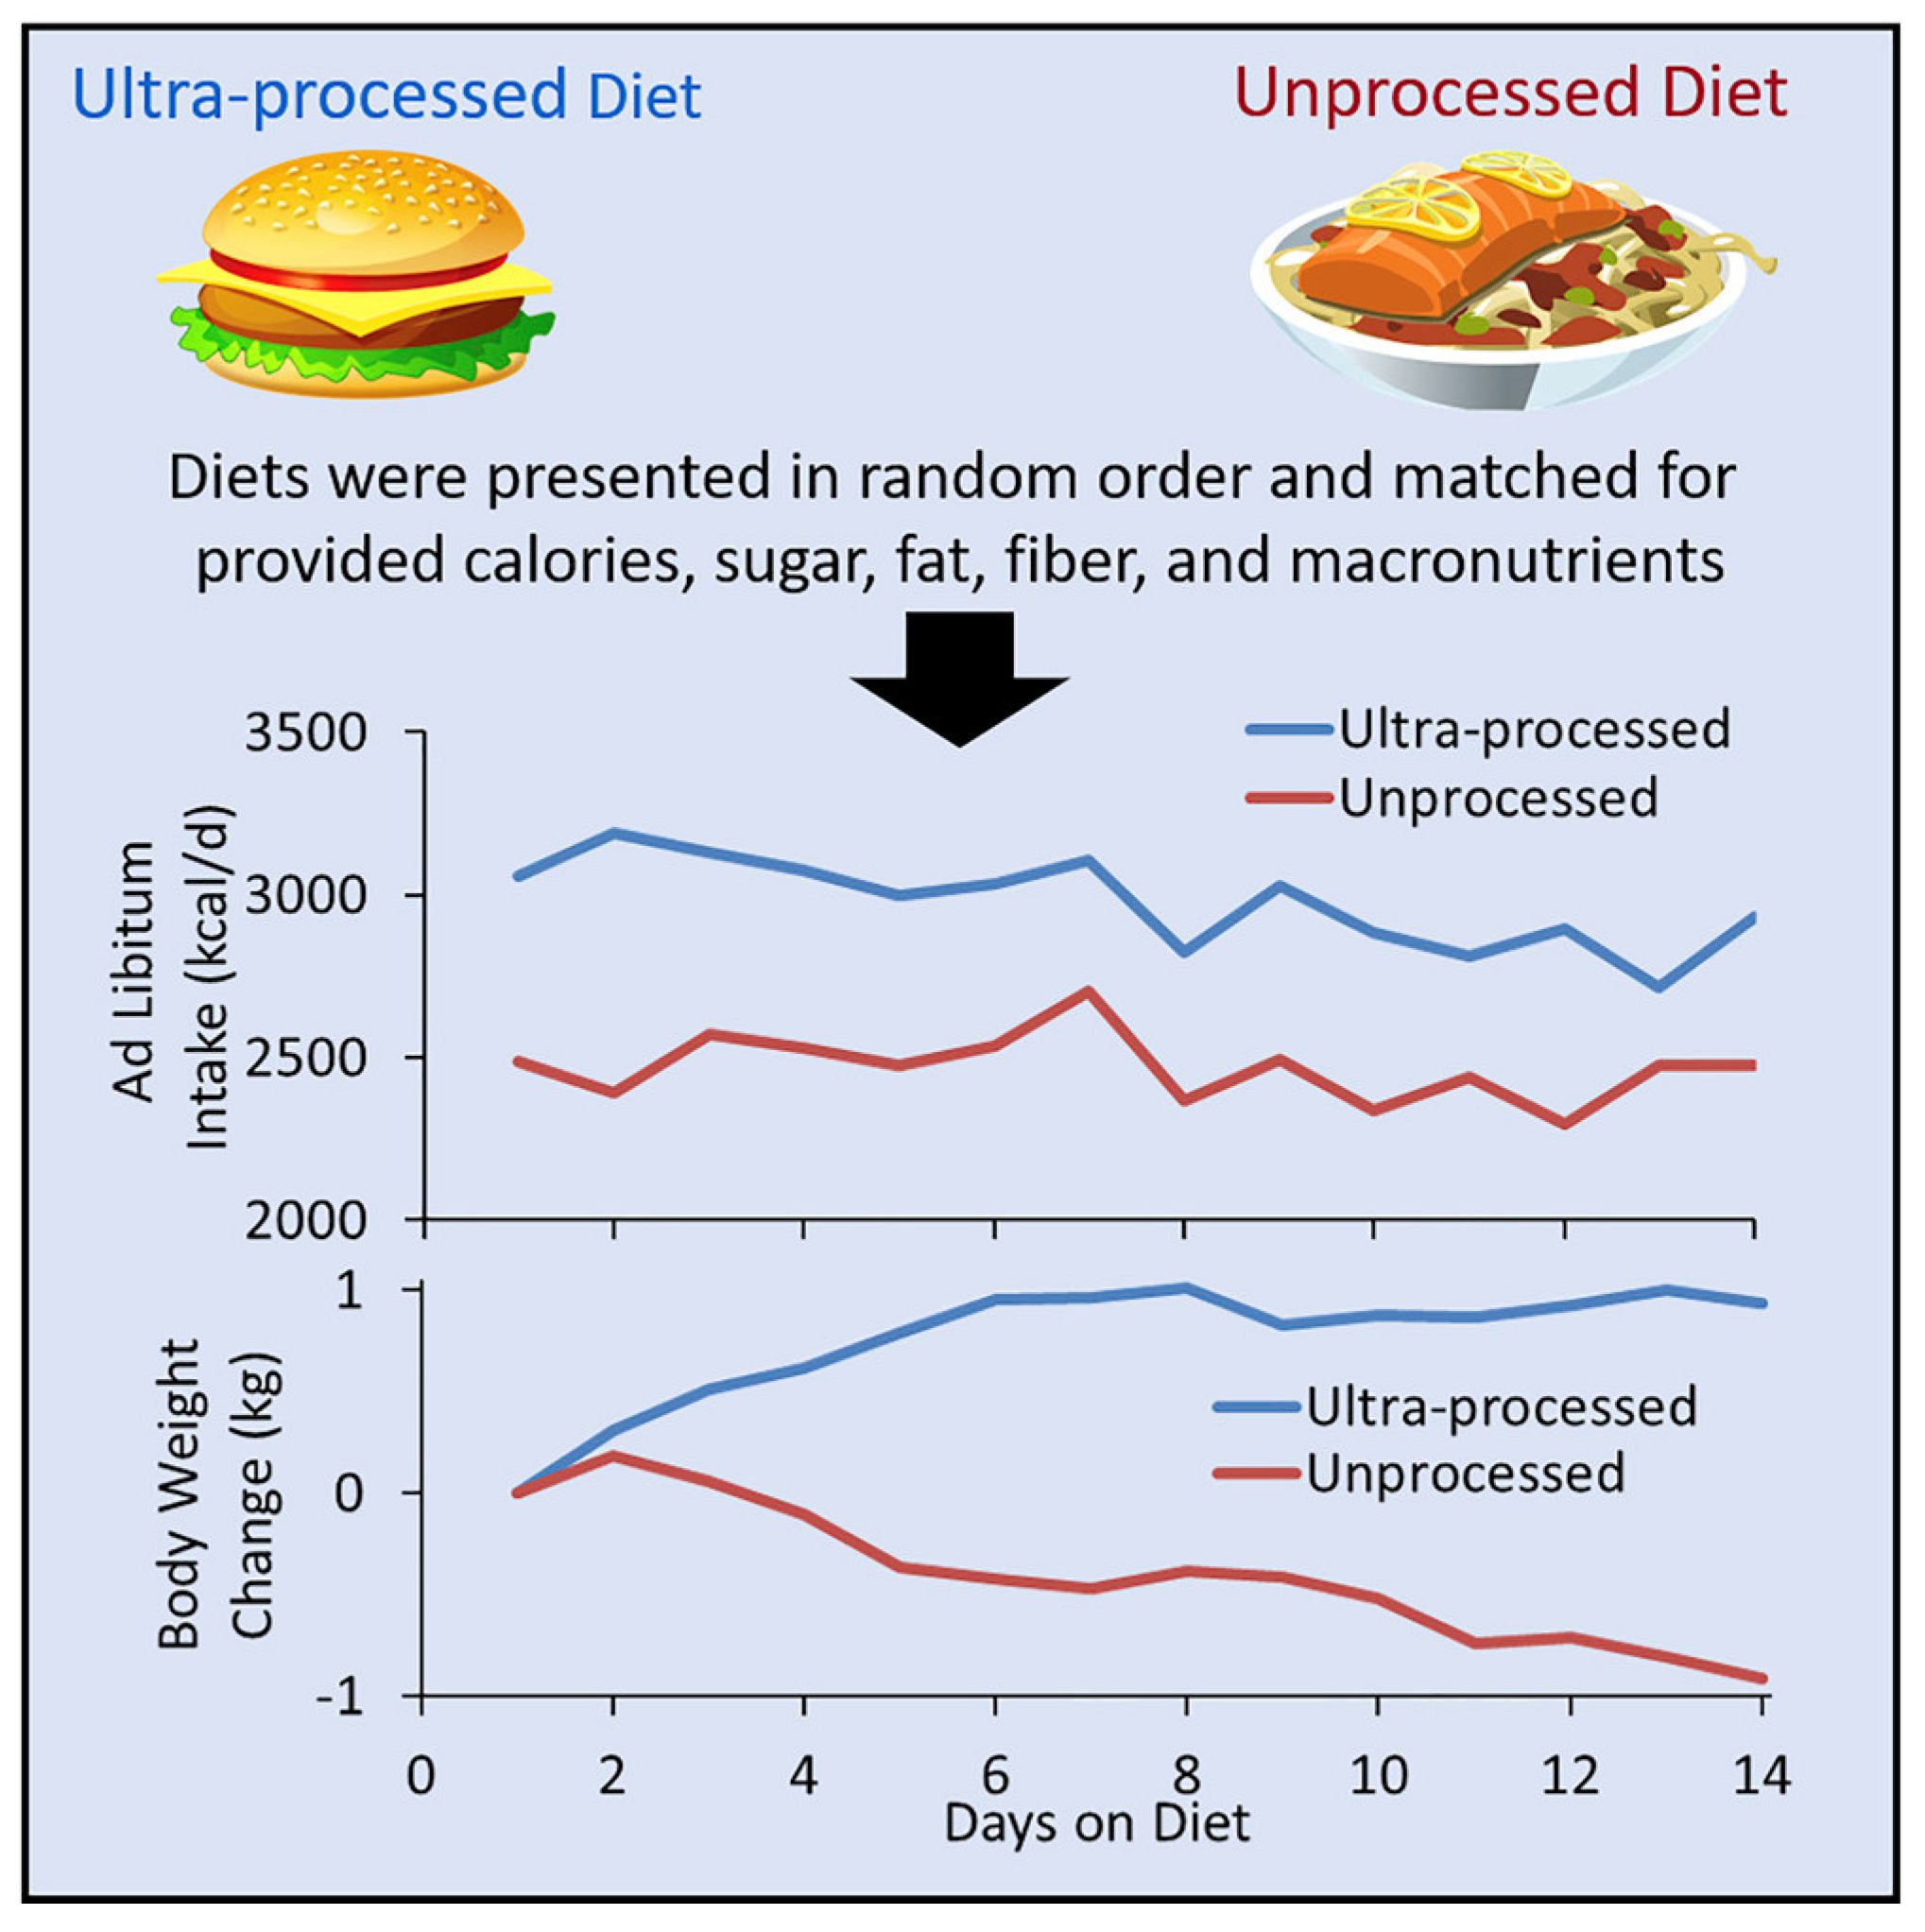
The popularity of ultra-processed foods that are high in fat, sugar, and salt coincides with the worldwide rise in obesity [49], and ultra-processed foods currently provide the majority of energy from calories, 57.9%, in the U.S. diet [50]. A 2019 randomized controlled trial sponsored by the U.S. National Institutes of Health provided twenty adults with three meals a day and snacks on a diet consisting entirely of either ultra-processed foods or unprocessed foods [51]. After two weeks, the participants switched diets for an additional two weeks. Each diet contained similar amounts of calories, macronutrients, fiber, sodium, and sugar, and participants were allowed to eat any amount of food they desired. Results showed that participants eating the ultra-processed diet consumed approximately 500 additional daily calories compared to those consuming the unprocessed diet, and participants on the ultra-processed diet gained an average of two pounds of body weight over two weeks. Weight gain was reversed when participants consumed the unprocessed diet, with losses of approximately two pounds of body weight over two weeks.
Figure 2 shows body weight changes in participants when following ultra-processed and unprocessed diets during the trial. Importantly, participants reported favorable taste and satiety on both diets. The implications of the results of this controlled experiment are that ultra-processed food is flavorful and satisfying but stimulates people to overeat and gain excessive body weight, while unprocessed food provides flavor and satisfaction with smaller amounts of food without inducing people to overeat. Although both diets were matched for energy density; fiber; and macronutrients, i.e., calories, protein, fat, and carbohydrates, the diets were not matched for overall nutrient density, including vitamins, minerals, enzymes, phytochemicals, etc. as they naturally occur in whole foods The study’s results may be causatively linked to greater overall nutrient density in unprocessed food compared to ultra-processed food, implying that consumption of lower amounts of natural, whole, unprocessed food is sufficient for adequate nourishment, but further investigations are warranted.
Telomers and Phosphate Additives
Another study of ultra-processed food investigated whether telomere length is affected by dietary factors through oxidation and inflammation mechanisms [52]. Telomeres, the noncoding sections located at the end of chromosomes, shorten over the life span with each cell division, and telomeres are considered markers of biological age [53] The cross-sectional study with 886 participants from a population of older adults evaluated the association between the consumption of ultra-processed food and the odds of having short telomeres. Results showed that those participants with the highest ultra-processed food consumption “had almost twice the odds of having short telomeres compared with those with the lowest consumption (adjusted OR: 1.82; 95% CI: 1.05, 3.22; P-trend = 0.03)”.
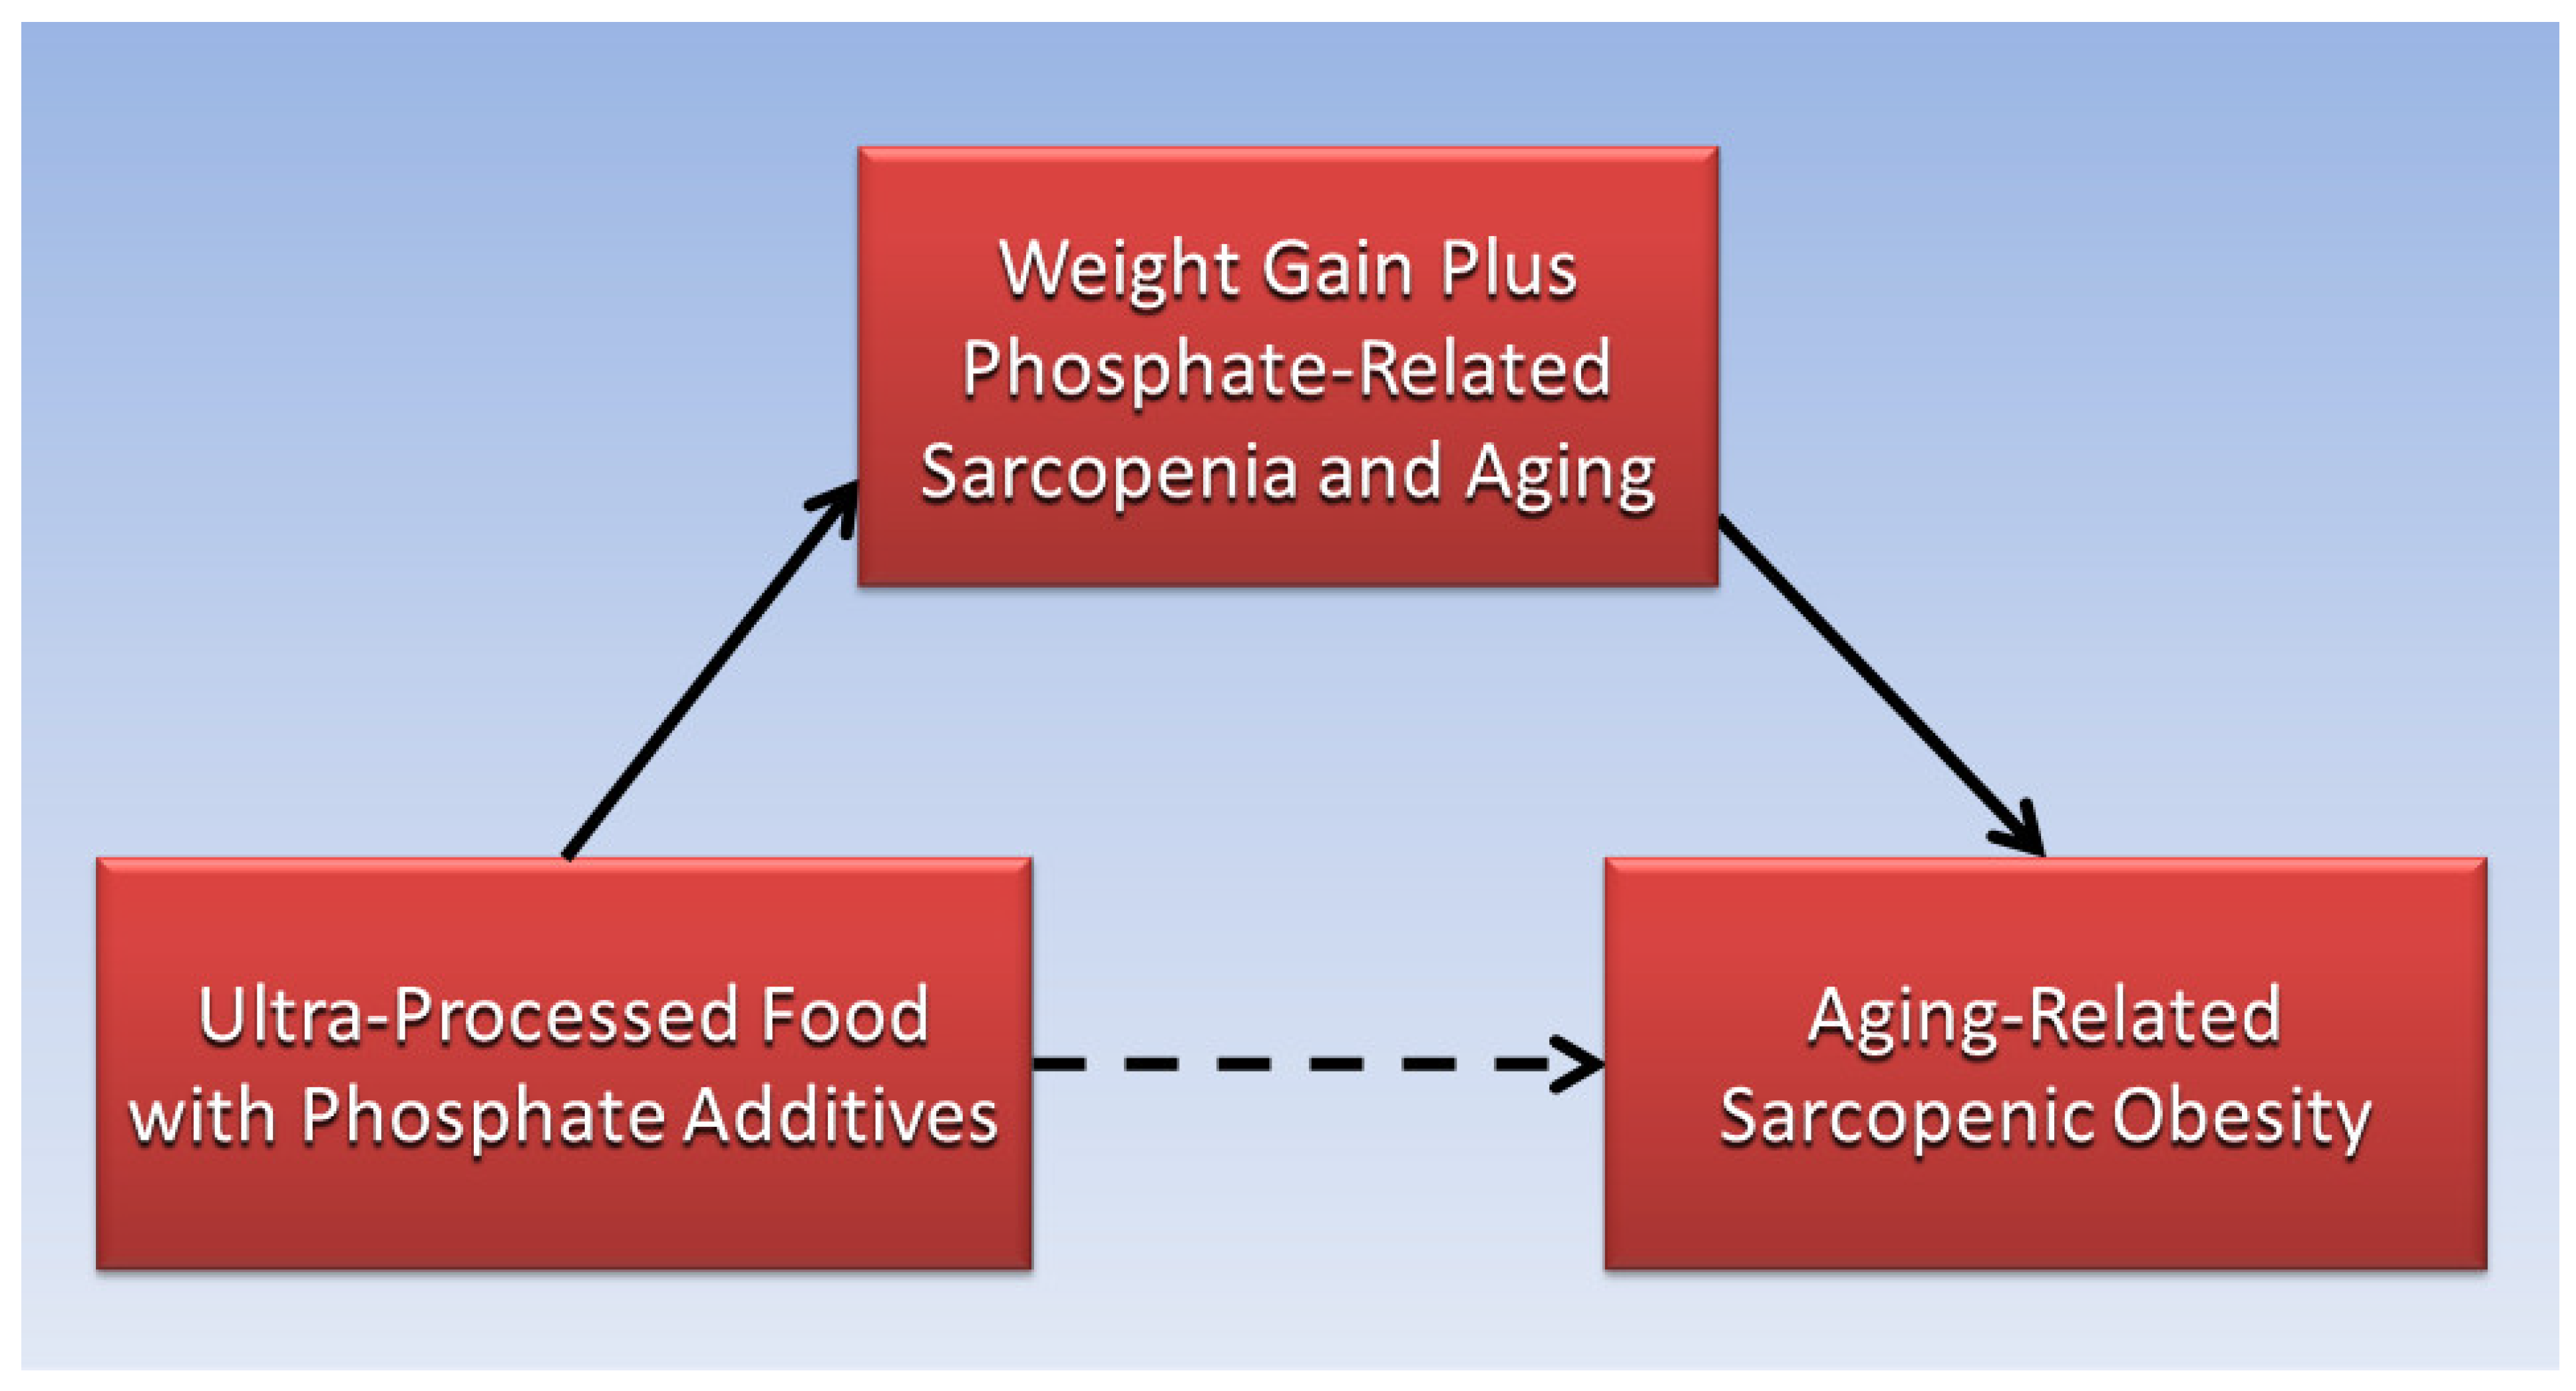
Finally, a mouse model of aging found that excessive amounts of dietary phosphates from the essential mineral phosphorus are associated with sarcopenia and other morphological changes in aging [54]. Further evidence links high serum phosphate levels with low muscle strength, or dynapenia, a condition used in the definition of frailty [55]. Moreover, sarcopenia is associated with aging-related impairment of mitochondria, which normally produce energy in muscle cells [56], and mitochondrial dysfunction is associated with accumulation of calcium phosphate [57]. Coincidently, phosphate additives are common in ultra-processed foods [58]. Accordingly, as illustrated in Figure 3, the present perspective paper proposes a causative pathway in which weight gain from ultra-processed food, combined with sarcopenia and aging from phosphate additives in ultra-processed food, increases risk of aging-related sarcopenic obesity. This etiological pathway can be integrated with individual, social, and environmental determinants of obesity to inform further research into the cause and prevention of aging-related sarcopenic obesity.
Table 1 summarizes nutritional and physical activity recommendations to help adults over age 65 maintain good health and quality of life.
7. Conclusions
Studies of body image, body composition, and aging in women are lacking. Sarcopenia associated with aging, in combination with excessive body fat, causes sarcopenic obesity. The obesity paradox is based on the BMI which misclassifies healthy people as overweight by failing to measure fat mass and fat-free mass. Body composition changes in aging as body fat is redistributed to the trunk and especially to the abdomen. The accuracy of body image perceptions can determine an individual’s control of body weight. Aging women can increase fat-free mass with resistance training and decrease fat mass with weight management knowledge and skills. Healthy dietary patterns are low in ultra-processed foods that increase body fat levels. In combination with the phosphate additives in ultra-processed food, an etiological pathway is proposed in which ultra-processed food consumption eventually leads to aging-related sarcopenic obesity.
Funding
This research received no external funding.
Institutional Review Board Statement
Not applicable.
Informed Consent Statement
Not applicable.
Data Availability Statement
Not applicable.
Conflicts of Interest
The author declares no conflict of interest.
References
- WHO.Int. Ageing and Health. Available online: https://www.who.int/news-room/fact-sheets/detail/ageing-and-health (accessed on 23 February 2023).
- Bouzas, C.; Bibiloni, M.D.M.; Tur, J.A. Relationship between Body Image and Body Weight Control in Overweight ≥55-Year-Old Adults: A Systematic Review. Int. J. Environ. Res. Public Health 2019, 16, 1622. [Google Scholar] [CrossRef] [Green Version]
- Wolfswinkel, J.F.; Furtmueller, E.; Wilderom, C.P.M. Using grounded theory as a method for rigorously reviewing literature. Eur. J. Inf. Syst. 2013, 22, 45–55. [Google Scholar] [CrossRef]
- Midlarsky, E.; Morin, R. Body image and aging. In The SAGE Encyclopedia of Psychology and Gender; SAGE Publications, Inc.: Thousand Oaks, CA, USA, 2017; pp. 227–230. [Google Scholar]
- Cruz-Jentoft, A.J.; Bahat, G.; Bauer, J.; Boirie, Y.; Bruyère, O.; Cederholm, T.; Cooper, C.; Landi, F.; Rolland, Y.; Sayer, A.A.; et al. Sarcopenia: Revised European consensus on definition and diagnosis. Age Ageing 2018, 48, 16–31. [Google Scholar] [CrossRef] [Green Version]
- Peng, Y.; Zhong, G.-C.; Zhou, X.; Guan, L.; Zhou, L. Frailty and risks of all-cause and cause-specific death in community-dwelling adults: A systematic review and meta-analysis. BMC Geriatr. 2022, 22, 725. [Google Scholar] [CrossRef]
- Baumgartner, R.N. Body composition in healthy aging. Ann. N. Y. Acad. Sci. 2000, 904, 437–448. [Google Scholar] [CrossRef] [PubMed]
- Samper-Ternent, R.; Al Snih, S. Obesity in Older Adults: Epidemiology and Implications for Disability and Disease. Rev. Clin. Gerontol. 2012, 22, 10–34. [Google Scholar] [CrossRef] [PubMed] [Green Version]
- Fleischmann, E.; Teal, N.; Dudley, J.; May, W.; Bower, J.D.; Salahudeen, A.K. Influence of excess weight on mortality and hospital stay in 1346 hemodialysis patients. Kidney Int. 1999, 55, 1560–1567. [Google Scholar] [CrossRef] [Green Version]
- Gruberg, L.; Weissman, N.J.; Waksman, R.; Fuchs, S.; Deible, R.; Pinnow, E.E.; Ahmed, L.M.; Kent, K.M.; Pichard, A.D.; Suddath, W.O.; et al. The impact of obesity on the short-term and long-term outcomes after percutaneous coronary intervention: The obesity paradox? J. Am. Coll. Cardiol. 2002, 39, 578–584. [Google Scholar] [CrossRef] [Green Version]
- Bosello, O.; Vanzo, A. Obesity paradox and aging. Eat. Weight Disord. 2021, 26, 27–35. [Google Scholar] [CrossRef]
- Miller, W.L. Fluid Volume Overload and Congestion in Heart Failure. Circ. Heart Fail. 2016, 9, e002922. [Google Scholar] [CrossRef] [Green Version]
- Wu, T.J.; Huang, J.J.; Lin, C.Y. Effects of fluid retention on the measurement of body composition using bioelectric impedance. J. Formos. Med. Assoc. 1994, 93, 939–943. [Google Scholar] [PubMed]
- Ponti, F.; Santoro, A.; Mercatelli, D.; Gasperini, C.; Conte, M.; Martucci, M.; Sangiorgi, L.; Franceschi, C.; Bazzocchi, A. Aging and Imaging Assessment of Body Composition: From Fat to Facts. Front. Endocrinol. 2019, 10, 861. [Google Scholar] [CrossRef] [PubMed] [Green Version]
- Chang, C.-S.; Liu, I.T.; Liang, F.-W.; Li, C.-C.; Sun, Z.-J.; Chang, Y.-F.; Chao, T.-H.; Wu, C.-H. Effects of age and gender on body composition indices as predictors of mortality in middle-aged and old people. Sci. Rep. 2022, 12, 7912. [Google Scholar] [CrossRef] [PubMed]
- Karastergiou, K.; Smith, S.R.; Greenberg, A.S.; Fried, S.K. Sex differences in human adipose tissues—The biology of pear shape. Biol. Sex Differ. 2012, 3, 13. [Google Scholar] [CrossRef] [PubMed] [Green Version]
- Janssen, I.; Heymsfield, S.B.; Wang, Z.; Ross, R. Skeletal muscle mass and distribution in 468 men and women aged 18–88 yr. J. Appl. Physiol. 2000, 89, 81–88. [Google Scholar] [CrossRef] [Green Version]
- Musolino, E.A.; O’Connor, B.P.; Cioe, J.D. Bigger isn’t always better: An exploration of social perception bias against high levels of muscularity in women. J. Soc. Psychol. 2022, 162, 523–539. [Google Scholar] [CrossRef]
- Henderson, G.C.; Dhatariya, K.; Ford, G.C.; Klaus, K.A.; Basu, R.; Rizza, R.A.; Jensen, M.D.; Khosla, S.; O’Brien, P.; Nair, K.S. Higher muscle protein synthesis in women than men across the lifespan, and failure of androgen administration to amend age-related decrements. FASEB J. 2009, 23, 631–641. [Google Scholar] [CrossRef] [Green Version]
- Roth, S.M.; Ivey, F.M.; Martel, G.F.; Lemmer, J.T.; Hurlbut, D.E.; Siegel, E.L.; Metter, E.J.; Fleg, J.L.; Fozard, J.L.; Kostek, M.C.; et al. Muscle size responses to strength training in young and older men and women. J. Am. Geriatr. Soc. 2001, 49, 1428–1433. [Google Scholar] [CrossRef] [PubMed]
- Hurst, C.; Robinson, S.M.; Witham, M.D.; Dodds, R.M.; Granic, A.; Buckland, C.; De Biase, S.; Finnegan, S.; Rochester, L.; Skelton, D.A.; et al. Resistance exercise as a treatment for sarcopenia: Prescription and delivery. Age Ageing 2022, 51, afac003. [Google Scholar] [CrossRef]
- Thomas, D.K.; Quinn, M.A.; Saunders, D.H.; Greig, C.A. Protein Supplementation Does Not Significantly Augment the Effects of Resistance Exercise Training in Older Adults: A Systematic Review. J. Am. Med. Dir. Assoc. 2016, 17, 959.e1–959.e9. [Google Scholar] [CrossRef] [Green Version]
- Valenzuela, P.L.; Santos-Lozano, A.; Barrán, A.T.; Fernández-Navarro, P.; Castillo-García, A.; Ruilope, L.M.; Ríos Insua, D.; Ordovas, J.M.; Ley, V.; Lucia, A. Joint association of physical activity and body mass index with cardiovascular risk: A nationwide population-based cross-sectional study. Eur. J. Prev. Cardiol. 2021, 29, e50–e52. [Google Scholar] [CrossRef] [PubMed]
- Tomiyama, A.J.; Carr, D.; Granberg, E.M.; Major, B.; Robinson, E.; Sutin, A.R.; Brewis, A. How and why weight stigma drives the obesity ‘epidemic’ and harms health. BMC Med. 2018, 16, 123. [Google Scholar] [CrossRef] [PubMed]
- Penney, T.L.; Kirk, S.F. The Health at Every Size paradigm and obesity: Missing empirical evidence may help push the reframing obesity debate forward. Am. J. Public Health 2015, 105, e38–e42. [Google Scholar] [CrossRef] [PubMed]
- Lee, A.; Cardel, M.; Donahoo, W.T. Social and Environmental Factors Influencing Obesity. In Endotext; Feingold, K.R., Anawalt, B., Blackman, M.R., Boyce, A., Chrousos, G., Corpas, E., de Herder, W.W., Dhatariya, K., Dungan, K., Hofland, J., et al., Eds.; MDText.com, Inc.: South Dartmouth, MA, USA, 2000. [Google Scholar]
- Medvedyuk, S.; Ali, A.; Raphael, D. Ideology, obesity and the social determinants of health: A critical analysis of the obesity and health relationship. Crit. Public Health 2018, 28, 573–585. [Google Scholar] [CrossRef]
- Sainsbury, A.; Hay, P. Call for an urgent rethink of the ‘health at every size’ concept. J. Eat. Disord. 2014, 2, 8. [Google Scholar] [CrossRef] [PubMed] [Green Version]
- CDC. Adult Obesity Facts. Available online: https://www.cdc.gov/obesity/data/adult.html (accessed on 27 February 2023).
- Lakerveld, J.; Mackenbach, J. The Upstream Determinants of Adult Obesity. Obes. Facts 2017, 10, 216–222. [Google Scholar] [CrossRef]
- Chumpunuch, P.; Jaraeprapal, U. The social determinants of health influencing obesity for the aged in the Pakpoon community context: A qualitative study. Int. J. Nurs. Sci. 2022, 9, 211–221. [Google Scholar] [CrossRef]
- Kansas State University. Physical Activity and Controlling Weight. Available online: https://www.k-state.edu/paccats/Contents/PA/PDF/Physical%20Activity%20and%20Controlling%20Weight.pdf (accessed on 26 February 2023).
- Harvard Health Publishing. Calorie Counting Made Easy. Available online: https://www.health.harvard.edu/staying-healthy/calorie-counting-made-easy#:~:text=To%20do%20so%2C%20you%20need,if%20you%20are%20moderately%20active (accessed on 26 February 2023).
- Engber, D. Unexpected clues emerge about why diets fail. Nat. Med. 2019, 25, 1637–1639. [Google Scholar] [CrossRef]
- Hall, K.D.; Kahan, S. Maintenance of Lost Weight and Long-Term Management of Obesity. Med. Clin. N. Am. 2018, 102, 183–197. [Google Scholar] [CrossRef]
- Harvey, J.; Krukowski, R.; Priest, J.; West, D. Log Often, Lose More: Electronic Dietary Self-Monitoring for Weight Loss. Obesity 2019, 27, 380–384. [Google Scholar] [CrossRef] [Green Version]
- Huang, X.; Li, M.; Shi, Y.; Yao, H.; Lei, Z.; Kou, W.; Li, B.; Shi, J.; Zhang, W.; Jian, W. Self-managed weight loss by smart body fat scales ameliorates obesity-related body composition during the COVID-19 pandemic: A follow-up study in Chinese population. Front. Endocrinol. 2022, 13, 996814. [Google Scholar] [CrossRef] [PubMed]
- Patel, M.L.; Wakayama, L.N.; Bennett, G.G. Self-Monitoring via Digital Health in Weight Loss Interventions: A Systematic Review among Adults with Overweight or Obesity. Obesity 2021, 29, 478–499. [Google Scholar] [CrossRef] [PubMed]
- Welton, S.; Minty, R.; O’Driscoll, T.; Willms, H.; Poirier, D.; Madden, S.; Kelly, L. Intermittent fasting and weight loss: Systematic review. Can. Fam. Physician 2020, 66, 117–125. [Google Scholar] [PubMed]
- Al Saif, A.; Alsenany, S. Aerobic and anaerobic exercise training in obese adults. J. Phys. Ther. Sci. 2015, 27, 1697–1700. [Google Scholar] [CrossRef] [Green Version]
- Alizadeh Pahlavani, H. Exercise Therapy for People with Sarcopenic Obesity: Myokines and Adipokines as Effective Actors. Front. Endocrinol. 2022, 13, 811751. [Google Scholar] [CrossRef]
- Kleist, B.; Wahrburg, U.; Stehle, P.; Schomaker, R.; Greiwing, A.; Stoffel-Wagner, B.; Egert, S. Moderate Walking Enhances the Effects of an Energy-Restricted Diet on Fat Mass Loss and Serum Insulin in Overweight and Obese Adults in a 12-Week Randomized Controlled Trial. J. Nutr. 2017, 147, 1875–1884. [Google Scholar] [CrossRef] [Green Version]
- Hill, J.O.; Wyatt, H.R.; Peters, J.C. The Importance of Energy Balance. Eur. Endocrinol. 2013, 9, 111–115. [Google Scholar] [CrossRef]
- Chaston, T.B.; Dixon, J.B.; O’Brien, P.E. Changes in fat-free mass during significant weight loss: A systematic review. Int. J. Obes. 2007, 31, 743–750. [Google Scholar] [CrossRef] [Green Version]
- Ball, M.F.; Canary, J.J.; Kyle, L.H. Comparative effects of caloric restriction and total starvation on body composition in obesity. Ann. Intern. Med. 1967, 67, 60–67. [Google Scholar] [CrossRef]
- Poehlman, E.T. A review: Exercise and its influence on resting energy metabolism in man. Med. Sci. Sport. Exerc. 1989, 21, 515–525. [Google Scholar] [CrossRef]
- Barakat, S.; Maguire, S.; Surgenor, L.; Donnelly, B.; Miceska, B.; Fromholtz, K.; Russell, J.; Hay, P.; Touyz, S. The Role of Regular Eating and Self-Monitoring in the Treatment of Bulimia Nervosa: A Pilot Study of an Online Guided Self-Help CBT Program. Behav. Sci. 2017, 7, 39. [Google Scholar] [CrossRef] [Green Version]
- Luca, A.; Luca, M.; Calandra, C. Eating Disorders in Late-life. Aging Dis. 2015, 6, 48–55. [Google Scholar] [CrossRef]
- Stuckler, D.; McKee, M.; Ebrahim, S.; Basu, S. Manufacturing epidemics: The role of global producers in increased consumption of unhealthy commodities including processed foods, alcohol, and tobacco. PLoS Med. 2012, 9, e1001235. [Google Scholar] [CrossRef] [PubMed] [Green Version]
- Martínez Steele, E.; Baraldi, L.G.; Louzada, M.L.; Moubarac, J.C.; Mozaffarian, D.; Monteiro, C.A. Ultra-processed foods and added sugars in the US diet: Evidence from a nationally representative cross-sectional study. BMJ Open. 2016, 6, e009892. [Google Scholar] [CrossRef] [PubMed] [Green Version]
- Hall, K.D.; Ayuketah, A.; Brychta, R.; Cai, H.; Cassimatis, T.; Chen, K.Y.; Chung, S.T.; Costa, E.; Courville, A.; Darcey, V.; et al. Ultra-Processed Diets Cause Excess Calorie Intake and Weight Gain: An Inpatient Randomized Controlled Trial of Ad Libitum Food Intake. Cell. Metab. 2019, 30, 67–77. [Google Scholar] [CrossRef] [PubMed] [Green Version]
- Alonso-Pedrero, L.; Ojeda-Rodríguez, A.; Martínez-González, M.A.; Zalba, G.; Bes-Rastrollo, M.; Marti, A. Ultra-processed food consumption and the risk of short telomeres in an elderly population of the Seguimiento Universidad de Navarra (SUN) Project. Am. J. Clin. Nutr. 2020, 111, 1259–1266. [Google Scholar] [CrossRef]
- Ojeda-Rodriguez, A.; Morell-Azanza, L.; Alonso-Pedrero, L.; del Moral, A.M. Chapter 12—Aging, Telomere Integrity, and Antioxidant Food. In Obesity; del Moral, A.M., Aguilera García, C.M., Eds.; Academic Press: Cambridge, MA, USA, 2018; pp. 241–261. [Google Scholar] [CrossRef]
- Ohnishi, M.; Razzaque, M.S. Dietary and genetic evidence for phosphate toxicity accelerating mammalian aging. FASEB J. 2010, 24, 3562–3571. [Google Scholar] [CrossRef] [Green Version]
- Chen, Y.-Y.; Kao, T.-W.; Chou, C.-W.; Wu, C.-J.; Yang, H.-F.; Lai, C.-H.; Wu, L.-W.; Chen, W.-L. Exploring the Link between Serum Phosphate Levels and Low Muscle Strength, Dynapenia, and Sarcopenia. Sci. Rep. 2018, 8, 3573. [Google Scholar] [CrossRef] [PubMed] [Green Version]
- Bellanti, F.; Lo Buglio, A.; Vendemiale, G. Mitochondrial Impairment in Sarcopenia. Biology 2021, 10, 31. [Google Scholar] [CrossRef]
- Malyala, S.; Zhang, Y.; Strubbe, J.O.; Bazil, J.N. Calcium phosphate precipitation inhibits mitochondrial energy metabolism. PLoS Comput. Biol. 2019, 15, e1006719. [Google Scholar] [CrossRef] [Green Version]
- Younes, M.; Aquilina, G.; Castle, L.; Engel, K.H.; Fowler, P.; Frutos Fernandez, M.J.; Fürst, P.; Gürtler, R.; Husøy, T.; Mennes, W.; et al. Re-evaluation of phosphoric acid-phosphates- di-, tri- and polyphosphates (E 338-341, E 343, E 450-452) as food additives and the safety of proposed extension of use. EFSA J. 2019, 17, e05674. [Google Scholar] [CrossRef] [PubMed] [Green Version]
- CDC. How Much Physical Activity Do Older Adults Need? Available online: https://www.cdc.gov/physicalactivity/basics/older_adults/index.htm#:~:text=Adults%20aged%2065%20and%20older,of%20activities%20that%20strengthen%20muscles (accessed on 28 March 2023).
- USDA. Older Adults. Available online: https://www.myplate.gov/life-stages/older-adults#:~:text=Choose%20foods%20with%20little%20to,of%20your%20sense%20of%20thirst (accessed on 28 March 2023).
Figure 1.
Charmion, strongwoman circa late 19th century. Photos accessed 5 April 2023 from https://commons.wikimedia.org/wiki/File:Charmion-strongwoman.png; https://en.wikipedia.org/wiki/Charmion.
Figure 1.
Charmion, strongwoman circa late 19th century. Photos accessed 5 April 2023 from https://commons.wikimedia.org/wiki/File:Charmion-strongwoman.png; https://en.wikipedia.org/wiki/Charmion.

Figure 2.
Body weight change with ultra–processed and unprocessed diets. Graphical abstract from Hall et al., 2019 [51].
Figure 2.
Body weight change with ultra–processed and unprocessed diets. Graphical abstract from Hall et al., 2019 [51].

Figure 3.
Weight gain plus sarcopenia and aging from ultra-processed food leads to aging-related sarcopenic obesity.
Figure 3.
Weight gain plus sarcopenia and aging from ultra-processed food leads to aging-related sarcopenic obesity.


Table 1.
Nutritional and Physical Activity Recommendations for Adults Aged 65 and Over.
|
|
|
|
Disclaimer/Publisher’s Note: The statements, opinions and data contained in all publications are solely those of the individual author(s) and contributor(s) and not of MDPI and/or the editor(s). MDPI and/or the editor(s) disclaim responsibility for any injury to people or property resulting from any ideas, methods, instructions or products referred to in the content. |
© 2023 by the author. Licensee MDPI, Basel, Switzerland. This article is an open access article distributed under the terms and conditions of the Creative Commons Attribution (CC BY) license (https://creativecommons.org/licenses/by/4.0/).
Share and Cite
MDPI and ACS Style
Brown, R.B. Body Image, Body Composition, and Aging in Women: Insights into an Older Adult Problem. Women 2023, 3, 214-224. https://doi.org/10.3390/women3020017
AMA Style
Brown RB. Body Image, Body Composition, and Aging in Women: Insights into an Older Adult Problem. Women. 2023; 3(2):214-224. https://doi.org/10.3390/women3020017
Chicago/Turabian StyleBrown, Ronald B. 2023. "Body Image, Body Composition, and Aging in Women: Insights into an Older Adult Problem" Women 3, no. 2: 214-224. https://doi.org/10.3390/women3020017