Article

Child Marriage and Later-Life Risk of Obesity in Women: A Cohort Analysis Using Nationally Representative Repeated Cross-Sectional Data from Tajikistan

1
Institute of Public and Preventive Health, Augusta University, Augusta, GA 30912, USA
2
Department of Population Health Sciences, Medical College of Georgia, Augusta University, Augusta, GA 30912, USA
3
Medical College of Georgia, Augusta University, Augusta, GA 30912, USA
*
Author to whom correspondence should be addressed.
Women 2023, 3(1), 53-70; https://doi.org/10.3390/women3010004
Submission received: 30 November 2022 / Revised: 6 January 2023 / Accepted: 9 January 2023 / Published: 11 January 2023

Abstract

:
Child marriage, defined as union before age 18 years, has detrimental health and socioeconomic consequences. This study examines whether women married as children have a disproportionately higher risk of being obese at adulthood compared to their peers married as adults. Using data from the 2012 and 2017 waves of the Tajikistan Demographic and Health Survey, we matched women aged 25 to 49 years by birth year and month to create four birth cohorts. We fitted multivariable logistic regressions to assess the differential odds of being obese and estimated simultaneous quantile regression models to examine the differences in average body mass index (BMI) between women married as adults and as children within birth cohorts. We found that the adjusted odds of being obese for women married as children were 1.5 (CI: 1.3–1.7) times those of those who were married as adults, after controlling for sociodemographic correlates along with birth cohort and survey wave fixed effects. Results of the quantile regression analyses suggest higher expected BMI levels among women married as children compared to those of women married as adults across different quantiles of BMI. The differences though were more pronounced in the younger cohorts than in the older cohorts.

1. Introduction

Obesity is a global health problem recognized as a leading cause of substantial short- and long-term morbidity. The obesity epidemic is of increasing concern in low-and-middle income countries (LMICs), where rates are escalating and disproportionately affecting women of reproductive age [1] who, as a result, may experience related pregnancy complications including but not limited to miscarriages, cardiovascular risks, and maternal death [2]. Obesity is also associated with higher risks of hypertension, diabetes, and multiple types of cancer in women [3]. Identifying and evaluating the risk factors of obesity in women in the LMICs, therefore, are critical public health priorities.
Of note, several studies, mostly conducted in the developed country settings, have found an association between both obesity among women and risk factors for obesity with lower life course socioeconomic status [4]. This lower economic standing may be reflective of disparities across social vulnerabilities in these regions such as in living conditions and educational attainment levels [5]. The prevalence of obesity among women in the LMICs, on the other hand, is associated with increasing wealth [6]. However, these findings are mixed. For example, in Tajikistan, one of the several LMICs where obesity has increased steadily, the gap in obesity prevalence between rich and poor women is relatively low [7]. A stronger understanding of novel predictors of obesity is critical to target populations for preventative initiatives in countries where risk may not be driven by typical socioeconomic inequalities.
One important consideration may occur in childhood, where body weight trajectories are shaped by complex social ecological environmental interactions. For example, evidence suggests that childhood adversity may increase the risk of central obesity [8]. Child marriage, defined as marriage before 18 years of age among girls, may be one such adverse experience in the LMICs, such as Tajikistan. Child marriage is gaining international attention as a human rights violation [9]. Child marriage is associated with poor reproductive outcomes among women, increased risk of violence exposure, mental health problems, infections, and risky sexual and behavioral practices [10]. Evidence suggests that these deleterious outcomes may be linked to constraints related to marriage before adulthood (age 18 years), such as with scholastic achievement, health services utilization, household power, autonomy, and decision-making [11,12,13]. Women married as children, therefore, are often marginalized when it comes to their health and wellbeing. The association between obesity in women and lower socioeconomic status including food insecurity [14,15,16], thus, sets the stage to explore any potential connection between child marriage and obesity in the LMICs, where adolescent women greatly suffer from poor diet quality [17].
Of note, child marriage in general is inversely associated with household wealth status [18]. However, in Tajikistan the prevalence of child marriage is not very different across household wealth distribution [19,20], making the experience a worthwhile consideration in the context of obesity risk. To date, there is limited evidence of the association between child marriage and chronic health outcomes among women in the LMICs. Several recent studies documented links between child marriage and chronic conditions such as hypertension and high blood glucose [21,22,23,24]. Very few studies, however, have evaluated child marriage as a potential body mass index (BMI) predictor in adulthood in LMICs where the child marriage is most prevalent. One study examined the relationship between child marriage and nutritional status of women in Sub-Saharan African countries and found that women married as children had a slightly reduced risk of being underweight [25]. Another study showed a higher risk of an individual-level double burden of anemia and obesity among women in India who were married as children [26]. As such, this paper seeks to explore the association between child marriage and obesity among women of reproductive age in Tajikistan. The conceptual framework of the relationship is presented as follows.

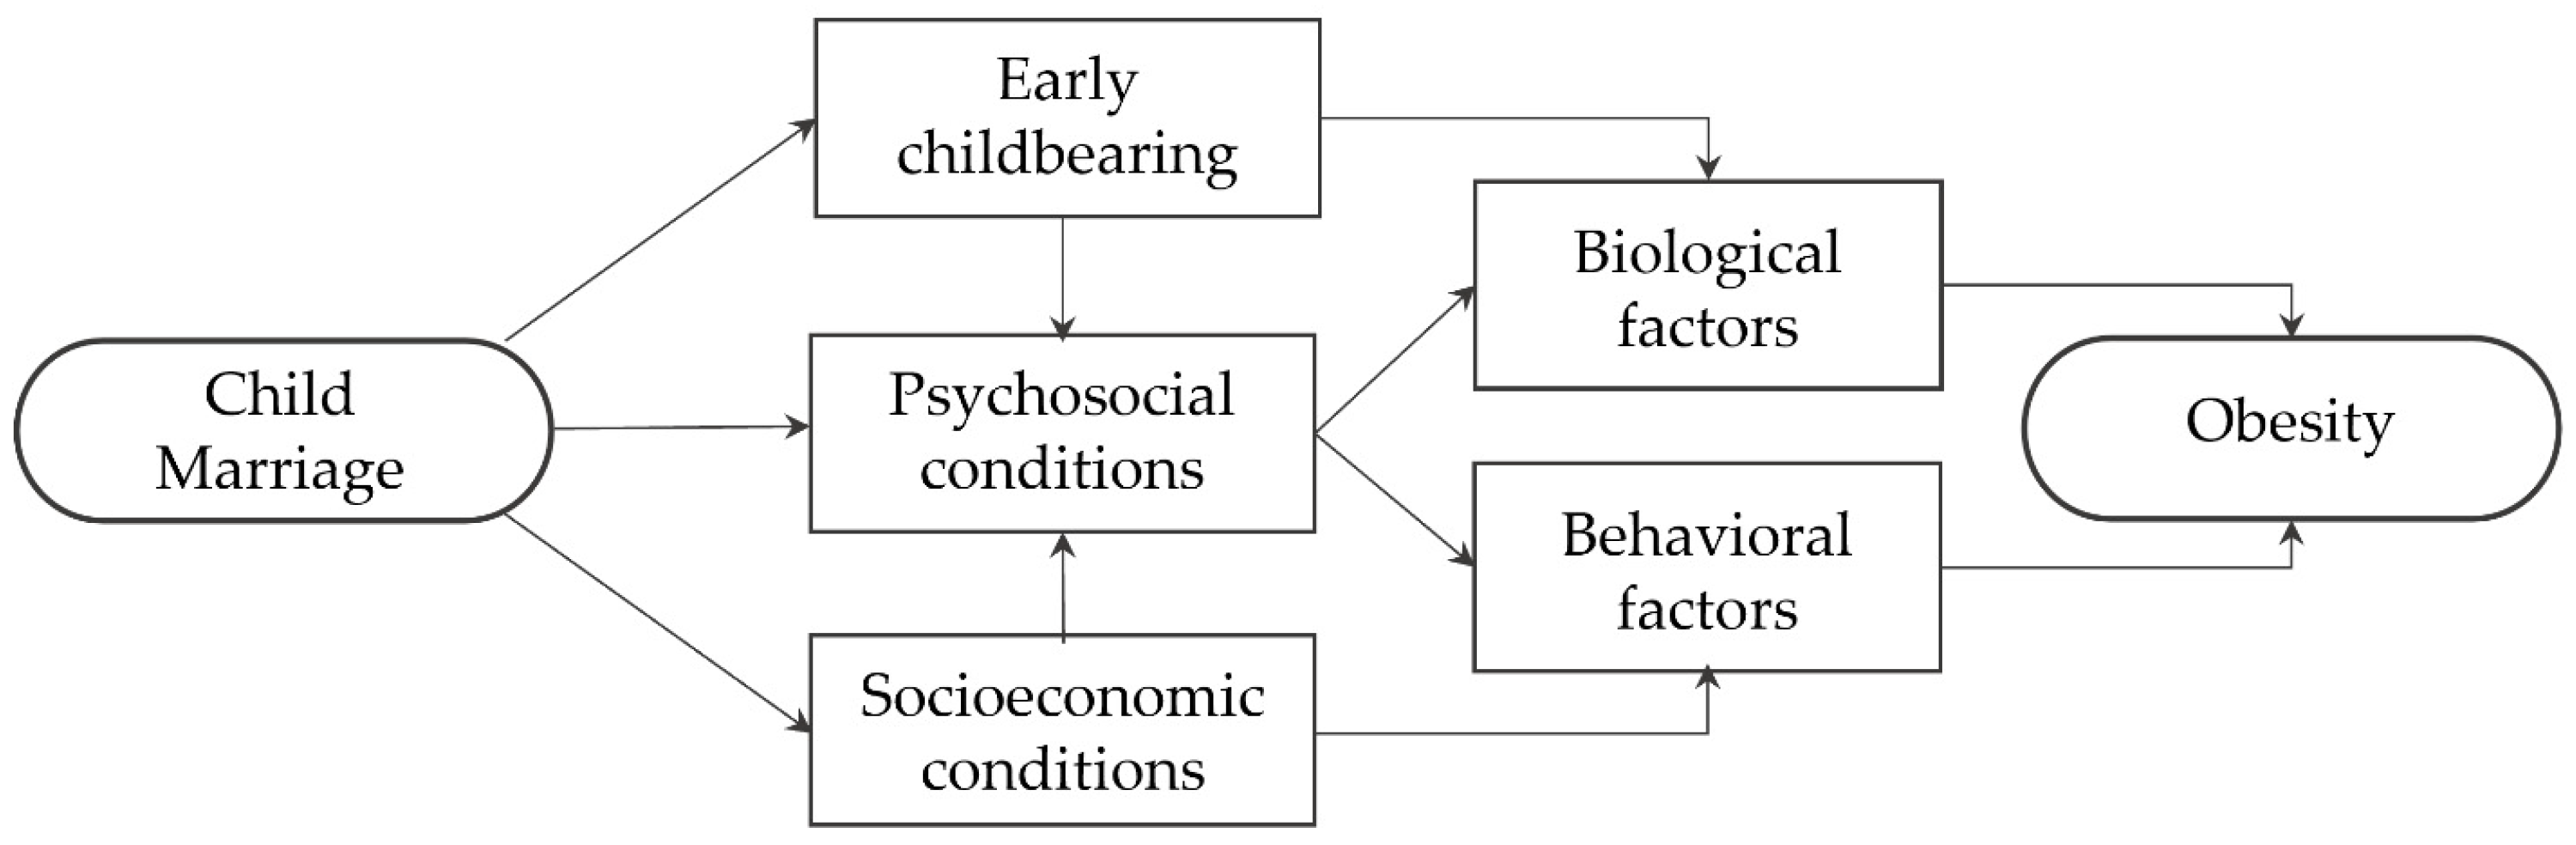
1.1. Conceptual Framework

The relationship between child marriage and obesity in women in later life could be attributable to several potential pathways entailing biological and behavioral factors (Figure 1). Child marriage is one of the leading causes of early childbearing [10]. Evidence suggests that a shorter interval from menarche to first birth may increase the risk of being overweight after pregnancy [27]. Women married as children are also more likely to have a higher lifetime fertility [18], which is another risk factor for obesity in women [28]. Child marriage and early childbearing are associated with adverse psychosocial conditions [29,30], which may impact the risk of obesity through health-risk behaviors [31,32]. Child marriage is also associated with lower educational attainment and limited economic opportunities [13], which have implications for diet, lifestyle, and health-seeking behaviors associated with women’s nutritional status [25]. A similar conceptual framework was used in Efevbera et al. (2019) [25] and Datta and Haider (2022) [26]. Thus, child marriage can have potential links to obesity outcomes in women in later life.

1.2. Aim

Using data on married women aged 25–49 years, matched by birth cohorts in nationally representative repeated cross-sectional surveys from Tajikistan, the aim of this study is to evaluate the following hypothesis: women married as children (before age 18 years) have higher odds of BMI levels indicative of obesity in adulthood (age ≥ 25 years) compared to women who were married as adults (between age 18–24 years).

2. Results

Around 18.3% of the women in our sample were married before age 18 years and 19.4% of the women were obese. Obesity prevalence among women married as children was 24.9%, which was 6.7 percentage points (pp) higher than that of their counterparts married as adults. While the prevalence of child marriage varied across birth cohorts, the prevalence of obesity gradually increased from the youngest birth cohort to the oldest birth cohort. Table 1 presents the descriptive statistics for the full sample and by sub-samples of birth cohorts.

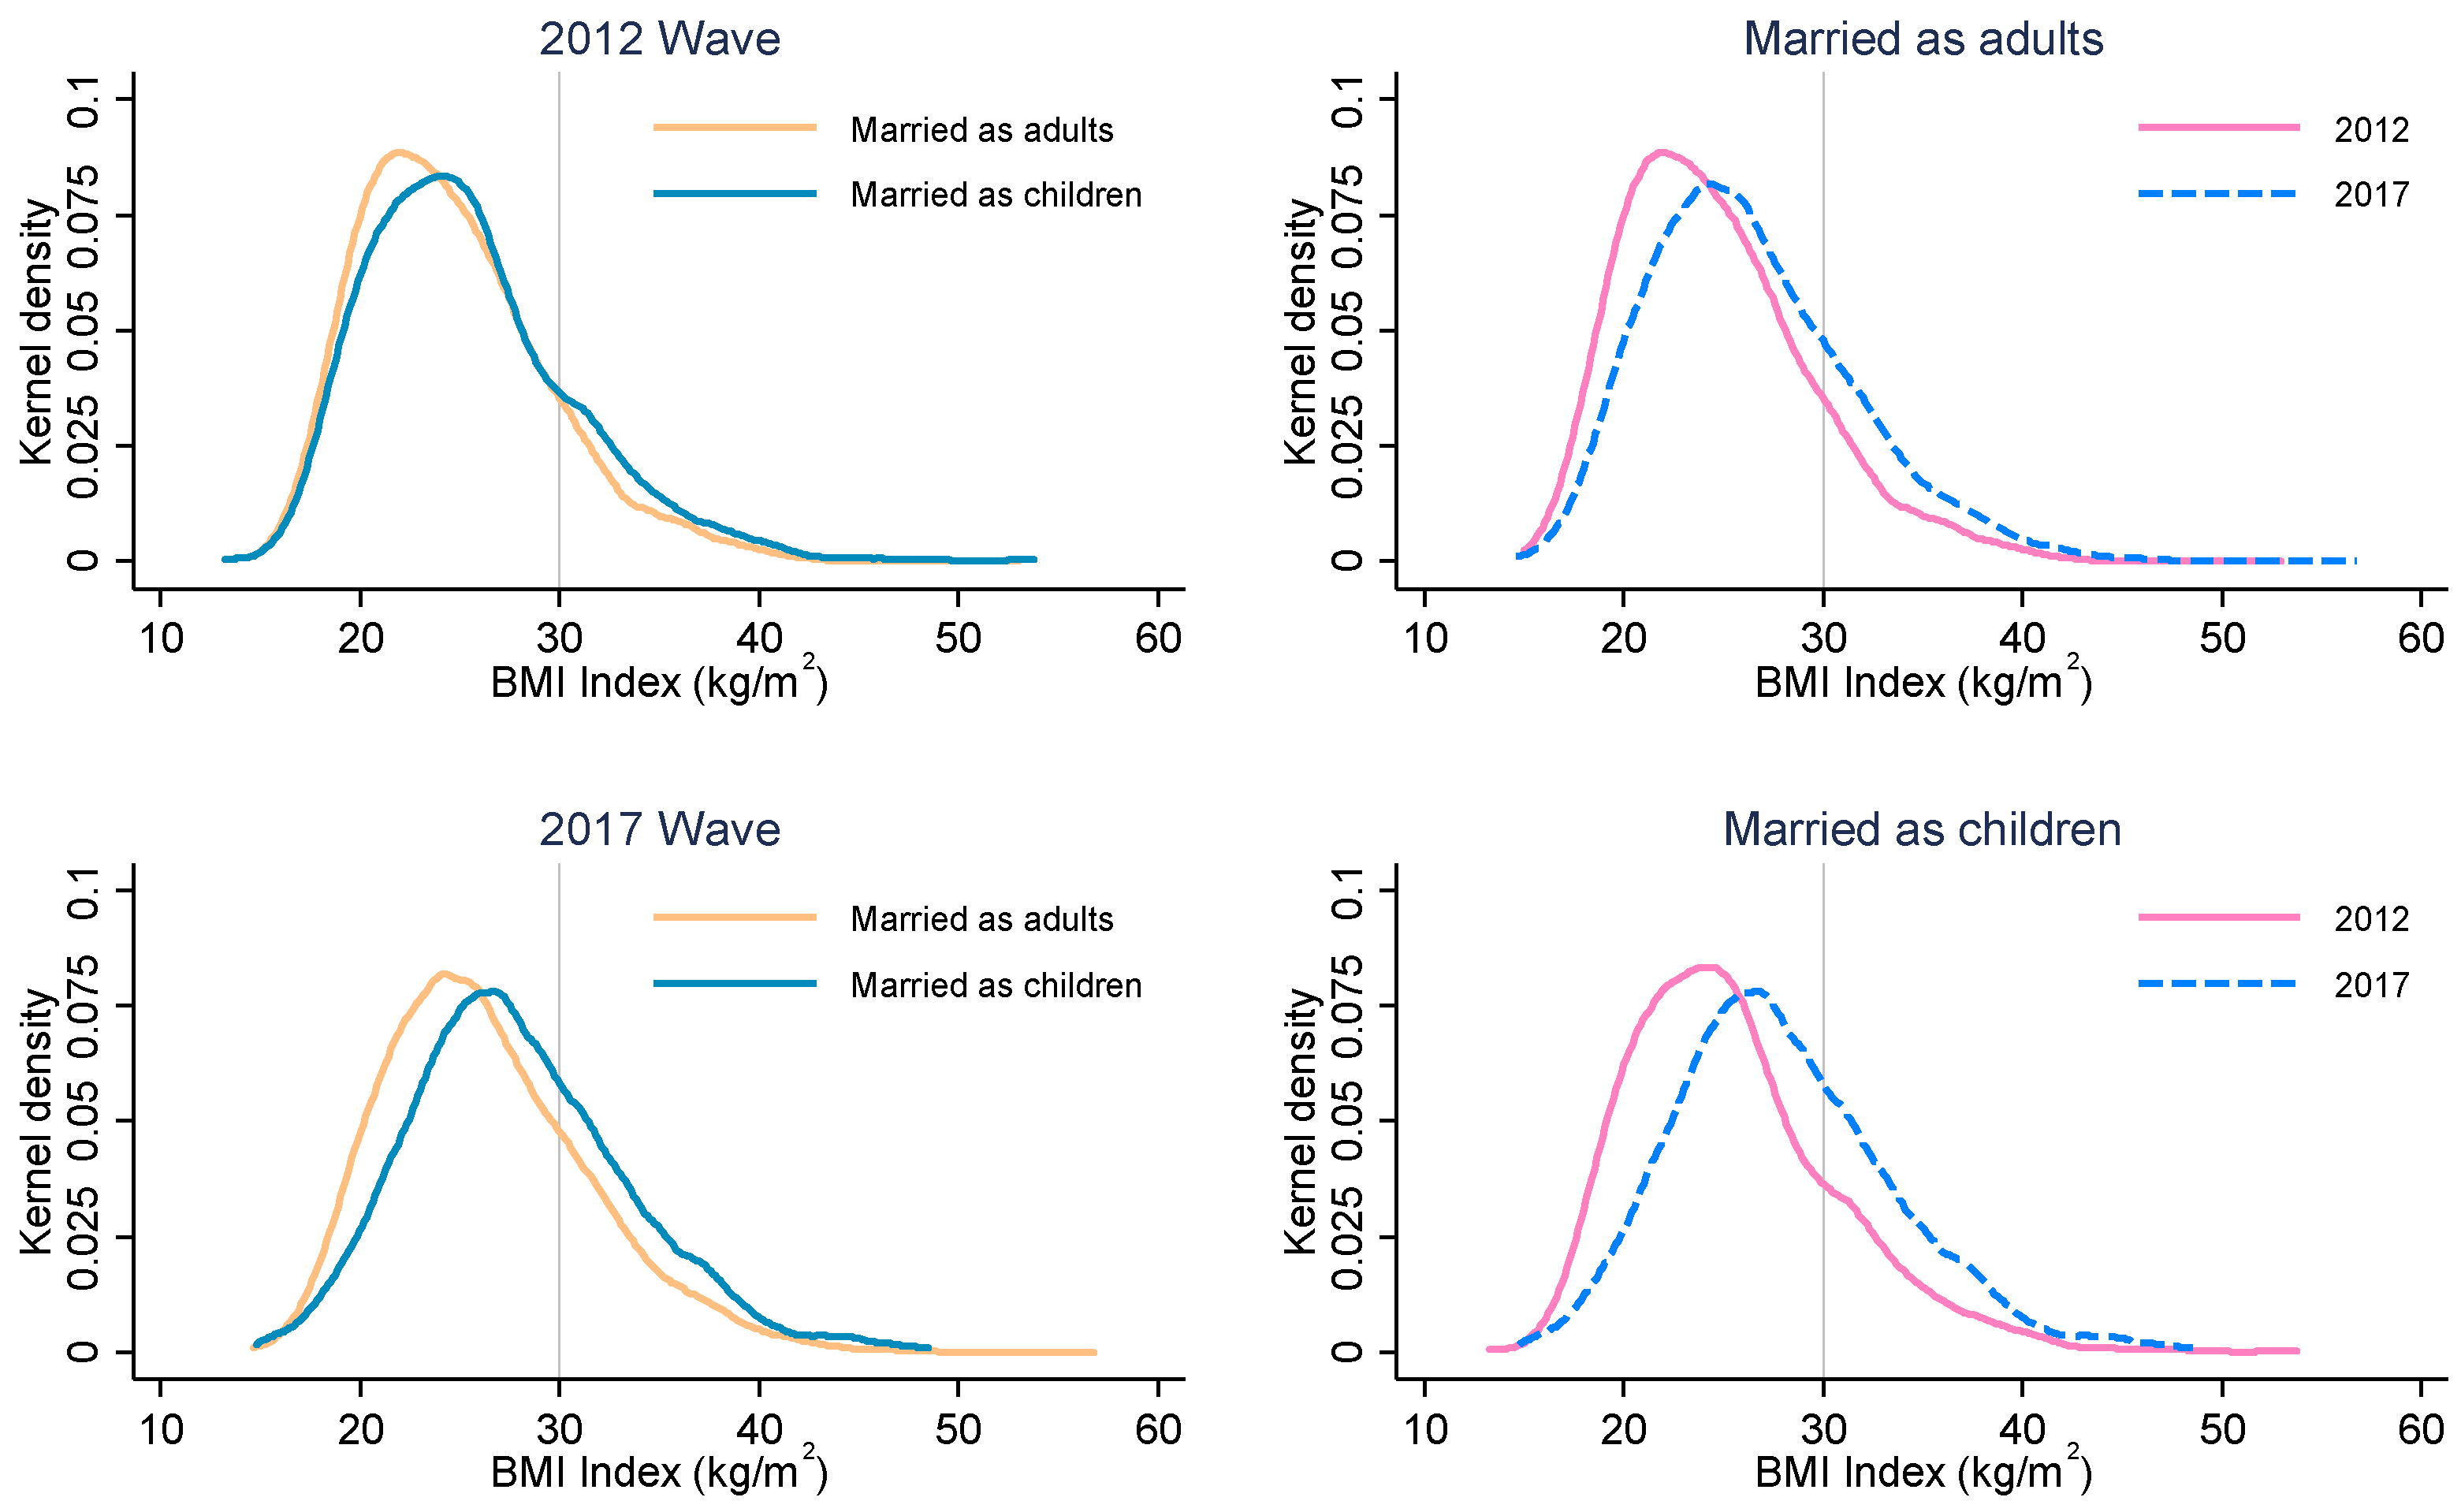
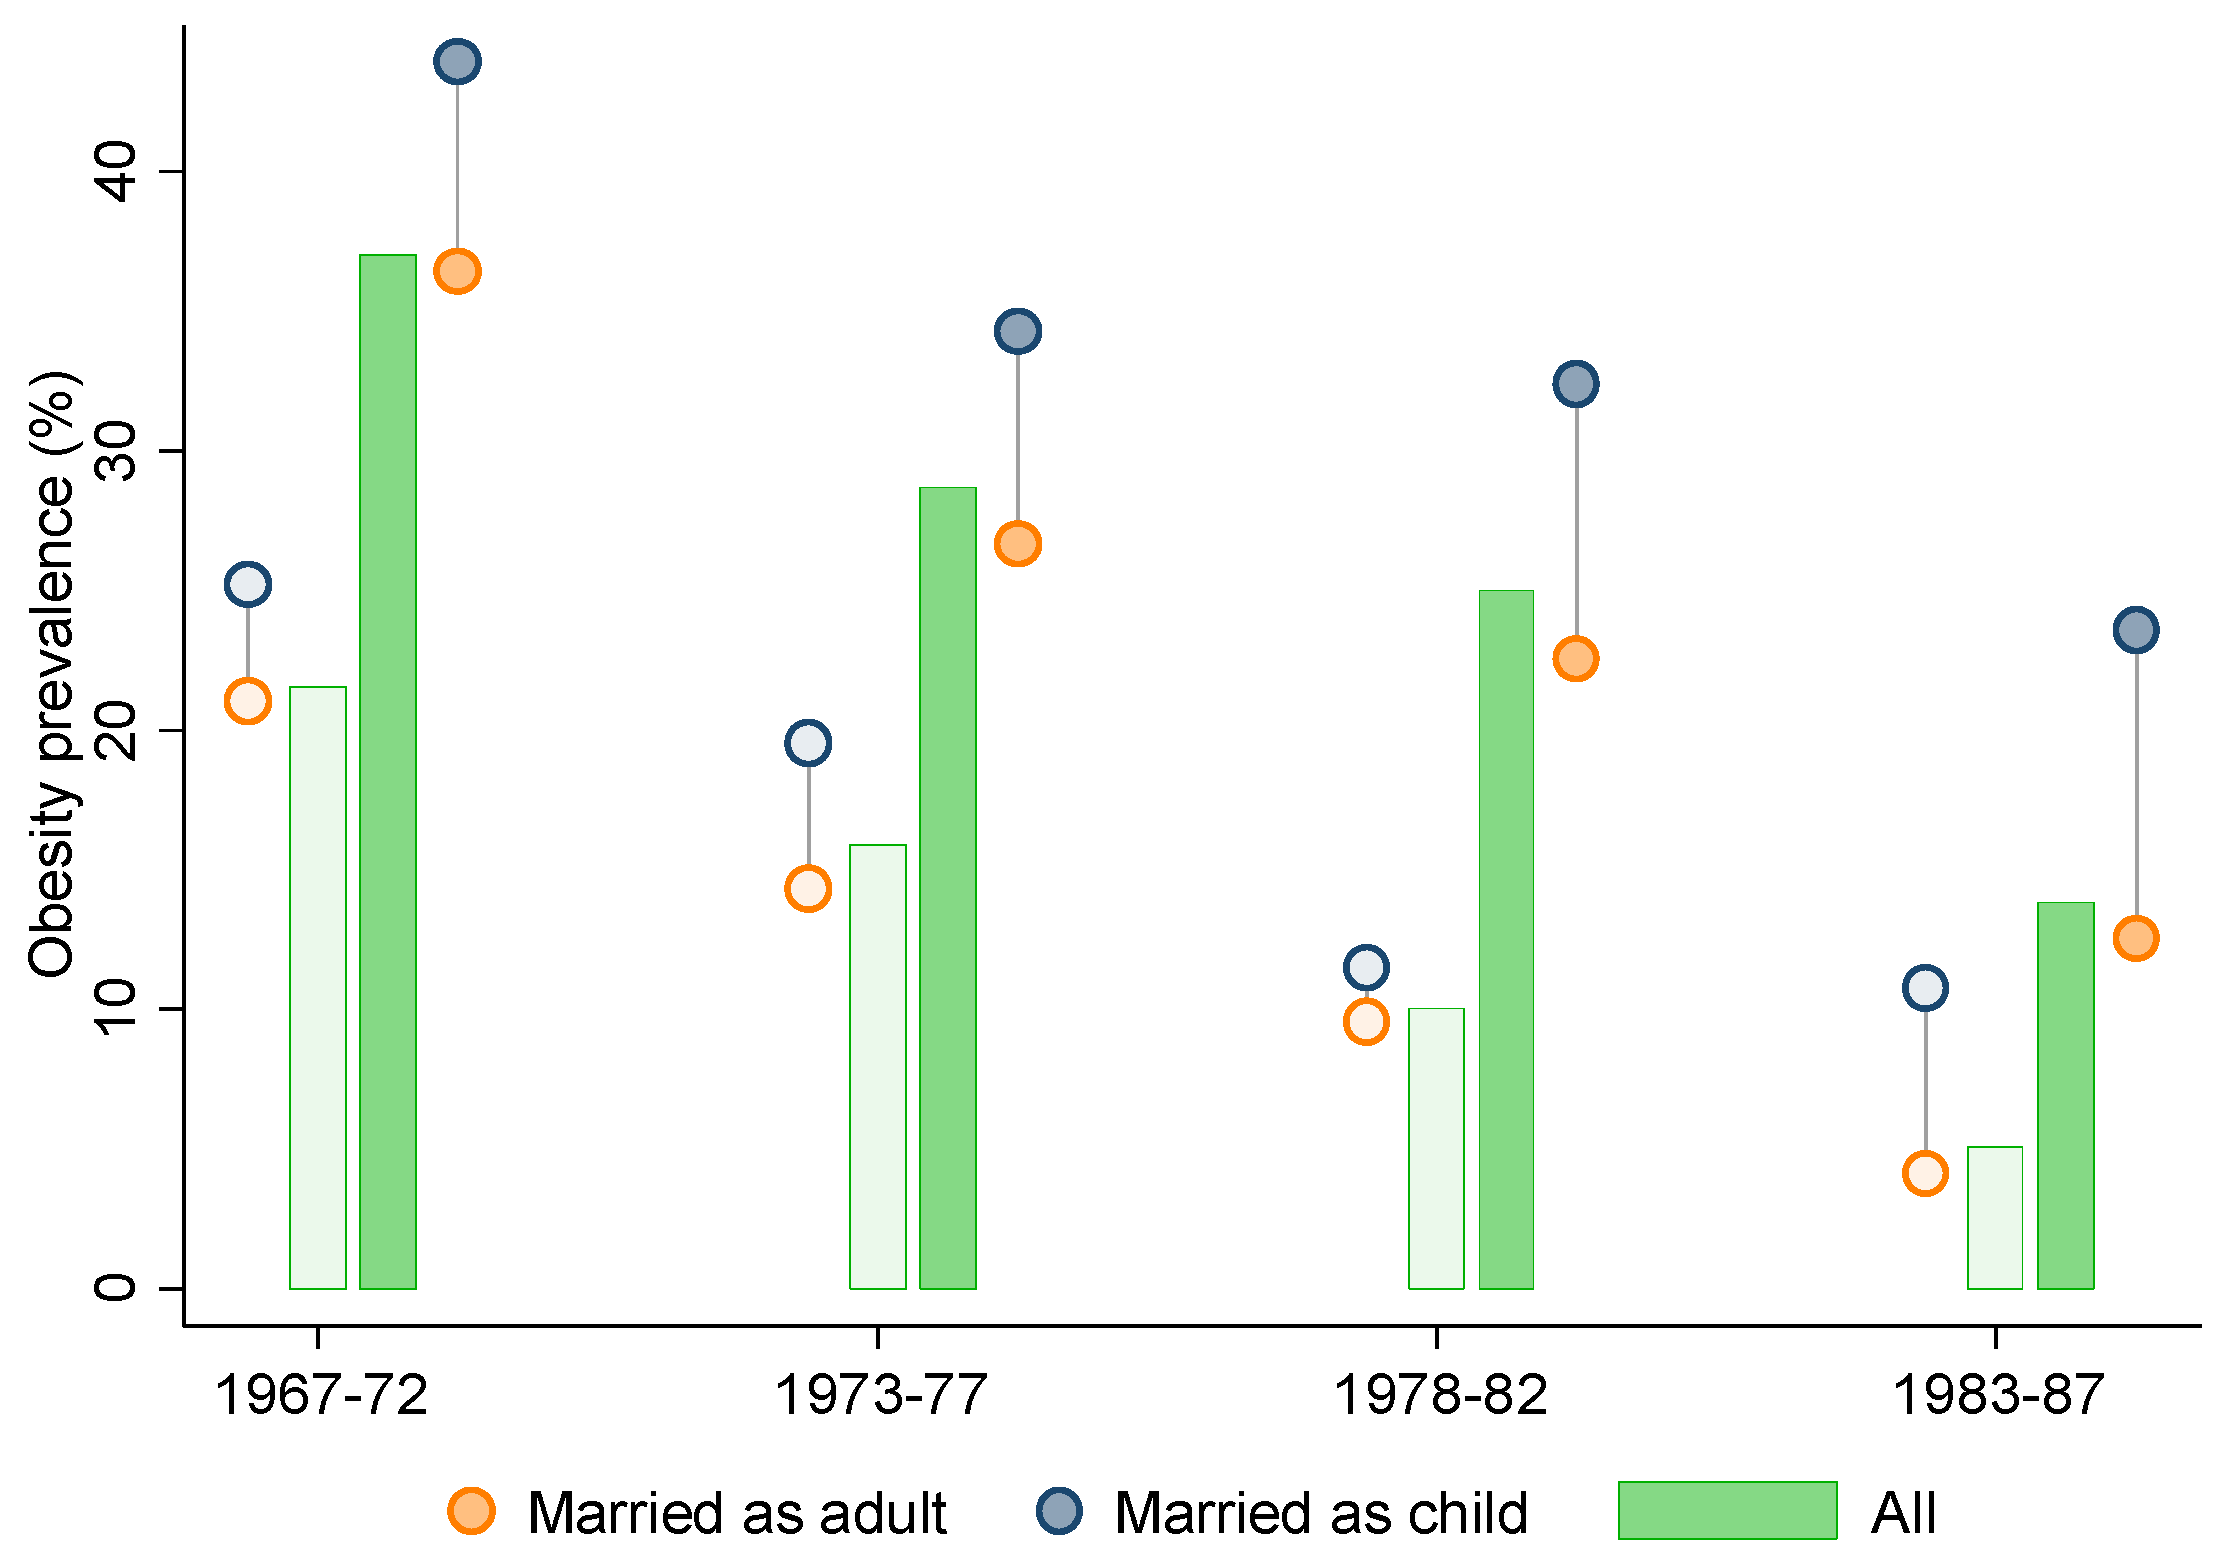
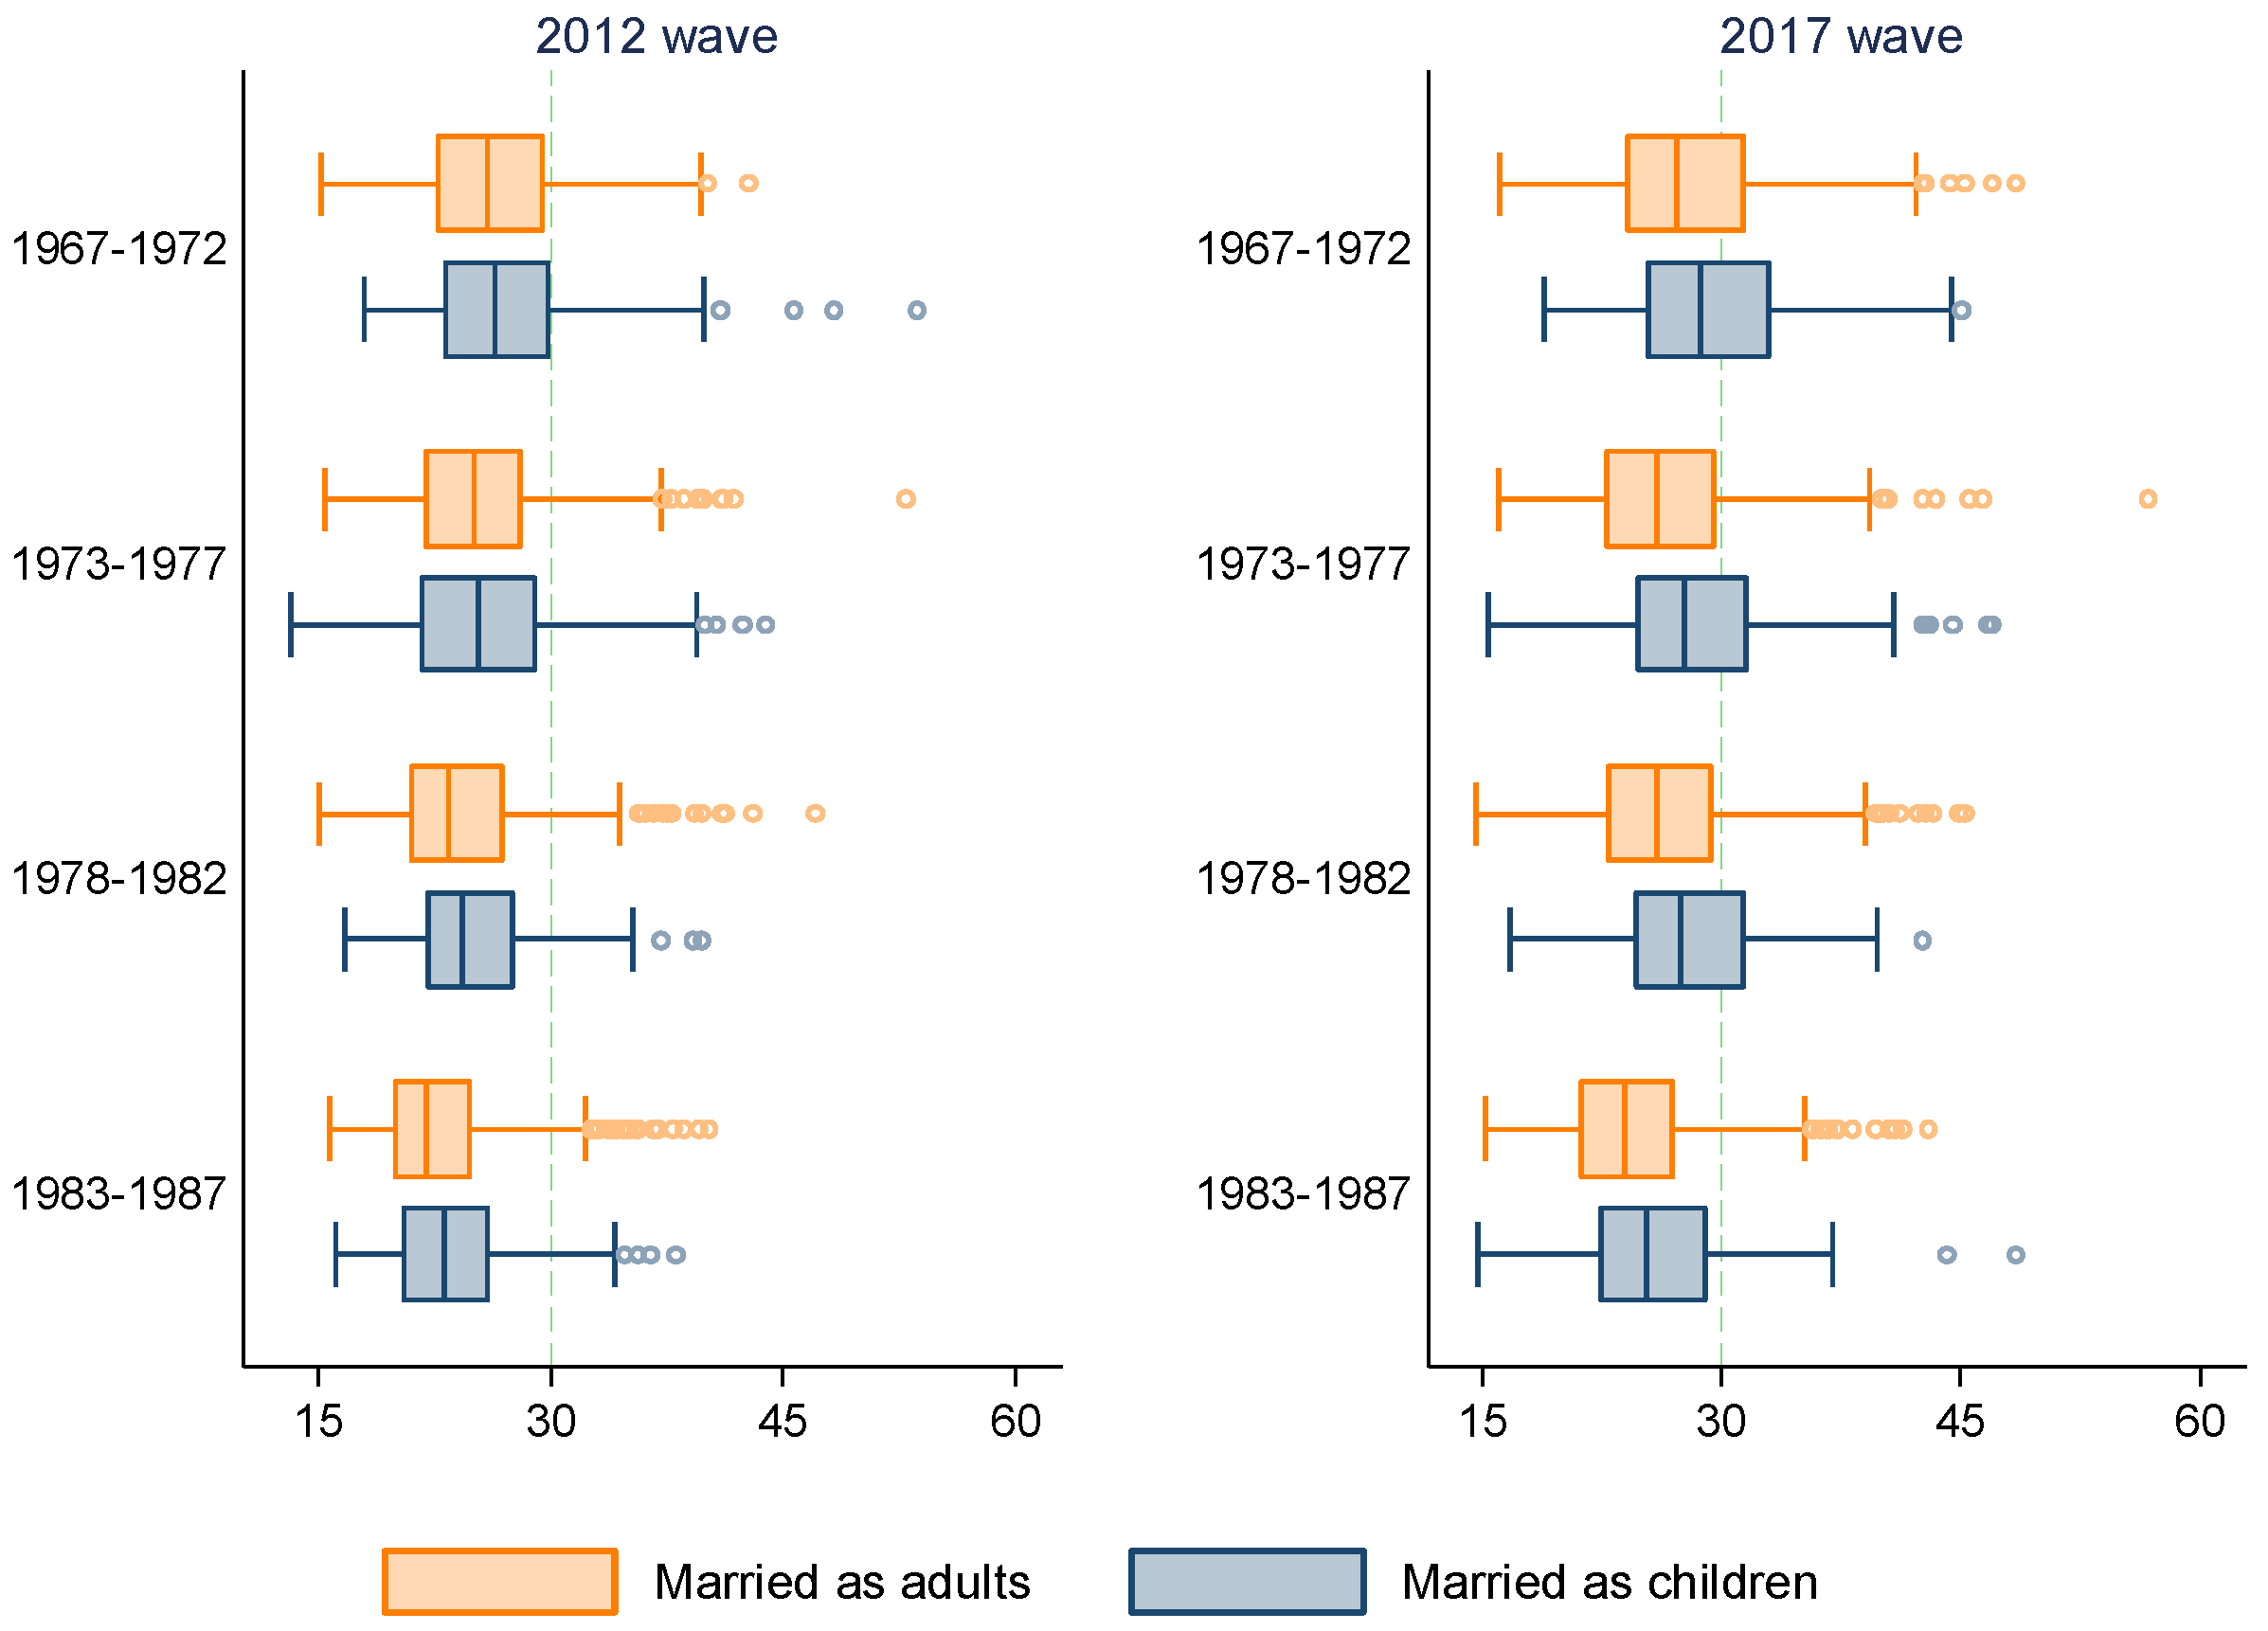
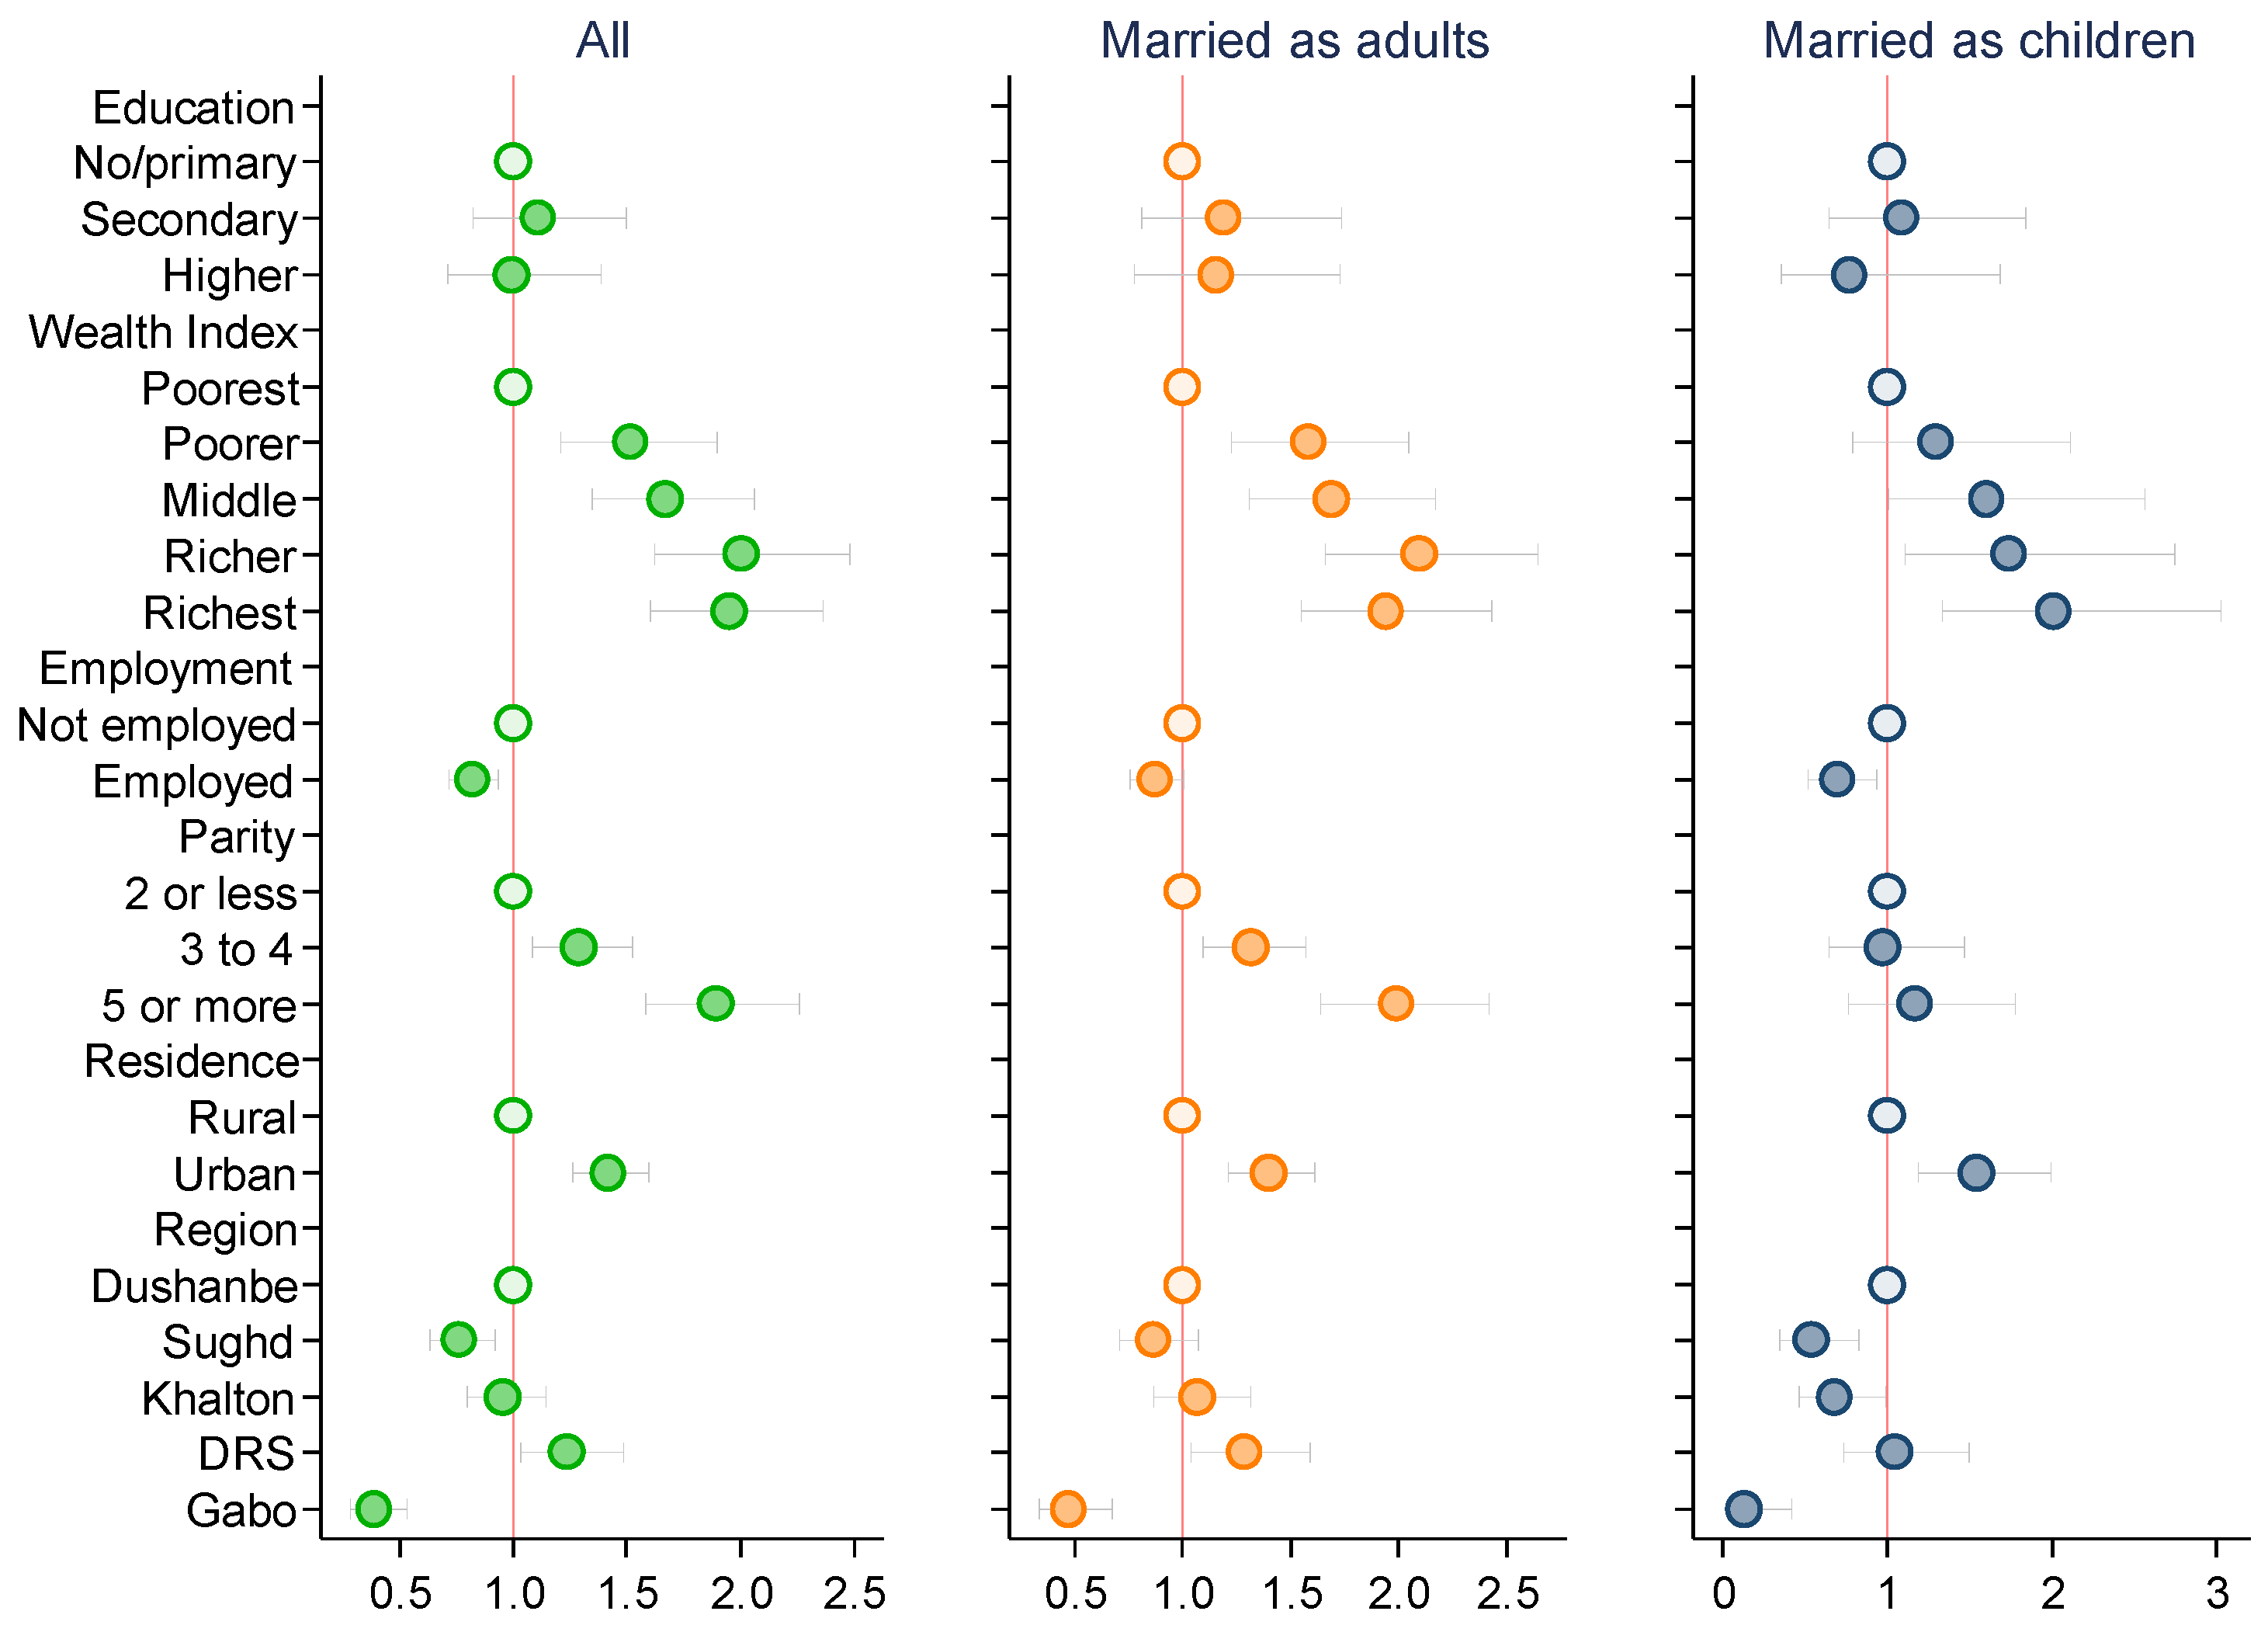
2.1. Descriptive Results

The distributions of BMI by child marriage and survey waves are presented in Figure 2. The mean BMI for women married as adults and as children was, respectively, 24.6 kg/m2 and 25.5 kg/m2 in 2012. The difference between the two groups widened in 2017 as the mean BMI became 26.3 kg/m2 and 28.0 kg/m2, respectively. The overall prevalence of obesity increased from 14.3% in 2012 to 24.3% in 2017. While the prevalence increased by 9.4 pp (from 13.4% to 22.7%) for women married as adults, it increased by 13.7 pp (from 18.3% to 32.0%) for women married as children during this period.
Figure 3 shows the obesity prevalence by survey waves and birth cohorts, and the differences in obesity prevalence by child marriage within the birth cohorts in respective survey waves. The differences between the two groups were more apparent in the younger birth cohorts during the 2017 survey wave. The differences, however, were not statistically significant for the older birth cohorts. The BMI distributions, in box plots, across birth cohorts by child marriage and survey waves are presented in Figure 4. In each birth cohort, particularly during the 2017 wave, the median levels of BMI for women married as children were higher than those of their counterparts married as adults.

2.2. Relationship between Obesity and Sociodemographic Correlates

The relationship between obesity and sociodemographic characteristics in the full-sample, and in sub-samples by marital age is depicted in Figure 5. Obesity was more prevalent among women in wealthier households and among women living in urban areas. On the contrary, prevalence of obesity was lower among women who were employed at the time of the survey. These associations were similar for women both married as adults and as children. High parity measured by giving five or more births was a significant predictor of obesity in women married as adults. The positive association between high parity and obesity, however, was not statistically significant among women married as children. Nevertheless, the trajectories of the relationship between obesity and sociodemographic factors were mostly comparable across the two groups.

2.3. Regression Results

The unadjusted and adjusted odds ratios in favor of being obese for the full sample are presented in Table 2. Among the survey respondents in 2012 who were married before the age of 18 years, the adjusted odds of being obese were 1.37 times those of those who were married at or after the age of 18. In 2017, the adjusted odds in favor of being obese further increased to 1.51 for women married as children. When both survey years were combined, the odds and adjusted odds were estimated as 1.61 and 1.47, respectively.
Results for the alternate measure of obesity based on the standardized BMI cutoffs are presented in Table 3. The two alternate measures were BMI ≥ 1.5 standard deviation and BMI ≥ 2.0 standard deviation. The obesity prevalence according to these measures was 8.52% and 4.24%, respectively, which were relatively conservative estimates of obesity. For both these measures, women who were married as children were more likely to be obese. The odds of having a BMI more than 1.5 and 2.0 standard deviations for women married as children were, respectively, 1.51 and 1.89 times those of women who were married as adults.
Odds of being obese for the child marriage indicator by birth cohorts are presented in Table 4. Though the odds were higher for women across all birth cohorts, they were not statistically significant for the oldest birth cohort. The adjusted odds were statistically significant for the two younger cohorts only. In the youngest cohort, the adjusted odds of being obese for women married as children were 1.71 times those of their counterparts married as adults.
Results for the alternate obesity measures by birth cohorts are presented in Table 5. Though the adjusted odds ratios were greater than 1.00 for all birth cohorts, they were statistically significant for a few. This is not quite unusual, given that these were very conservative estimates of obesity.
The decomposition results of the total effect of child marriage via indirect effects of lifestyle factors, namely employment status and high parity (i.e., giving 5 or more births), are presented in Table 6. The correlation between child marriage and being employed, measured by Tetrachoric Rho, was −0.08 (p < 0.001). The Tetrachoric Rho for child marriage and giving birth of five or more children, on the other hand, was 0.24 (p < 0.001). Figure 5 shows that both being employed and having five or more children were significant predictors of the obesity condition in women. As such, the association between child marriage and obesity had potentials to be mediated via employment status and higher parity. However, we did not find any statistically significant indirect effect of employment in the full sample or in sub-samples by birth cohorts (Table 6). There was a small statistically significant indirect effect of high parity (4.78%) in the full sample, but not in the birth-cohort sub-samples. The joint indirect effects of employment and high parity were also not statistically significant.
Results of the association between child marriage and obesity in women by spousal age-difference groups are presented in Table 7. Spousal age differences were higher among women who were married as children compared to those in women who were married as adults. While 38.9% of the women married as adults had a spousal age difference of 0–2 years, this share was nearly half (19.4%) among women who were married as children. In contrast, 5.1% of the women married as adults had a spousal age difference of 10+ years, which was nearly two-fold (9.8%) in women married as children. The association between child marriage and obesity in women remained similar to our original estimates (column 6 in Table 2) after accounting for the spousal age-difference categories (column 1 in Table 7). The results were also similar across different groups of spousal age differences. No statistically significant association between child marriage and obesity, however, was observed for the 10+ years and < 0 years groups, both of which had a relatively smaller sample size.
Lastly, results of the simultaneous quantile regressions are presented in Table 8 and Table 9. The 25th, 50th, 75th, and 90th percentiles of BMI in the pooled sample were 21.93, 25.07, 28.78, and 32.74 kg/m2, respectively. At every quantile level, the expected BMI for women married as children was higher than that of women who were married as adults. For example, at the 90th quantile, the expected BMI level for women married before the age of 18 years was 1.52 kg/m2 more than that of women married at or after the age of 18 years (i.e., E [BMI(τ = 90) | Married as children]—E [BMI(τ = 90) | Married as adult] = 1.52). Results were similar across birth cohorts. As with the binary obesity outcome, higher expected levels of BMI for women married as children were more pronounced in the youngest birth cohort and not statistically significant in the oldest birth cohort.

3. Discussion

Though many aspects of child marriage have been widely studied in the literature, there is limited understanding of the long-term health conditions of women married as children. Obesity is one such chronic concern that has great relevance to the health and wellbeing of women of reproductive age [3]. In this paper, we investigated whether child marriage is associated with a higher likelihood of being obese at a later course of life among married women aged 25 to 49 in Tajikistan. Our findings suggest that the odds of being obese during the ages of 25 to 49 were higher for those who were married before age 18 than those who were married between the ages of 18 and 24.
Marriage at an early age may subsequently affect a girl’s development and health [33], leading to an increased risk of obesity in adulthood. Using a biobehavioral lens, the confluence of biological and psychosocial influences may impact health outcomes among women. For example, during the adolescent phase, women are undergoing significant growth and developmental changes. Childhood adversity can trigger dysregulation of hypothalamic–pituitary–adrenal (HPA) axis functioning in response to situations of high stress. Such reactions are linked to alterations in metabolic functioning and eating behaviors, which may increase the risk for obesity [34].
Existing literature also suggests a strong link between the early-life predictors of obesity and contextual factors such as socioeconomic inequality [35]. Child marriage is associated with early pregnancy, rapid repeat childbirth, and high parity [36,37,38] that, in conjunction with lower socioeconomic status, may contribute to the risk of obesity among child brides [39]. Further, child marriage restricts women’s employment opportunities and labor force participation [13], which is a contributing factor to the gender obesity gap [40]. Of note, from 2012 to 2017, women’s employment in our sample decreased by 1.04 pp; while the decrease was only 0.17 pp among those who were married as adults, it was as high as 5.44 pp among women who were married as children. During the same period, obesity prevalence increased by 8.63 pp among women who were employed, while it increased by 10.64 pp among women who were unemployed. Though these estimates obtained from the study sample were not part of our analyses, these are suggestive of a probable link between socioeconomic inequality and the risk of obesity in reproductive-age Tajik women.
The association between child marriage and obesity in women may also entail the possible seclusion of women from the social sphere. Women who were married in their adolescence were found to have less mobility, less household and economic power, less exposure to media, and limited social networks [41]. All these disadvantages may contribute to the obesity condition in women via lifestyle factors. Given data availability, we assessed whether factors, such as being employed or giving birth to five or more children, mediated the relationship between child marriage and obesity. We did not find any statistically significant indirect effects of these factors. Our analyses, however, were constrained by available constructs in the dataset, and future research, using appropriate data, may further explore these critical relationships.
An interesting angle of the relationship between child marriage and obesity among Tajik women was that the risk of obesity in women married as children was the highest in the youngest birth cohort (1983–1987), while the odds of being obese were not statistically different for women married as children and as adults in the oldest birth cohort (1967–1972). A major contrast between these two cohorts were the level of educational attainment. While only 1.83% of the women in the oldest cohort reported a lower level of educational attainment (i.e., primary or no education), this share was 9.66% in the youngest cohort. Among women married as children, the share of lower educational attainment was 3.01% in the oldest cohort, whereas it was 15.27% in the youngest cohort. As such, educational achievement may be an important target to reduce the risk of obesity among women married as children. The higher obesity prevalence among women married as children, even after accounting for household wealth, is consistent with the existing evidence that education plays a protective role against the wealth-induced risk of obesity in the LMICs [42]. As child marriage is a predictor for lower educational attainment [43], it can affect the level of knowledge of community resources as well as general decision-making capacity, nutritional status, and healthcare access for women.
This work must be considered in light of some limitations. First, we were unable to observe BMI at the onset of child marriage. An ideal experiment would entail observing individuals pre- and post-marriage and compare the obesity outcome of women who were married as a child with the obesity outcome of those who were married as adults. Due to data unavailability, we could not conduct such analyses. Second, data did not include information on growth patterns of participants nor their dietary habit and food consumption practices, or those of their parents or siblings. Future research is warranted in these areas to enhance our understanding of this relationship. Third, all analyses were limited to available constructs in the dataset; as such, we were unable to examine additional risk factors for early adversity such as mental health, which may further impact the observed results.

4. Materials and Methods

4.1. Data

We used the 2012 and 2017 waves of the Tajikistan Demography and Health Survey (TjDHS). The TjDHS is a nationally representative cross-sectional survey that follows a two-stage stratified sampling framework [19,20]. Around ten thousand women aged 15 to 49 years were interviewed during each wave of the TjDHS, yielding a response rate of 99% in both rounds [19,20]. Our sample included women aged 25 to 49 years who were married by the age of 24 years and were not pregnant at the time of the survey. We matched women by birth month and birth year across the two survey waves to create four birth cohorts, comprised of approximately five years, as follows: (i) Oldest: 1967–1972, (ii) Older: 1973–1977, (iii) Younger: 1978–1982, and (iv) Youngest: 1983–1987. Our analytical sample, thus, included 7005 women, of whom 3426 were interviewed in the 2012 wave and 3579 were interviewed in the 2017 wave.

4.2. Measures

The TjDHS collects anthropometric measures such as height and weight of the respondents and reports the body mass index (BMI) measures (in kg/m2). The obesity condition was defined as BMI ≥ 30.0 kg/m2. Our outcome variable, Obesei, was a binary variable indicating whether a respondent was obese or not. A common BMI cutoff (i.e., ≥30.0 kg/m2), however, may not be appropriate to determine obesity across race, ethnicity, and sex [44]. As such, BMI thresholds may need to be contextualized within nations or ethnicities to account for bodily differences associated with certain social and cultural practices [45]. To address this issue, we standardized BMI using the following formula: Z B M I i , a , y = B M I i , a , y B M I a , y ¯ S T D B M I a , y , where B M I i , a , y is the BMI of individual i of age group a (in 5-year intervals: 25–29, 30–34, 35–39, 40–44, and 45–49) in survey year y, and B M I a , y ¯ and S T D B M I a , y are the mean and standard deviations, respectively, of BMI in respective age groups and survey years. Using the standardized BMI, we created two alternative measures of obesity as follows: (i) B M I i , a , y 1.5   Z B M I i , a , y and (ii) B M I i , a , y 2.0   Z B M I i , a , y . These measures, which were not based on the universal BMI cutoff but on the BMI distribution in the Tajik population, were used to check the robustness of our analyses. We also used the continuous BMI measure as an alternative outcome.
The TjDHS also collects information on various sociodemographic characteristics of the respondents including marriage and sexual activity, fertility, and family planning. From the reported age of women at first marriage, we identified respondents who were married before the age of 18 years. Our key explanatory variable, CMi, is a binary variable indicating whether a respondent was married as a child or as an adult.

4.3. Statistical Analysis

We first examined the distribution of BMI of women aged 25 to 49 by child marriage for the 2012 and 2017 survey waves. We also examined the distribution by survey wave separately for women married as children and married as adults. The distributions were obtained by estimating the kernel density of BMI using the Epanechnikov kernel function for the respective groups.
Next, to assess how the obesity outcome differs across women married as children and as adults, we estimated the following binomial logistic regression models:
l o g i t ( O b e s e i ) = α 0 + α 1 C M i + X i α 2 + R e g i o n i + C o h o r t i                
l o g i t ( O b e s e i ) = β 0 + β 1 C M i + X i β 2 + R e g i o n i + Y e a r i + C o h o r t i                
Equation (1) was separately estimated for the two survey waves and Equation (2) was estimated for the pooled sample that included both survey waves. Regioni, Yeari, and Cohorti are administrative-region fixed effects, survey-wave fixed effects, and birth-cohort fixed effects, respectively. The vector Xi included the following sociodemographic covariates: education—primary or no education (reference group), secondary, and higher; employment status; household wealth index quintiles—poorest (reference group), poorer, middle, richer, and richest; life-time parity (i.e., number of children born)—≤2 (reference group), 3 to 4, and ≥5; urban/rural residence. Equations (1) and (2) were also estimated for the alternative obesity measures based on standardized BMI cutoffs.
Of note, we did not intend to analyze how these covariates predict obesity outcome in women. Rather, these covariates were included in the analysis to examine whether the relationship between child marriage and obesity persisted after controlling for related sociodemographic characteristics. We, however, obtained crude odds ratios in favor of being obese for the covariates included in the model by child marriage sub-groups (i.e., married as adults and married as children) to examine if the relationship between these covariates and obesity were similar (or different) across the two groups.
Covariates that were significant predictors of obesity in women and were significantly correlated with child marriage, such as lifestyle factors including employment status and having five or more children, were further explored by decomposing the total logistic coefficient of the child marriage indicator into direct and indirect parts. We applied the Karlson–Holm–Breen (KHB) method [46] to assess whether the effect of child marriage on obesity was mediated via employment status and giving five or more births. The decomposition analyses were separately and jointly performed for the two factors. The other covariates in vector Xi were controlled for confounding influences.
Spousal age difference is another factor that may impact obesity outcomes in married women via power differences in relationships, impacting fertility choice and behavioral practices [47]. As such, the relationship between child marriage and obesity in women married to similar-aged men and in women married to older men may vary. To address this issue, we calculated women’s age differences with their husbands and categorized the study participants in five spousal age difference groups as follows: (i) 0–2 years, (ii) 3–5 years, (iii) 6–9 years, (iv) 10+ years, and (v) <0 years (i.e., husband was younger). We then estimated Equation (2) with spousal age difference categories as additional covariates. Of note, information on husband’s age was not available for 568 observations (8% of the sample). Further, we estimated Equation (2) separately for the five spousal age-difference groups.
Lastly, to assess the relationship between continuous BMI outcome and child marriage, we estimated the following simultaneous quantile regression model:
Q τ ( B M I i ) = γ 0 ( τ ) + γ 1 ( τ ) C M i + X i γ 2 ( τ ) + R e g i o n i + Y e a r i + C o h o r t i                
The subscript τ in Equation (3) denotes quantiles. We reported estimates for the 25th, 50th, 75th, and 90th quantiles of the BMI distribution. Equations (2) and (3) were also separately estimated for the four birth cohorts. We reported the results with (adjusted) and without (unadjusted) the sociodemographic covariates. As we pooled data from two different survey waves, the use of wave-specific complex survey weights to obtain standard errors was not feasible. As such, standard errors in all specifications were obtained by bootstrapping with 1000 replications. All regressions were performed using Stata version 17.0 (StataCorp, College Station, TX, USA) software.

5. Conclusions

The findings of this research offer an important piece evidence to suggest that child marriage is predictive of obesity in adulthood among the Tajik women. Our results were robust to alternate measures of obesity and persisted when factors such as spousal age differences were accounted for. Though several studies document a positive relationship between marriage and weight gain [48,49], evidence on such a relationship in the context of early marriage is limited in the existing literature. Studying this relationship in the Tajikistan context has relevance for other LMICs with a high burden of child marriage. A recent study found a relatively higher risk of hypertension, for which obesity is a risk factor, among young-adult Tajik women who were married as children [22]. This finding was comparable to the findings of studies using data from India [21,23], where child marriage is a major social issue. A significant decline in early marriage was observed in Tajikistan in recent years, in comparison to other Central Asian, Sub-Saharan African, and South Asian countries, after enactment of a new law in 2010 that raised the minimum age at marriage to 18 years [50]. Our study population, however, was not impacted by this law, as all study participants were aged over 18 years at the time of enactment. As such, our study can be considered as a relevant piece of work, especially for countries that are battling to eliminate the harmful practice of child marriage.
This paper also contributes to the new and growing body of literature that examines the later-life health consequences of child marriage beyond reproductive health outcomes. By documenting the higher risk of obesity at adult age among women married as children, this study calls for strategic public health interventions that may potentially address both the prevention of child marriage and promotion of current health behaviors among women in the LMICs. Such interventions may include creating awareness on healthful food choices, removing barriers for women’s participation in physical activities, and embedding counselling services or behavioral therapies for obesity management with regular health checkups [51,52]. Further research is warranted to identify culturally appropriate interventions to combat obesity in women who were married as children.

Author Contributions

Conceptualization, B.D. and A.T.; methodology, B.D.; software, B.D.; validation, A.T.; formal analysis, B.D.; investigation, B.D.; resources, B.D.; data curation, B.D.; writing—original draft preparation, B.D. and A.T.; writing—review and editing, S.A. All authors have read and agreed to the published version of the manuscript.

Funding

This research received no external funding.

Institutional Review Board Statement

The study used anonymized data from a publicly available secondary source, and, therefore, ethics committee approval was not required. Participation in the survey was voluntary and informed consent was obtained prior to interview. The survey protocols are reviewed and approved by the ICF Institutional Review Board (IRB). Details of the ethical review are available at: https://dhsprogram.com/Methodology/Protecting-the-Privacy-of-DHS-Survey-Respondents.cfm (accessed on 14 November 2022). The methods were carried out in accordance with the “U.S. Department of Health and Human Services regulations for the protection of human subjects” and relevant national guidelines.

Informed Consent Statement

Informed consent was obtained from all subjects involved in the study.

Data Availability Statement

The datasets used and/or analyzed during the current study are freely available from the USAID’s Demographic and Health Surveys (DHS) Program website (https://www.dhsprogram.com/data/dataset_admin/login_main.cfm) (accessed on 14 November 2022) upon registering as a DHS data user and submitting a research proposal.

Conflicts of Interest

The authors declare no conflict of interest.

References

  1. Ford, N.D.; Patel, S.A.; Narayan, K.M.V. Obesity in Low- and Middle-Income Countries: Burden, Drivers, and Emerging Challenges. Annu. Rev. Public Health 2017, 38, 145–164. [Google Scholar] [CrossRef] [Green Version]
  2. Kanguru, L.; McCaw-Binns, A.; Bell, J.; Yonger-Coleman, N.; Wilks, R.; Hussein, J. The Burden of Obesity in Women of Reproductive Age and in Pregnancy in a Middle-Income Setting: A Population Based Study from Jamaica. PLoS ONE 2017, 12, e0188677. [Google Scholar] [CrossRef] [Green Version]
  3. Kulie, T.; Slattengren, A.; Redmer, J.; Counts, H.; Eglash, A.; Schrager, S. Obesity and Women’s Health: An Evidence-Based Review. J. Am. Board Fam. Med. 2011, 24, 75–85. [Google Scholar] [CrossRef] [PubMed]
  4. Newton, S.; Braithwaite, D.; Akinyemiju, T.F. Socio-Economic Status over the Life Course and Obesity: Systematic Review and Meta-Analysis. PLoS ONE 2017, 12, e0177151. [Google Scholar] [CrossRef] [PubMed] [Green Version]
  5. Mackenbach, J.P.; Stirbu, I.; Roskam, A.-J.R.; Schaap, M.M.; Menvielle, G.; Leinsalu, M.; Kunst, A.E.; European Union Working Group on Socioeconomic Inequalities in Health. Socioeconomic Inequalities in Health in 22 European Countries. N. Engl. J. Med. 2008, 358, 2468–2481. [Google Scholar] [CrossRef] [Green Version]
  6. Reyes Matos, U.; Mesenburg, M.A.; Victora, C.G. Socioeconomic Inequalities in the Prevalence of Underweight, Overweight, and Obesity among Women Aged 20-49 in Low- and Middle-Income Countries. Int. J. Obes. 2020, 44, 609–616. [Google Scholar] [CrossRef] [PubMed] [Green Version]
  7. Barth-Jaeggi, T.; Zandberg, L.; Bahruddinov, M.; Kiefer, S.; Rahmarulloev, S.; Wyss, K. Nutritional Status of Tajik Children and Women: Transition towards a Double Burden of Malnutrition. Matern. Child Nutr. 2020, 16, e12886. [Google Scholar] [CrossRef] [PubMed] [Green Version]
  8. Davis, C.R.; Dearing, E.; Usher, N.; Trifiletti, S.; Zaichenko, L.; Ollen, E.; Brinkoetter, M.T.; Crowell-Doom, C.; Joung, K.; Park, K.H.; et al. Detailed Assessments of Childhood Adversity Enhance Prediction of Central Obesity Independent of Gender, Race, Adult Psychosocial Risk and Health Behaviors. Metabolism 2014, 63, 199–206. [Google Scholar] [CrossRef] [Green Version]
  9. United Nations Children’s Fund (UNICEF). Early Marriage—A Harmful Traditional Practice—A Statistical Exploration; UNICEF: New York, NY, USA, 2005; Available online: https://data.unicef.org/resources/early-marriage-a-traditional-harmful-practice-a-statistical-exploration/ (accessed on 10 September 2022).
  10. Fan, S.; Koski, A. The Health Consequences of Child Marriage: A Systematic Review of the Evidence. BMC Public Health 2022, 22, 309. [Google Scholar] [CrossRef]
  11. Santhya, K.; Jejeebhoy, S. Sexual and reproductive health needs of married adolescent girls. Econ. Political Wkly. 2003, 38, 4370–4377. [Google Scholar]
  12. Clark, S.; Bruce, J.; Dude, A. Protecting Young Women from HIV/AIDS: The Case against Child and Adolescent Marriage. Int. Fam. Plan. Perspect. 2006, 32, 79–88. [Google Scholar] [CrossRef]
  13. Parsons, J.; Edmeades, J.; Kes, A.; Petroni, S.; Sexton, M.; Wodon, Q. Economic Impacts of Child Marriage: A Review of the Literature. Rev. Faith Int. Aff. 2015, 13, 12–22. [Google Scholar] [CrossRef] [Green Version]
  14. Martin, M.A.; Lippert, A.M. Feeding Her Children, but Risking Her Health: The Intersection of Gender, Household Food Insecurity and Obesity. Soc. Sci. Med. 2012, 74, 1754–1764. [Google Scholar] [CrossRef] [Green Version]
  15. Basiotis, P.; Lino, M. Food insufficiency and prevalence of overweight among adult women. Fam. Econ. Nutr. Rev. 2003, 15, 55–58. [Google Scholar]
  16. Townsend, M.S.; Peerson, J.; Love, B.; Achterberg, C.; Murphy, S.P. Food Insecurity Is Positively Related to Overweight in Women. J. Nutr. 2001, 131, 1738–1745. [Google Scholar] [CrossRef] [Green Version]
  17. Keats, E.C.; Rappaport, A.I.; Shah, S.; Oh, C.; Jain, R.; Bhutta, Z.A. The Dietary Intake and Practices of Adolescent Girls in Low- and Middle-Income Countries: A Systematic Review. Nutrients 2018, 10, 1978. [Google Scholar] [CrossRef] [Green Version]
  18. Yaya, S.; Odusina, E.K.; Bishwajit, G. Prevalence of Child Marriage and Its Impact on Fertility Outcomes in 34 Sub-Saharan African Countries. BMC Int. Health Hum. Rights 2019, 19, 33. [Google Scholar] [CrossRef] [Green Version]
  19. Statistical Agency under the President of the Republic of Tajikistan (SA); Ministry of Health of Tajikistan (MOH); ICF International. Tajikistan Demographic and Health Survey 2012; SA: Dushanbe, Tajikistan; MOH: Dushanbe, Tajikistan; ICF: Calverton, MD, USA, 2013; Available online: https://dhsprogram.com/pubs/pdf/FR279/FR279.pdf (accessed on 10 September 2022).
  20. Statistical Agency under the President of the Republic of Tajikistan (SA); Ministry of Health of the Republic of Tajikistan (MOHSP); ICF International. Tajikistan Demographic and Health Survey 2017; SA: Dushanbe, Tajikistan; MOH: Dushanbe, Tajikistan; ICF: Calverton, MD, USA, 2018; Available online: https://dhsprogram.com/pubs/pdf/FR341/FR341.pdf (accessed on 10 September 2022).
  21. Datta, B.K.; Haider, M.R.; Tiwari, A.; Jahan, M. The Risk of Hypertension among Child Brides and Adolescent Mothers at Age 20 s, 30 s, and 40 s: Evidence from India. J. Hum. Hypertens. 2022. [Google Scholar] [CrossRef]
  22. Datta, B.; Tiwari, A. Adding to Her Woes: Child Bride’s Higher Risk of Hypertension at Young Adulthood. J. Public Health 2022, fdac026. [Google Scholar] [CrossRef]
  23. Datta, B.; Tiwari, A. Early Marriage in Adolescence and Risk of High Blood Pressure and High Blood Glucose in Adulthood: Evidence from India. Women 2022, 2, 189–203. [Google Scholar] [CrossRef]
  24. Datta, B.; Tiwari, A.; Glenn, L. Stolen Childhood Taking a Toll at Young Adulthood: The Higher Risk of High Blood Pressure and High Blood Glucose Comorbidity among Child Brides. PLoS Glob. Public Health 2022, 2, e0000638. [Google Scholar] [CrossRef]
  25. Efevbera, Y.; Bhabha, J.; Farmer, P.; Fink, G. Girl Child Marriage, Socioeconomic Status, and Undernutrition: Evidence from 35 Countries in Sub-Saharan Africa. BMC Med. 2019, 17, 55. [Google Scholar] [CrossRef]
  26. Datta, B.K.; Haider, M.R. The Double Burden of Overweight or Obesity and Anemia among Women Married as Children in India: A Case of the Simpson’s Paradox. Obes. Res. Clin. Pract. 2022, 16, 364–372. [Google Scholar] [CrossRef]
  27. Gunderson, E.P.; Abrams, B.; Selvin, S. The Relative Importance of Gestational Gain and Maternal Characteristics Associated with the Risk of Becoming Overweight after Pregnancy. Int. J. Obes. Relat. Metab. Disord. 2000, 24, 1660–1668. [Google Scholar] [CrossRef] [Green Version]
  28. van den Broek, T.; Fleischmann, M. The Causal Effect of Number of Children on Later-Life Overweight and Obesity in Parous Women. An Instrumental Variable Study. Prev. Med. Rep. 2021, 24, 101528. [Google Scholar] [CrossRef]
  29. Burgess, R.A.; Jeffery, M.; Odero, S.A.; Rose-Clarke, K.; Devakumar, D. Overlooked and Unaddressed: A Narrative Review of Mental Health Consequences of Child Marriages. PLoS Glob. Public Health 2022, 2, e0000131. [Google Scholar] [CrossRef]
  30. Tebb, K.P.; Brindis, C.D. Understanding the Psychological Impacts of Teenage Pregnancy through a Socio-Ecological Framework and Life Course Approach. Semin. Reprod. Med. 2022, 40, 107–115. [Google Scholar] [CrossRef]
  31. Thomas, K.; Nilsson, E.; Festin, K.; Henriksson, P.; Lowén, M.; Löf, M.; Kristenson, M. Associations of Psychosocial Factors with Multiple Health Behaviors: A Population-Based Study of Middle-Aged Men and Women. Int. J. Environ. Res. Public Health 2020, 17, 1239. [Google Scholar] [CrossRef] [Green Version]
  32. Moore, C.J.; Cunningham, S.A. Social Position, Psychological Stress, and Obesity: A Systematic Review. J. Acad. Nutr. Diet. 2012, 112, 518–526. [Google Scholar] [CrossRef]
  33. Hanna, B.; Kleinman, A. Unpacking Global Health: Theory and Critique. In Reimagining Global Health; University of California Press: Berkeley, CA, USA, 2013; pp. 15–32. [Google Scholar]
  34. Pervanidou, P.; Chrousos, G.P. Metabolic Consequences of Stress during Childhood and Adolescence. Metabolism 2012, 61, 611–619. [Google Scholar] [CrossRef]
  35. Cameron, A.J.; Spence, A.C.; Laws, R.; Hesketh, K.D.; Lioret, S.; Campbell, K.J. A Review of the Relationship Between Socioeconomic Position and the Early-Life Predictors of Obesity. Curr. Obes. Rep. 2015, 4, 350–362. [Google Scholar] [CrossRef]
  36. United Nations Population Fund (UNFPA). Girlhood, Not Motherhood: Preventing Adolescent Pregnancy; UNFPA: New York, NY, USA, 2015; Available online: https://www.unfpa.org/publications/girlhood-not-motherhood (accessed on 10 September 2022).
  37. Godha, D.; Hotchkiss, D.; Gage, A. Association between child marriage and reproductive health outcomes and service utilization: A multi-country study from South Asia. J. Adolesc. Health 2013, 52, 552–558. [Google Scholar] [CrossRef]
  38. Nour, N.M. Health Consequences of Child Marriage in Africa. Emerg. Infect. Dis. 2006, 12, 1644–1649. [Google Scholar] [CrossRef]
  39. Davis, E.M.; Zyzanski, S.J.; Olson, C.M.; Stange, K.C.; Horwitz, R.I. Racial, Ethnic, and Socioeconomic Differences in the Incidence of Obesity Related to Childbirth. Am. J. Public Health 2009, 99, 294–299. [Google Scholar] [CrossRef]
  40. Costa-Font, J.; Györi, M. The Weight of Patriarchy? Gender Obesity Gaps in the Middle East and North Africa (MENA). Soc. Sci. Med. 2020, 266, 113353. [Google Scholar] [CrossRef]
  41. Haberland, N.; Chong, E.L.; Bracken, H.J. A world apart: The disadvantage and social isolation of married adolescent girls. In Brief Based on Background Paper Prepared for the WHO/UNFPA/Population Council Technical Consultation on Married Adolescents; Population Council: New York, NY, USA, 2004; Available online: https://www.ohchr.org/sites/default/files/Documents/Issues/Women/WRGS/ForcedMarriage/NGO/PopulationCouncil28.pdf (accessed on 28 December 2022).
  42. Aitsi-Selmi, A.; Bell, R.; Shipley, M.J.; Marmot, M.G. Education Modifies the Association of Wealth with Obesity in Women in Middle-Income but Not Low-Income Countries: An Interaction Study Using Seven National Datasets, 2005–2010. PLoS ONE 2014, 9, e90403. [Google Scholar] [CrossRef]
  43. McCleary-Sills, J.; Hanmer, L.; Parsons, J.; Klugman, J. Child Marriage: A Critical Barrier to Girls’ Schooling and Gender Equality in Education. Rev. Faith Int. Aff. 2015, 13, 69–80. [Google Scholar] [CrossRef] [Green Version]
  44. Stanford, F.C.; Lee, M.; Hur, C. Race, Ethnicity, Sex, and Obesity: Is It Time to Personalize the Scale? Mayo Clin. Proc. 2019, 94, 362–363. [Google Scholar] [CrossRef] [Green Version]
  45. Cottino, G. Obesity “Epidemic” in the Kingdom of Tonga: Critical Notes on the “Right” Body Size. J. Anthropol. 2014, 138–139, 65–87. [Google Scholar] [CrossRef] [Green Version]
  46. Karlson, K.B.; Holm, A.; Breen, R. Comparing Regression Coefficients Between Same-Sample Nested Models Using Logit and Probit: A New Method. Sociol. Methodol. 2012, 42, 286–313. [Google Scholar] [CrossRef]
  47. Minocher, R.; Ross, C.T. Spousal Age-Gaps, Partner Preferences, and Consequences for Well-Being in Four Colombian Communities. Evol. Hum. Behav. 2022, 43, 394–407. [Google Scholar] [CrossRef]
  48. Wilson, S.E. Marriage, Gender and Obesity in Later Life. Econ. Hum. Biol. 2012, 10, 431–453. [Google Scholar] [CrossRef]
  49. Mata, J.; Richter, D.; Schneider, T.; Hertwig, R. How Cohabitation, Marriage, Separation, and Divorce Influence BMI: A Prospective Panel Study. Health Psychol. 2018, 37, 948–958. [Google Scholar] [CrossRef] [PubMed] [Green Version]
  50. Batyra, E.; Pesando, L.M. Trends in Child Marriage and New Evidence on the Selective Impact of Changes in Age-at-Marriage Laws on Early Marriage. SSM—Popul. Health 2021, 14, 100811. [Google Scholar] [CrossRef] [PubMed]
  51. Blumenthal, S.J.; Hendi, J.M.; Marsillo, L. A Public Health Approach to Decreasing Obesity. JAMA 2002, 288, 2178. [Google Scholar] [CrossRef] [PubMed]
  52. Salam, R.A.; Padhani, Z.A.; Das, J.K.; Shaikh, A.Y.; Hoodbhoy, Z.; Jeelani, S.M.; Lassi, Z.S.; Bhutta, Z.A. Effects of Lifestyle Modification Interventions to Prevent and Manage Child and Adolescent Obesity: A Systematic Review and Meta-Analysis. Nutrients 2020, 12, 2208. [Google Scholar] [CrossRef]
Figure 1. Conceptual framework of the relationship between child marriage and obesity.
Women 03 00004 g001
Figure 2. Distribution of body mass index by child marriage and survey wave.
Women 03 00004 g002
Figure 3. Obesity prevalence by survey wave, birth cohort, and child marriage. The lighter and darker shades of the same color represent 2012 and 2017 survey waves, respectively. The differences in obesity prevalence between women married as children and married as adults were statistically significant for the youngest birth cohort (i.e., 1983–1987) in both survey waves, and for the 1978–1982 birth cohort in the 2017 survey wave. The differences were not statistically significant for the older birth cohorts (i.e., 1973–1977 and 1967–1972) in either survey wave.
Women 03 00004 g003
Figure 4. Box plot of BMI by child marriage across birth cohorts and survey waves. The box represents the 25th percentile, median, and 75th percentile values, from left to right. The bars on the left and right of the box represent lower and upper adjacent values, respectively. The circles represent outside values.
Women 03 00004 g004
Figure 5. Crude odds ratios in favor of being obese for sociodemographic correlates. Horizontal lines across the markers represent 95% confidence intervals. Standard errors were obtained by bootstrapping with 1000 replications.
Women 03 00004 g005
Table 1. Descriptive statistics by birth cohorts.
All
1967–1987
Birth Cohort
1967–19721973–19771978–19821983–1987
N = 7005N = 1692N = 1654N = 1693N = 1966
Share of women (%)
Outcome
Obesity19.4328.7221.6418.6110.27
Exposure
Child marriage18.339.8126.8424.3413.33
Covariates
Education
No/primary4.401.832.063.139.66
Secondary77.6074.5980.7182.2873.55
Higher18.0023.5817.2314.5916.79
Wealth Index Quintiles
1st: Poorest18.4718.5020.5019.6115.77
2nd: Poorer16.2013.9515.7816.3618.36
3rd: Middle17.1315.9615.3016.8319.94
4th: Richer18.8319.9817.7818.3719.13
5th: Richest29.3631.6230.6528.8226.81
Employed31.7238.8934.7028.8825.48
Parity
2 or less21.6613.5313.0617.9639.06
3 to 453.0646.3451.6959.7854.22
5 or more25.2840.1335.2522.276.71
Urban36.4338.1238.0336.2733.77
Region
Dushanbe16.8717.0818.0216.6615.92
Sughd24.7324.8823.5826.2824.21
Khalton26.4726.7725.9425.9927.06
DRS22.9120.3321.8924.2224.87
Gabo9.0210.9310.586.857.93
Note: Shares add to 100 across rows for respective characteristics (e.g., education, wealth index, and quintiles).
Table 2. Odds ratios in favor being obese for the full sample.
Not Adjusted for Sociodemographic CorrelatesAdjusted for Sociodemographic Correlates
2012 Wave2017 WaveBoth Waves2012 Wave2017 WaveBoth Waves
Child marriage1.533 ***1.666 ***1.614 ***1.371 *1.509 ***1.468 ***
(1.202, 1.954)(1.371, 2.024)(1.393, 1.870)(1.062, 1.770)(1.232, 1.850)(1.259, 1.711)
Birth cohort
1967–1972Ref.Ref.Ref.Ref.Ref.Ref.
1973–19770.616 ***0.617 ***0.612 ***0.605 ***0.636 ***0.618 ***
(0.478, 0.793)(0.497, 0.766)(0.517, 0.726)(0.467, 0.785)(0.509, 0.794)(0.519, 0.736)
1978–19820.405 ***0.585 ***0.508 ***0.394 ***0.562 ***0.499 ***
(0.308, 0.533)(0.468, 0.730)(0.429, 0.601)(0.294, 0.529)(0.446, 0.710)(0.419, 0.594)
1983–19870.225 ***0.299 ***0.268 ***0.228 ***0.273 ***0.253 ***
(0.165, 0.306)(0.236, 0.378)(0.224, 0.320)(0.160, 0.324)(0.211, 0.353)(0.209, 0.306)
Survey wave
2012 Ref. Ref.
2017 2.024 *** 2.069 ***
(1.798, 2.278) (1.828, 2.340)
Observations342635797005342635797005
Note: 95% confidence intervals are in parentheses. *** p < 0.001; * p < 0.05. Standard errors were obtained by bootstrapping with 1000 replications. Sociodemographic correlates include education, employment status, household wealth index quintiles, parity (i.e., number of children born), urban/rural residence, and administrative region fixed effects.
Table 3. Odds ratios in favor being obese (alternate measure) for the full sample.
Not Adjusted for Sociodemographic CorrelatesAdjusted for Sociodemographic Correlates
2012 Wave2017 WaveBoth Waves2012 Wave2017 WaveBoth Waves
A. ≥ 1.5 Std. Dev.
Child marriage1.736 ***1.706 ***1.721 ***1.491 **1.481 **1.505 ***
(1.324, 2.275)(1.290, 2.256)(1.409, 2.104)(1.119, 1.985)(1.111, 1.975)(1.225, 1.849)
B. ≥ 2.0 Std. Dev.
Child marriage2.318 ***2.022 ***2.183 ***1.982 ***1.728 **1.894 ***
(1.625, 3.305)(1.364, 2.997)(1.685, 2.828)(1.359, 2.891)(1.152, 2.593)(1.449, 2.476)
Observations342635797005342635797005
Note: 95% confidence intervals are in parenthesis. *** p < 0.001; ** p < 0.01. Standard errors were obtained by bootstrapping with 1000 replications. Sociodemographic correlates include education, employment status, household wealth index quintiles, parity (i.e., number of children born), urban/rural residence, and administrative region fixed effects.
Table 4. Odds ratios in favor being obese by birth cohort.
Birth Cohorts
Oldest: 1967–1972Older: 1973–1977Younger: 1978–1982Youngest: 1983–1987
A. Not adjusted
Child marriage1.2861.459 **1.746 ***2.224 ***
(0.904, 1.830)(1.126, 1.892)(1.317, 2.315)(1.532, 3.229)
Survey wave
2012Ref.Ref.Ref.Ref.
20171.741 ***1.782 ***2.583 ***2.386 ***
(1.396, 2.171)(1.396, 2.274)(1.973, 3.381)(1.753, 3.248)
Observations1692165416931966
B. Adjusted
Child marriage1.2261.2651.579 **1.707 **
(0.841, 1.787)(0.955, 1.676)(1.168, 2.135)(1.138, 2.560)
Survey wave
2012Ref.Ref.Ref.Ref.
20171.752 ***1.879 ***2.815 ***2.211 ***
(1.391, 2.206)(1.454, 2.427)(2.129, 3.720)(1.579, 3.098)
Observations1692165416931966
Note: 95% confidence intervals are in parentheses. *** p < 0.001; ** p < 0.01. Standard errors were obtained by bootstrapping with 1000 replications. Sociodemographic correlates include education, employment status, household wealth index quintiles, parity (i.e., number of children born), urban/rural residence, and administrative region fixed effects.
Table 5. Odds ratios in favor being obese (alternate measure) by birth cohorts.
Birth Cohorts
Oldest: 1967–1972Older: 1973–1977Younger: 1978–1982Youngest: 1983–1987
A. Not adjusted
i. ≥ 1.5 Std. Dev.
Child marriage1.6351.804 **1.528 *1.935 ***
(0.960, 2.785)(1.245, 2.615)(1.073, 2.175)(1.326, 2.823)
ii. ≥ 2.0 Std. Dev.
Child marriage2.163 *2.838 ***1.2822.839 ***
(1.080, 4.331)(1.701, 4.736)(0.749, 2.195)(1.761, 4.578)
B. Adjusted
i. ≥ 1.5 Std. Dev.
Child marriage1.4611.723 **1.2191.500
(0.835, 2.556)(1.169, 2.538)(0.817, 1.819)(0.990, 2.271)
ii. ≥ 2.0 Std. Dev.
Child marriage1.9112.482 **1.0842.073 **
(0.987, 3.699)(1.427, 4.319)(0.614, 1.914)(1.219, 3.526)
Observations1692165416931966
Note: 95% confidence intervals are in parentheses. *** p < 0.001; ** p < 0.01; * p < 0.05. Standard errors were obtained by bootstrapping with 1000 replications. Sociodemographic correlates include education, employment status, household wealth index quintiles, parity (i.e., number of children born), urban/rural residence, and administrative region fixed effects.
Table 6. Decomposition of total effect of child marriage into direct and indirect effect via employment status and high parity.
All:
1967–1987
Birth Cohorts
Oldest:
1967–1972
Older:
1973–1977
Younger:
1978–1982
Youngest:
1983–1987
A. Employed
Total Effect0.395 ***0.2160.2340.470 **0.595 **
(0.243, 0.547)(−0.160, 0.592)(−0.043, 0.510)(0.181, 0.760)(0.202, 0.989)
Direct Effect0.399 ***0.2120.2420.472 **0.602 **
(0.247, 0.551)(−0.164, 0.588)(−0.035, 0.520)(0.183, 0.762)(0.207, 0.998)
Indirect Effect−0.0030.004−0.009−0.002−0.007
(−0.009, 0.002)(−0.008, 0.016)(−0.024, 0.007)(−0.020, 0.016)(−0.027, 0.013)
B. Parity ≥ 5
Total Effect0.397 ***0.2180.2320.473 **0.589 **
(0.245, 0.549)(−0.157, 0.593)(−0.044, 0.509)(0.185, 0.761)(0.195, 0.983)
Direct Effect0.378 ***0.2120.2300.445 **0.543 **
(0.225, 0.531)(−0.164, 0.587)(−0.047, 0.508)(0.145, 0.744)(0.141, 0.946)
Indirect Effect0.019 *0.0060.0020.0280.046
(0.001, 0.037)(−0.012, 0.024)(−0.022, 0.026)(−0.031, 0.087)(−0.023, 0.115)
C. Employed and Parity ≥ 5
Total Effect0.397 ***0.2180.2340.472 **0.591 **
(0.245, 0.549)(−0.158, 0.594)(−0.043, 0.511)(0.182, 0.761)(0.196, 0.985)
Direct Effect0.382 ***0.2080.2410.453 **0.552 **
(0.229, 0.536)(−0.169, 0.585)(−0.038, 0.520)(0.152, 0.753)(0.146, 0.958)
Indirect Effect0.0140.010−0.0070.0190.039
(−0.005, 0.034)(−0.011, 0.031)(−0.038, 0.024)(−0.043, 0.081)(−0.036, 0.113)
Note: Estimates are coefficients of the logistic regression, not odds ratios. Direct and indirect effects add up to total effect. 95% confidence intervals are in parentheses. *** p < 0.001; ** p < 0.01; * p < 0.05. Standard errors were obtained by bootstrapping with 1000 replications. To control for confounding influences in the decomposition analyses, the following sociodemographic correlates were included: education, household wealth index quintiles, urban/rural residence, and administrative region fixed effects.
Table 7. Odds ratios in favor being obese by spousal age-difference groups.
Spousal Age Difference
All0–23–56–910+<0
Child mariage1.416 ***1.454 *1.307 *1.551 *1.4006.679
(1.202, 1.668)(1.007, 2.099)(1.002, 1.706)(1.108, 2.171)(0.725, 2.705)(0.172, 259.234)
Observations6437227124541132387193
Note: 95% confidence intervals are in parentheses. *** p < 0.001; * p < 0.05. Standard errors were obtained by bootstrapping with 1000 replications. The full sample model accounts for spousal age difference categories. All models controlled for birth cohort fixed effects, survey year fixed effects, and sociodemographic correlates including education, employment status, household wealth index quintiles, parity (i.e., number of children born), urban/rural residence, and administrative region fixed effects.
Table 8. Quantile regression results for body mass index for the full sample.
Q25Q50Q75Q90
A. Not adjusted
Child marriage0.975 ***1.070 ***1.490 ***2.020 ***
(0.616, 1.334)(0.737, 1.403)(0.976, 2.004)(1.284, 2.756)
Birth cohort
1967–1972Ref.Ref.Ref.Ref.
1973–1977−1.185 ***−1.090 ***−1.550 ***−1.520 ***
(−1.551, −0.819)(−1.491, −0.689)(−2.073, −1.027)(−2.256, −0.784)
1978–1982−1.400 ***−1.920 ***−2.230 ***−2.740 ***
(−1.739, −1.061)(−2.332, −1.508)(−2.781, −1.679)(−3.492, −1.988)
1983–1987−2.830 ***−3.650 ***−4.470 ***−4.800 ***
(−3.137, −2.523)(−4.027, −3.273)(−4.981, −3.959)(−5.499, −4.101)
Survey wave
2012Ref.Ref.Ref.Ref.
20171.565 ***1.890 ***2.250 ***2.640 ***
(1.324, 1.806)(1.629, 2.151)(1.886, 2.614)(2.118, 3.162)
B. Adjusted
Child marriage0.614 **0.787 ***1.108 ***1.519 ***
(0.227, 1.000)(0.426, 1.148)(0.598, 1.618)(0.756, 2.282)
Birth cohort
1967–1972Ref.Ref.Ref.Ref.
1973–1977−0.928 ***−1.094 ***−1.423 ***−1.496 ***
(−1.378, −0.477)(−1.524, −0.664)(−1.987, −0.860)(−2.273, −0.719)
1978–1982−1.423 ***−1.781 ***−2.158 ***−2.465 ***
(−1.842, −1.004)(−2.204, −1.358)(−2.766, −1.550)(−3.228, −1.702)
1983–1987−2.798 ***−3.509 ***−4.251 ***−4.612 ***
(−3.204, −2.391)(−3.924, −3.095)(−4.839, −3.663)(−5.391, −3.833)
Survey wave
2012Ref.Ref.Ref.Ref.
20171.505 ***1.861 ***2.313 ***2.566 ***
(1.241, 1.770)(1.598, 2.125)(1.929, 2.697)(2.045, 3.086)
Note: 95% confidence intervals are in parentheses. *** p < 0.001; ** p < 0.01. Standard errors were obtained by bootstrapping with 1000 replications. Sociodemographic correlates include education, employment status, household wealth index quintiles, parity (i.e., number of children born), urban/rural residence, and administrative region fixed effects.
Table 9. Quantile regression results for body mass index by birth cohorts.
Q25Q50Q75Q90
A. Not adjusted
I. 1967–1972
Child marriage0.8000.9101.1701.690
(−0.172, 1.772)(−0.027, 1.847)(−0.337, 2.677)(−0.503, 3.883)
II. 1967–1972
Child marriage0.6300.910 **1.510 **2.110 **
(−0.050, 1.310)(0.302, 1.518)(0.510, 2.510)(0.539, 3.681)
III. 1978–1982
Child marriage1.350 ***1.170 ***1.480 **1.700 **
(0.712, 1.988)(0.530, 1.810)(0.453, 2.507)(0.463, 2.937)
IV. 1983–1987
Child marriage0.930 **1.350 ***1.720 ***2.810 **
(0.274, 1.586)(0.598, 2.102)(0.728, 2.712)(1.035, 4.585)
B. Adjusted
I. 1967–1972
Child marriage0.3550.2100.7202.183
(−0.562, 1.272)(−0.801, 1.221)(−0.954, 2.394)(−0.102, 4.469)
II. 1967–1972
Child marriage0.781 *0.5370.8402.053 *
(0.030, 1.532)(−0.150, 1.224)(−0.107, 1.787)(0.432, 3.674)
III. 1978–1982
Child marriage1.198 ***0.927 **1.126 *−0.063
(0.529, 1.867)(0.223, 1.630)(0.162, 2.090)(−1.236, 1.110)
IV. 1983–1987
Child marriage0.4400.757 *1.391 *1.770 *
(−0.385, 1.265)(0.066, 1.448)(0.287, 2.495)(0.126, 3.414)
Note: 95% confidence intervals are in parentheses. *** p < 0.001; ** p < 0.01; * p < 0.05. Standard errors were obtained by bootstrapping with 1000 replications. Sociodemographic correlates include education, employment status, household wealth index quintiles, parity (i.e., number of children born), urban/rural residence, and administrative region fixed effects.
Disclaimer/Publisher’s Note: The statements, opinions and data contained in all publications are solely those of the individual author(s) and contributor(s) and not of MDPI and/or the editor(s). MDPI and/or the editor(s) disclaim responsibility for any injury to people or property resulting from any ideas, methods, instructions or products referred to in the content.

