
Correlation of Socio-Economic Factors, Diet, and Ownership of Consumer Electronics with Body Mass Index in Women of Childbearing Age: Insights from the 2016 South African Demographic Health Survey

Abstract
:1. Background
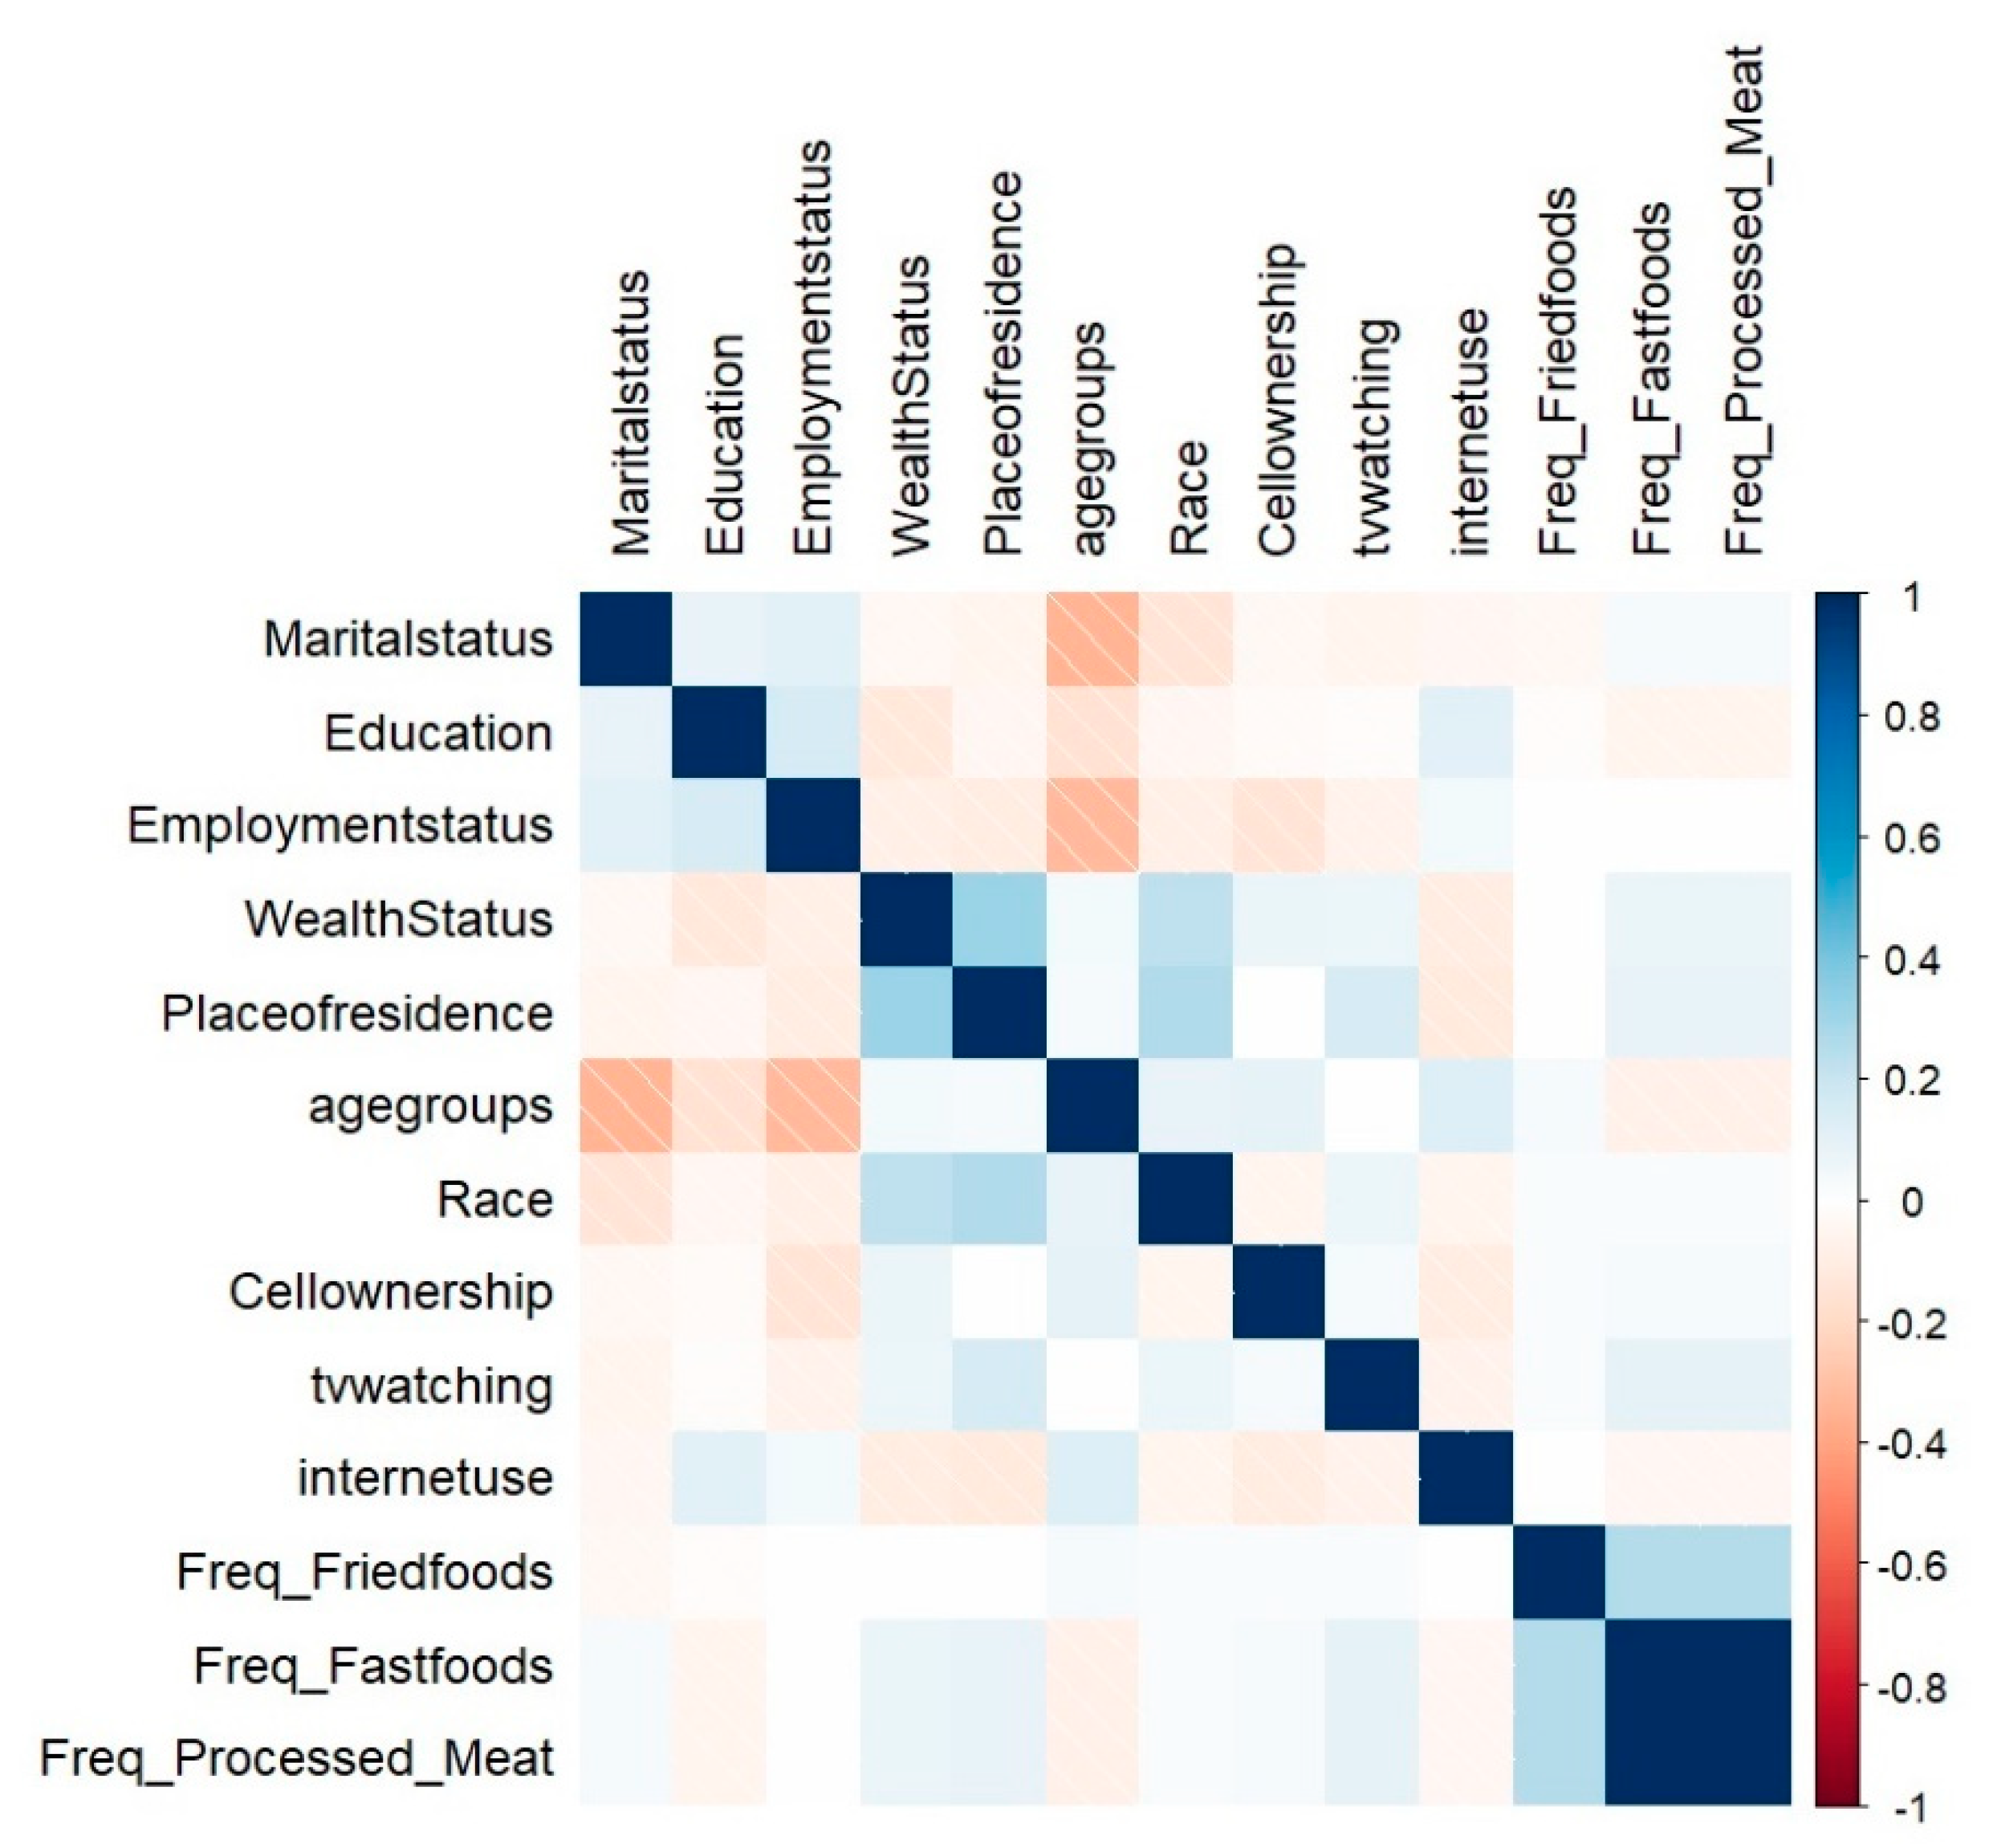
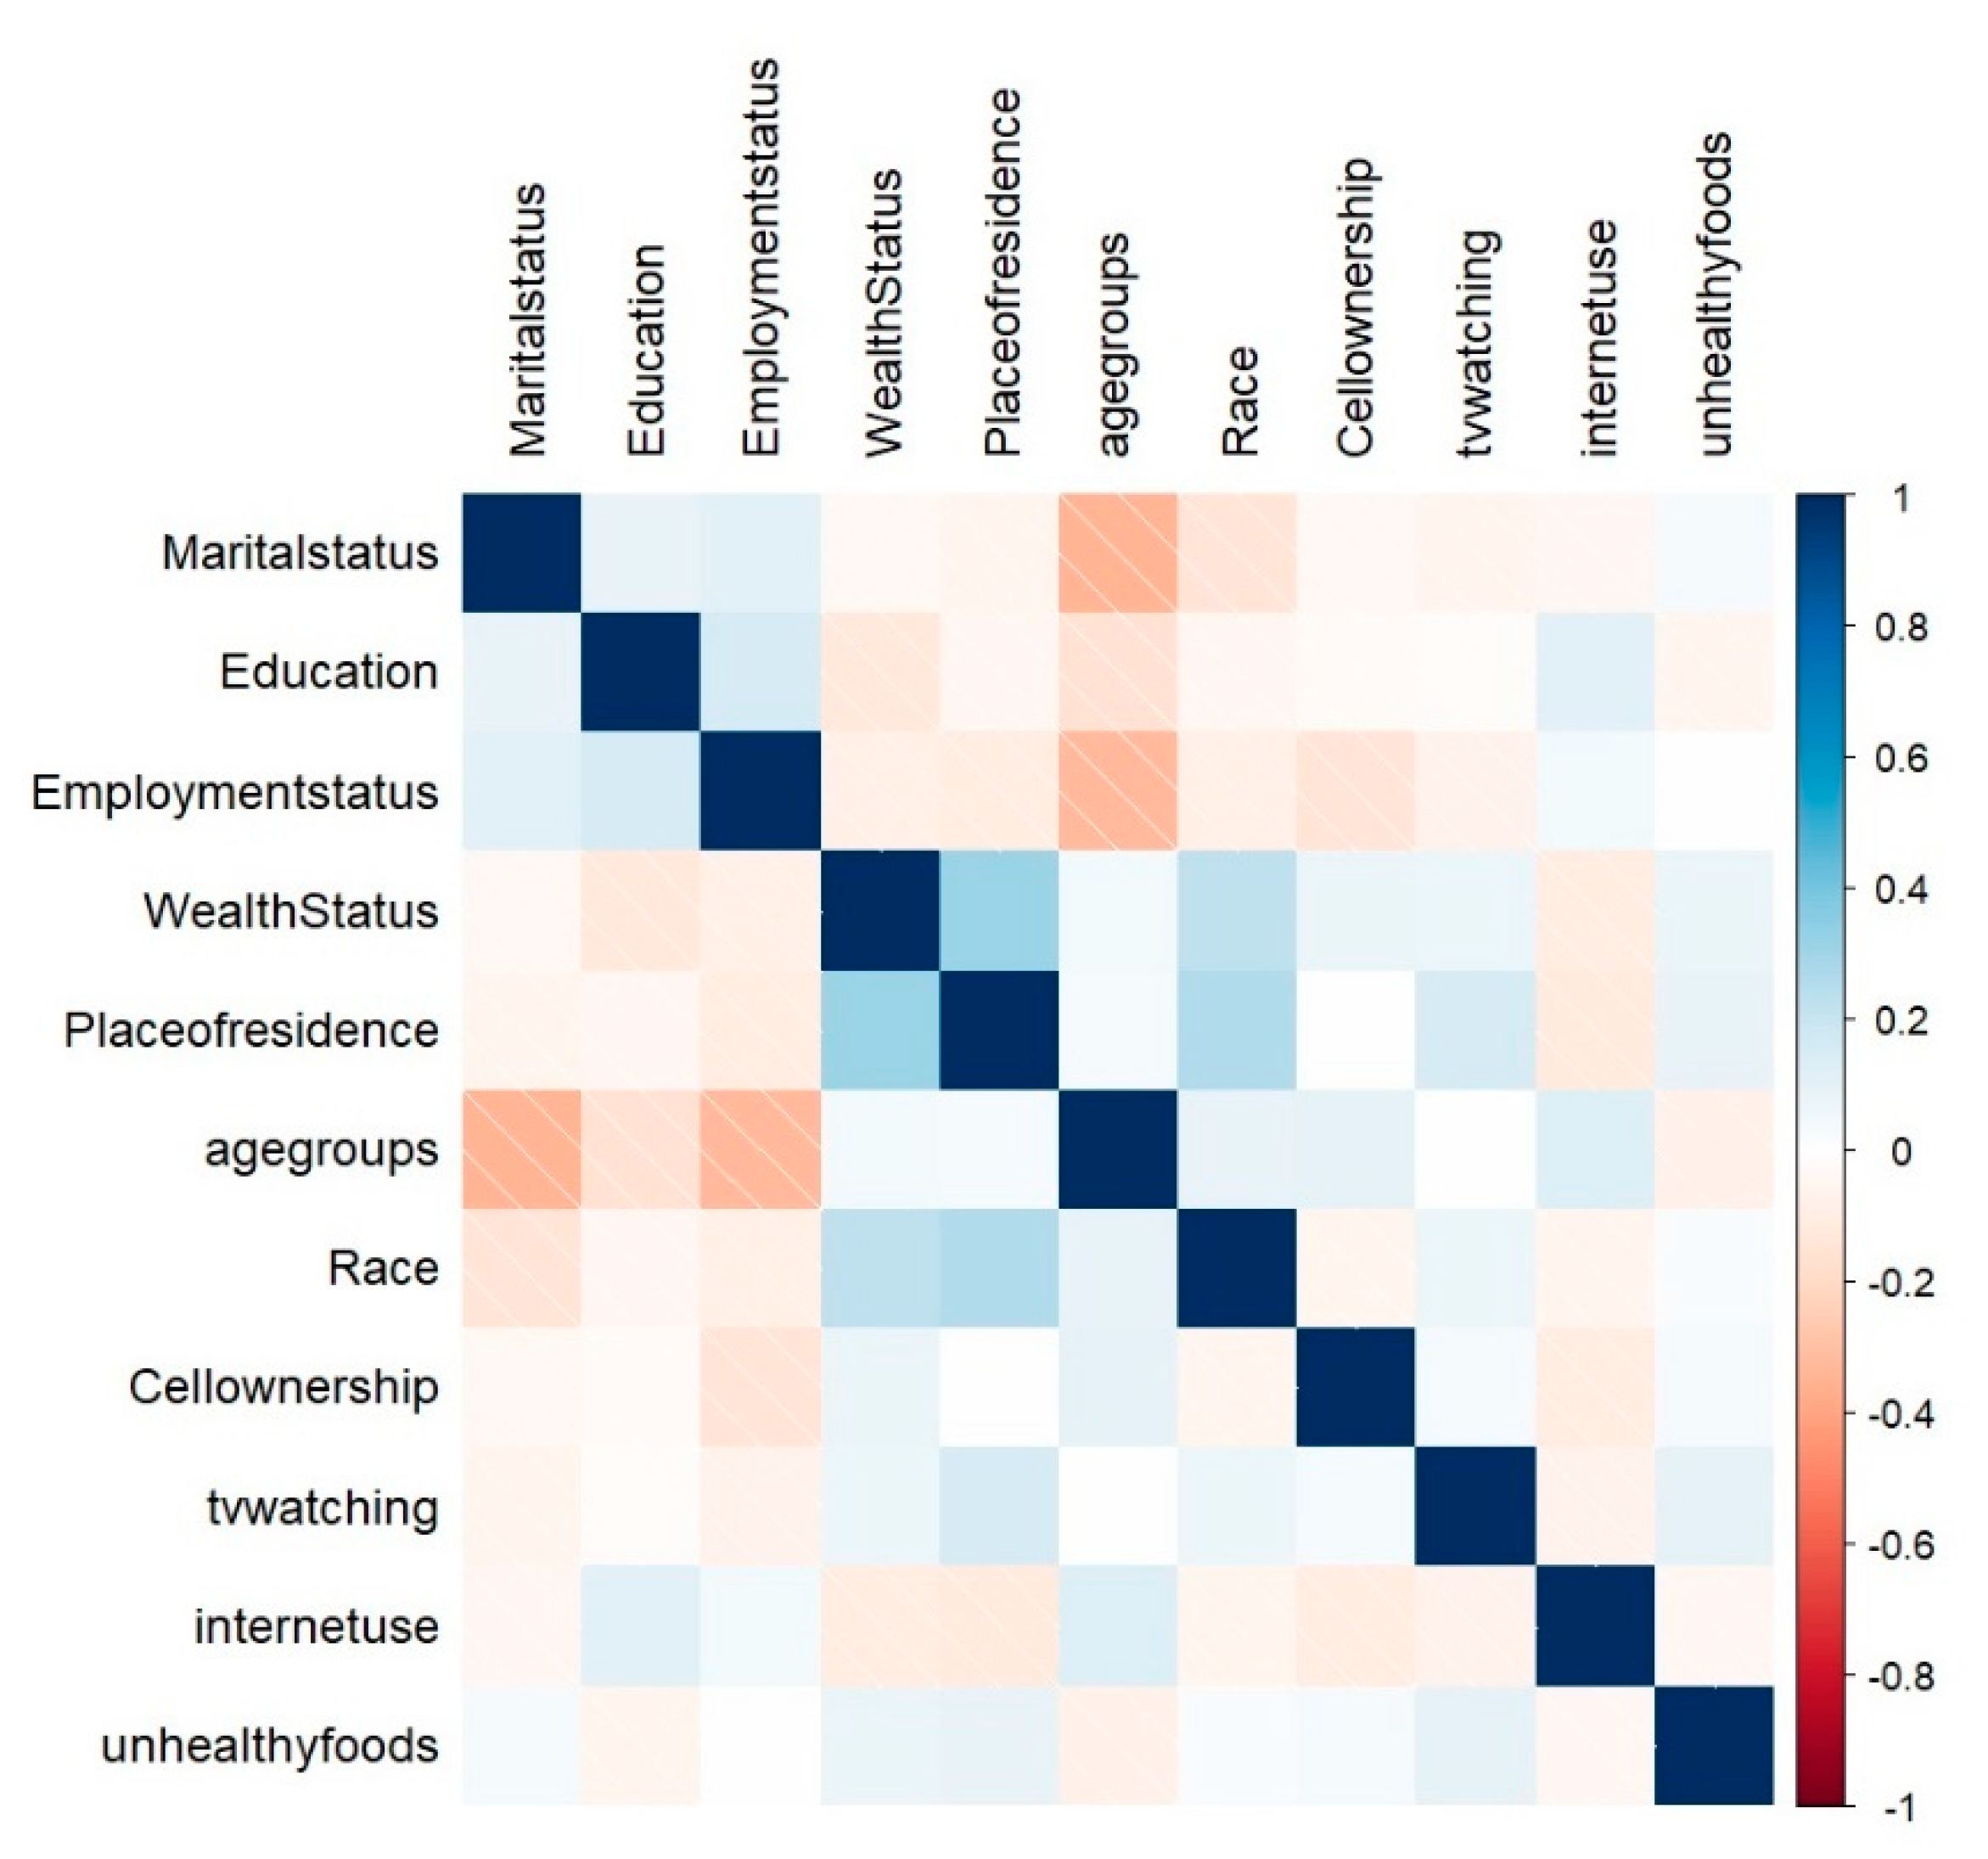
2. Results
2.1. BMI Differential Prevalence, Socio-Demographic, Consumer Electronics Ownership, and Behavioural Characteristics
2.1.1. Statistical Analysis
2.1.2. Multinomial Logistic Regression
3. Discussion
4. Methods
4.1. Data Source and Design
4.2. Study Population
4.3. Setting
5. Conclusions
6. Limitations and Strength
Author Contributions
Funding
Institutional Review Board Statement
Informed Consent Statement
Data Availability Statement
Conflicts of Interest
References
- Kyomuhendo, C.; Adeola, R. Green and grey: Nutritional lifestyle and healthful ageing in rural and urban areas of three sub-Saharan African countries. Bus. Strategy Dev. 2021, 4, 22–33. [Google Scholar] [CrossRef]
- Abarca-Gómez, L.; Abdeen, Z.A.; Hamid, Z.A.; Abu-Rmeileh, N.M.; Acosta-Cazares, B.; Acuin, C.; Adams, R.J.; Aekplakorn, W.; Afsana, K.; Aguilar-Salinas, C.A.; et al. Worldwide trends in body-mass index, underweight, overweight, and obesity from 1975 to 2016: A pooled analysis of 2416 population-based measurement studies in 1289 million children, adolescents, and adults. Lancet 2017, 390, 2627–2642. [Google Scholar] [CrossRef] [Green Version]
- Basu, J.K.; Jeketera, C.M.; Basu, D. Obesity and its outcomes among pregnant South African women. Int. J. Gynecol. Obstet. 2010, 110, 101–104. [Google Scholar] [CrossRef]
- Pisa, P.T.; Pisa, N.M. Economic growth and obesity in South African adults: An ecological analysis between 1994 and 2014. Eur. J. Public Health 2016, 27, 404–409. [Google Scholar] [CrossRef] [Green Version]
- Wandai, M.E.; Aagaard-Hansen, J.; Manda, S.O.; Norris, S.A. Transitions between body mass index categories, South Africa. Bull. World Health Organ 2020, 98, 878–885I. [Google Scholar] [CrossRef]
- Akokuwebe, M.E.; Idemudia, E.S. Multilevel Analysis of Urban–Rural Variations of Body Weights and Individual-Level Factors among Women of Childbearing Age in Nigeria and South Africa: A Cross-Sectional Survey. Int. J. Environ. Res. Public Health 2021, 19, 125. [Google Scholar] [CrossRef] [PubMed]
- Syed, N.K.; Syed, M.H.; Meraya, A.M.; Albarraq, A.A.; Al-Kasim, M.A.; Alqahtani, S.; Makeen, H.A.; Yasmeen, A.; Banji, O.J.F.; Elnaem, M.H. The association of dietary behaviors and practices with overweight and obesity parameters among Saudi university students. PLoS ONE 2020, 15, e0238458. [Google Scholar] [CrossRef]
- Narciso, J.; Silva, A.J.; Rodrigues, V.; Monteiro, M.J.; Almeida, A.; Saavedra, R.; Costa, A.M. Behavioral, contextual and biological factors associated with obesity during adolescence: A systematic review. PLoS ONE 2019, 14, e0214941. [Google Scholar] [CrossRef]
- Micklesfield, L.K.; Kagura, J.; Munthali, R.; Crowther, N.J.; Jaff, N.; Gradidge, P.; Ramsay, M.; Norris, S.A. Demographic, socio-economic and behavioural correlates of BMI in middle-aged black men and women from urban Johannesburg, South Africa. Glob. Health Action 2018, 11, 1448250. [Google Scholar] [CrossRef] [Green Version]
- Peer, N.; Ganie, Y.N. A weighty matter: Identification and management of overweight and obesity in adolescents. S. Afr. Med. J. 2016, 106, 662–665. [Google Scholar] [CrossRef] [Green Version]
- Sun, C.; Pomer, A.; Dancause, K.N.; Chan, C.W.; Olszowy, K.M.; Silverman, H.; Lee, G.; Tarivonda, L.; Taleo, G.; Regenvanu, R.; et al. Ownership of consumer electronics is associated with measures of adiposity during health transition in Vanuatu. Am. J. Hum. Biol. 2017, 29, e22928. [Google Scholar] [CrossRef] [PubMed]
- Higgins, V.; Nazroo, J.; Brown, M. Pathways to ethnic differences in obesity: The role of migration, culture and socio-economic position in the UK. SSM—Popul. Health 2019, 7, 100394. [Google Scholar] [CrossRef]
- Barkley, J.E.; Lepp, A.; Salehi-Esfahani, S. College Students’ Mobile Telephone Use Is Positively Associated With Sedentary Behavior. Am. J. Lifestyle Med. 2016, 10, 437–441. [Google Scholar] [CrossRef]
- Fennell, C.; Barkley, J.E.; Lepp, A. The relationship between cell phone use, physical activity, and sedentary behavior in adults aged 18–80. Comput. Hum. Behav. 2019, 90, 53–59. [Google Scholar] [CrossRef]
- Hu, F.B.; Li, T.Y.; Colditz, G.A.; Willett, W.C.; Manson, J.E. Television Watching and Other Sedentary Behaviors in Relation to Risk of Obesity and Type 2 Diabetes Mellitus in Women. JAMA 2003, 289, 1785–1791. [Google Scholar] [CrossRef] [Green Version]
- Ghose, B. Frequency of TV viewing and prevalence of overweight and obesity among adult women in Bangladesh: A cross-sectional study. BMJ Open 2017, 7, e014399. [Google Scholar] [CrossRef]
- Jeffery, R.W.; French, S.A. Epidemic obesity in the United States: Are fast foods and television viewing contributing? Am. J. Public Health 2011, 88, 277–280. [Google Scholar] [CrossRef] [Green Version]
- ICASA ICA of SA. The State of the ICT Sector Report in South Africa; ICASA: Centurion, South Africa, 2020; p. 115. [Google Scholar]
- DOC & DCDT D of C and DT. Official Guide to South Africa 2018/2019 Communications. 2020. Available online: https://www.gcis.gov.za/sites/default/files/docs/resourcecentre/pocketguide/2012/07-Communications-2018-19%28print%29%20.pdf (accessed on 9 December 2022).
- Kemp, S. Digital 2022: South Africa—DataReportal—Global Digital Insights. 2022. Available online: https://datareportal.com/reports/digital-2022-south-africa (accessed on 9 December 2022).
- Rothman, K.J. BMI-related errors in the measurement of obesity. Int. J. Obes. 2008, 32, S56–S59. [Google Scholar] [CrossRef] [Green Version]
- WHO. World Health Organization: Obesity and Overweight. 2017. Available online: https://scholar.google.com/scholar_lookup?title=Obesity%20and%20Overweight%20Fact%20sheet&publication_year=2017 (accessed on 5 April 2022).
- World Obesity. Obesity Classification. World Obesity Federation. 2022. Available online: https://www.worldobesity.org/about/about-obesity/obesity-classification (accessed on 11 December 2022).
- Keetile, M.; Navaneetham, K.; Letamo, G.; Bainame, K.; Rakgoasi, S.D.; Gabaitiri, L.; Masupe, T.; Molebatsi, R. Socioeconomic and behavioural determinants of overweight/obesity among adults in Botswana: A cross-sectional study. BMJ Open 2019, 9, e029570. [Google Scholar]
- Moise, I.K.; Kangmennaang, J.; Halwiindi, H.; Grigsby-Toussaint Diana, S.; Fuller Douglas, O. Increase in Obesity Among Women of Reproductive Age in Zambia, 2002–2014. J. Women’s Health 2019, 28, 1679–1687. Available online: https://www.liebertpub.com/doi/abs/10.1089/jwh.2018.7577 (accessed on 11 December 2022). [CrossRef]
- Adeloye, D.; Ige-Elegbede, J.O.; Ezejimofor, M.; Owolabi, E.O.; Ezeigwe, N.; Omoyele, C.; Mpazanje, R.G.; Dewan, M.T.; Agogo, E.; Gadanya, M.A.; et al. Estimating the prevalence of overweight and obesity in Nigeria in 2020: A systematic review and meta-analysis. Ann. Med. 2021, 53, 495–507. [Google Scholar] [CrossRef]
- Galvin, A.E.; Friedman, D.B.; Hébert, J.R. Focus on disability-free life expectancy: Implications for health-related quality of life. Qual. Life Res. 2021, 30, 2187–2195. [Google Scholar] [CrossRef]
- Saaka, M.; Mutaru, S.; Osman, S.M. Determinants of dietary diversity and its relationship with the nutritional status of pregnant women. J. Nutr. Sci. 2021, 10, e14. [Google Scholar] [CrossRef]
- Dancause, K.N.; Vilar, M.; Wilson, M.; Soloway, L.E.; Dehuff, C.; Chan, C.; Tarivonda, L.; Regenvanu, R.; Kaneko, A.; Lum, J.K.; et al. Behavioral risk factors for obesity during health transition in Vanuatu, South Pacific. Obesity 2013, 21, E98–E104. [Google Scholar] [CrossRef] [Green Version]
- Lajunen, H.R.; Keski-Rahkonen, A.; Pulkkinen, L.; Rose, R.J.; Rissanen, A.; Kaprio, J. Are computer and cell phone use associated with body mass index and overweight? A population study among twin adolescents. BMC Public Health 2007, 7, 24. Available online: https://bmcpublichealth.biomedcentral.com/articles/10.1186/1471-2458-7-24 (accessed on 11 December 2022). [CrossRef] [Green Version]
- Lepp, A.; Barkley, J.E.; Sanders, G.J.; Rebold, M.; Gates, P. The relationship between cell phone use, physical and sedentary activity, and cardiorespiratory fitness in a sample of U.S. college students. Int. J. Behav. Nutr. Phys. Act. 2013, 10, 79. Available online: https://ijbnpa.biomedcentral.com/articles/10.1186/1479-5868-10-79 (accessed on 11 December 2022). [CrossRef] [Green Version]
- Yen, C.-F.; Hsiao, R.C.; Ko, C.-H.; Yen, J.-Y.; Huang, C.-F.; Liu, S.-C.; Wang, S.-Y.; Yen, C. The relationships between body mass index and television viewing, internet use and cellular phone use: The moderating effects of socio-demographic characteristics and exercise. Int. J. Eat. Disord. 2010, 43, 565–571. [Google Scholar] [CrossRef]
- Akombi, B.J.; Agho, K.E.; Hall, J.J.; Wali, N.; Renzaho, A.M.N.; Merom, D. Stunting, Wasting and Underweight in Sub-Saharan Africa: A Systematic Review. Int. J. Environ. Res. Public Health 2017, 14, 863. [Google Scholar] [CrossRef] [Green Version]
- Neupane, S.; Prakash, K.C.; Doku, D.T. Overweight and obesity among women: Analysis of demographic and health survey data from 32 Sub-Saharan African Countries. BMC Public Health 2016, 16, 30. [Google Scholar] [CrossRef] [Green Version]
- Maimela, E.; Alberts, M.; Bastiaens, H.; Fraeyman, J.; Meulemans, H.; Wens, J.; Van Geertruyden, J.P. Interventions for improving management of chronic non-communicable diseases in Dikgale, a rural area in Limpopo Province, South Africa. BMC Health Serv. Res. 2018, 18, 331. [Google Scholar] [CrossRef] [Green Version]
- Kibria, A.; Muhammed, G.; Swasey, K.; Hasan, M.Z.; Sharmeen, A.; Day, B. Prevalence and factors associated with underweight, overweight and obesity among women of reproductive age in India. Glob. Health Res. Policy 2019, 4, 24. [Google Scholar] [CrossRef] [PubMed] [Green Version]
- SADHS. Demographic and Health Survey 2016: Statistics South Africa. 2016. Available online: https://www.google.com/search?rlz=1C1GCEB_enZA830ZA888&ei=IQbFXpOUHZTixgPN2o3wBw&q=SADHS%2C+2016.+Demographic+and+Health+Survey+2016%3A+Statistics+South+Africa.&oq=SADHS%2C+2016.+Demographic+and+Health+Survey+2016%3A+Statistics+South+Africa.&gs_lcp=CgZwc3ktYWIQDDoECAAQR1DftZgBWN-1mAFgkNOYAWgAcAN4AIAB_gGIAf4BkgEDMi0xmAEAoAECoAEBqgEHZ3dzLXdpeg&sclient=psy-ab&ved=0ahUKEwjTqLHGncLpAhUUsXEKHU1tA34Q4dUDCAw (accessed on 20 May 2020).


| Variable | Normal Weight, N = 1195 (35.53%) | Pre-Obese, N = 1159 (34.46%) | Obese, N = 913 (27.15%) | Underweight, N = 96 (2.9%) | p 1 |
|---|---|---|---|---|---|
| Marital Status | <0.001 | ||||
| Married | 269 (23%) | 493 (43%) | 302 (33%) | 10 (10%) | |
| Unmarried | 926 (77%) | 666 (57%) | 611 (67%) | 86 (90%) | |
| Education | |||||
| None | 28 (2.3%) | 33 (2.8%) | 16 (1.8%) | 2 (2.1%) | |
| Higher | 82 (6.9%) | 131 (11%) | 87 (9.5%) | 8 (8.3%) | |
| Primary | 144 (12%) | 120 (10%) | 93 (10%) | 9 (9.4%) | |
| Secondary | 941 (79%) | 875 (75%) | 717 (79%) | 77 (80%) | |
| Employment Status | <0.001 | ||||
| Employed | 237 (20%) | 459 (40%) | 294 (32%) | 17 (18%) | |
| Unemployed | 958 (80%) | 700 (60%) | 619 (68%) | 79 (82%) | |
| Wealth Status | <0.001 | ||||
| Rich | 325 (27%) | 449 (39%) | 281 (31%) | 26 (27%) | |
| Middle Income | 273 (23%) | 294 (25%) | 234 (26%) | 26 (27%) | |
| Poor | 597 (50%) | 416 (36%) | 398 (44%) | 44 (46%) | |
| Place of Residence | 0.052 | ||||
| Rural | 576 (48%) | 505 (44%) | 429 (47%) | 52 (54%) | |
| Urban | 619 (52%) | 654 (56%) | 484 (53%) | 44 (46%) | |
| Age Groups | <0.001 | ||||
| 15–19 | 367 (31%) | 60 (5.2%) | 108 (12%) | 42 (44%) | |
| 20–24 | 257 (22%) | 111 (9.6%) | 180 (20%) | 17 (18%) | |
| 25–29 | 205 (17%) | 183 (16%) | 178 (19%) | 13 (14%) | |
| 30–34 | 129 (11%) | 207 (18%) | 144 (16%) | 8 (8.3%) | |
| 35–39 | 96 (8.0%) | 209 (18%) | 107 (12%) | 9 (9.4%) | |
| 40–44 | 86 (7.2%) | 193 (17%) | 96 (11%) | 3 (3.1%) | |
| 45–59 | 55 (4.6%) | 196 (17%) | 100 (11%) | 4 (4.2%) | |
| Race | |||||
| Other | 27 (2.3%) | 38 (3.3%) | 23 (2.5%) | 1 (1.0%) | |
| African | 1073 (90%) | 1028 (89%) | 827 (91%) | 77 (80%) | |
| Coloured | 95 (7.9%) | 93 (8.0%) | 63 (6.9%) | 18 (19%) | |
| Unhealthy Foods | |||||
| Daily | 28 (2.3%) | 30 (2.6%) | 22 (2.4%) | 2 (2.1%) | |
| Never | 87 (7.3%) | 83 (7.2%) | 57 (6.2%) | 10 (10%) | |
| Occasionally | 869 (73%) | 816 (70%) | 640 (70%) | 71 (74%) | |
| Once a Week | 211 (18%) | 230 (20%) | 194 (21%) | 13 (14%) | |
| Cell ownership | 1019 (85%) | 1105 (95%) | 836 (92%) | 68 (71%) | <0.001 |
| Frequency of TV Watching | <0.001 | ||||
| Less than Once a week | 111 (9.3%) | 107 (9.2%) | 78 (8.5%) | 9 (9.4%) | |
| Not at all | 298 (25%) | 177 (15%) | 192 (21%) | 22 (23%) | |
| Once a week | 786 (66%) | 875 (75%) | 643 (70%) | 65 (68%) | |
| Internetuse | |||||
| <once a week | 56 (4.7%) | 40 (3.5%) | 43 (4.7%) | 11 (11%) | |
| Almost daily | 319 (27%) | 300 (26%) | 244 (27%) | 24 (25%) | |
| Not at all | 696 (58%) | 709 (61%) | 542 (59%) | 54 (56%) | |
| Once a week | 124 (10%) | 110 (9.5%) | 84 (9.2%) | 7 (7.3%) |
| Variable | Pre-Obese | Obese | Underweight | ||||||
|---|---|---|---|---|---|---|---|---|---|
| AOR | 95% CI | p-Value | AOR | 95% CI | p-Value | AOR | 95% CI | p-Value | |
| Marital Status | |||||||||
| Married | — | — | — | — | — | — | |||
| Unmarried | 0.72 | 0.59, 0.89 | 0.002 *** | 0.81 | 0.65, 1.01 | 0.056 | 2.42 | 1.17, 5.01 | 0.017 *** |
| Education | |||||||||
| None | — | — | — | — | — | — | |||
| Higher | 1.29 | 0.67, 2.47 | 0.4 | 1.89 | 0.90, 3.95 | 0.091 | 1.79 | 0.30, 10.6 | 0.5 |
| Primary | 1.01 | 0.56, 1.85 | >0.9 | 1.48 | 0.74, 2.94 | 0.3 | 0.79 | 0.15, 4.24 | 0.8 |
| Secondary | 1.41 | 0.80, 2.49 | 0.2 | 2.02 | 1.05, 3.90 | 0.036 *** | 1.05 | 0.21, 5.13 | >0.9 |
| Employment Status | |||||||||
| Employed | — | — | — | — | — | — | |||
| Unemployed | 0.80 | 0.65, 0.99 | 0.043 *** | 0.78 | 0.63, 0.98 | 0.029 *** | 0.90 | 0.49, 1.67 | 0.7 |
| Wealth Status | |||||||||
| Rich | — | — | — | — | — | — | |||
| Middle Income | 0.78 | 0.60, 1.01 | 0.060 | 0.96 | 0.73, 1.25 | 0.8 | 1.04 | 0.55, 1.98 | 0.9 |
| Poor | 0.54 | 0.40, 0.71 | <0.001 *** | 0.77 | 0.58, 1.03 | 0.078 | 0.77 | 0.37, 1.59 | 0.5 |
| Place of Residence | |||||||||
| Rural | — | — | — | — | — | — | |||
| Urban | 0.80 | 0.65, 1.00 | 0.048 *** | 0.87 | 0.70, 1.07 | 0.2 | 0.53 | 0.31, 0.92 | 0.023 *** |
| Age Groups | <0.001 *** | <0.001 *** | |||||||
| 15–19 | — | — | — | — | — | — | |||
| 20–24 | 2.33 | 1.62, 3.34 | 2.20 | 1.63, 2.96 | 0.69 | 0.37, 1.28 | 0.2 | ||
| 25–29 | 4.61 | 3.21, 6.60 | 2.63 | 1.92, 3.60 | 0.72 | 0.36, 1.47 | 0.4 | ||
| 30–34 | 7.77 | 5.29, 11.4 | 3.27 | 2.29, 4.65 | 0.76 | 0.32, 1.81 | 0.5 | ||
| 35–39 | 11.5 | 7.70, 17.2 | 3.50 | 2.38, 5.13 | 1.05 | 0.45, 2.46 | >0.9 | ||
| 40–44 | 12.1 | 7.96, 18.3 | 3.58 | 2.39, 5.36 | 0.43 | 0.12, 1.58 | 0.2 | ||
| 45–49 | 20.2 | 12.8, 31.9 | 6.23 | 4.01, 9.67 | 0.84 | 0.26, 2.76 | 0.8 | ||
| Race | |||||||||
| Other | — | — | — | — | — | — | |||
| African | 1.73 | 0.98, 3.04 | 0.059 | 1.50 | 0.82, 2.76 | 0.2 | 1.17 | 0.15, 9.35 | 0.9 |
| Coloured | 1.27 | 0.67, 2.39 | 0.5 | 1.11 | 0.56, 2.18 | 0.8 | 3.83 | 0.47, 31.5 | 0.2 |
| Unhealthy Food | |||||||||
| Daily | — | — | — | — | |||||
| Never | 0.71 | 0.37, 1.38 | 0.3 | — | — | 1.59 | 0.32, 7.98 | 0.6 | |
| Occasionally | 0.83 | 0.46, 1.47 | 0.5 | 0.74 | 0.37, 1.45 | 0.4 | 1.05 | 0.24, 4.58 | >0.9 |
| Once a Week | 1.01 | 0.55, 1.85 | >0.9 | 0.92 | 0.51, 1.66 | 0.8 | 0.74 | 0.16, 3.52 | 0.7 |
| Cell Ownership | 1.19 | 0.65, 2.19 | 0.6 | ||||||
| No | — | — | — | — | |||||
| Yes | 2.35 | 1.64, 3.36 | <0.001 *** | — | — | 0.45 | 0.26, 0.77 | 0.004 *** | |
| TV Watching | 1.34 | 0.98, 1.83 | 0.066 | ||||||
| Less than Once a week | — | — | — | — | |||||
| Not at all | 0.80 | 0.55, 1.14 | 0.2 | — | — | 0.90 | 0.39, 2.10 | 0.8 | |
| Once a week | 1.07 | 0.78, 1.46 | 0.7 | 1.07 | 0.74, 1.54 | 0.7 | 0.93 | 0.44, 1.95 | 0.8 |
| Internet use | 1.12 | 0.81, 1.54 | 0.5 | ||||||
| <once a week | — | — | — | — | |||||
| Almost daily | 0.92 | 0.57, 1.49 | 0.7 | — | — | 0.45 | 0.20, 1.01 | 0.054 *** | |
| Not at all | 0.93 | 0.58, 1.49 | 0.7 | 0.78 | 0.49, 1.22 | 0.3 | 0.40 | 0.18, 0.87 | 0.020 *** |
Disclaimer/Publisher’s Note: The statements, opinions and data contained in all publications are solely those of the individual author(s) and contributor(s) and not of MDPI and/or the editor(s). MDPI and/or the editor(s) disclaim responsibility for any injury to people or property resulting from any ideas, methods, instructions or products referred to in the content. |
© 2023 by the authors. Licensee MDPI, Basel, Switzerland. This article is an open access article distributed under the terms and conditions of the Creative Commons Attribution (CC BY) license (https://creativecommons.org/licenses/by/4.0/).
Share and Cite
Banda, L.; Oladimeji, O. Correlation of Socio-Economic Factors, Diet, and Ownership of Consumer Electronics with Body Mass Index in Women of Childbearing Age: Insights from the 2016 South African Demographic Health Survey. Women 2023, 3, 163-174. https://doi.org/10.3390/women3010013
Banda L, Oladimeji O. Correlation of Socio-Economic Factors, Diet, and Ownership of Consumer Electronics with Body Mass Index in Women of Childbearing Age: Insights from the 2016 South African Demographic Health Survey. Women. 2023; 3(1):163-174. https://doi.org/10.3390/women3010013
Chicago/Turabian StyleBanda, Lucas, and Olanrewaju Oladimeji. 2023. "Correlation of Socio-Economic Factors, Diet, and Ownership of Consumer Electronics with Body Mass Index in Women of Childbearing Age: Insights from the 2016 South African Demographic Health Survey" Women 3, no. 1: 163-174. https://doi.org/10.3390/women3010013