
Respiratory Muscle Strength in Brazilian Adolescents: Impact of Body Composition
 ,
,  , , , , , , and
Abstract
:1. Introduction
2. Materials and Methods
2.1. Trial Design, Setting and Ethics
2.2. Sample Size
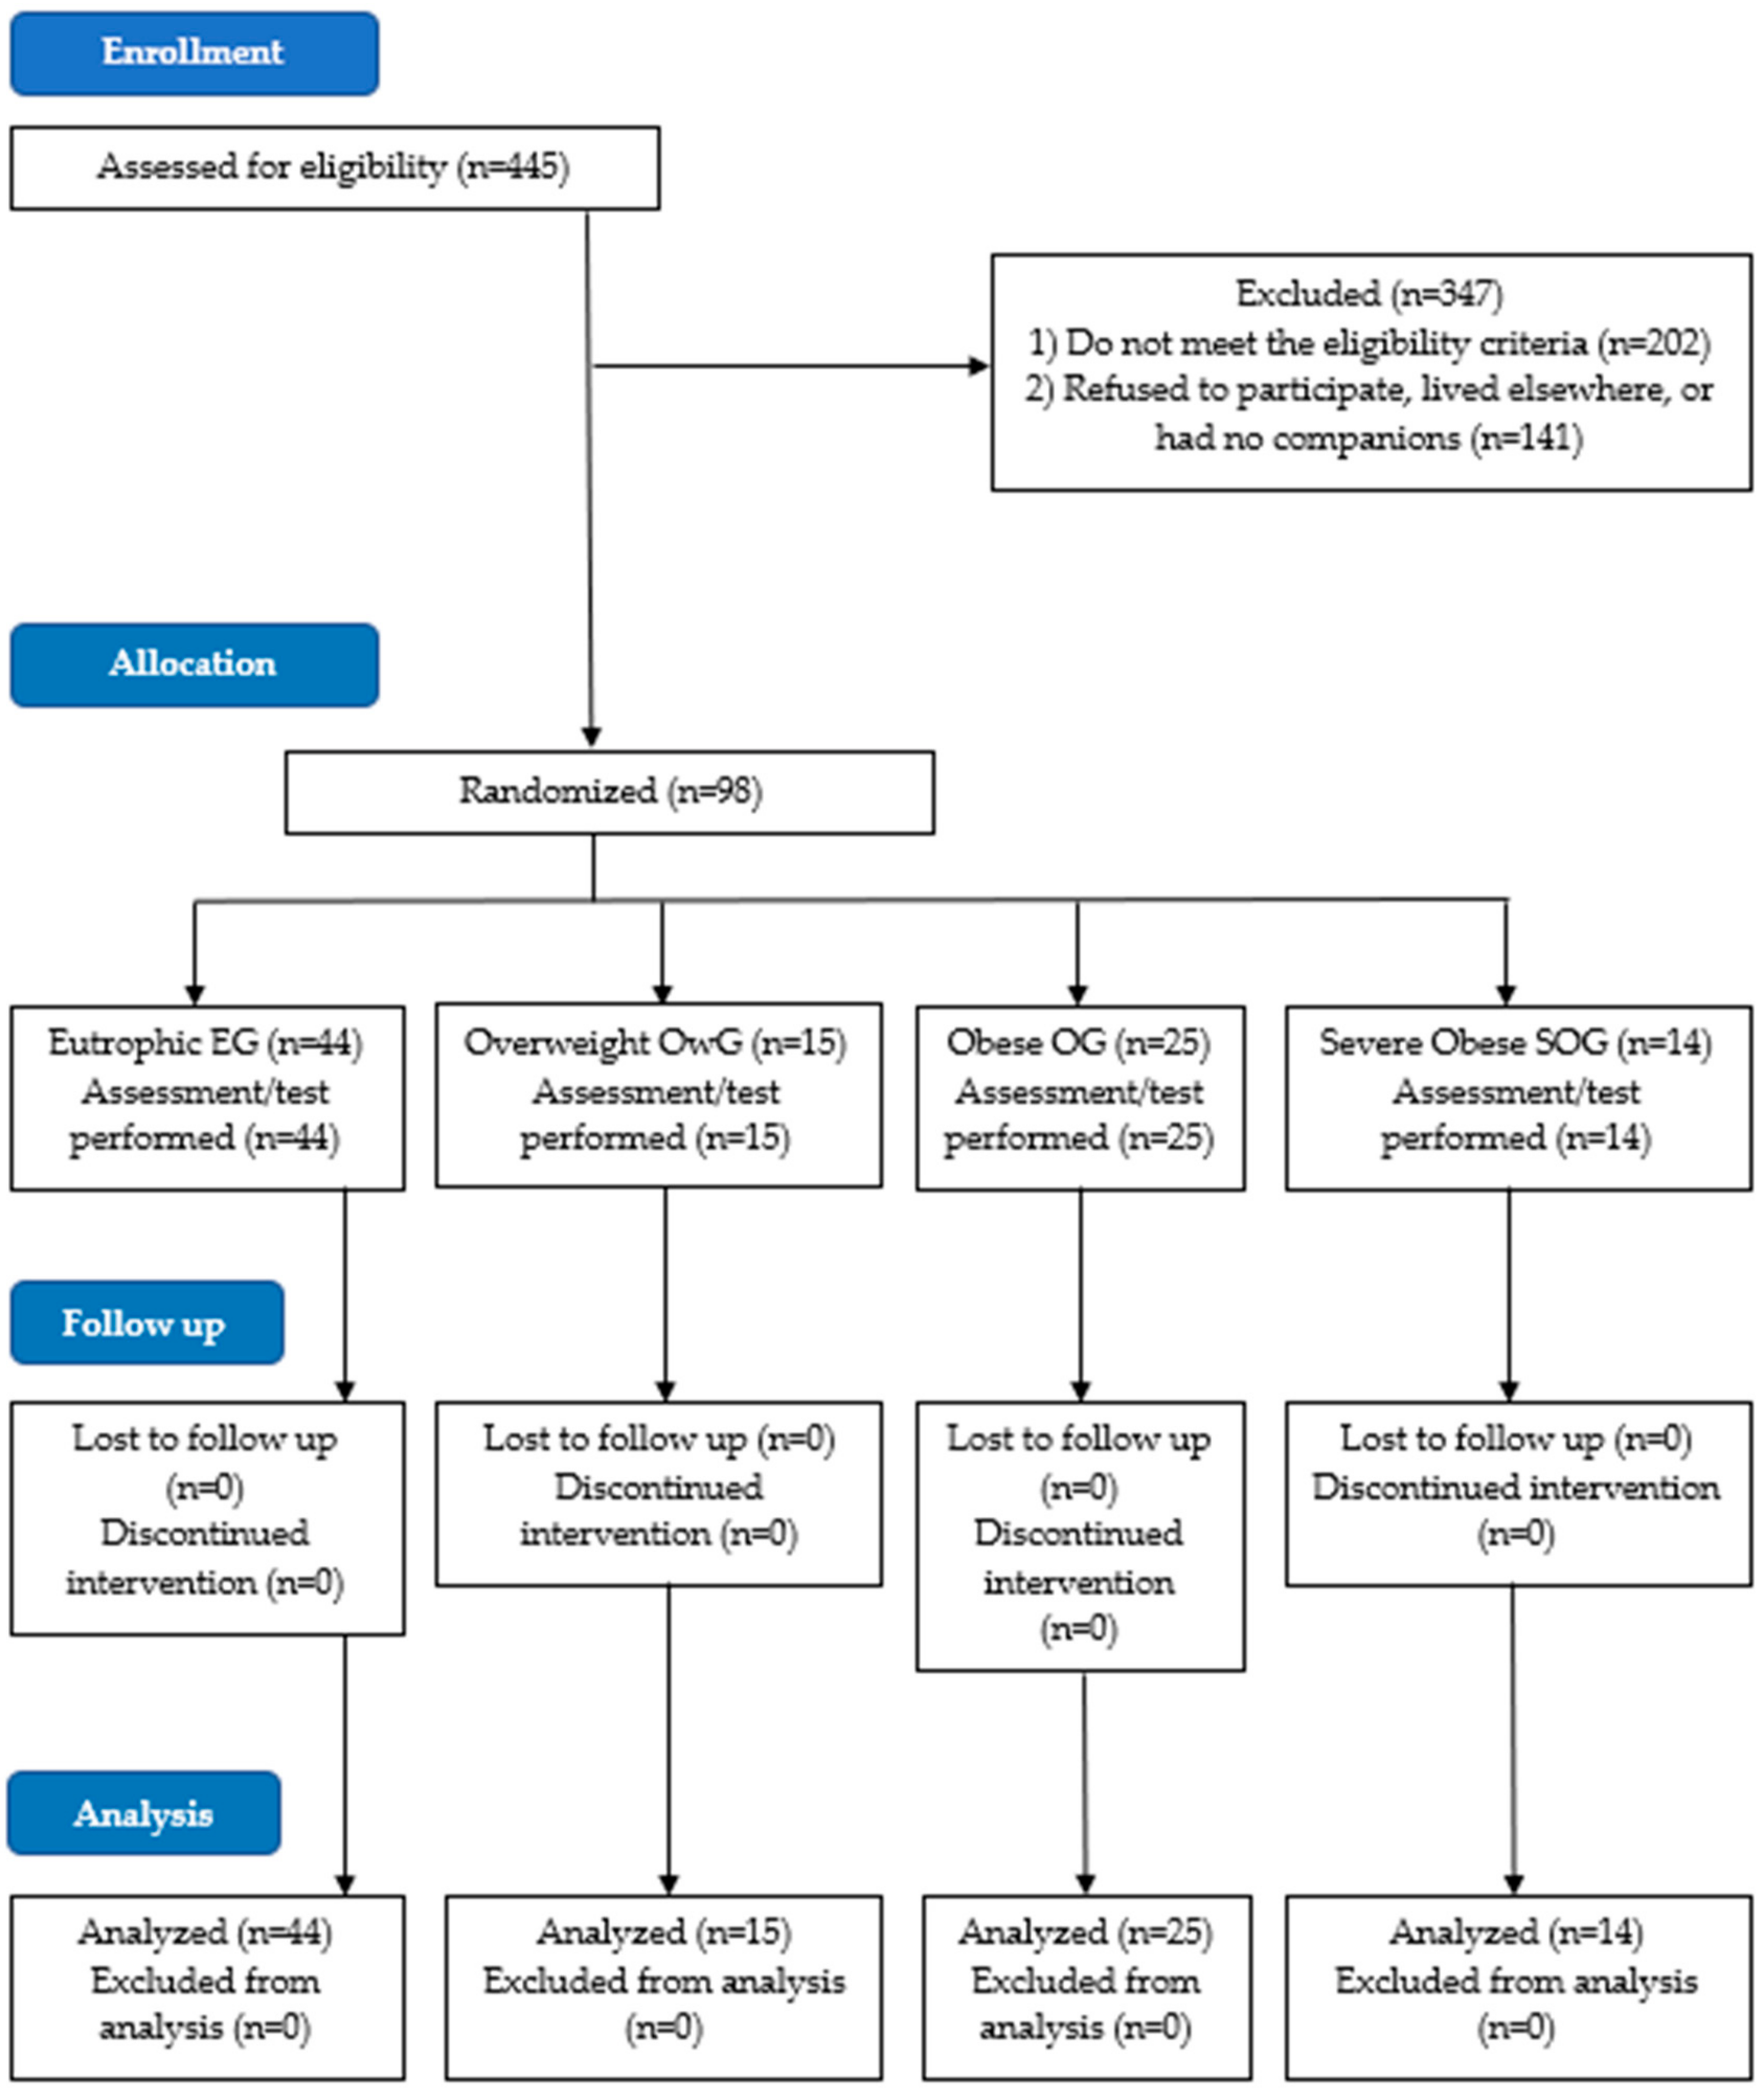
2.3. Participants
2.4. Anthropometric Assessment
2.5. Assessment of the Level of Physical Activity
- Very active: all those who practiced in vigorous activity ≥3 days a week and ≥20 min per session plus moderate activity and/or walking ≥5 days a week and ≥30 min per session;
- Active: those who performed an activity ≥5 days a week and ≥150 min a week (walking plus moderate activity plus vigorous activity).
- Irregularly active: those who performed physical activity but not enough to be classified as active, as did not comply with the frequency or duration of exercise in different types of activities (walking plus moderate activity plus vigorous activity).
- Sedentary: those who did not perform any physical activity for at least 10 min continuously during a week.
2.6. Maximum Respiratory Pressures
2.7. Statistical Analysis
3. Results
4. Discussion
4.1. Contributions to Practice
4.2. Study Limitations
5. Conclusions
Author Contributions
Funding
Institutional Review Board Statement
Informed Consent Statement
Data Availability Statement
Acknowledgments
Conflicts of Interest
References
- Costa, M.J.M.; Araújo, M.L.L.M.; Araújo, M.A.M.; Moreira-Araújo, R.S.R. Overweight and obesity in preschool children and physical activity. Rev. Bras. Ciênc. Mov. 2015, 23, 70–80. Available online: https://portalrevistas.ucb.br/index.php/rbcm/article/view/5147 (accessed on 20 February 2020).
- Hinkle, J.L.; Cheever, K.H. Brunner & Suddarth: Treaty of Medical-Surgical Nursing, 13th ed.; Guanabara Koogan: Rio de Janeiro, Brazil, 2016; ISBN 9781451146660. [Google Scholar]
- NCD Risk Factor Collaboration. Worldwide trends in body-mass index, underweight, overweight and obesity from 1975 to 2016: A pooled analysis of 2416 population-based measurement studies in 128-9 million children, adolescents, and adults. Lancet 2017, 390, 2627–2642. [Google Scholar] [CrossRef] [PubMed]
- Pazzianotto-Forti, E.M.; Peixoto-Souza, F.S.; Piconi-Mendes, C.; Rasera-Junior, I.; Barbalho-Moulim, M. Behavior of respiratory muscle strength in morbidly obese women by using different predictive equations. Braz. J. Phys. Ther. 2012, 16, 479–486. [Google Scholar] [CrossRef]
- Silva, C.F.D.; Burgos, M.S.; Silva, P.T.D.; Burgos, L.T.; Welser, L.; Sehn, A.P.; Horta, J.A.; Mello, E.D.D.; Reuter, C.P. Relationship between Cardiometabolic Parameters and Elevated Resting and Effort Heart Rate in Schoolchildren. Arq. Bras. Cardiol. 2017, 109, 191–198. [Google Scholar] [CrossRef]
- Tenório, L.H.; Santos, A.C.; Oliveira, A.S.; Lima, A.M.; Brasileiro-Santos, M.D. Obesity and pulmonary function tests in children and adolescents: A systematic review. Rev. Paul. Pediatr. 2012, 30, 423–430. Available online: https://www.scielo.br/j/rpp/a/J9KQXHRjcnQ4mcLTrshD7td/?lang=en&format=pdf (accessed on 20 February 2020). [CrossRef]
- Freitas, D.A.; Borja, R.O.; Gardênia, M.; Ferreira, A.P.; Nogueira, P.A.M.S.; Mendonça, K.M.P.P. Predictive equations and normal values for maximal respiratory pressures in childhood and adolescence. Rev. Paul. Pediatr. 2011, 29, 656–662. [Google Scholar] [CrossRef]
- Bessa, E.J.C.; Lopes, A.J.; Rufino, R. The importance of measurement of respiratory muscle strenght in pulmonology practice. Pulmão RJ 2015, 24, 37–41. Available online: https://pesquisa.bvsalud.org/portal/resource/pt/lil-764339 (accessed on 20 February 2020).
- Laranjeira, T.L.; Montebelo, M.I.L.; Ike, D.; Cancelliero, K.M.; Costa, D. Comparison between the obtained and predicted values of the respiratory muscle strength in a cohort of healthy adults of the São Paulo west region. Fisioter. Bras. 2010, 11, 21–27. Available online: https://pesquisa.bvsalud.org/portal/resource/pt/lil-789686 (accessed on 20 February 2020).
- Teixeira, V.D.S.S.; Fonseca, B.C.A.; Pereira, D.M.; Silva, B.A.K.; Reis, F.A. Avaliação do efeito da obesidade infantil e a do adolescente sobre as propriedades ventilométricas e força muscular do sistema respiratório. ConScientiae Saúde 2009, 8, 35–40. [Google Scholar] [CrossRef]
- Lanza, F.C.; de Moraes Santos, M.L.; Selman, J.P.R.; Silva, J.C.; Marcolin, N.; Santos, J.; Oliveira, C.M.; Dal Lago, P.; Dal Corso, S. Reference Equation for Respiratory Pressures in Pediatric Population: A Multicenter Study. PLoS ONE 2015, 10, e0135662. [Google Scholar] [CrossRef]
- Verma, R.; Chiang, J.; Qian, H.; Amin, R. Maximal Static Respiratory and Sniff Pressures in Healthy Children. A Systematic Review and Meta-Analysis. Ann. Am. Thorac. Soc. 2019, 16, 478–487. [Google Scholar] [CrossRef]
- Von Elm, E.; Altman, D.G.; Egger, M.; Pocock, S.J.; Gøtzsche, P.C.; Vandenbroucke, J.P. The Strengthening the Reporting of Observational Studies in Epidemiology (STROBE) statement: Guidelines for reporting observational studies. J. Clin. Epidemiol. 2008, 61, 344–349. [Google Scholar] [CrossRef]
- Lopes, N.B.; Conceição, P.P.; Couto, H.L.O.; Santos, T.M.S.; Cascapera, M.S.; Marquezi, M.L.; Bernardes, N.; Aparecido, J.M.L. Respiratory Mechanic in Adolescents with Different Nutritional Status. Revista Brasileira de Ciências da Saúde 2021, 25, 711–720. [Google Scholar]
- Santiago, S.Q.; Silva, M.L.P.; Davidson, J.; Aristóteles, L.R.C.R.B. Evaluation of respiratory muscle strength in overweight/obese children and adolescents. Rev. Paul. Pediatr. 2008, 26, 146–150. [Google Scholar] [CrossRef]
- Batista, F.C.S.; Bernardes, P.S.; Côrte, A.P.N.; Serpa, G.H.C.; Miranda, B.M.; Siqueira, G.D.J.; Venâncio, P.E.M.; Soares, V. Respiratory Muscle Strength in obese and non-obese adolescents. Rev. Mov. 2019, 12, 274–280. Available online: https://www.revista.ueg.br/index.php/movimenta/article/view/8221 (accessed on 2 May 2020).
- Onis, M.; Onyango, A.W.; Borghi, E.; Siyam, A.; Nishida, C.; Siekmann, J. Development of a WHO growth reference for school-aged children and adolescents. Bull. World Health Organ. 2007, 85, 660–667. [Google Scholar] [CrossRef]
- Amarante, A.A.A.; Sirino, F.; Minuzzi, L.G. Index of obesity, overweight and cardiovascular risk in schoolchildren aged 11 to 14 years in the city of Abelardo Luz (SC). Revista Mackenzie de Educação Física e Esporte 2011, 10, 128–139. Available online: http://editorarevistas.mackenzie.br/index.php/remef/article/view/2504 (accessed on 2 May 2020).
- Aparecido, J.M.L.; Marquezi, M.L.; Couto, H.L.O.; Santos, T.M.D.S.; Cruz, A.F.C.; Lopes, N.B.; Cascapera, M.S.; Xavier, V.B.; Kochi, C.; Alves, V.L.D.S.; et al. Six HIT Sessions Improve Cardiorespiratory Fitness and Metabolic Flexibility in Insulin Resistant and Insulin Sensitive Adolescents with Obesity. Int. J. Environ. Res. Public Health 2022, 19, 10568. [Google Scholar] [CrossRef]
- Manna, I. Growth Development and Maturity in Children and Adolescent: Relation to Sports and Physical Activity. Am. J. Sport. Sci. Med. 2014, 23, 48–50. Available online: http://pubs.sciepub.com/ajssm/2/5A/11/index.html (accessed on 15 June 2020). [CrossRef]
- Costa, R.F. Body Composition Assessment Theory and Practice; Manole: Barueri, Brazil, 2001; ISBN 9788520412695. [Google Scholar]
- Matsudo, S.; Araújo, T.; Matsudo, V.; Andrade, D.; Andrade, E.; Oliveira, L.C.; Braggion, G. International physical activity questionnaire (IPAQ): Study of validity and rehability in Brazil. Rev. Bras. Ativ. Física Saúde 2001, 6, 5–18. [Google Scholar]
- Costa, T.R.; Lima, T.P.; Gontijo, P.L.; Carvalho, H.A.D.; Cardoso, F.P.D.F.; Faria, O.P.; Cavalcanti Neto, F.F. Correlation of respiratory muscle strength with anthropometric variables of eutrophic and obese women. Revista da Associação Médica Brasileira 2010, 56, 403–408. [Google Scholar] [CrossRef] [PubMed]
- Souza, F.S.P.; Forti, E.M.P. Study of Lung Function and Respiratory Muscle Strength in Morbidly Obese Women. Master’s Dissertation, Methodist University of Piracicaba, Piracicaba, Brazil, 2012. Available online: http://iepapp.unimep.br/biblioteca_digital/visualiza.php?cod=Nzgy (accessed on 15 June 2020).
- Pessoa, I.M.B.S.; Pinheiro, D.A.; Falcão, M.A.D.; Araújo, P.F.; Martins, P.M.; Velloso, M. Brazilian equations: Inspiratory muscle force. Fisioter. Pesqui. 2021, 27, 356–361. Available online: https://www.scielo.br/j/fp/a/T7R43KTYWnnvXKSSfLCKKrq/?lang=en&format=pdf (accessed on 3 March 2022). [CrossRef]
- Oliveira, L.C.D.; Campos, T.F.; Borja, R.D.O.; Chaves, G.S.D.S.; Delgado, R.N.; Mendes, R.E.D.F.; Mendonça, K.M.P.P.D. Maximum peak and sustained respiratory pressures in the assessment of respiratory muscular strength in children. Rev. Bras. Saúde Matern. Infant. 2012, 12, 357–364. [Google Scholar] [CrossRef]
- Furtado, P.R.; Campos, T.F.; de França Mendes, R.E.; de Freitas, D.A.; da Silva Chaves, G.S.; de Macêdo, T.M.F.; de Mendonça, K.M.P.P. Respiratory muscle strength of brazilian adolescents: Obtained and predicted values. J. Hum. Growth Dev. 2014, 24, 163–167. Available online: http://pepsic.bvsalud.org/scielo.php?script=sci_arttext&pid=S0104-12822014000200008 (accessed on 5 March 2022). [CrossRef]
- Oliveira, C.M.G.; Lanza, F.C.; Solé, D. Respiratory muscle strength in children and adolescents with asthma: Similar to that of healthy subjects? J. Bras. Pneumol. 2012, 38, 308–314. [Google Scholar] [CrossRef]
- Barreto, L.M.; Duarte, M.A.; Moura, S.C.D.O.; Alexandre, B.L.; Augusto, L.S.; Fontes, M.J.F. Comparison of measured and predicted values for maximum respiratory pressures in healthy students. Fisioter. Pesqui. 2013, 20, 235–243. [Google Scholar] [CrossRef]


| Variable | EG (n = 44) | OwG (n = 15) | OG (n = 25) | SOG (n = 14) |
|---|---|---|---|---|
| Age (years) b | 13.0 (12.0–14.0) | 13.0 (13.0–14.0) | 13.0 (12.0–13.0) | 12.5 (12.0–15.0) |
| Weight (kg) a | 46.2 ± 8.67 | 53.5 ± 8.95 | 68.2 ± 9.90 *≠ | 74.5 ± 13.9 *≠ |
| Height (m) a | 1.6 ± 0.0936 | 1.6 ± 0.0523 | 1.6 ± 0.0551 | 1.6 ± 0.0838 |
| pBF (%) a | 20.6 ± 5.47 | 26.0 ± 2.56 * | 31.3 ± 2.69 *≠ | 38.0 ± 2.73 *≠¥ |
| FM b | 8.8 (6.75–12.1) | 13.9 (12.5–15.7) * | 19.5 (17.8–23.9) *≠ | 29.8 (25.6–39.9) *≠¥ |
| LM a | 36.1 ± 8.46 | 39.7 ± 7.20 | 44.5 ± 7.66 * | 46.7 ± 8.77 * |
| BMR b | 1084 (967–1193) | 1151 (1076–1311) | 1370 (1221–1511) *≠ | 1460 (1281–1596) * |
| BMI (kg/m2) b | 18.3 (17.0–21.0) | 19.8 (19.2–22.7) * | 26.9 (24.4–28.2) *≠ | 29.2 (26.6–31.6) *≠ |
| Pressures (cm H2O) | EG (n = 44) b | OwG (n = 15) b | OG (n = 25) b | SOG (n = 14) b |
|---|---|---|---|---|
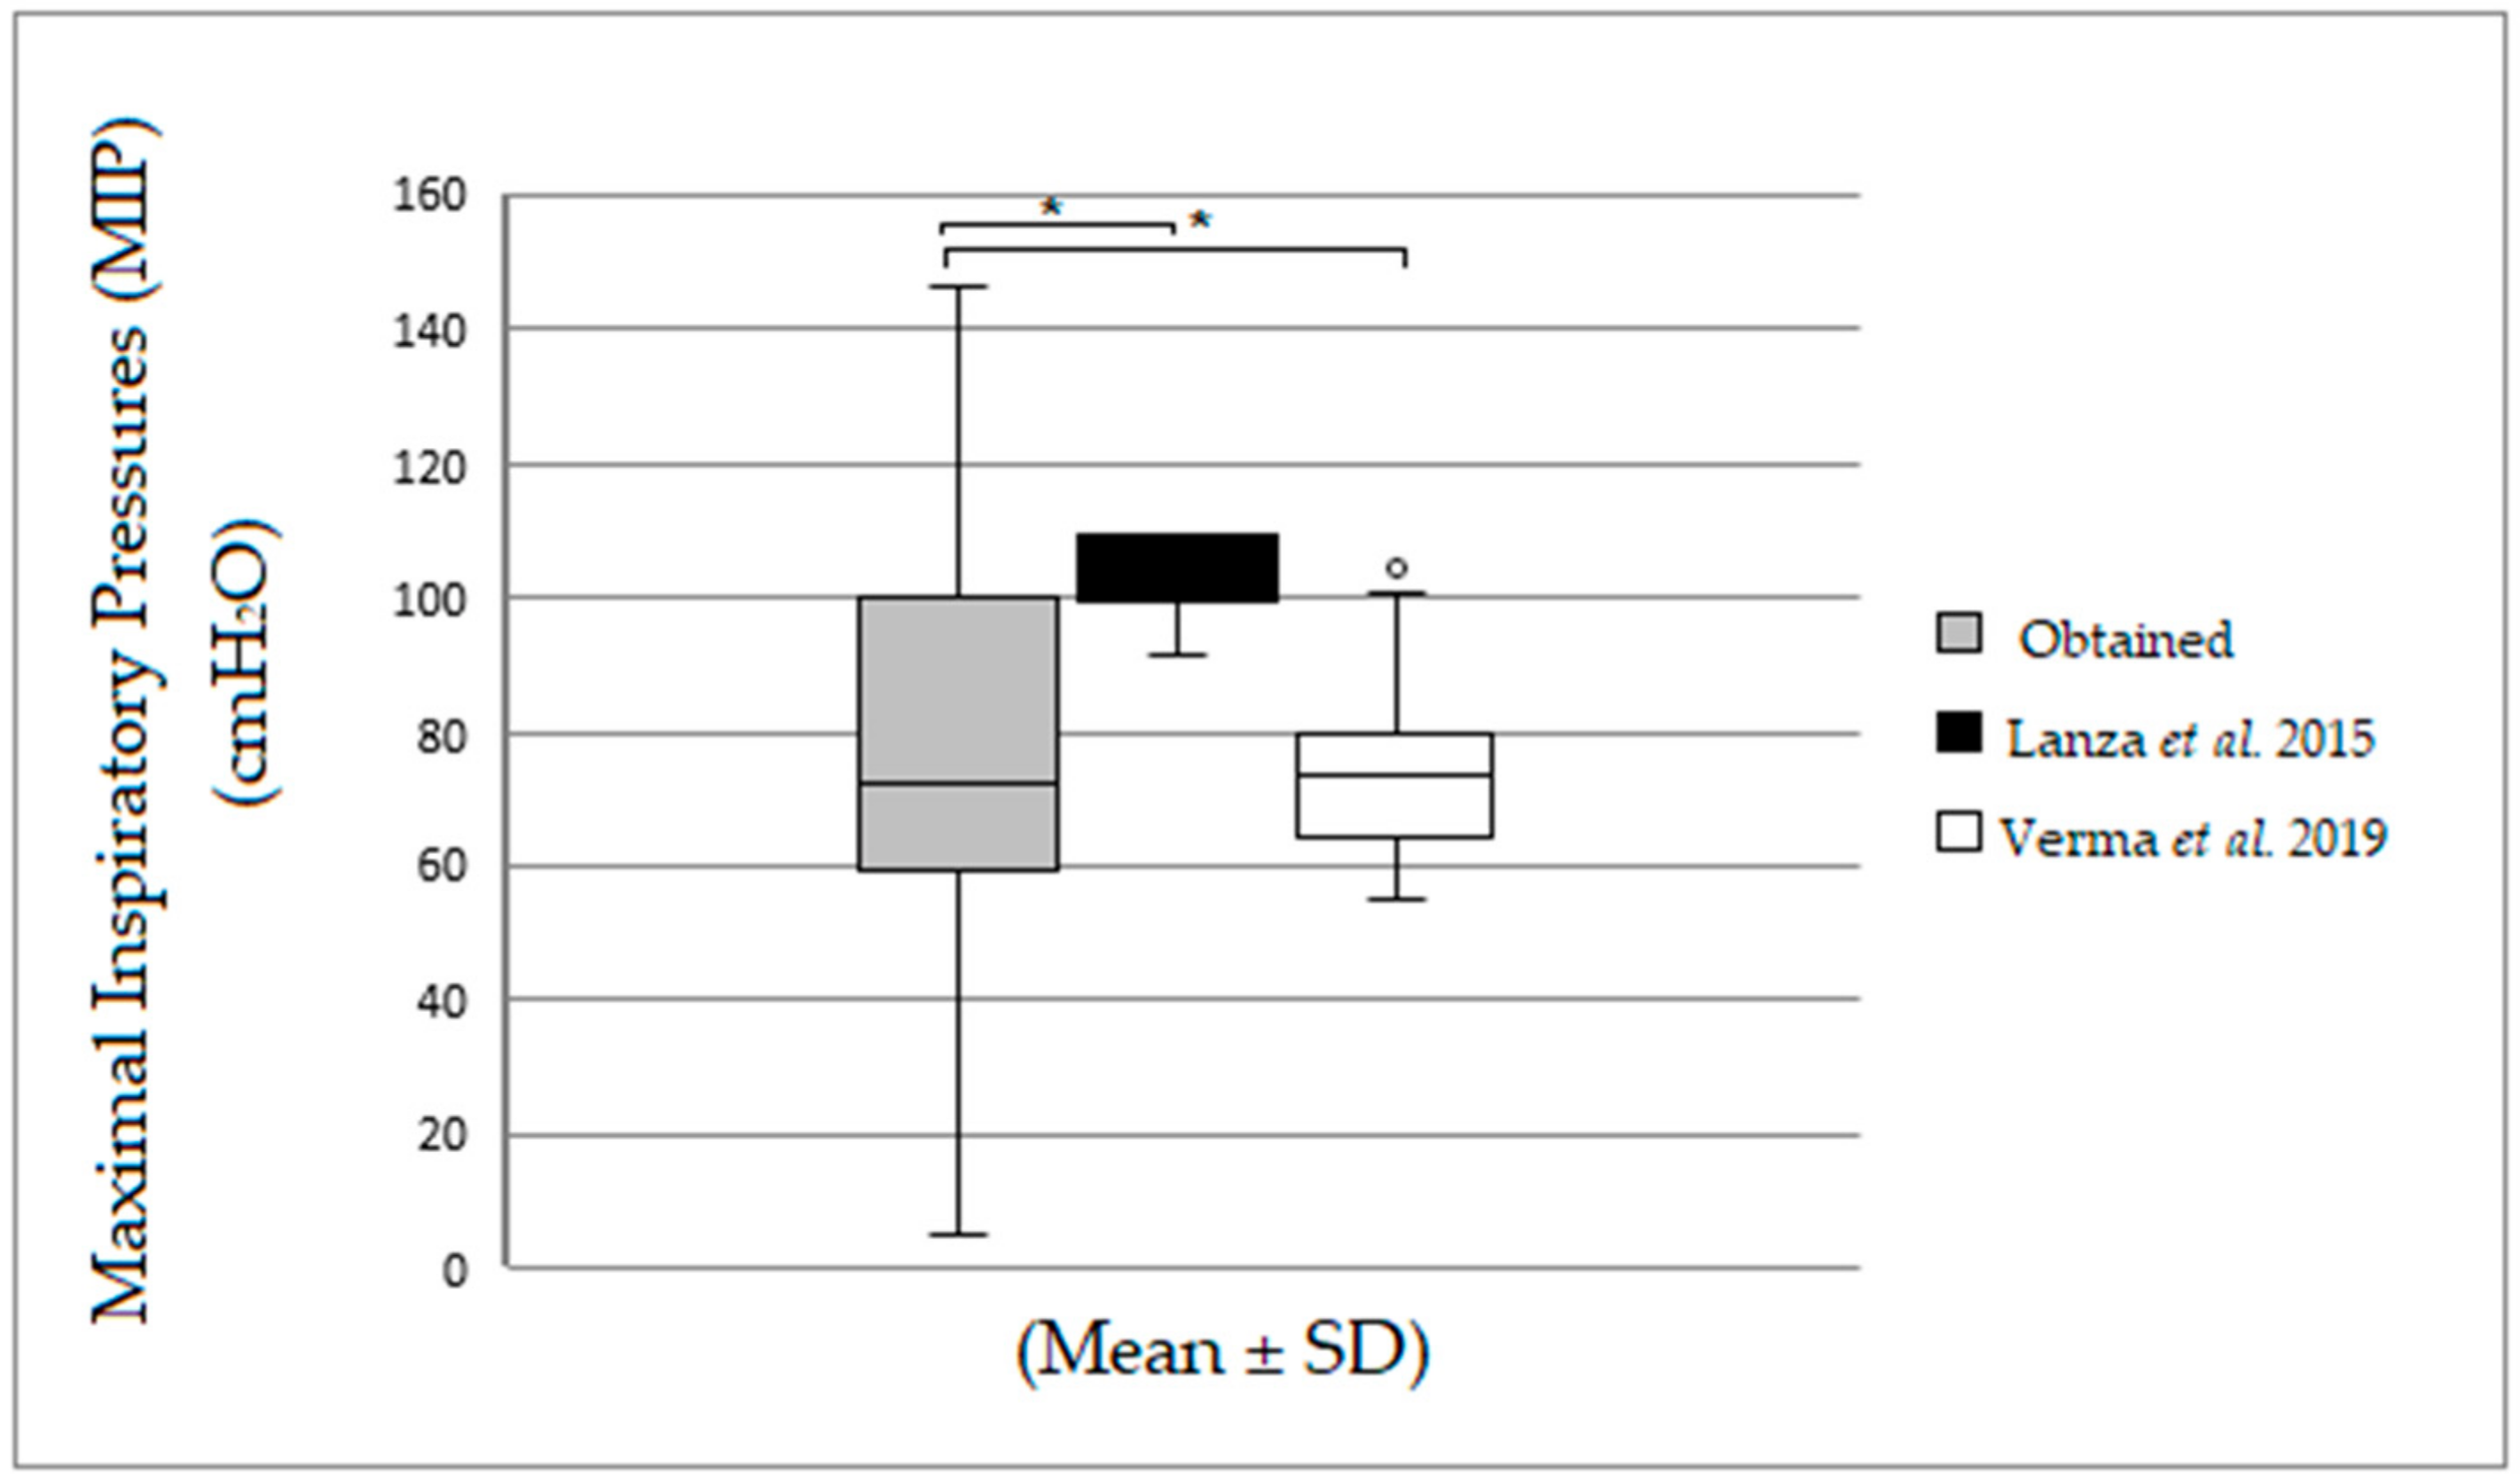
| MIPobtained | 80.0 (60.0–106.5) | 60.0 (44.0–100.0) | 68.0 (60.0–90.0) | 76.0 (56.0–80.0) |
| MIPLANZA et al. [11] | 99.6 (99.6–109.5) | 99.6 (99.6–109.5) | 99.6 (99.6–109.5) | 99.6 (99.6–99.6) |
| MIPVERMA et al. [12] | 70.0 (64.9–74.5) | 73.7 (64.5–78.4) | 78.7 (57.8–84.2) | 84.62 (79.3–93.9) *≠ |
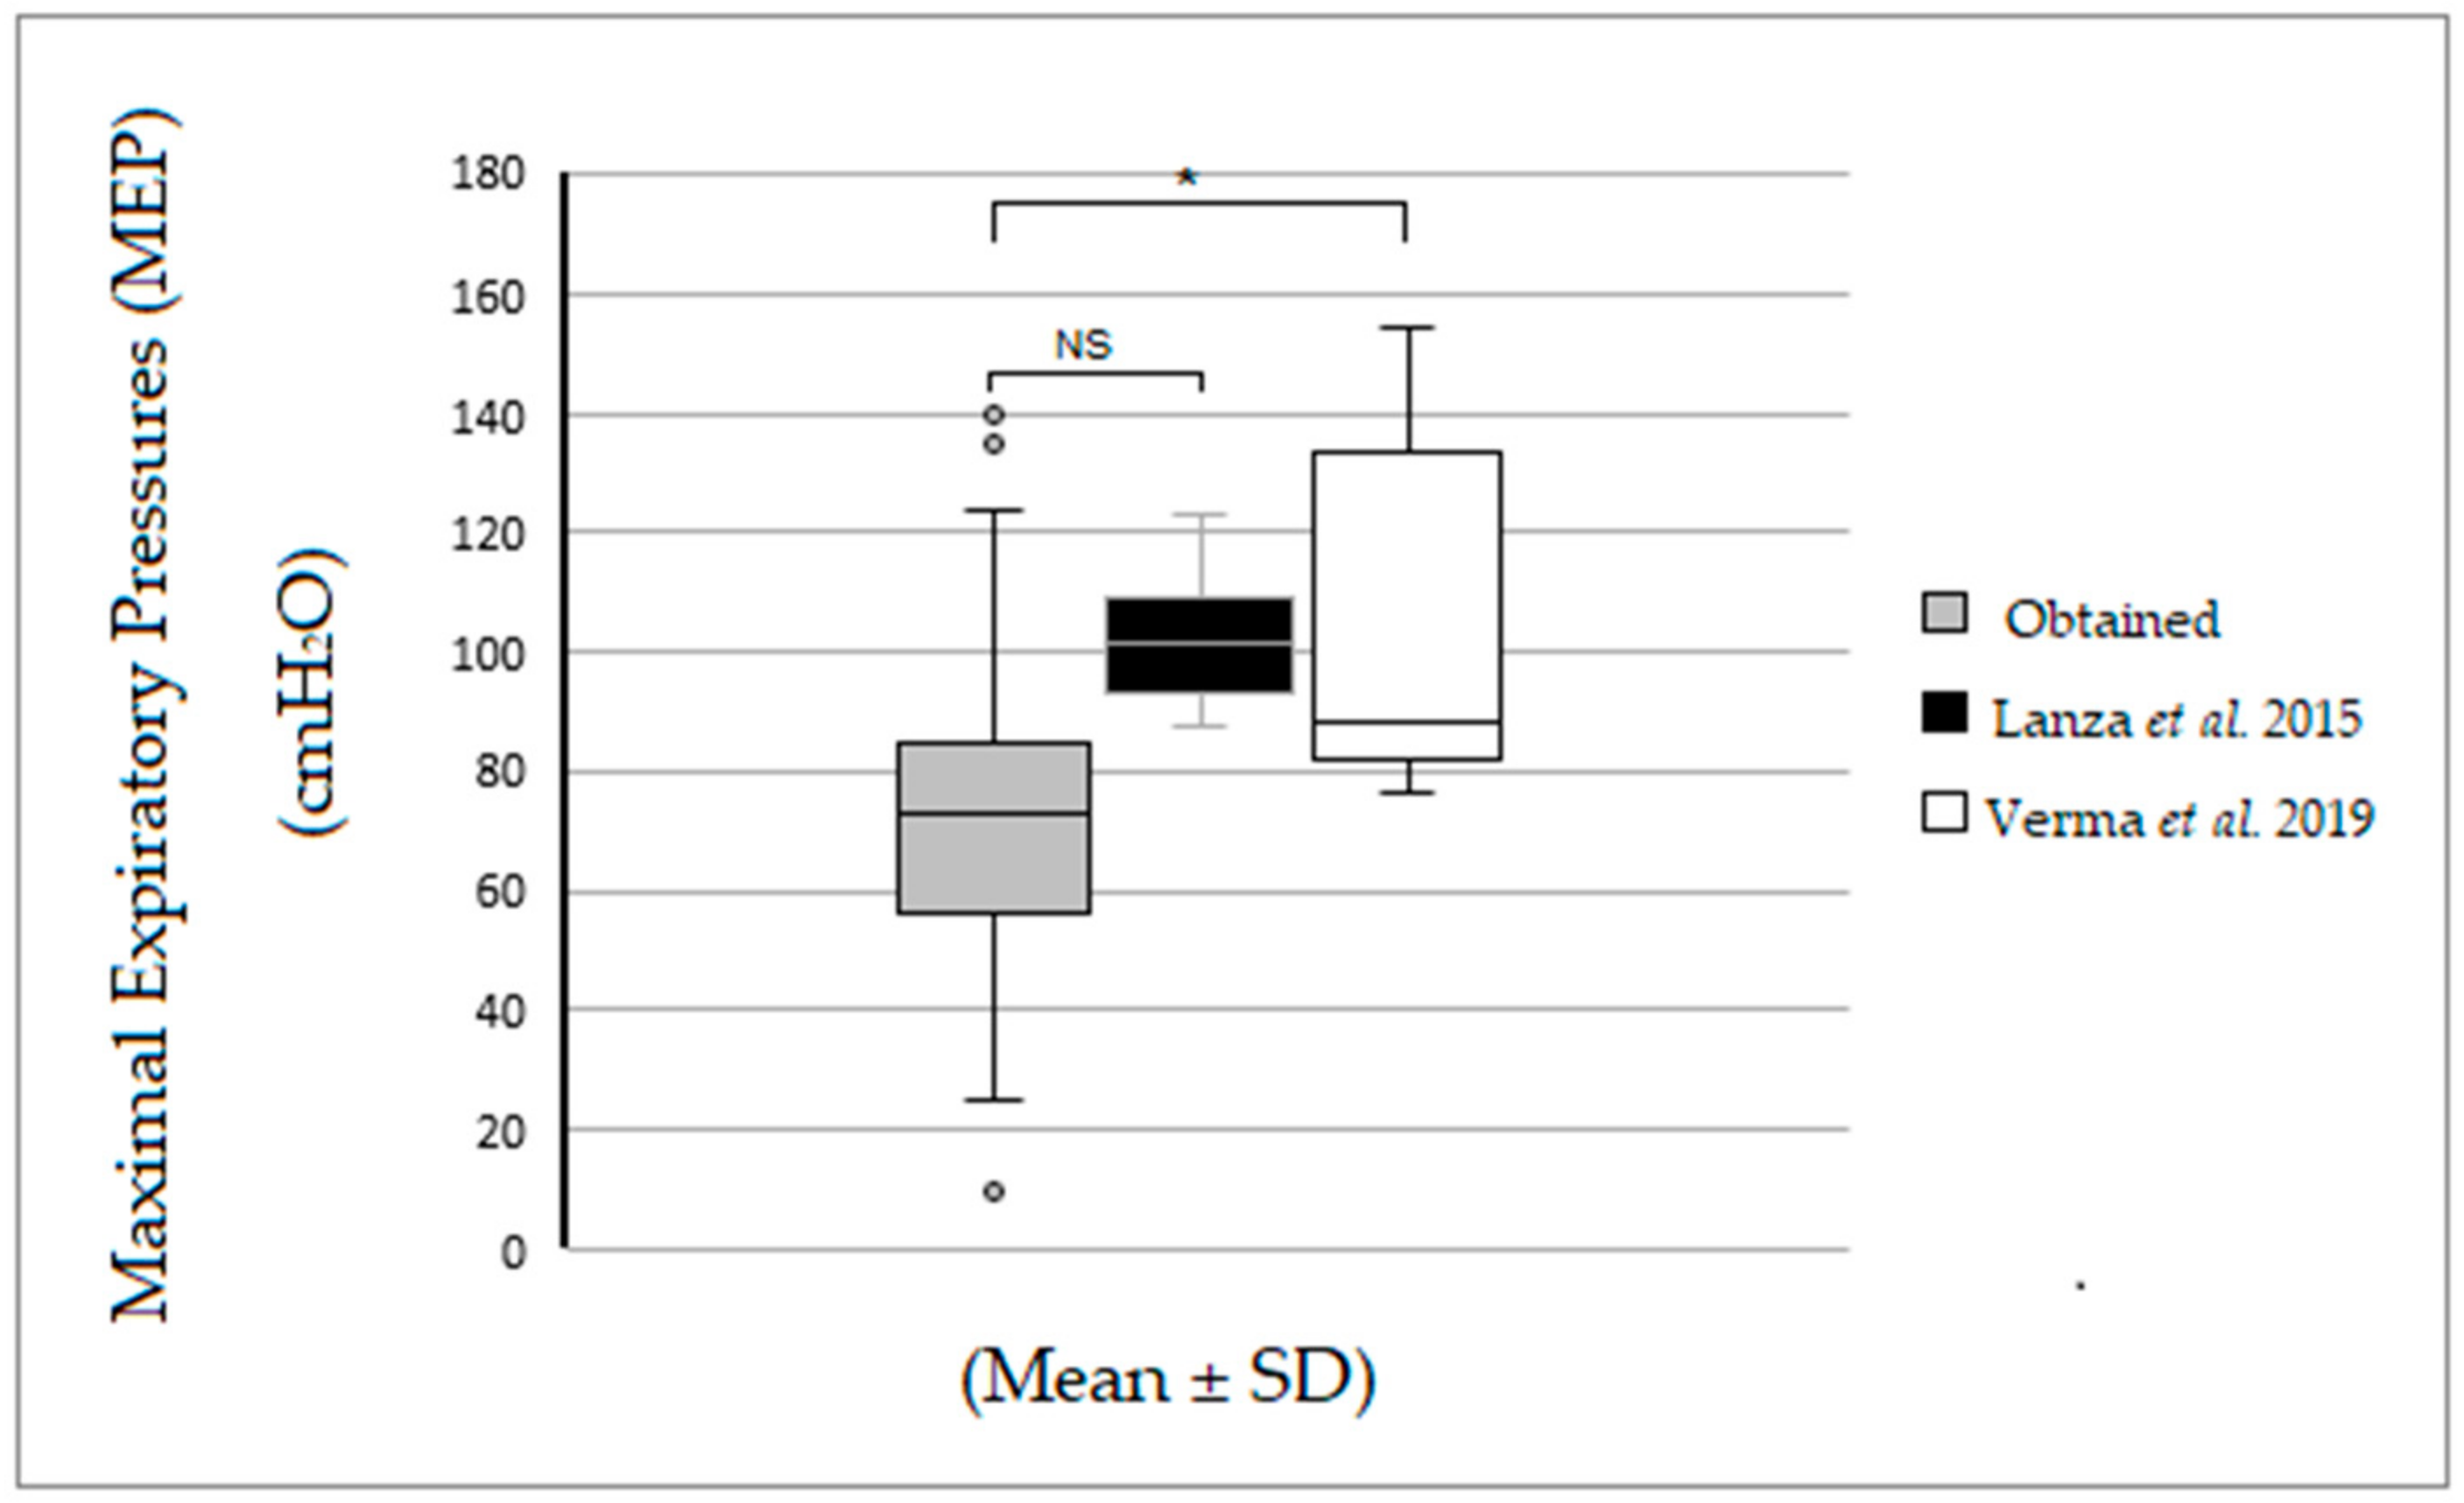
| MEPobtained | 76.0 (58.0–92.5) | 64.0 (60.0–80.0) | 64.0 (56.0–92.0) | 69.0 (44.0–80.0) |
| MEPLANZA et al. [11] | 96.5 (91.4–108.4) | 97.3 (92.5–109.9) | 101.8 (98.7–114.6) * | 103.7 (101.8–109.8) |
| MEPVERMA et al. [12] | 84.9 (79.7–138.5) | 84.7 (83.5–138.5) | 88.9 (85.9–97.9) | 93.7 (88.9–103.1) |
Disclaimer/Publisher’s Note: The statements, opinions and data contained in all publications are solely those of the individual author(s) and contributor(s) and not of MDPI and/or the editor(s). MDPI and/or the editor(s) disclaim responsibility for any injury to people or property resulting from any ideas, methods, instructions or products referred to in the content. |
© 2023 by the authors. Licensee MDPI, Basel, Switzerland. This article is an open access article distributed under the terms and conditions of the Creative Commons Attribution (CC BY) license (https://creativecommons.org/licenses/by/4.0/).
Share and Cite
de Lima, V.C.; Marquezi, M.L.; Alcantara, P.R.; Lopes, N.B.; Frientes, C.S.; da Silva Santos, T.M.; Miedes, L.R.; Fornel, M.S.; Oliveira, D.C.; Rogeri, P.S.; et al. Respiratory Muscle Strength in Brazilian Adolescents: Impact of Body Composition. Obesities 2023, 3, 155-164. https://doi.org/10.3390/obesities3020013
de Lima VC, Marquezi ML, Alcantara PR, Lopes NB, Frientes CS, da Silva Santos TM, Miedes LR, Fornel MS, Oliveira DC, Rogeri PS, et al. Respiratory Muscle Strength in Brazilian Adolescents: Impact of Body Composition. Obesities. 2023; 3(2):155-164. https://doi.org/10.3390/obesities3020013
Chicago/Turabian Stylede Lima, Viviane Campos, Marcelo Luis Marquezi, Paulo Roberto Alcantara, Nayara Barbosa Lopes, Caroline Santana Frientes, Thais Miriã da Silva Santos, Leonardo Ribeiro Miedes, Matheus Silva Fornel, Danielle Castro Oliveira, Patrícia Soares Rogeri, and et al. 2023. "Respiratory Muscle Strength in Brazilian Adolescents: Impact of Body Composition" Obesities 3, no. 2: 155-164. https://doi.org/10.3390/obesities3020013