Article

Natural Gas Pyrolysis in a Liquid Metal Bubble Column Reaction System—Part I: Experimental Setup and Methods

1
Karlsruhe Liquid Metal Laboratory, Karlsruhe Institute of Technology, 76131 Karlsruhe, Germany
2
Institute of Thermal Process Engineering, Karlsruhe Institute of Technology, 76131 Karlsruhe, Germany
*
Author to whom correspondence should be addressed.
Hydrogen 2023, 4(2), 295-306; https://doi.org/10.3390/hydrogen4020021
Submission received: 13 March 2023 / Revised: 3 May 2023 / Accepted: 13 May 2023 / Published: 17 May 2023
(This article belongs to the Topic Hydrogen Production Processes)

Abstract

:
Hydrogen is not only an important industrial chemical but also an energy carrier with increasing demand. However, the current production techniques are based on technologies that result in massive CO2 emissions. In contrast, the pyrolysis of alkanes in a liquid metal bubble column reactor does not lead to direct CO2 emissions. In order to transfer this technology from lab-scale to industrial applications, it has to be scaled up and the influences of the most common constituent of natural gas on the pyrolysis process have to be determined. For this study, the liquid metal bubble column technology developed at the KIT was scaled up by a factor of 3.75, referred to as the reactor volume. In this article, the experimental setup containing the reactor is described in detail. In addition, new methods for the evaluation of experimental data will be presented. The reactor, as well as the experimental results from pure methane pyrolysis (PM), will be compared to the previous generation of reactors in terms of methane conversion. It could be proven that scaling up the reactor volume did not result in a decrease in methane conversion. For part II of this publication, methane-ethane (MEM) gas mixtures and high calorific natural gas (nGH) were pyrolyzed, and the results were discussed on the basis of the present part I.

1. Introduction

Hydrogen (H2) is becoming increasingly important as an enabling element for an emission free, sustainable energy system, especially in Europe. Thus, hydrogen is not only envisaged to be used for mobility but also to become the most frequently used energy carrier in Europe [1]. In addition, hydrogen has been considered for use as an additive to high caloric natural gas (nGH) for heating and fuel gases. Furthermore, there are several feasibility studies investigating the usability of hydrogen for a wide range of energy-intensive industrial applications such as steel production [2]. Independent of these developments, hydrogen is already one of the most frequently used basic commodities for a broad spectrum of industrial applications. The major consumers include the petroleum and fertilizer industries [3]. In 2017, nearly half (48%) of the consumed hydrogen all over the world was produced by steam reforming of natural gas, which is the most economical route and, therefore, the main production technique for hydrogen in the world [2,4]. Other industrial technologies for hydrogen production are coal gasification with 18% and oil and naphtha reforming with 30% [2]. These currently employed techniques producing hydrogen out of fossil raw materials (coal: brown or black hydrogen, natural gas: grey hydrogen [5]) show a high carbon-to-hydrogen ratio but were predominant with 90% of all produced hydrogen worldwide in the year 2020 [5]. The most common and developed hydrogen production method of steam reforming, for example, results in total carbon dioxide (CO2) emissions of up to 0.3–0.4 m3 CO2 per m3 of H2 and requires 63.3 kJ per mol of H2 [3,6]. Producing hydrogen from purely renewable sources (green hydrogen [5]) such as electrolysis currently causes high costs compared to conventional technologies [6]. Bridging technologies such as methane (CH4) pyrolysis are intended to close this gap. Methane pyrolysis causes no direct CO2 emissions and the use of methane (or natural gas) as a raw material makes this technology currently more energy efficient compared to water electrolysis. Whereas the energy requirement for electrolysis is about 288 kJ per mol of H2 [6], the energy requirement for methane pyrolysis is 37.4 kJ per mol of H2 [7], which is not only significantly lower than for electrolysis but also lower than for steam reforming (63.3 kJ per mol of H2 [3,8]). For the pyrolysis process, CH4 is heated up to temperatures above 1173 K [9,10,11,12]. Neglecting small amounts of other by-products as a simplifying approximation, within this process, only solid carbon (C) in addition to hydrogen is formed, according to the cumulative reaction (1).
CH 4 g C s + 2   H 2 g , Δ H 0 = 74 , 85   kJ mol   CH 4
Using a tube reactor, the generated hydrogen could simply be vented as a gas stream. However, a large fraction of carbon is disposed on the hot surfaces of the reactor walls, thus quickly leading to blockage [13]. To overcome this challenge for continuous operation, a bubble column reactor concept, with liquid tin as the working medium has been implemented at the Karlsruhe Liquid Metal Laboratory (KALLA), based upon suggestions and experimental trials by Steinberg [14] and Serban et al. [15]. This continuously operating technique generates solid carbon powder and hydrogen from pure methane as feed. Using the bubble column technology, the pyrolysis takes place in the rising gas bubbles, where the inner surface of the bubbles can be considered as a heated reactor wall that is newly formed with each bubble. There is no direct contact of the methane with the reactor wall, so that no blockages can form. The proof-of-concept studies have already been successfully performed by Plevan and Geißler et al. [7,11,12,16,17]. The developed reactor with a volume of 1.6 L (reactor type 1, RT1) was recently used to prove the operability of the process. In this reactor, methane gas bubbles are dispersed through a single orifice in the bottom of the reactor into the liquid tin, at a temperature between 1223 K and 1473 K. The carbon powder formed in these bubbles by pyrolysis is carried to the liquid tin surface. There, the carbon accumulates as a loose floating deposit and, thus, no longer causes any blockages within the reaction zone [7]. In their literature study, Von Wald et al. [18] concluded that the hydrogen production by methane pyrolysis using the liquid metal bubble column technology is a suitable process for reducing CO2 emissions in the short term. The calculated costs of the gained CO2 emission reduction are comparable to current CO2 emission reduction technologies (gaseous carbon capture and sequestration) even without considering the value of the by-products such as carbon. They also noted that this technology can also provide economic benefits through the resulting carbon as a potential valuable material.
The current study has been published in two parts. In the present first part, the reactor volume was enlarged by a factor of 3.75 by increasing the diameter without decreasing the methane conversion. The increased reactor diameter was the first step to prepare this technology for the use of multi-orifices as dispersing units. That minimized coalescence during bubble formation [19], which would be resulting in larger bubbles with reduced residence time in the liquid tin [20]. In parallel an increase in throughput per orifice by factor 2.5 has also been investigated. The impact of these changes on methane conversion have been compared to RT1, using pure methane (PM) as feed gas. In the second part of this publication, gas mixtures of methane-ethane (MEM) and high calorific natural gas (nGH) were pyrolyzed and investigated using the setup and the evaluation methodology of the present part.

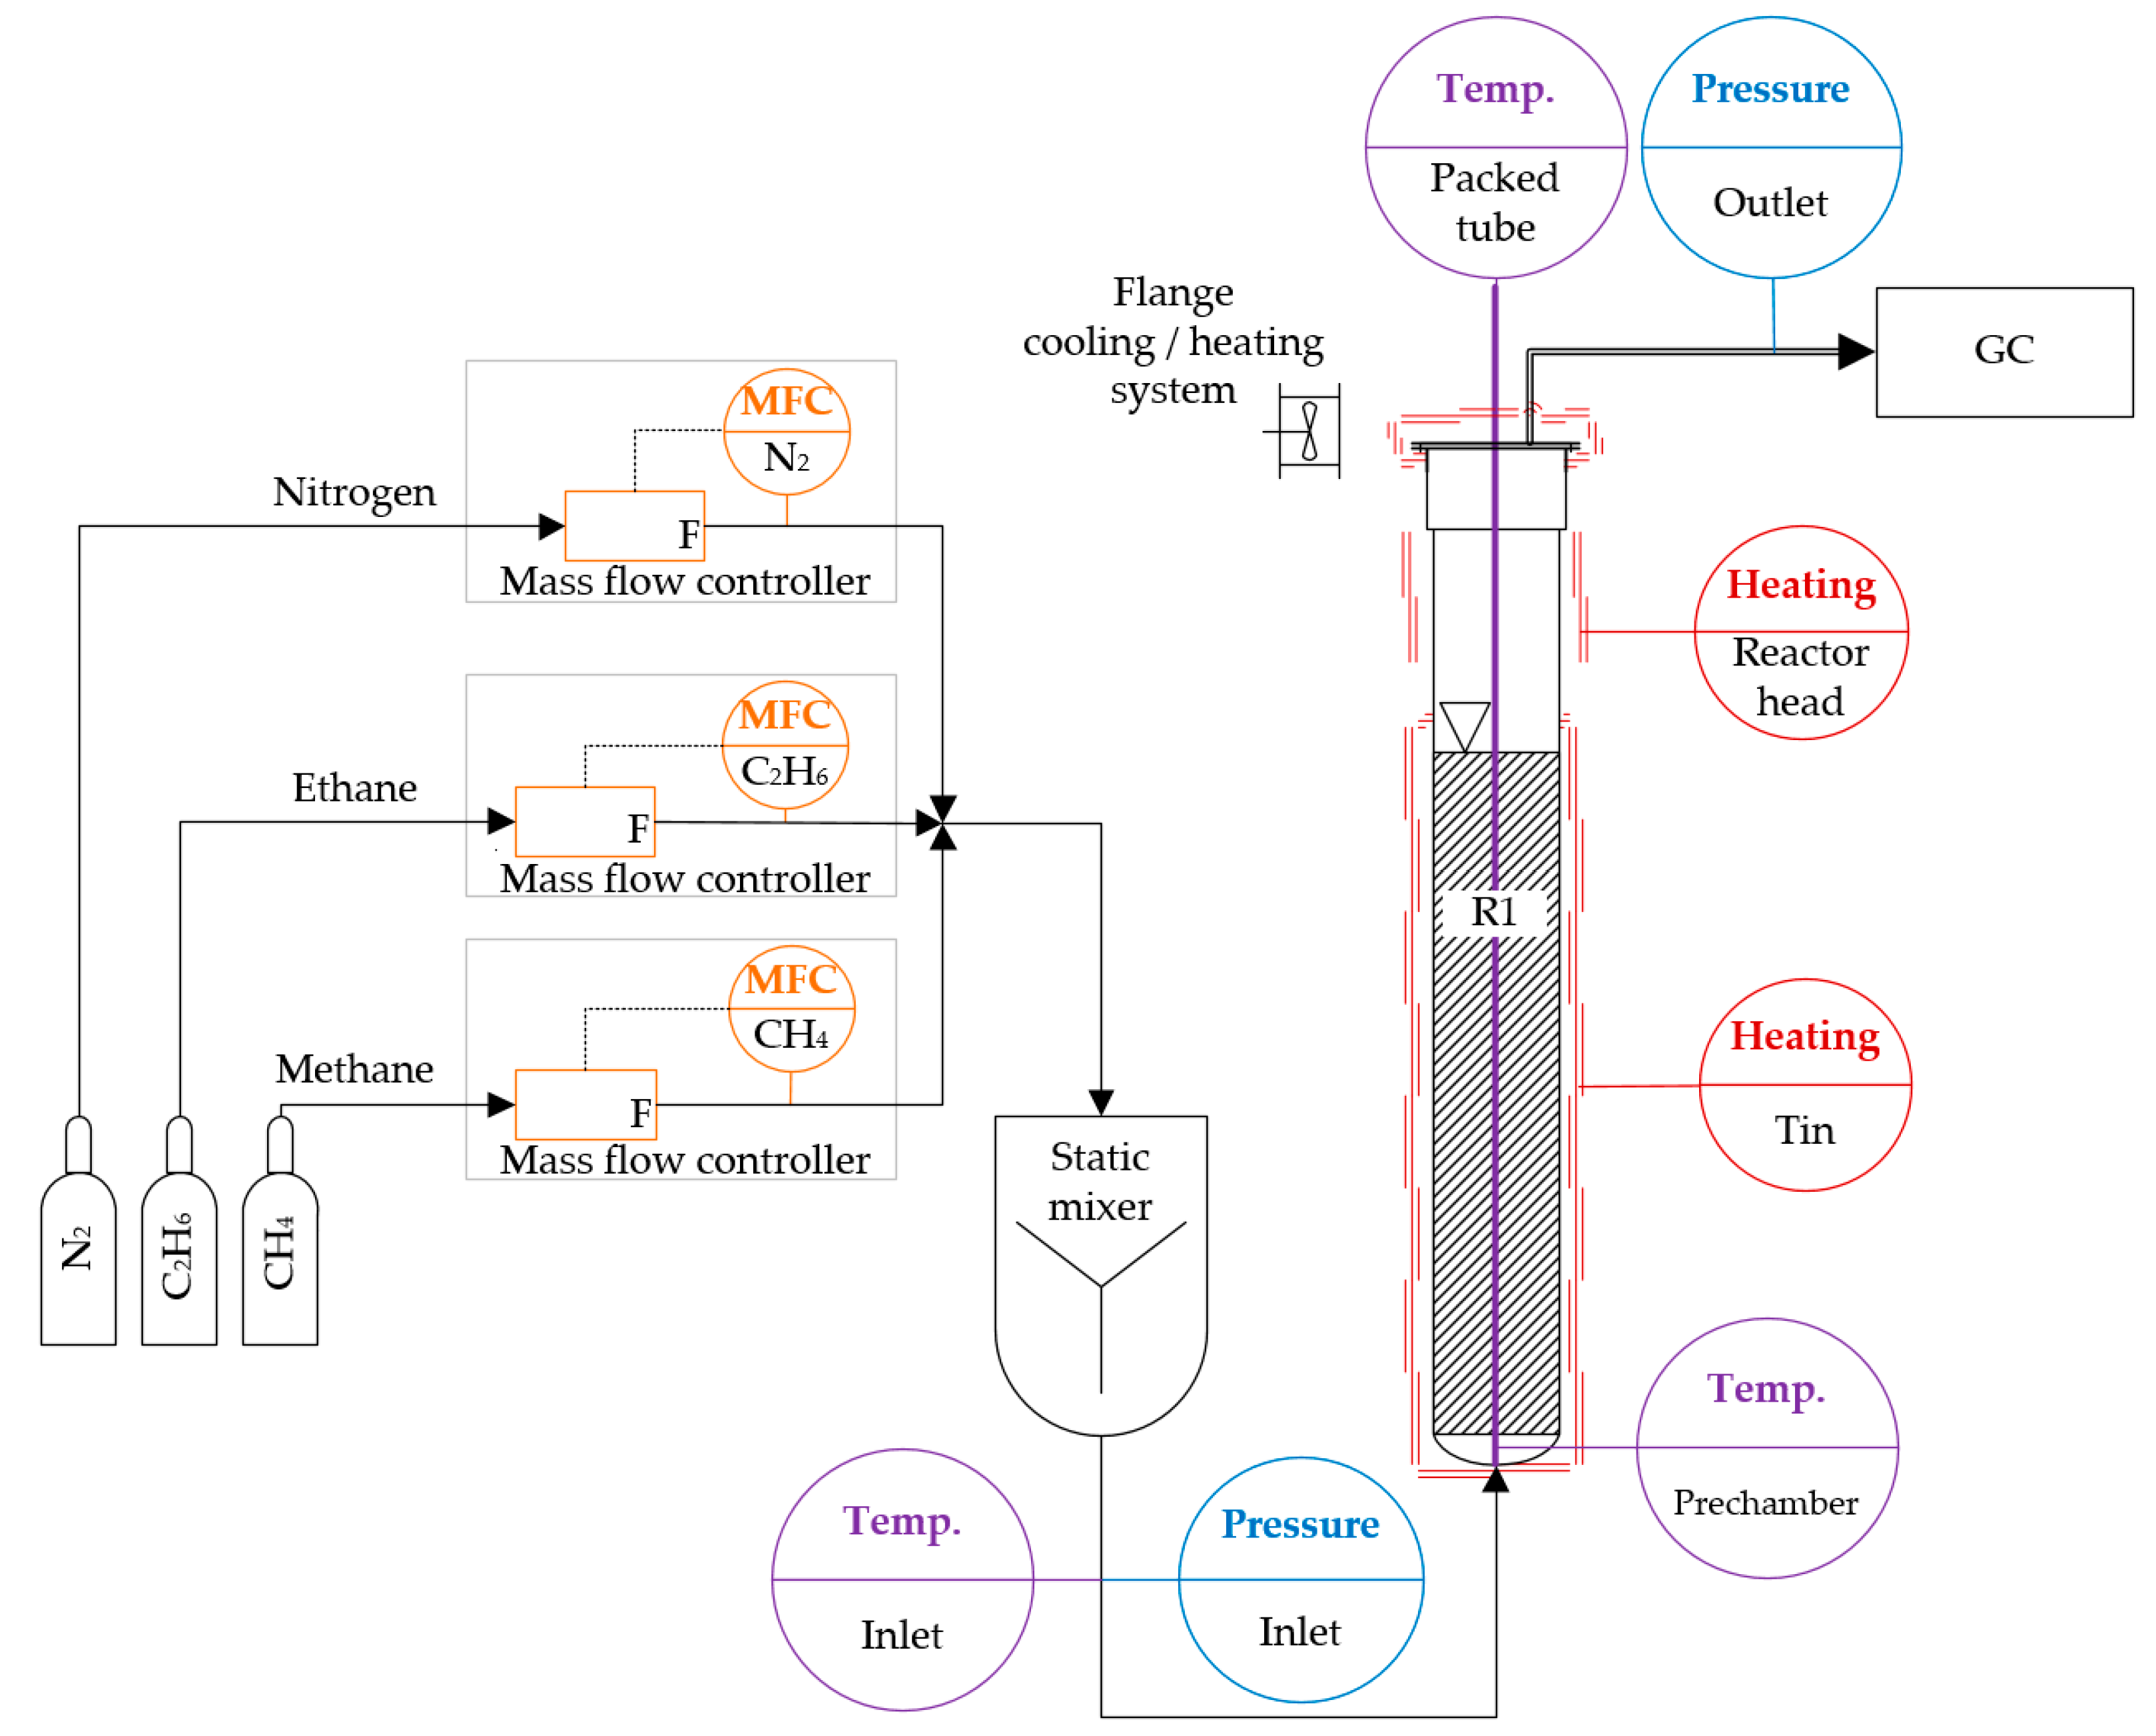
2. Experimental Setup

The reactor system is based on the work of Geißler et al. [7], which was further developed. The core of the reactor system, a quartz glass bubble column, was embedded in an electrically heated column furnace. The inlet of the reactor (reactor bottom) was connected to the gas supply system. At the outlet of the reactor (reactor head), the quartz glass reactor was connected with a flange to the analysis and exhaust gas system. The analysis of the gas composition was carried out, using a gas chromatograph (GC).

2.1. Gas Supply

The gas supply was implemented using mass flow controllers (MFC) from Bronkhorst in Ruurlo, Netherlands. The accuracy of the MFCs with respect to the resulting standard volumetric flow was ±2%. The gas flow rates were kept within a superficial gas velocity (SGV) range of 1.1 and 1.9 mm/s at standard conditions (T = 273 K, p = 1.013 × 10⁵ Pa), referred to the inner bubble column diameter. This range was investigated in 0.4 mm/s steps. After the MFCs, a static mixer was integrated (Figure 1) with a mixing quality of 96% (at 50 mLN/min at 293 K) to 99% (at 2000 mLN/min at 293 K).
Each gas species had its own MFC: one for the methane feed of PM and MEM pyrolysis, one for the ethane during MEM pyrolysis, and one for nitrogen which was used for stand-by states. For nGH, the methane MFC was used, with an additional correction factor. The volume of the gas supply system between the MFCs and the reactor inlet nozzle was considered as the gas supply prechamber.

2.2. Reactor

The bubble column reactor used in the studies from Geißler (RT1) [7] was enlarged by a factor of 3.75 in terms of reactor volume (1.88 in terms of diameter), but the relative filling height of the liquid tin (hSn/hrh) with 0.73 ± 0.04 at 1323 K was maintained. Two reactor types (reactor type 2 and 3, RT2 and RT3) were developed, RT2 with a reactor-prechamber and RT3 without (Table 1).
The reactor prechamber in RT2 was implemented with a ratio between reactor height and reactor prechamber height (hrh/hpch) of 39. The usability of a prechamber was tested in order to subsequently imply a multi-hole dispersion unit. In the present study, all dispersion systems were designed as single-hole orifices with inner diameters of 0.6 ± 0.1 mm, for reactor types 2 and 3. The temperature inside the reactors was measured by means of 11 thermocouples (type K) distributed over the reactor height. The thermocouples were arranged to ensure that the local resolution was highest in the area where the tin surface was expected (Figure 2).
The tin surface position (hSn) was estimated by means of the temperatures: the high thermal conductivity of the tin [21], the controlled heating zones in the area of the liquid tin and the mixing of the tin due to the bubble rising led to mostly homogeneous temperature conditions throughout the major part of the liquid tin. On the other hand, there was a significant gradient (∆T ≥ −30 K) in temperature in the area of the tin surface, due to the actively cooled reactor head (Figure 2). The calculated tin height using the correlation of Assael et al. [22] agreed well with the measured temperature data. For this calculation, the negligible relative gas holdup (hg_holdup/hrh) of maximum 0.024 (SGV = 1.9 mm/s; T = 1430 K) was not taken into account.
The reported temperature measurement uncertainties comprise the accuracy of thermocouples given by the manufacturer as limit deviation and the determined uncertainty over a defined period of time. The resulting overall temperature uncertainties lie within the range of ±4 K to ±16 K.

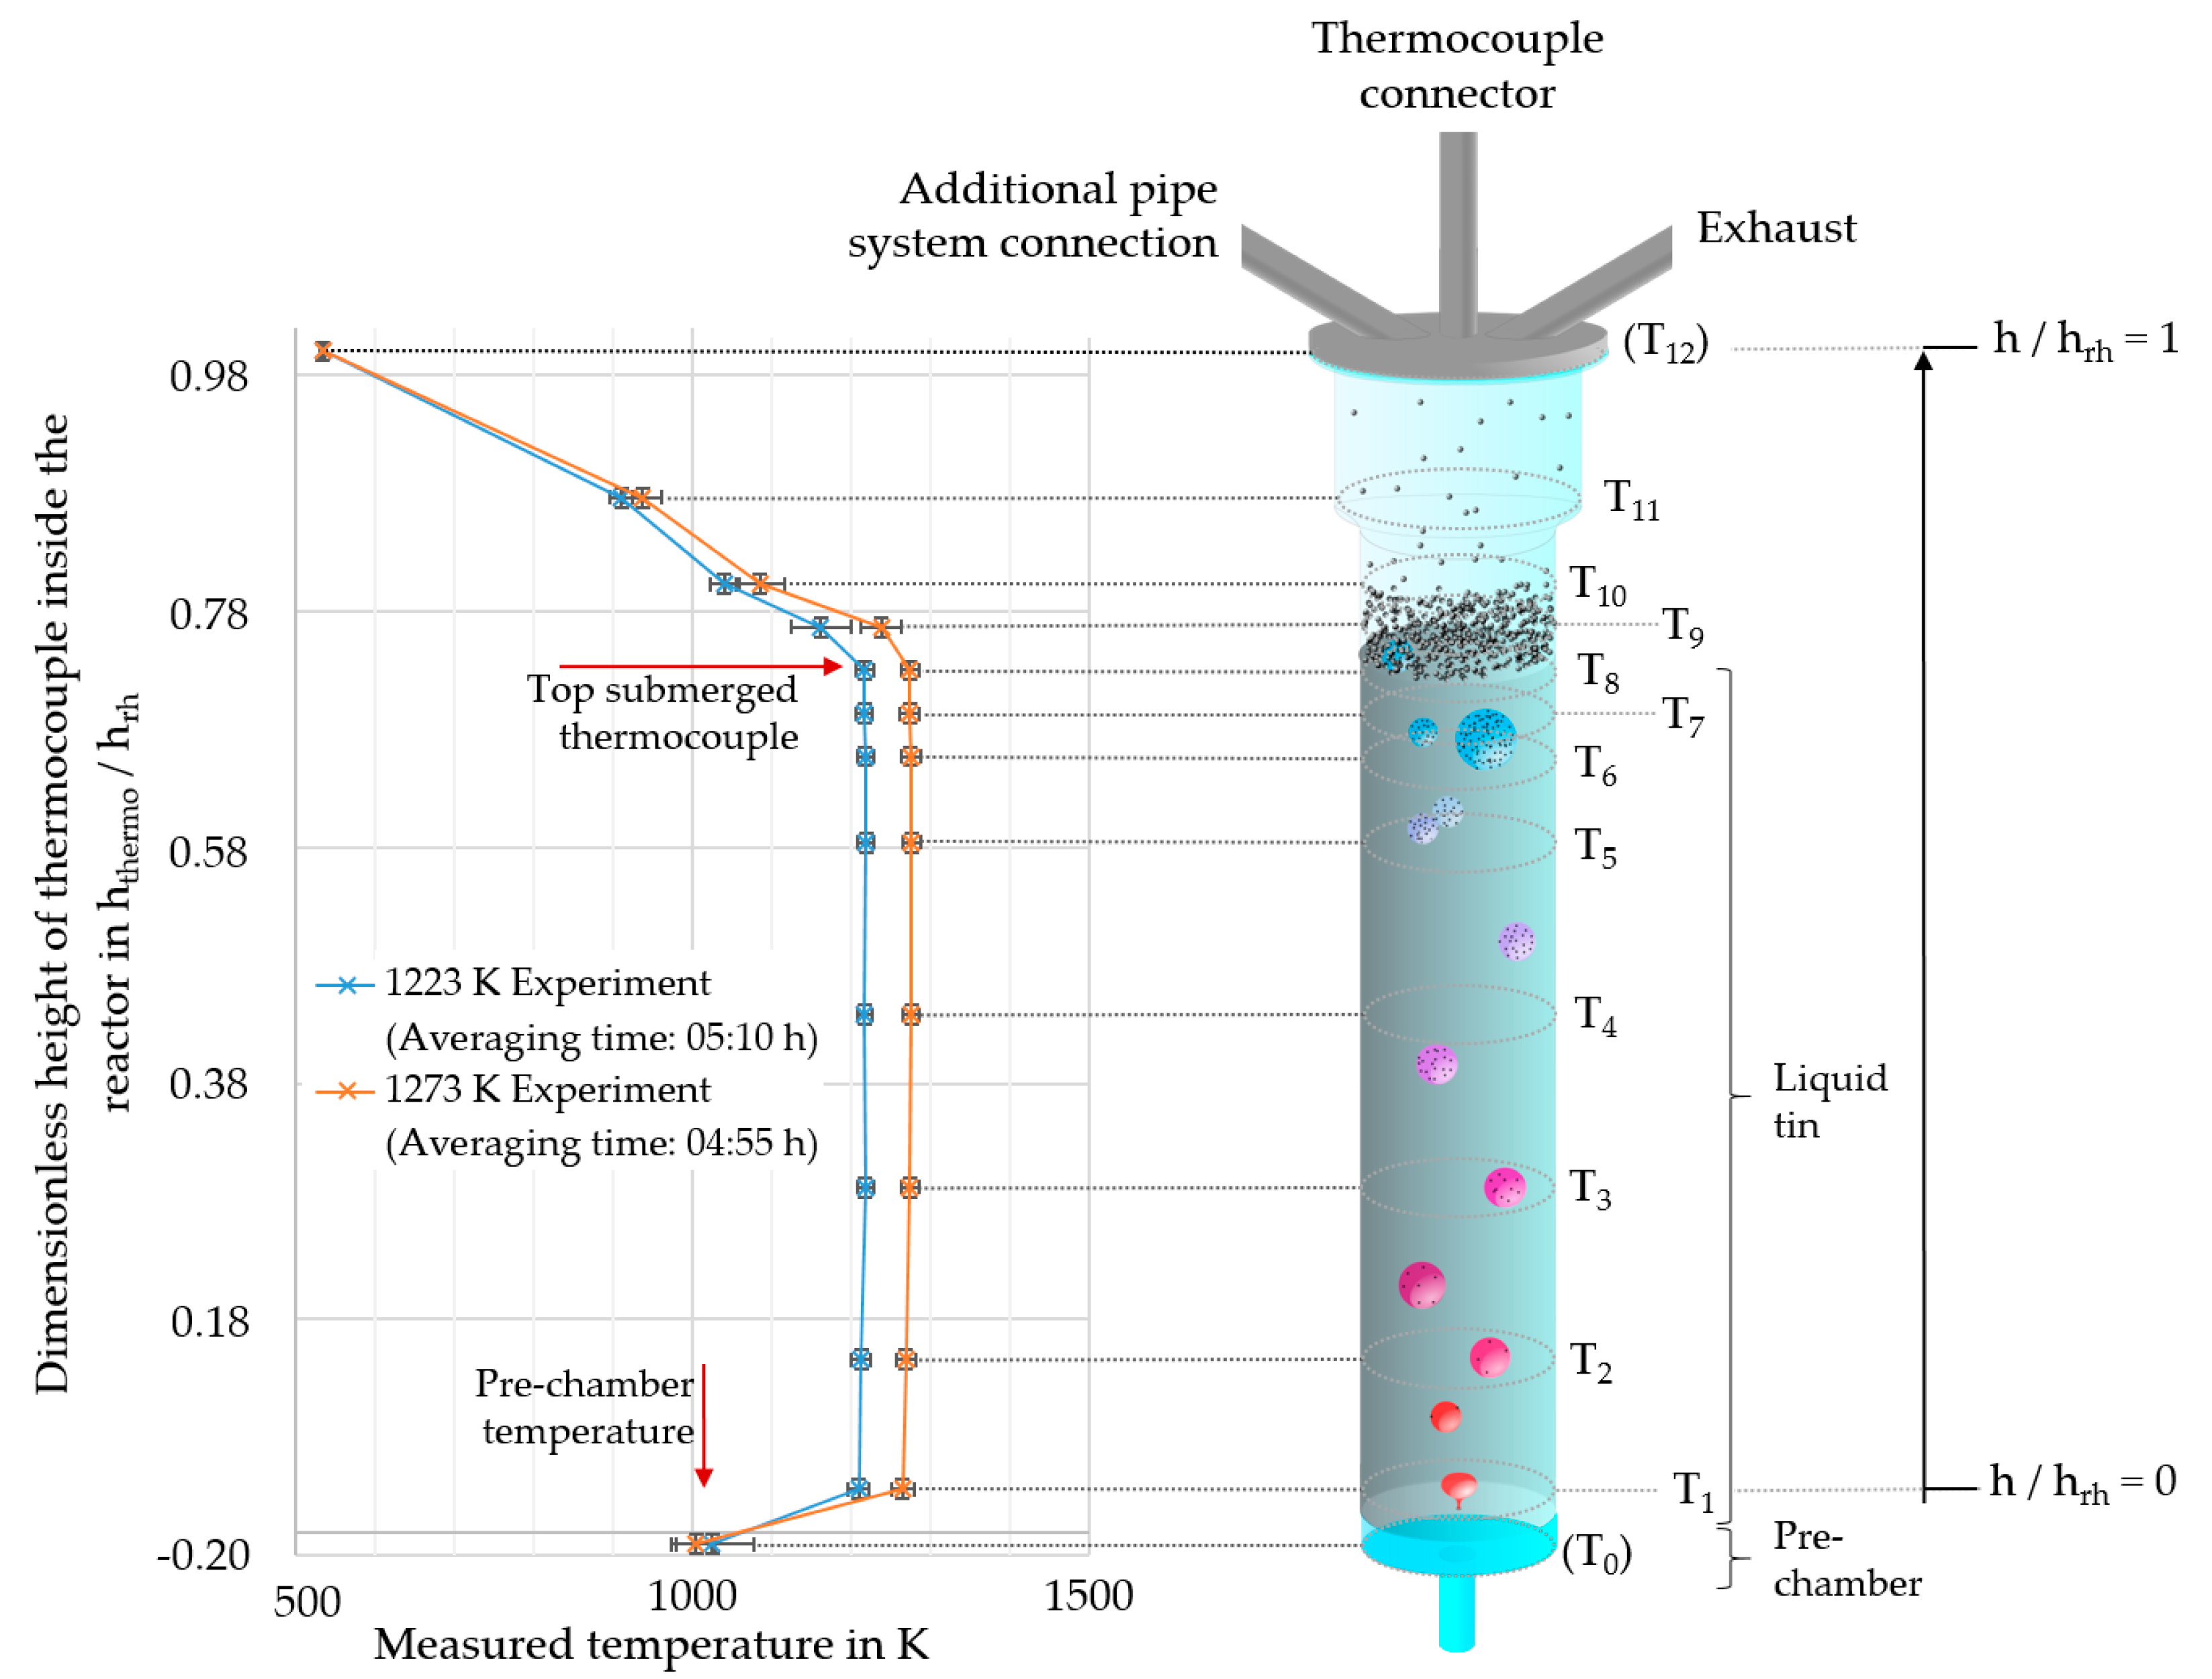
2.3. Temperature Evaluation

For the calculation of the mean temperature of the tin ( T ¯ tin ), the first step was to average the temperature of each thermocouple T i t arithmetically backwards in time ( t   in seconds), using Equation (2).
T ¯ i = 3.5 · τ 1 s × t t 3.5   ·   τ T i t
For this study a 3.5-fold of the residence time ( τ ) was chosen to average backwards. Due to the complex fluid dynamics, the reactor prechamber and the reactor head space were considered as an ideal continuous stirred-tank reactor (CSTR). The residence time chosen lead to 97% volume exchange according to the equations presented by Naumann [23]. After changing the reactor conditions or the gas composition, this residence time results in a maximum uncertainty of 3%.
Subsequently to the calculation of the time mean temperature of each thermocouple ( T ¯ i ), the overall (time and height dependent) mean temperature of the tin was calculated using the trapezoidal rule in the following manner: The temperature of T1 (Figure 2) was considered as the lower edge temperature ( T ¯ 0 at hthermo(L) = 0) of the tin. The temperature of T8 (Figure 2), which was the uppermost thermocouple, still below the tin filling level ( T ¯ u at hthermo(U)) was considered as the upper edge temperature of the tin. The space between those two bounds has been divided into n segments, with a thermocouple between each segment. For the temperature integration, the lower and upper bounds of each segment have to be calculated in terms of the sums L s , tin i (3) and U s , tin i (4).
L s , tin i = 0 h thermo U T ¯ i   d h = i = 1 i T ¯ u h thermo T i   h thermo T i 1 × T ¯ i
U s , tin i = 0 h thermo U T ¯ i   d h = i = 1 i T ¯ u h thermo T i   h thermo T i 1 × T ¯ i 1
Then, the trapezoidal sum T s could be calculated using Equation (5) with the lower L s , tin / head i and upper U s , tin / head i bounds.
T s , tin i = 1 2 × L s , tin i U s , tin i  
This leads to an interval number I s calculated with Equation (6)
I s = L s , tin i + T s , tin i
and finally, the mean temperature T ¯ tin of Equation (7).
T ¯ tin = I s h Sn
The temperature differences of the feed gases were not taken into account. Geißler et al. [12] estimated that even for high bubble diameters (10 mm), low tin temperatures (1173 K) and low gas temperatures (298 K), the bubble core temperature adjusted to the liquid tin temperature after 0.3 s. Due to the rapid heat up and the actively cooled reactor prechamber (to prevent pyrolysis) in this study, the preheating due to the reactor prechamber was considered to be negligible.

2.4. Pressure Evaluation

The accuracy of the reported pressure measurements was determined to be ±1.8 ∗ 102 Pa. Both the reactor inlet and outlet pressures were found to depend strongly on the applied gas volume flow (Table 2). The pressure ranges were also influenced by operating time and were increasing over time due to carbon deposits and tin weeping. The inlet pressures of the reactor ranged from 1.7 × 10⁵ Pa (a) of a new reactor with minimal SGV to 2.9 × 10⁵ Pa (a) of a reactor as prescribed maximal pressure, usually reached right before finishing experimental campaigns. The reactor outlet pressure was between 1.00 × 10⁵ Pa (a) and 1.54 × 10⁵ Pa (a), depending on volume flows and exhaust filter adhesions. The system includes various operational and safety internals, upstream of the reactor inlet. Thus, the additional volume generated was considered as gas supply dead volume and was not further taken into account.

2.5. Gas Composition Evaluation

Gas chromatography was used to determine the product gas composition. The GC (Model: Clarus GC580, ARNL3933 modified 4016 for Perkin Elmer, Waltham, MA, USA), equipped with a thermal conductivity detector, was calibrated for eight components (Table 3).
The limits of quantification (LoQ) for every calibrated species are given by the manufacturer with 0.1 mol%. Each gas composition was measured in four-fold determinations.
The methane conversions from the experiments of Geißler et al. [7] were calculated using the measured mole fractions of methane ( y CH 4 ) and assuming that the selectivity for reaction (1) was S H 2 CH 4 = 1 (8), which was based on the simplification that only carbon and hydrogen are formed during pyrolysis, as represented by formula (1). Therefore, the hydrogen yield Y H 2 CH 4 is equal to the methane conversion X CH 4 (9).
S H 2 CH 4 = Y H 2 CH 4 X CH 4
X CH 4 = 1 y CH 4 1 + y CH 4
In the present part I Equations (8) and (9) were used for the comparison of the up-scaled reactor RT2 to the previous reactor type RT1.
For part II of this publication, the assumptions made for Equations (8) and (9) are too idealized to discuss the effects of gas mixtures on methane conversions and hydrogen yields. In order to calculate the overall methane conversion as well as the yields of all components detectable, all detectable by-products formed in the pyrolysis process have been taken into account in this study. Additionally, several assumptions were made. Nitrogen was assumed to be fully inert. The sum of all detected species was normalized to 100 mol%. Furthermore, it was assumed that the PM pyrolysis only included the following reactions (10)–(12):
CH 4 C s + 2 × H 2
2 × CH 4 C 2 H 6 + H 2
2 × CH 4 C 2 H 4 + 2 · H 2
On the other hand, nGH and the MEM pyrolysis only included the following reactions (13)–(15):
CH 4 C s + 2 × H 2
C 2 H 6 2 × C s + 3 × H 2
2 × CH 4 C 2 H 4 + 2 × H 2
All other possible reactions were not taken into account.
The given reactions (10)–(12) for the PM pyrolysis resulted in a system of equations for calculating the conversion rates and yields of the determinable components.

2.5.1. System of Equations for PM Pyrolysis

Assuming the validity of the ideal gas law, the following equations were applied to all components, detectable (16)–(19):
y eq , CH 4 = 1 X CH 4 y feed CH 4 × 1 + Y H 2 CH 4 + 1 2 × Y C 2 H 4 CH 4
y eq , H 2 =   2 × Y H 2 CH 4 + 1 2 × Y C 2 H 6 CH 4 + Y C 2 H 4 CH 4 y feed CH 4 × 1 + Y H 2 CH 4 + 1 2 × Y C 2 H 4 CH 4
y eq , C 2 H 4 = 1 2 × Y C 2 H 4 CH 4 y feed CH 4 × 1 + Y H 2 CH 4 + 1 2 × Y C 2 H 4 CH 4
y eq , C 2 H 6 = 1 2 × Y C 2 H 6 CH 4 y feed CH 4 × 1 + Y H 2 CH 4 + 1 2 × Y C 2 H 4 CH 4
  • Y H 2 CH 4 = hydrogen yield with regard to methane
  • Y C 2 H 6 CH 4 = ethane yield with regard to methane
  • Y C 2 H 4 CH 4 = ethene yield with regard to methane
  • y eq ; i = mole fraction of component i

2.5.2. System of Equations for MEM and nGH Pyrolysis

For MEM and nGH, similar assumptions were made for PM pyrolysis, which resulted in a system of equations for calculating the conversion rates and yields of the determinable components based on reactions (20)–(23):
y eq , CH 4 = y feed CH 4 × 1 X CH 4 y feed CH 4 × 1 + Y H 2 CH 4 + 1 2 × Y C 2 H 4 CH 4 + y feed C 2 H 6 × 1 + 2 × X C 2 H 6
y eq , H 2 = y feed H 2 + y feed CH 4 × 2 × Y H 2 CH 4 + 1 2 × Y C 2 H 4 CH 4 + y feed C 2 H 6 × 3 · X C 2 H 6 y feed CH 4 × 1 + Y H 2 CH 4 + 1 2 × Y C 2 H 4 CH 4 + y feed C 2 H 6 × 1 + 2 × X C 2 H 6
y eq , C 2 H 4 = y feed CH 4 × 1 2 × Y C 2 H 4 CH 4 y feed CH 4 × 1 + Y H 2 CH 4 + 1 2 × Y C 2 H 4 CH 4 + y feed C 2 H 6 × 1 + 2 × X C 2 H 6
y eq , C 2 H 6 = y feed C 2 H 6 × 1 X C 2 H 6 y feed CH 4 × 1 + Y H 2 CH 4 + 1 2 × Y C 2 H 4 CH 4 + y feed C 2 H 6 × 1 + 2 × X C 2 H 6
  • y feed i = mole fraction of component ( i ) in the feed gas flow
  • X C 2 H 6 = overall conversion rate of ethane
  • Y H 2 CH 4 = hydrogen yield with regard to methane
  • Y C 2 H 4 CH 4 = ethene yield with regard to methane
  • y eq ; i = molar fraction of component i
The GC measurements provided the relative mole fractions y eq ; i of the detectable components in the product gas. The feed gas composition on the other hand was defined by the mass flow adjustments m ˙ Gas i of the MFCs for each feed gas. For y feed i generally, the Equation (24) follows.
y feed i = m ˙ Gas i × i m ˙ Gas i 1
All differences between the equation systems and the GC-measured values y GC _ i , were minimized (25) using python (Version 3.11.2) with the solver “scipy.optimize.minimize” of the library “scipy” [24,25] (version 1.9.3).
i y eq _ i y GC _ i !   0
For the estimation of the uncertainty, a worst-case consideration was carried out. For this purpose, a matrix of the GC measurement uncertainties of all measured gas amount values was created and the system of equations were solved again with summation or subtraction of each uncertainty of the GC values in all possible permutations.
The given uncertainties of the GC values for setting up the matrix consisted of the following parts:
  • Accuracy of the calibration gases (manufacturer’s specification, VDI 3490-2);
  • Maximum standard uncertainty of multiple determination of each calibrated gas (four-fold determinations for each calibration point);
  • Standard uncertainty of each multiple determination of the product-gas during the experiments.
The resulting calculation matrix was defined by the number of variables and number of equations (4 ∗ 42). As uncertainty values, the ranges of the respective maximum and minimum conversions and yields, resulting from the uncertainties of the list above, were used.

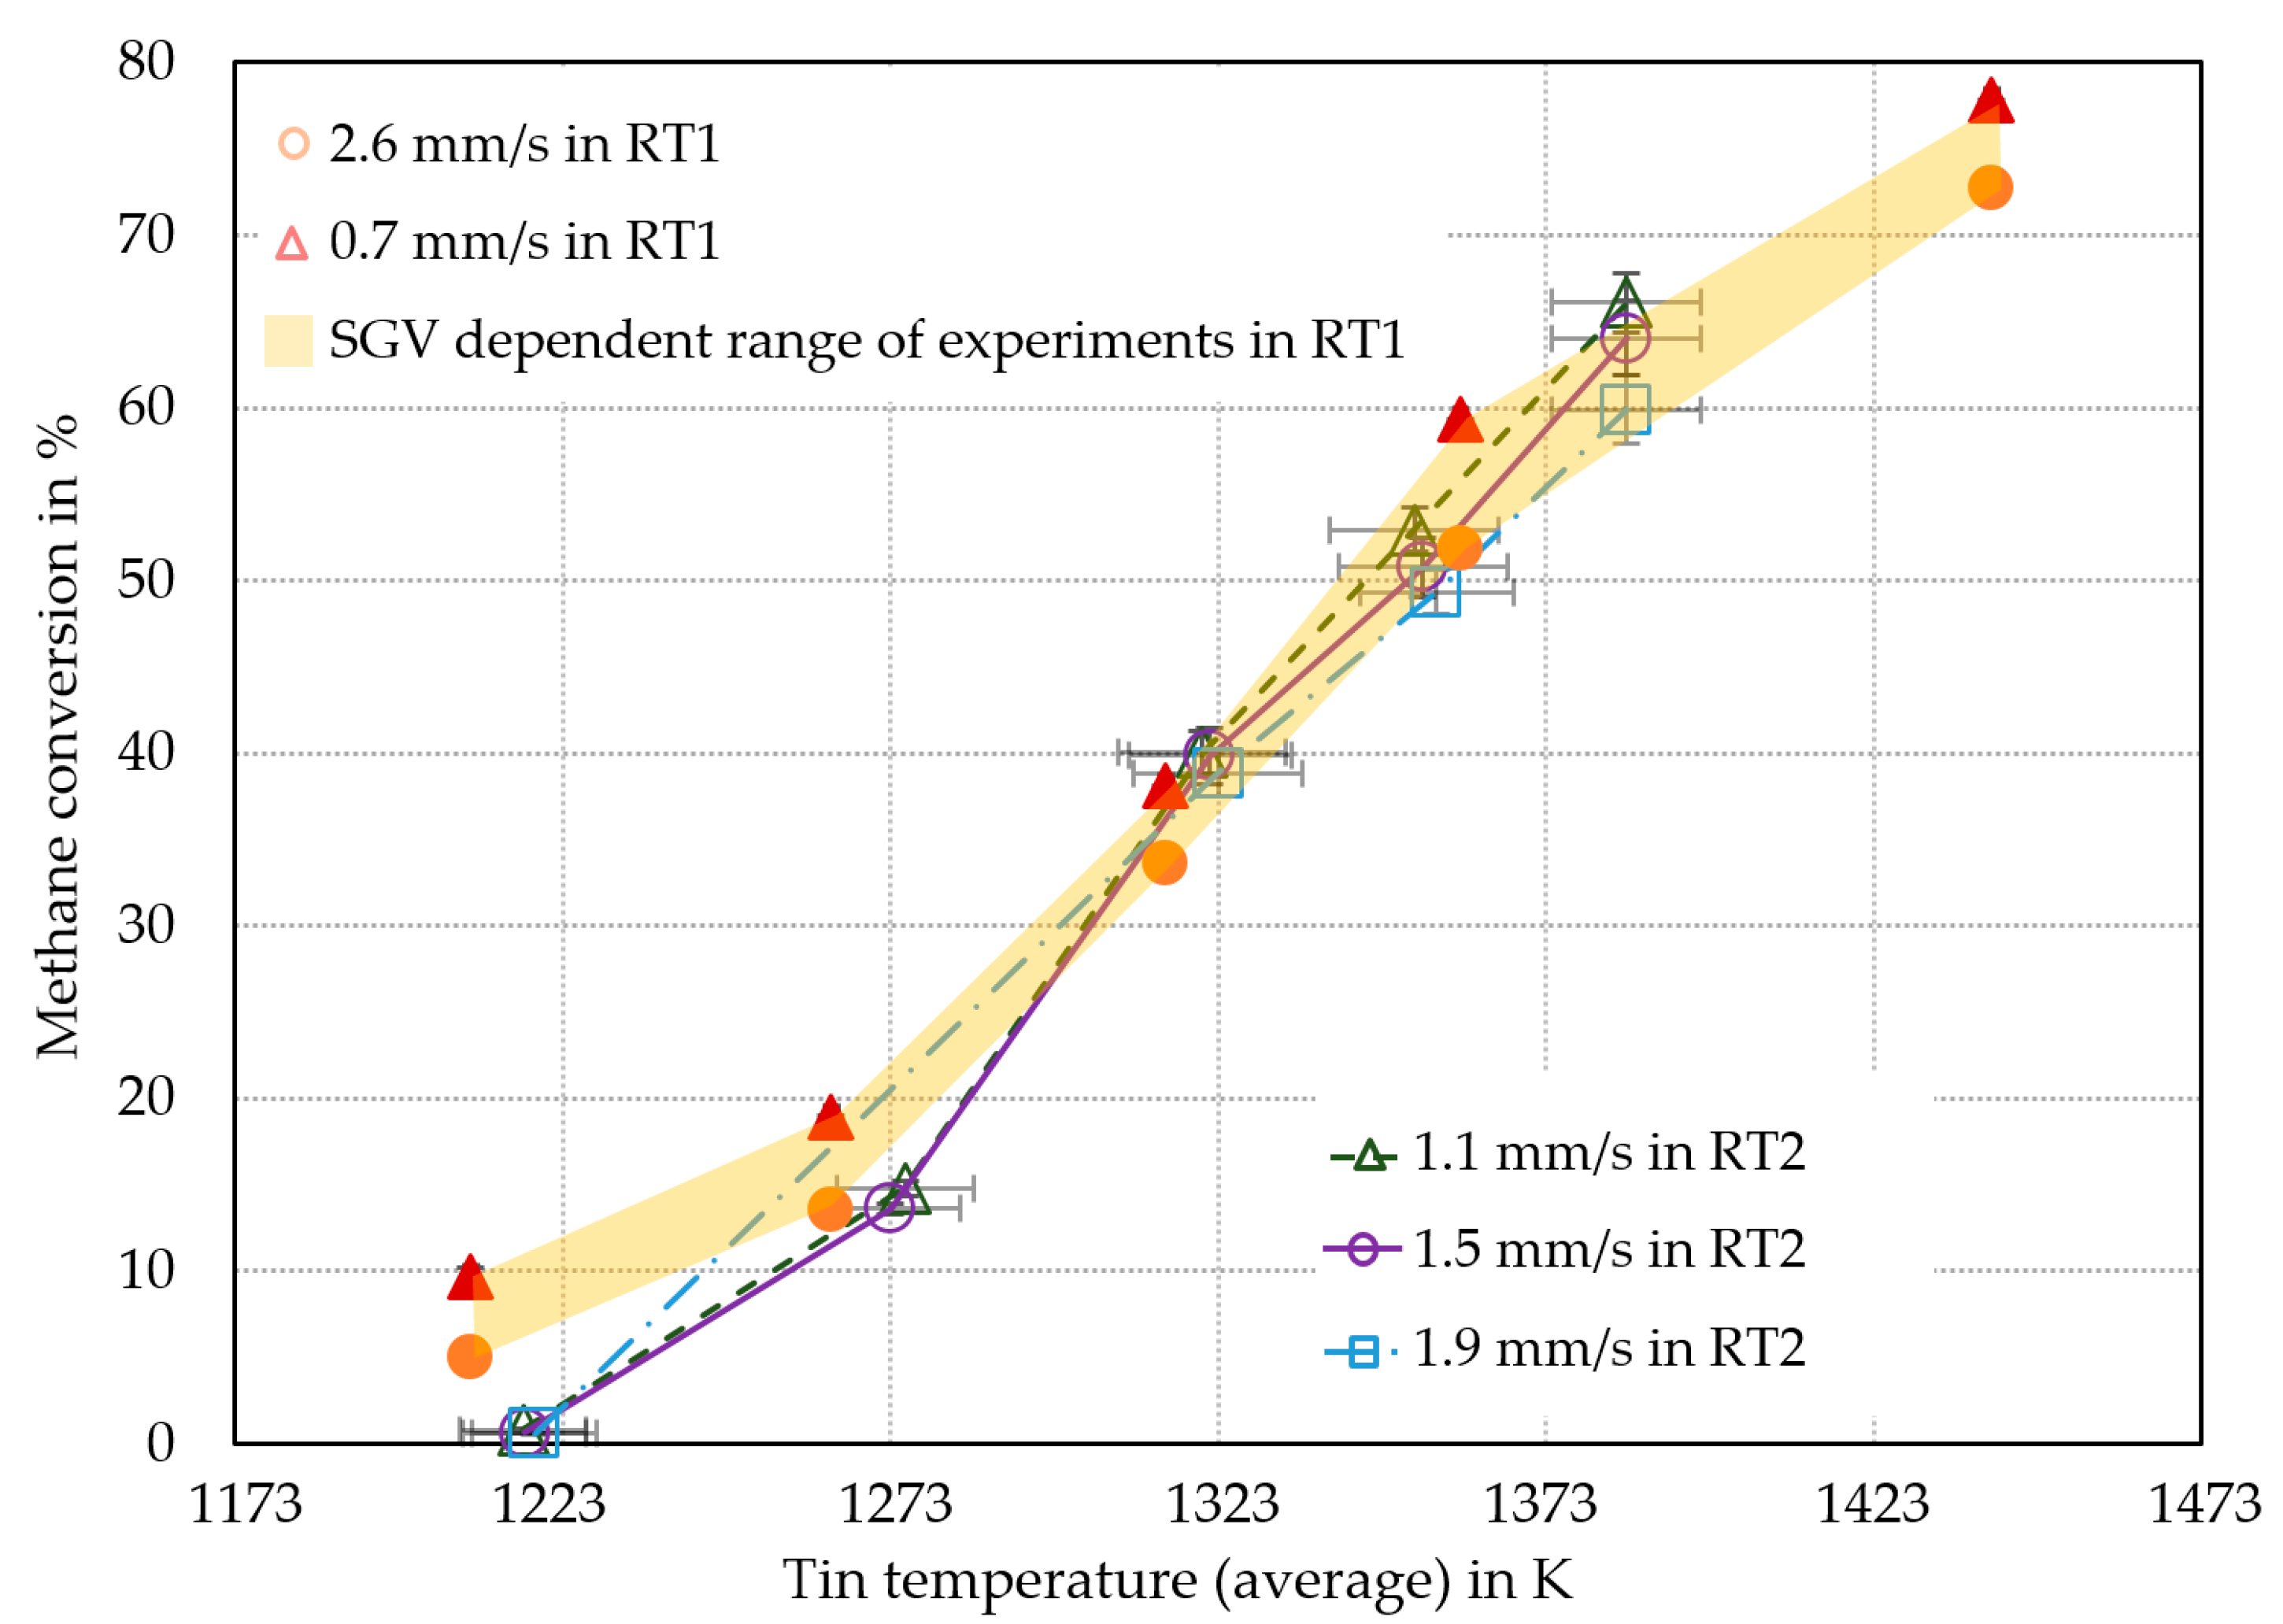
2.6. Conducted Experiments

An overview of the reactor designs with the executed experiments is given in Table 4.

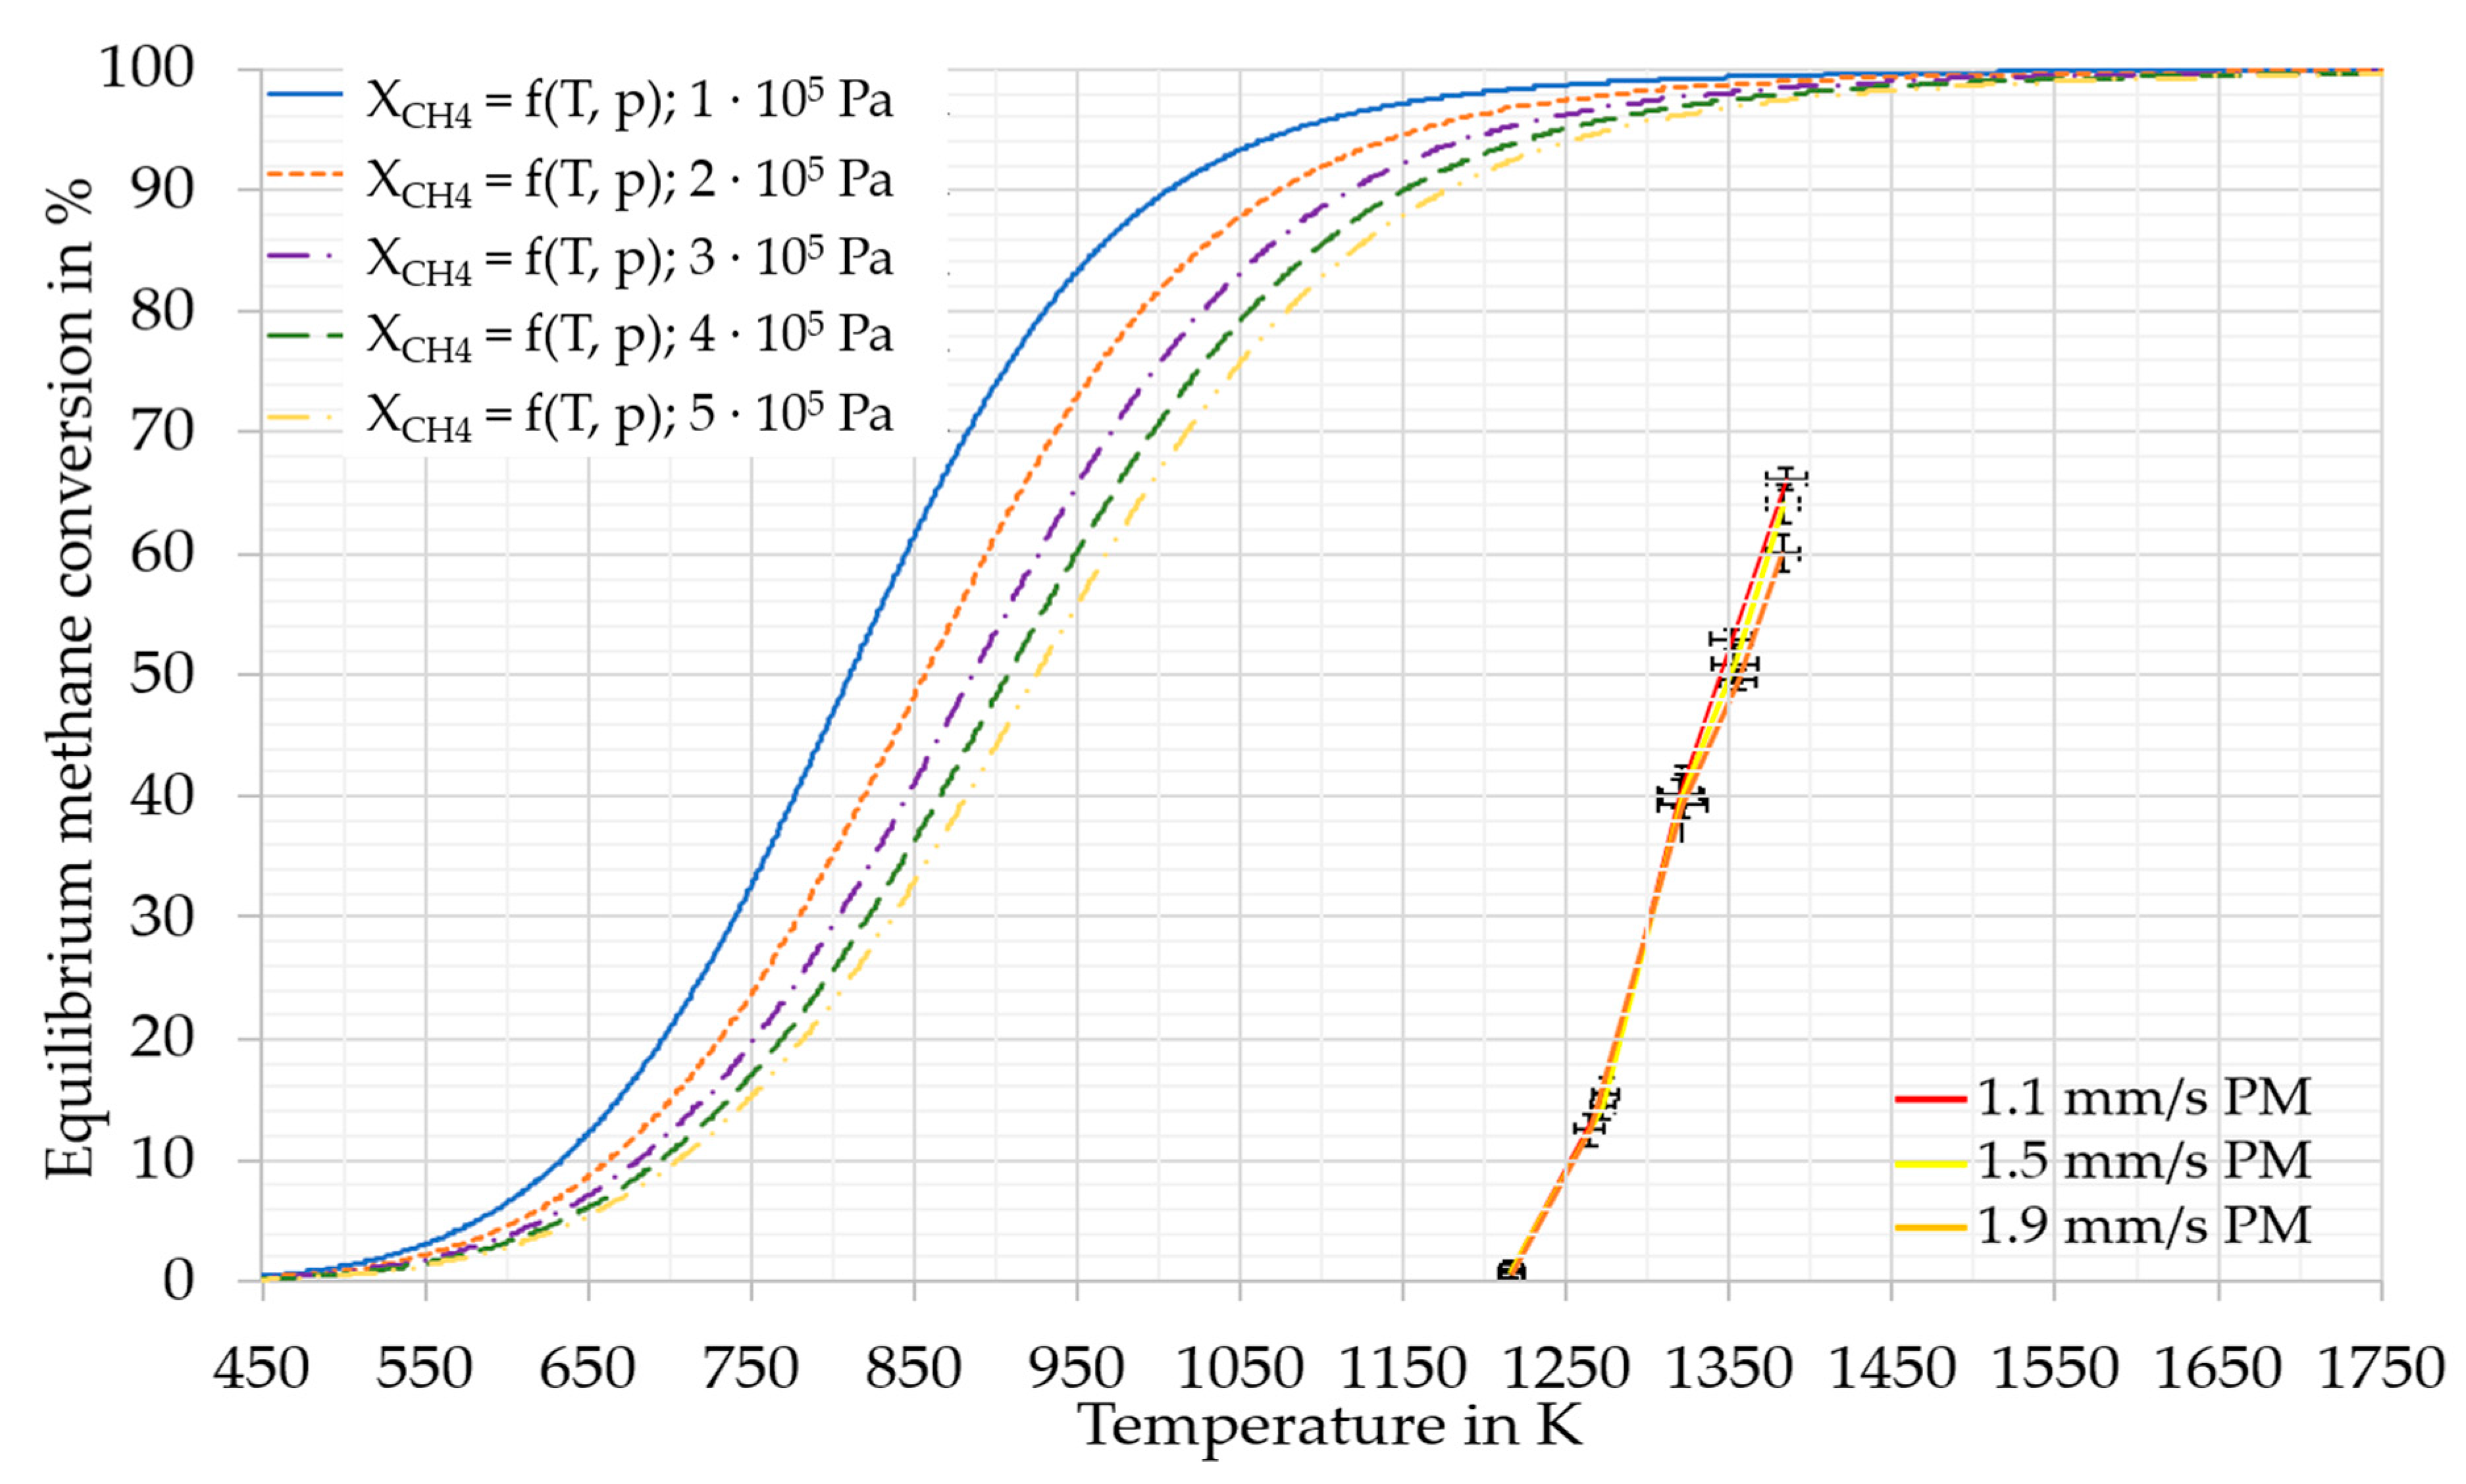
3. Experimental Results and Discussion

To evaluate of the performance of RT2 after the scale-up, the overall methane conversion X CH 4 was compared to the methane conversion of Geißler et al. [7], obtained using RT1 (Figure 3).
As shown in Figure 3, the methane conversion of RT2 was in good agreement with the conversions from RT1 [7], above an average tin temperature of 1273 K, although the throughput was higher in RT2. Within this temperature range, it was assumed that differences between the two reactor types RT1 and RT2 (including the differed SGVs) in bubble dynamics such as bubble-wall-effect, as well as bubble formation and rise regimes, only have a negligible effect on pyrolysis. At temperatures of 1273 K and below, the experiments in RT2 yielded a significantly lower methane conversion. As the experimental campaigns using RT2 were conducted in the order of rising temperatures, the decreased methane conversion at lower temperatures compared to RT1 could be a result of the unused reactor (e.g., tin weeping occurred, no carbon deposits in the reactor inlet and head). Geißler [16] has shown that the methane conversion was increasing by prolonged operating time of RT1. In difference to RT1, the RT2 showed negligible effects on the methane conversion due to the SGV changes. The largest difference in methane conversion caused by changing in the SGV from 1.1 mm/s to 1.5 mm/s at a temperature of 1273 K amounted to only 5% (absolute). This seems to be negligible in comparison to the effect that a change in temperature causes. Therefore, the uncertainty of the MFCs was also negligible. The accuracy of the MFCs was given by the manufacturer, with a maximum resulting variation of the SGV of ±0.04 mm/s. Thus, the maximum variation of SGV should lead to conversion rate uncertainties of ±0.5% at most, based on the observation of conversion variance due to the executed SGVs at 1273 K. Since this is a highly conservative worst-case consideration, the real uncertainties were expected to be significantly lower. As shown in Figure 3, the difference in methane conversion due to different SGVs was only significant at 1353 K and 1383 K. An approach to account for the volumetric flow dependence only at higher temperatures is given by the fluid mechanics: According to Equation (1), the molar amount of gas phase species is increasing due to the pyrolysis reaction. Assuming the ideal gas law, the increasing methane conversion leads to higher bubble diameters and thus bubble volumes. This results in higher rising velocities and, thus, lower residence times of the gas bubbles in the tin [19,20,26,27].
Additionally, higher SGVs lead to higher pressure in the reactor. Fau et al. [28] found in their literature survey, the pressure to affect the equilibrium conversion of methane pyrolysis. The outcome of the second Ulrich approximation [29] about the pressure effects on equilibrium methane conversion can be seen in Figure 4.
The principle of Le Chatelier [32] suggests that for the overall reaction of methane pyrolysis (1), an increase in pressure leads to a shift of the equilibrium towards reactants. As the conversions achieved in this study are distant from the equilibrium conversion (Figure 4), this effect was assumed to be very low [33,34]. The distance from equilibrium is probably a result of the limited residence time of the methane in the reaction zone. Steward et al. [35] concluded from their calculations of the initial reaction of methane pyrolysis that the effect of pressure is small. Furthermore, the used pressure-dependent equilibrium model of this study (Figure 4) predicted a difference in methane conversion using pressure and temperature values from Table 2, only up to 3 % in total. Therefore, the pressure differences (inlet pressures between 1.63 × 10⁵ Pa (a) and 2.95 × 10⁵ Pa (a) and head pressures between 0.95 × 10⁵ Pa (a) and 1.54 × 10⁵ Pa (a)) in this study were assumed to be negligible, even at the equilibrium conversion, and the pressure was, thus, not considered in this study.

4. Conclusions

Methane pyrolysis experiments were carried out using the up-scaled liquid metal bubble column reactor, developed and described in earlier work at the KIT [7]. It could be proven that neither the up-scaling factor of 3.75 (referred to as the reactor volume), nor the increased throughput (by a factor of 2.5) resulted in a decrease in methane conversion at temperatures above 1373 K. In both reactor designs RT1 and RT2, methane conversions of up to 66% between 1350 K and 1390 K could be reached. Due to the significant distance of the methane conversion achieved in this study from equilibrium conditions, the pressure effects on the achieved methane conversions were considered to be negligible. Within the SGV range of RT2, investigated in this study, none (up to 1323 K) or negligible (above 1323 K) effects on the methane conversion could be found. In comparison between the different reactor types RT1 and RT2 at 1323 K and above, no effects of the SGV on methane conversion could be determined as well. A python-based evaluation methodology is being presented, which will be used for part II of the publication. This methodology is able to compare the pyrolysis results of gas mixtures (methane ethane mixtures, MEM and high calorific natural gas, nGH) to each other. The effects of MEM and nGH gases on pyrolysis yields, conversions rates and product gas compositions are discussed in detail in part II of this publication.

Author Contributions

Conceptualization, C.M.H., L.S. and T.W.; methodology, C.M.H.; Investigation, C.M.H.; Resources, R.K.; Data curation, C.M.H.; Writing—original draft preparation, C.M.H.; Writing—review and editing, B.D., I.D.V., L.S., N.U. and T.W.; Supervision, L.S. and T.W.; Project administration, L.S., T.W.; Funding acquisition, T.W. All authors have read and agreed to the published version of the manuscript.

Funding

This research was funded by Wintershall DEA. The APC was funded by KIT-Publication Fund of the Karlsruhe Institute of Technology.

Data Availability Statement

Not applicable.

Acknowledgments

The authors sincerely thank Wintershall Dea for the cooperation, exchange of ideas and the financial support.

Conflicts of Interest

The authors declare no conflict of interest.

Abbreviations

RT1/2/3Reactor type 1/2/3
PMPure methane
MEMMethane-ethane mixture
nGHHigh calorific natural gas
SGVSuperficial gas velocity
GCGas chromatograph
MFCMass flow controller
TCDThermal conductivity detector
hthermoHeight of thermocouple
hrhReactor height
hSnTin filling height
hpchPrechamber height

References

  1. Lambert, M. EU Hydrogen Strategy: A Case for Urgent Action towards Implementation; Oxford Institute for Energy Studies: Oxford, UK, 2020. [Google Scholar]
  2. Da Silva Veras, T.; Mozer, T.S.; Da Silva César, A. Hydrogen: Trends, production and characterization of the main process worldwide. Int. J. Hydrog. Energy 2017, 42, 2018–2033. [Google Scholar] [CrossRef]
  3. Ramachandran, R.; Menon, R.K. An overview of industrial uses of hydrogen. Int. J. Hydrog. Energy 1998, 23, 593–598. [Google Scholar] [CrossRef]
  4. De Mattos, M.; Souza, V.M. Processos Inorgânicos; SYNERGIA: Roßdorf, Germany, 2012; ISBN 10: 856132581X. [Google Scholar]
  5. Wasserstoff-Farbenlehre. 2020. Available online: https://usercontent.one/wp/www.ikem.de/wp-content/uploads/2021/03/IKEM_Kurzstudie_Wasserstoff_Farbenlehre.pdf?media=1667839188 (accessed on 19 December 2022).
  6. Muradov, N. Hydrogen via methane decomposition: An application for decarbonization of fossil fuels. Int. J. Hydrog. Energy 2001, 26, 1165–1175. [Google Scholar] [CrossRef]
  7. Lemus, R.G.; Duart, J.M. Updated hydrogen production costs and parities for conventional and renewable technologies. Int. J. Hydrog. Energy 2010, 35, 3929–3936. [Google Scholar] [CrossRef]
  8. Geißler, T.; Abánades, A.; Heinzel, A.; Mehravaran, K.; Müller, G.; Rathnam, R.; Rubbia, C.; Salmieri, D.; Stoppel, L.; Stückrad, S.; et al. Hydrogen production via methane pyrolysis in a liquid metal bubble column reactor with a packed bed. Chem. Eng. J. 2016, 299, 192–200. [Google Scholar] [CrossRef]
  9. Muradov, N.; Smith, F.; Huang, C.; Ali, T. Autothermal catalytic pyrolysis of methane as a new route to hydrogen production with reduced CO2 emissions. Catal. Today 2006, 116, 281–288. [Google Scholar] [CrossRef]
  10. Guéret, C.; Daroux, M.; Billaud, F. Methane pyrolysis: Thermodynamics. Chem. Eng. Sci. 1997, 52, 815–827. [Google Scholar] [CrossRef]
  11. Geißler, T.; Plevan, M.; Abánades, A.; Heinzel, A.; Mehravaran, K.; Rathnam, R.; Rubbia, C.; Salmieri, D.; Stoppel, L.; Stückrad, S.; et al. Experimental investigation and thermo-chemical modeling of methane pyrolysis in a liquid metal bubble column reactor with a packed bed. Int. J. Hydrogen Energy 2015, 40, 14134–14146. [Google Scholar] [CrossRef]
  12. Abánades, A.; Rathnam, R.K.; Geißler, T.; Heinzel, A.; Mehravaran, K.; Müller, G.; Plevan, M.; Rubbia, C.; Salmieri, D.; Stoppel, L.; et al. Development of methane decarbonisation based on liquid metal technology for CO2-free production of hydrogen. Int. J. Hydrog. Energy 2016, 41, 8159–8167. [Google Scholar] [CrossRef]
  13. Abánades, A.; Ruiz, E.; Ferruelo, E.M.; Hernández, F.; Cabanillas, A.; Martínez-Val, J.M.; Rubio, J.A.; López, C.; Gavela, R.; Barrera, G.; et al. Experimental analysis of direct thermal methane cracking. Int. J. Hydrog. Energy 2011, 36, 12877–12886. [Google Scholar] [CrossRef]
  14. Steinberg, M. Fossil fuel decarbonization technology for mitigating global warming. Int. J. Hydrog. Energy 1999, 24, 771–777. [Google Scholar] [CrossRef]
  15. Serban, M.; Lewis, M.A.; Marshall, C.L.; Doctor, R.D. Hydrogen Production by Direct Contact Pyrolysis of Natural Gas. Energy Fuels 2003, 17, 705–713. [Google Scholar] [CrossRef]
  16. Geißler, T.G. Methanpyrolyse in einem Flüssigmetall-Blasensäulenreaktor; Verlag Dr. Hut: Karlsruhe, Germany, 2017. [Google Scholar]
  17. Plevan, M. Entwicklung eines Verfahrens zur Thermischen Zerlegung von Methan zu Wasserstoff und Kohlenstoff unter Nutzung Flüssiger Metalle als Wärmeübertragungsmedium. Ph.D. Dissertation, Karlsruher Institut für Technologie (KIT), Karlsruhe, Germany, 2017. [Google Scholar]
  18. Von Wald, G.A.; Masnadi, M.S.; Upham, D.C.; Brandt, A.R. Optimization-based technoeconomic analysis of molten-media methane pyrolysis for reducing industrial sector CO2 emissions. Sustain. Energy Fuels 2020, 4, 4598–4613. [Google Scholar] [CrossRef]
  19. Thomas, L.; Gunther, M.; Uwe, S. Inviscid bubble formation on porous plates and sieve plates. Chem. Eng. Sci. 2004, 59, 809–818. [Google Scholar]
  20. Kulkarni, A.A.; Joshi, J.B. Bubble formation and bubble rise velocity in gas− liquid systems: A review. Ind. Eng. Chem. Res. 2005, 44, 5873–5931. [Google Scholar] [CrossRef]
  21. Giordanengo, B.; Benazzi, N.; Vinckel, J.; Gasser, J.G.; Roubi, L. Thermal conductivity of liquid metals and metallic alloys. J. Non-Cryst. Solids 1999, 250–252, 377–383. [Google Scholar] [CrossRef]
  22. Assael, M.J.; Kalyva, A.E.; Antoniadis, K.D.; Michael Banish, R.; Egry, I.; Wu, J.; Kaschnitz, E.; Wakeham, W.A. Reference data for the density and viscosity of liquid copper and liquid tin. J. Phys. Chem. Ref. Data 2010, 39, 33105. [Google Scholar] [CrossRef]
  23. Nauman, E.B. Residence Time Theory. Ind. Eng. Chem. Res. 2008, 47, 3752–3766. [Google Scholar] [CrossRef]
  24. Virtanen, P.; Gommers, R.; Oliphant, T.E.; Haberland, M.; Reddy, T.; Cournapeau, D.; Burovski, E.; Peterson, P.; Weckesser, W.; Bright, J.; et al. SciPy 1.0: Fundamental algorithms for scientific computing in Python. Nat. Methods 2020, 17, 261–272. [Google Scholar] [CrossRef]
  25. SciPy: Open Source Scientific Tools for Python. 2001. Available online: https://scipy.org/ (accessed on 22 December 2022).
  26. Clift, R.; Grace, J.R.; Weber, M.E. Bubbles, Drops, and Particles. Dover Publications: Mineola, NY, USA, 2005. [Google Scholar]
  27. Sano, M.; Mori, K. Bubble formation from single nozzles in liquid metals. Trans. Jpn. Inst. Met. 1976, 17, 344–352. [Google Scholar] [CrossRef]
  28. Fau, G.; Gascoin, N.; Gillard, P.; Steelant, J. Methane pyrolysis: Literature survey and comparisons of available data for use in numerical simulations. J. Anal. Appl. Pyrolysis 2013, 104, 1–9. [Google Scholar] [CrossRef]
  29. Atkins, P.W.; De Paula, J. Physikalische Chemie; John Wiley & Sons: Hoboken, NJ, USA, 2013. [Google Scholar]
  30. Schaber, K.; Stephan, K.; Mayinger, F. Thermodynamik. Grundlagen und Technische Anwendungen: Band 1: Einstoffsysteme; Springer: Berlin/Heidelberg, Germany, 2013. [Google Scholar]
  31. Moldoveanu, S.C. Pyrolysis of Hydrocarbons. Pyrolysis Org. Mol. Appl. Health Environ. 2019, 2, 35–161. [Google Scholar]
  32. Grigull, U. Das Prinzip von Le Chatelier und Braun. Int. J. Heat Mass Transf. 1964, 7, 23–31. [Google Scholar] [CrossRef]
  33. Levenspiel, O. Chemical Reaction Engineering; John Wiley & Sons: Hoboken, NJ, USA, 1998. [Google Scholar]
  34. Arutyunov, V.S.; I Vedeneev, V. Pyrolysis of methane in the temperature range 1000–1700 K. Russ. Chem. Rev. 1991, 60, 1384–1397. [Google Scholar] [CrossRef]
  35. Stewart, P.H.; Smith, G.P.; Golden, D.M. The pressure and temperature dependence of methane decomposition. Int. J. Chem. Kinet. 1989, 21, 923–945. [Google Scholar] [CrossRef]
Figure 1. Overview of the experimental pyrolysis system used in this study, which comprises a gas-dosing unit with several mass flow controllers (MFCs) and a static mixer, the bubble column reactor R1, temperature and pressure transmitters, as well as a gas chromatograph (GC) for the analysis of the product gas mixture.
Hydrogen 04 00021 g001
Figure 2. Scheme of the quartz glass reactor type 2 (RT2) with positions of the thermocouples and the measured reactor temperatures for experiments with target temperatures of 1223 K and 1273 K. The thermocouples T1 to T11 were positioned inside a ceramic lance into the reactor. Thermocouple T0 was placed in the reactor prechamber and T12 on the head flange. The accuracy of the relative height of the thermocouple positions was ±0.008 (hthermo/hrh).
Hydrogen 04 00021 g002
Figure 3. Comparison of methane conversion in liquid metal bubble column reactors between RT1 [7] and RT2 reactors. All methane conversions were calculated using Equation (9).
Hydrogen 04 00021 g003
Figure 4. Pressure and temperature dependent equilibrium conversion of methane. For the calculation the second Ulrich approximation [29] was used. Used entropies for methane: 186.2 J/mol, for hydrogen: 130.6 J/mol and for C (as Graphite): 5.7 J/mol [30]. For the standard formation enthalpy of methane −74.8 kJ/mol was used [29,31]. Additionally, the obtained methane conversions including uncertainties in the experimental series of PM in RT2.
Hydrogen 04 00021 g004
Table 1. Reactor types (RT) with their prechamber and orifice geometrics for both parts of this publication.
Reactor Type (RT)Reactor to Prechamber Ratio hrh/hpchSingle Orifice Diameter in mmReactor Volume in LPublication Part
1-0.5 ± 0.1 mm1.6-
2390.6 ± 0.1 mm6I and II
3-0.6 ± 0.1 mm6II
Table 2. Reactor types (RT) with their achieved pressure conditions during the pyrolysis experiments.
Reactor
Type (RT)
Pyrolyzed GasesSGVs
in mm/s
Overall Inlet Pressure Range
in 105 Pa (a)
Overall Outlet Pressure Range in 105 Pa (a)
1PM0.6
1.3
1.9
2.6
1.68–2.461.01–1.34
2PM
MEM
1.1
1.5
1.9
1.63–2.950.95–1.37
3nGH1.1
1.5
1.9
1.73–2.740.97–1.54
Table 3. Determinable and calibrated compounds for this study by the used GC, with their calibration ranges and correlation coefficients.
ComponentCalibration Range
in mol%
Correlation
Coefficient
Methane (CH4)0.1–99.995>0.9999
Ethane (C2H6)0.1–10>0.9996
Ethene (C2H4)0.1–10>0.9996
Ethyne (C2H2)0.1–10>0.9998
Nitrogen (N2)20–99.9999>0.9999
Hydrogen (H2)0.1–99.9995>0.9995
Table 4. Reactor types with average tin temperatures for each SGV and maximum uncertainty.
Reactor Type (RT)SGVs in mm/sTemperatures in KFeed
10.6 & 1.3 & 1.9 & 2.6
for all temperatures
1209 ± 16
1264 ± 15
1315 ± 16
1360 ± 15
1441 ± 4
PM
PM
PM
PM
PM
21.1 & 1.5 & 1.9
for all temperatures
1210 to 1220 ± 6
1264 to 1276 ± 13
1316 to 1325 ± 14
1347 to 1356 ± 11
1383 to 1388 ± 10
PM
PM
PM
PM
PM
1.1 & 1.5 & 1.9
1.1 & 1.5 & 1.9
1.5 & 1.9
1217 to 1220 ± 8
1264 to 1275 ± 9
1314 to 1328 ± 9
MEM
MEM
MEM
31.1 & 1.5 & 1.9
for all temperatures
1222 to 1226 ± 5
1326 to 1332 ± 7
1423 to 1430 ± 8
nGH
nGH
nGH
Disclaimer/Publisher’s Note: The statements, opinions and data contained in all publications are solely those of the individual author(s) and contributor(s) and not of MDPI and/or the editor(s). MDPI and/or the editor(s) disclaim responsibility for any injury to people or property resulting from any ideas, methods, instructions or products referred to in the content.

